laguna figures and tables 13jan04 - world lakes
TRANSCRIPT

DRAFT: Not for Citation or Distribution Laguna de Bay
1
Experience and Lessons Learned Brief for 1 Laguna de Bay 2
3 Adelina Santos-Borja, Chief, Research and Development Division 4
Dolora N. Nepomuceno, Assistant General Manager 5 Laguna Lake Development Authority 6
Figures 7
8
9
10
11
12
13
14
15
Figure 1. Map of Laguna de Bay 16
17
18
19

DRAFT: Not for Citation or Distribution Laguna de Bay
2
Figure 1. Watershed Land Use
5229%
Forested Areas 19,100 has
Open Areas 59, 480 has.
Built - up/Industrial Areas 110,780 has. Agricultural Areas 198, 640 has .
Figure 2 W t h d L d U
����������������������������������������������������������������
���������������������������������������������������
�������������������������������������������������������������������������������������������������������������
������������������������������������������������������������������
���������������������������������������������������������������������������������������������������������������
��������������������������������������������������������������������������������������������������������������������������������������������������������������������������������������������������������������������
�������������������������������������������������������������������������������������������������������������������������������������������������������������������������������������������������������������������������������������������������������������������������
5%
52%%
14%%
��������������������������������������������������������
Forested Areas 19,100 has
Open Areas 59, 480 has.
Built - up/Industrial Areas 110,780 has. Agricultural Areas 198, 640 has .
1
2
3
4
5
6
7
8 Figure 3. The Laguna de Bay Region

DRAFT: Not for Citation or Distribution Laguna de Bay
3
1 2
0.00
1.00
2.00
3.00
4.00
5.00
6.00
7.00
8.00
1990 1991 1992 1993 1994 1995 1996 1997 1998 1999 2000
Figure 3A : B iochem ical oxygen dem and
in Laguna de B ay.
BOD (mg/L)
W e st B a y
C e ntra l B a y
E a st B a y
m a x lim it
0
200
400
600
800
1000
1200
1400
1990 1991 1992 1993 1994 1995 1996 1997 1998 1999 2000
Figure 3B : C hloride concentration in
Laguna de B ay.
Cl- (m
g/L)
W e st B ay
C entral B ay
E ast B ay
m ax lim it
3 4 5
0.000
0.010
0.020
0.030
0.040
0.050
0.060
0.070
0.080
1990 1991 1992 1993 1994 1995 1996 1997 1998 1999 2000
Figure 3C : P hosphate concentration in
Laguna de B ay.
PO
43- (mg/L)
W e st B ay
C entral B ay
E ast B ay
m ax lim it
0.0 00
0.0 10
0.0 20
0.0 30
0.0 40
0.0 50
0.0 60
19 90 19 91 19 92 19 93 19 94 19 95 19 96 19 97 19 98 19 99 20 00
Figure 3D : N itrate concentration in Laguna
de B ay.
NO
3- (m
g/L)
W e st B a y
C e ntra l B a y
E a st B a y
m ax lim it = 10 m g/L
6 7 8
0.0
1.0
2.0
3.0
4.0
5.0
6.0
7.0
8.0
1990 1991 1992 1993 1994 1995 1996 1997 1998 1999 2000
Figure 3E: Dissolved oxygen concentration in Laguna de Bay.
DO
(mg/
L)
West Bay
Central Bay
East Bay
min limit
0
10
20
30
40
50
60
70
80
90
100
1996 1997 1998 1999 2000
Figure 3F: Transparency of water in Laguna de Bay.
Tran
spar
ency
(cm
)
West Bay
Central Bay
East Bay
9 10 11 12 13 14 15 16 17 18
Figures 4A, B,C,D,E,F
DRAFT: Not for Citation or Distribution Laguna de Bay
4
1 2
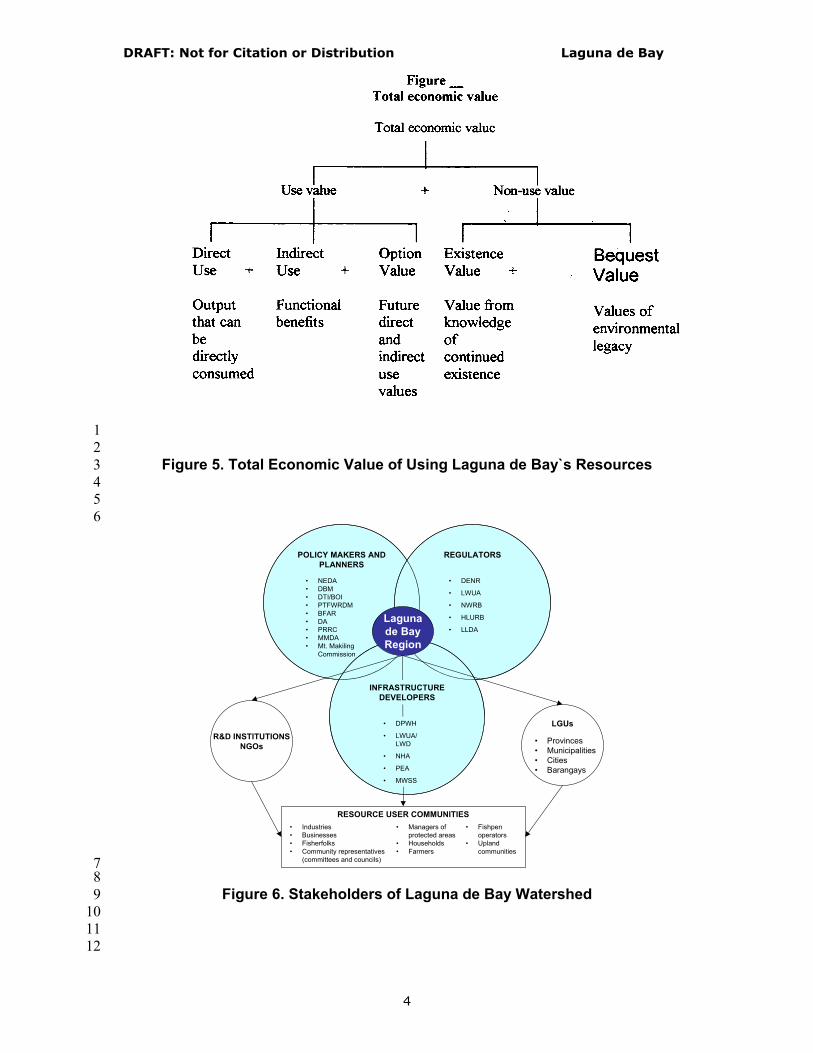
Figure 5. Total Economic Value of Using Laguna de Bay`s Resources 3 4
5 6
POLICY MAKERS ANDPLANNERS
R&D INSTITUTIONSNGOs
LGUs
REGULATORS
• DENR
• LWUA
• NWRB
• HLURB
• LLDALagunade BayRegion
RESOURCE USER COMMUNITIES• Industries• Businesses• Fisherfolks• Community representatives
(committees and councils)
• Managers ofprotected areas
• Households• Farmers
• Fishpenoperators
• Uplandcommunities
• DPWH
• LWUA/LWD
• NHA
• PEA
• MWSS
INFRASTRUCTUREDEVELOPERS
• Provinces• Municipalities• Cities• Barangays
• NEDA• DBM• DTI/BOI• PTFWRDM• BFAR• DA• PRRC• MMDA• Mt. Makiling
Commission
7 8
Figure 6. Stakeholders of Laguna de Bay Watershed 9 10
11 12

DRAFT: Not for Citation or Distribution Laguna de Bay
5
1 2
POSITION
ON
THE
PROJECT
Figure 7. Force Field Map 3 4 5 6 7 8 9 10 11 12 13 14 15
Figure 8. Zoning and Management Plan of Laguna de Bay 16
UPA COM TLLD PLLD
MAPAGPALA
INFORMAL SETTLERS
LGU's
Taytay
Fishpen/Cage Operators
NAPC
- DENR/EMB - UP-NHRC
NGA's
NGA's
- NHA - ODAA - MMDA - DPWH - HUDCC
LGU's
- Taguig - Pasig
- Pateros
LLDA
Left of Center
Right of Center
(+) For
(-) Opposed
DRAFT: Not for Citation or Distribution Laguna de Bay
6
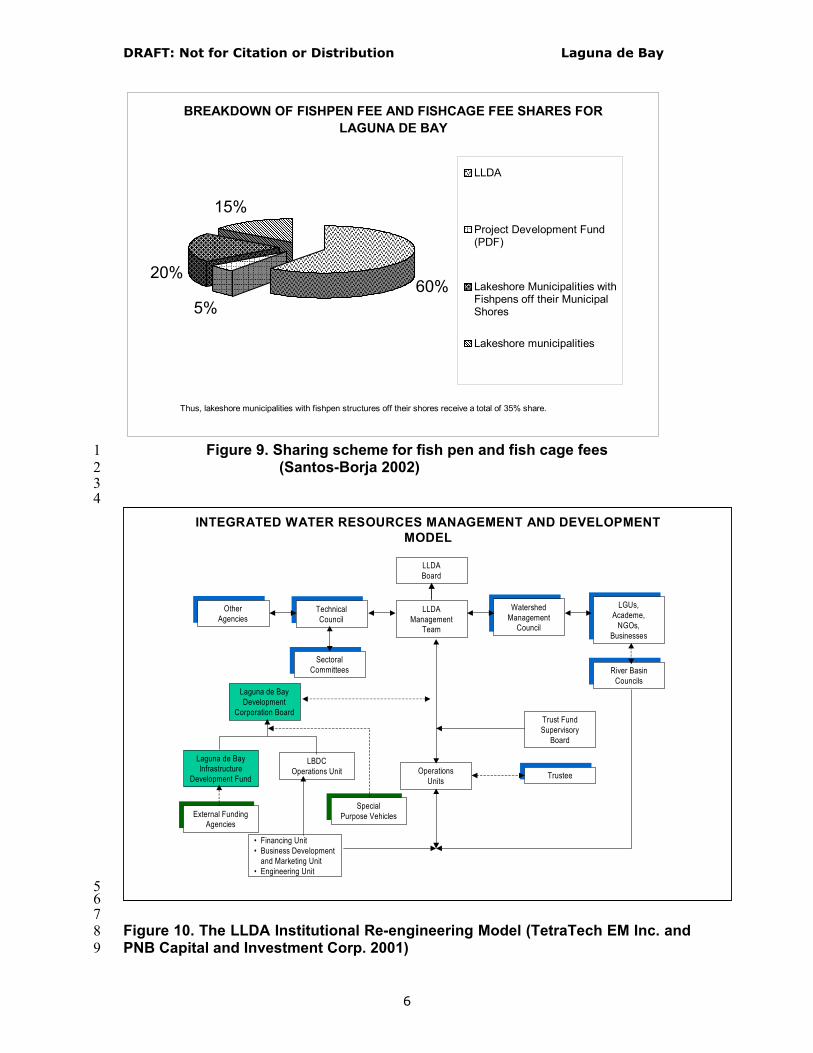
Figure 9. Sharing scheme for fish pen and fish cage fees 1 (Santos-Borja 2002) 2
3 4
INTEGRATED WATER RESOURCES MANAGEMENT AND DEVELOPMENT MODEL
LLDA Board
LLDA Management
Team
Technical CouncilTechnical Council
Other Agencies
Other Agencies
Watershed Management
Council
Watershed Management
Council
LGUs, Academe,
NGOs, Businesses
LGUs, Academe,
NGOs, Businesses
River Basin CouncilsRiver Basin
Councils
Sectoral Committees
Sectoral Committees
Laguna de Bay Development
Corporation BoardTrust Fund Supervisory
Board
TrusteeTrusteeOperations Units
Laguna de Bay Infrastructure
Development Fund
LBDC Operations Unit
External Funding AgenciesExternal Funding
Agencies
Special Purpose Vehicles
Special Purpose Vehicles
• Financing Unit• Business Development
and Marketing Unit• Engineering Unit
5 6 7 Figure 10. The LLDA Institutional Re-engineering Model (TetraTech EM Inc. and 8 PNB Capital and Investment Corp. 2001) 9
������������������������������������������������������������������������������������������
��������������������������������������������������������������������������������������������������
����������������
������������������������������������������������������������������������������������������
������������������������������������������������������������������������������������������������������������������������
������������������
����������������������������������������������������������������������������������������
������������������������������������������������������������
������������������������������������������������������������������������������������������������������������������������������������������������������������������������������������������������������������������������������������
������������������������������������������������������������������������������������������������������������������������������������������������������������������������������������������������������������������������������������
BREAKDOWN OF FISHPEN FEE AND FISHCAGE FEE SHARES FOR LAGUNA DE BAY
60%5%
20%
15%
���LLDA
���Project Development Fund(PDF)
������ Lakeshore Municipalities with
Fishpens off their MunicipalShores
���Lakeshore municipalities
Thus, lakeshore municipalities with fishpen structures off their shores receive a total of 35% share.

DRAFT: Not for Citation or Distribution Laguna de Bay
7
1 2 3 4
revenue
0
50
100
150
95 96 97 98 99 00 01 02year
reve
nue
(in m
illio
n)
5 6 Figure 11. Annual revenue collection 7 8 9
Delineation of LLDA’s Development Functions
2 0 0 1 2 0 0 2 to 2 0 0 4 A f te r 2 0 0 4
C u rr e n t S tr u c tu r e P r o to ty p e P h a s e F in a l P h a s e
L L D A a s : L L D A a s : L L D A a s :
P la n n e r , R e g u la to r ,a n d D e v e lo p e r
P la n n e r a n dR e g u la to r
P la n n e r a n dR e g u la to r
D e v e lo p e r L B D CL B D C
C o m p o s ite a n dF u n c t io n s
U n d if fe r e n t ia te d
F u n c t io n sD if f e r e n t ia te d C o r p o r a t iz e d
10 11
Figure 12. Evolution of the LLDA`s development functions 12
13
DRAFT: Not for Citation or Distribution Laguna de Bay
8
C lass A AC lass A /BC lass CC lass DW o rse than DN o D ata3
4
2
1
V III67
I
9II
1 0
1 3
8
V 1 2
IV5
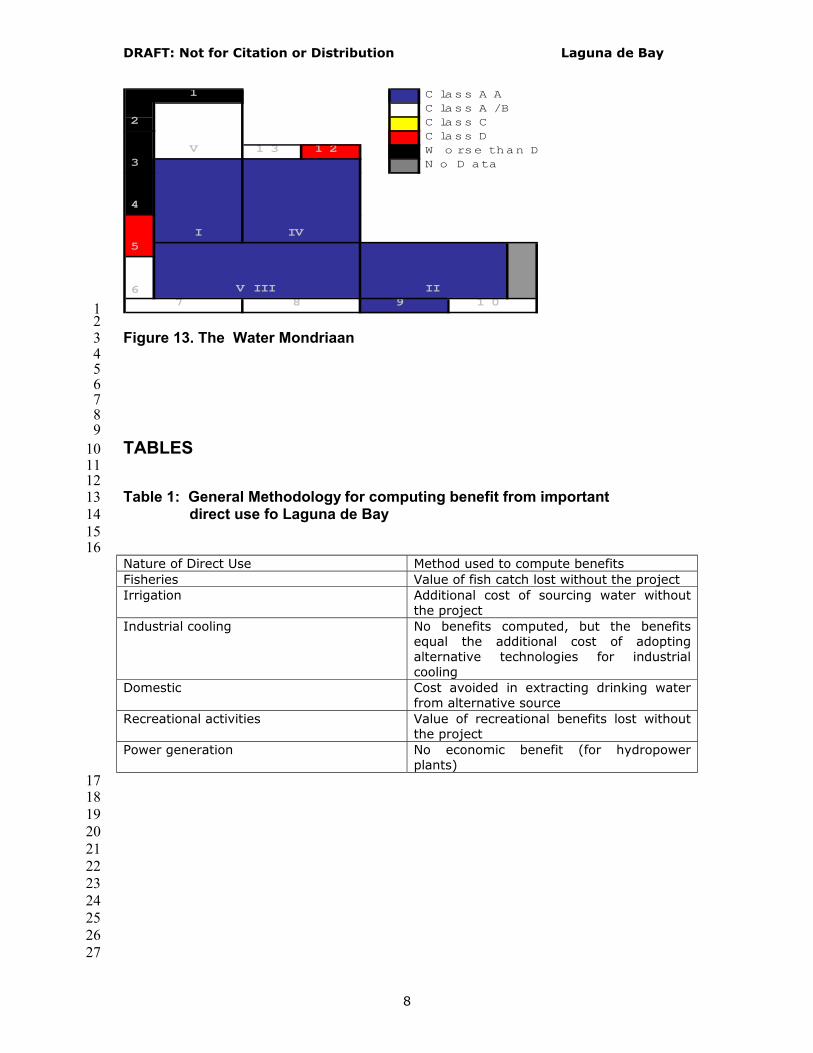
1 2 Figure 13. The Water Mondriaan 3 4 5 6 7 8 9 TABLES 10 11 12 Table 1: General Methodology for computing benefit from important 13 direct use fo Laguna de Bay 14 15 16 Nature of Direct Use Method used to compute benefits Fisheries Value of fish catch lost without the project Irrigation Additional cost of sourcing water without
the project Industrial cooling No benefits computed, but the benefits
equal the additional cost of adopting alternative technologies for industrial cooling
Domestic Cost avoided in extracting drinking water from alternative source
Recreational activities Value of recreational benefits lost without the project
Power generation No economic benefit (for hydropower plants)
17 18 19 20 21 22 23 24 25 26 27
DRAFT: Not for Citation or Distribution Laguna de Bay
9
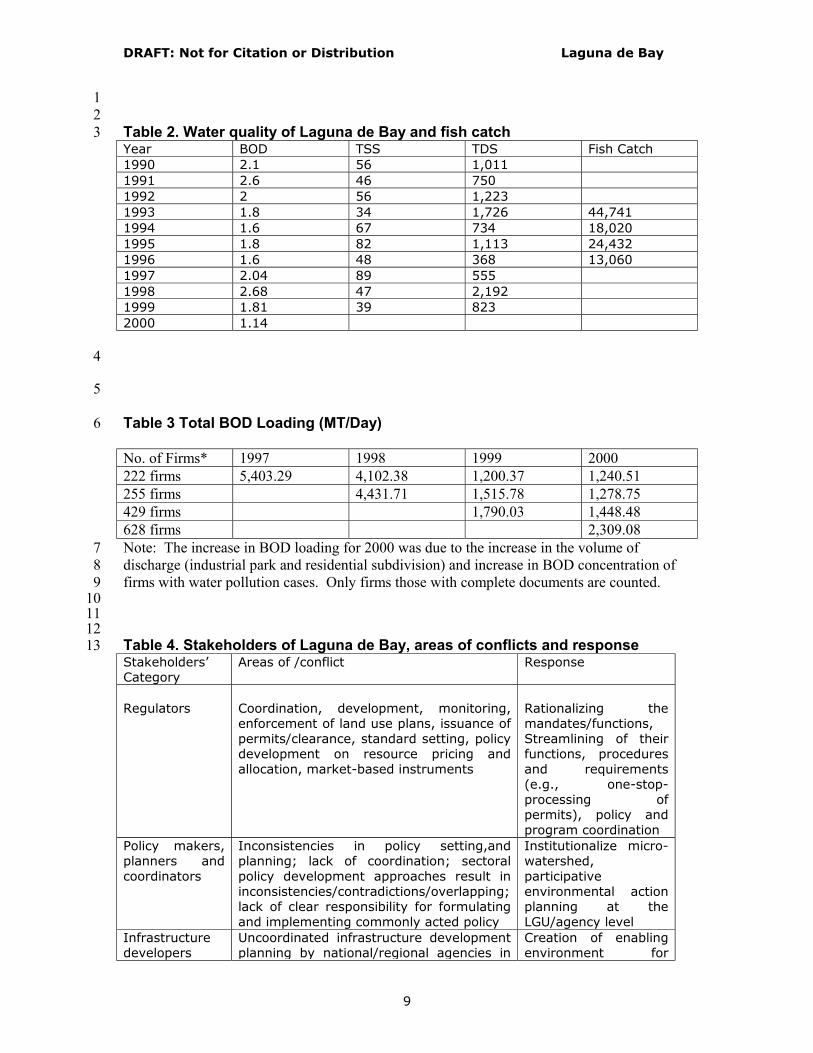
1 2 Table 2. Water quality of Laguna de Bay and fish catch 3 Year BOD TSS TDS Fish Catch 1990 2.1 56 1,011 1991 2.6 46 750 1992 2 56 1,223 1993 1.8 34 1,726 44,741 1994 1.6 67 734 18,020 1995 1.8 82 1,113 24,432 1996 1.6 48 368 13,060 1997 2.04 89 555 1998 2.68 47 2,192 1999 1.81 39 823 2000 1.14
4
5
Table 3 Total BOD Loading (MT/Day) 6
No. of Firms* 1997 1998 1999 2000 222 firms 5,403.29 4,102.38 1,200.37 1,240.51 255 firms 4,431.71 1,515.78 1,278.75 429 firms 1,790.03 1,448.48 628 firms 2,309.08 Note: The increase in BOD loading for 2000 was due to the increase in the volume of 7 discharge (industrial park and residential subdivision) and increase in BOD concentration of 8 firms with water pollution cases. Only firms those with complete documents are counted. 9 10 11 12 Table 4. Stakeholders of Laguna de Bay, areas of conflicts and response 13 Stakeholders’ Category
Areas of /conflict Response
Regulators
Coordination, development, monitoring, enforcement of land use plans, issuance of permits/clearance, standard setting, policy development on resource pricing and allocation, market-based instruments
Rationalizing the mandates/functions, Streamlining of their functions, procedures and requirements (e.g., one-stop-processing of permits), policy and program coordination
Policy makers, planners and coordinators
Inconsistencies in policy setting,and planning; lack of coordination; sectoral policy development approaches result in inconsistencies/contradictions/overlapping; lack of clear responsibility for formulating and implementing commonly acted policy
Institutionalize micro-watershed, participative environmental action planning at the LGU/agency level
Infrastructure developers
Uncoordinated infrastructure development planning by national/regional agencies in
Creation of enabling environment for

DRAFT: Not for Citation or Distribution Laguna de Bay
10
relation to LLDA; inconsistency of infrastructure projects with the strategic policy direction for the management of the lake as set out in the Master Plan; limited public investments in environmental infrastructures
private sector participation with government as facilitator and catalyst
Research and development institutions
Lack of proper coordination with LLDA; dissemination of research outputs is limited
LLDA as clearing house to coordinate & integrated R & D activities to (i) ensure focused research agenda centered around priority research areas, (ii) minimize duplications and maximize outputs; dissemination of outputs to the widest audience/users as possible
Resource Users/ communities
In addition to using the resources of the lake and the watershed for common good (fisheries, irrigation, drinking water, navigation, recreation, etc.), the lake has served as recipient of waste.
Strengthening regulation, monitoring and enforcement; expansion of MBIs, enhanced IEC activities; application of user fee to households;
Local Government Units (LGUs)
Sometimes conflict with LLDA responsibilities in the management and maintenance of ecological balance within their territorial jurisdiction
Co-management of the watershed with LGUs and communities of stakeholders
1 2 Table 5. Estimated BOD reduction in the lake due to EUFS implementation 3 4 Year Cumulative No. of
Firms BOD Loading (in MT/year)
BOD Loading Reduction (%)
1997
222
5,403
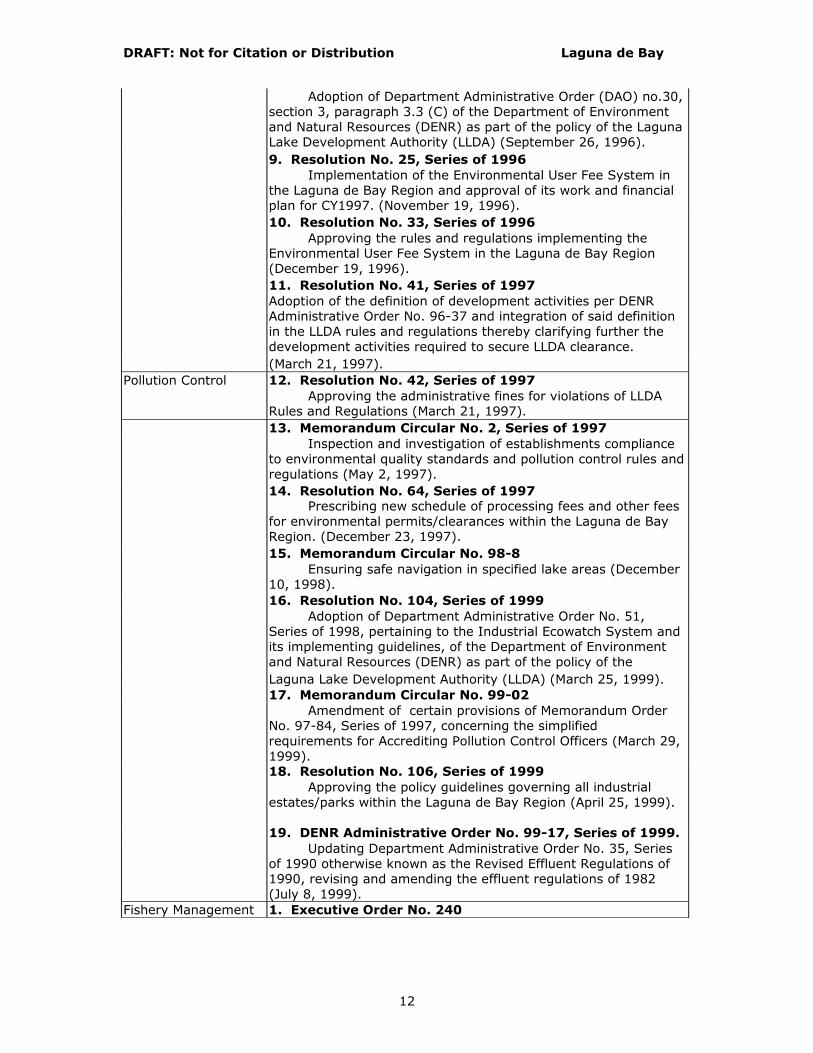
1998 255 4,432 24.08 1999 429 1,790 65.80 2000 628 2,309 19.08 2001 738 1,687 40.61 2002 914 791 61.30 5 6 7 Table 6 Laws, Rules and Regulations for Laguna de Bay Basin Management
Objectives Names of laws and ordinances General Mandates on Lake Basin Management
1. Republic Act No. 4850

DRAFT: Not for Citation or Distribution Laguna de Bay
11
An act creating the Laguna Lake Development Authority, prescribing its powers, functions and duties, providing funds thereof and for other purposes. (July 18, 1966)
2. Presidential Decree No. 813 Amending certain sections of Republic Act No. 4850,
granting the LLDA the exclusive jurisdiction to issue permits for the use of all surface waters of the lake for any project or activity within the region. (October 17, 1983)
3. Executive Order No. 927 Further amending the original charter of the LLDA granting
the power to control and abate pollution within the Laguna de Bay Region. (December 16, 1983).
General Mandates on Lake
4. Executive Order No. 121
Basin Management Creating the Mt. Makiling Reserve Area and Laguna de Bay Commission. (august 24, 1993).
5. Executive Order No. 149 Streamlining the Office of the President (December 28,
1993). 6. Executive Order No. 349 Adopting the Mt. Makiling Reserve Area and Laguna de Bay
Region Master Plan, providing for the implementation thereof and for other purposes. (July 18, 1996).
Pollution Control 1. Presidential Decree No. 984 Providing the for the revisions of Republic Act 3931,
commonly known as "The Pollution Control Law of the Philippines", and for other purposes (August 18, 1976).
2. Presidential Decree No. 1586 Establishing an Environmental Impact Assessment System
including Environmental Management-related measures and for other purposes (June 11, 1978).
3. DENR Administrative Order No. 34, Series of 1990 Revised water usage and classification/water quality criteria
amending section nos. 68 and 69 and Chapter III of the 1978 NPCC Rules and Regulations (March 20, 1990).
4. Republic Act No. 6969 An act to control toxic substances and hazardous nuclear
wastes, providing penalties for violations thereof and for other purposes (July 23, 1990).
5. DENR Administrative Order No. 26-92, Series of 1992 Amending Memorandum Circular No. 02 Series of 1981:
Appointment/Designation of Pollution Control Officers (June 29, 1992).
6. Resolution No. 7, Series of 1993 Approving new schedule of processing fees for
environmental permit/clearance (November 4, 1993). 7. DENR Administrative Order No. 35-91, Series of 1993 Revised effluent regulations of 1990 revising and amending
the effluent regulations of 1982 (December 9, 1993). 8. Resolution No. 24, Series of 1996
DRAFT: Not for Citation or Distribution Laguna de Bay
12
Adoption of Department Administrative Order (DAO) no.30, section 3, paragraph 3.3 (C) of the Department of Environment and Natural Resources (DENR) as part of the policy of the Laguna Lake Development Authority (LLDA) (September 26, 1996).
9. Resolution No. 25, Series of 1996 Implementation of the Environmental User Fee System in
the Laguna de Bay Region and approval of its work and financial plan for CY1997. (November 19, 1996).
10. Resolution No. 33, Series of 1996 Approving the rules and regulations implementing the
Environmental User Fee System in the Laguna de Bay Region (December 19, 1996).
11. Resolution No. 41, Series of 1997 Adoption of the definition of development activities per DENR
Administrative Order No. 96-37 and integration of said definition in the LLDA rules and regulations thereby clarifying further the development activities required to secure LLDA clearance.
(March 21, 1997). Pollution Control 12. Resolution No. 42, Series of 1997 Approving the administrative fines for violations of LLDA
Rules and Regulations (March 21, 1997). 13. Memorandum Circular No. 2, Series of 1997 Inspection and investigation of establishments compliance
to environmental quality standards and pollution control rules and regulations (May 2, 1997).
14. Resolution No. 64, Series of 1997 Prescribing new schedule of processing fees and other fees
for environmental permits/clearances within the Laguna de Bay Region. (December 23, 1997).
15. Memorandum Circular No. 98-8 Ensuring safe navigation in specified lake areas (December
10, 1998). 16. Resolution No. 104, Series of 1999 Adoption of Department Administrative Order No. 51,
Series of 1998, pertaining to the Industrial Ecowatch System and its implementing guidelines, of the Department of Environment and Natural Resources (DENR) as part of the policy of the
Laguna Lake Development Authority (LLDA) (March 25, 1999). 17. Memorandum Circular No. 99-02
Amendment of certain provisions of Memorandum Order No. 97-84, Series of 1997, concerning the simplified requirements for Accrediting Pollution Control Officers (March 29, 1999).
18. Resolution No. 106, Series of 1999 Approving the policy guidelines governing all industrial
estates/parks within the Laguna de Bay Region (April 25, 1999).
19. DENR Administrative Order No. 99-17, Series of 1999. Updating Department Administrative Order No. 35, Series
of 1990 otherwise known as the Revised Effluent Regulations of 1990, revising and amending the effluent regulations of 1982 (July 8, 1999).
Fishery Management 1. Executive Order No. 240

DRAFT: Not for Citation or Distribution Laguna de Bay
13
Creating Fisheries and Aquatic Resources Management Councils (FARMC's) in barangays, cities and municipalities, their composition and functions (April 28, 1995).
2. Memorandum Circular No. 96-60 Policy guidelines for the fishcage operation in the Laguna
de Bay ((April 28, 1995). 3. Rules and Regulations Implementing the Revised
Laguna De Bay zoning and Management Plan (ZOMAP) (January 25, 1996).
4. Resolution No. 9, Series of 1996 Amending Section 4.3 of the Rules and Regulations
implementing the Revised Laguna De Bay Fishery Zoning and Management Plan (ZOMAP) of 1996. (February 29, 1996).
6. Resolution No. 15, Series of 1996 Approving the implementation of the modified sharing of
fishpen fee per R.A. 4850, as amended (June 27, 1996).
7. Resolution No. 26, Series of 1996
Approving the co-management approach to attain sustainability of the Seven-Crater Lakes of San Pablo City by deconcentrating certain administrative functions of the LLDA (November 19, 1996).
8. Resolution No. 27, Series of 1996 Approving the policy guidelines for fishcage operation in
the Laguna de Bay (November 19, 1996). 9. Resolution No. 28, Series of 1996 Approving the policy guidelines for public bidding of the
remaining free fishpen area in the Laguna de Bay (November 19, 1996). 10. Memorandum Circular No. 97-5 Fishpen block verifications (July 15, 1997). 11. Resolution No. 70, Series of 1998
Approving the policy framework on the use of Seven-Crater Lakes of San Pablo City (March 30, 1998).
12. Memorandum Circular No. 2, Series of 1998 Moratorium in the construction of fishcages in Laguna de
Bay (August 19, 1998). 13. Memorandum Circular No. 98-06 Policy guidelines for fishcage operation in the Laguna de
Bay (October 7, 1998). 14. Memorandum Circular No. 7, Series of 1998 Policy guidelines in the collection of annual fishpen fees for
Winning bidders. 15. Memorandum Circular No. 1, Series of 1999 Policy guidelines for fishpen registration in Laguna de Bay
(January 25, 1999).
Shoreland Management
1. Section 41 (11) of Republic Act No. 4850
2. Memorandum Order No. 204 Creating an effective committee to oversee the
implementation of the short and long term plans for the Mt. Makiling Reserve Area and Laguna de Bay Commission (April 27,
DRAFT: Not for Citation or Distribution Laguna de Bay
14
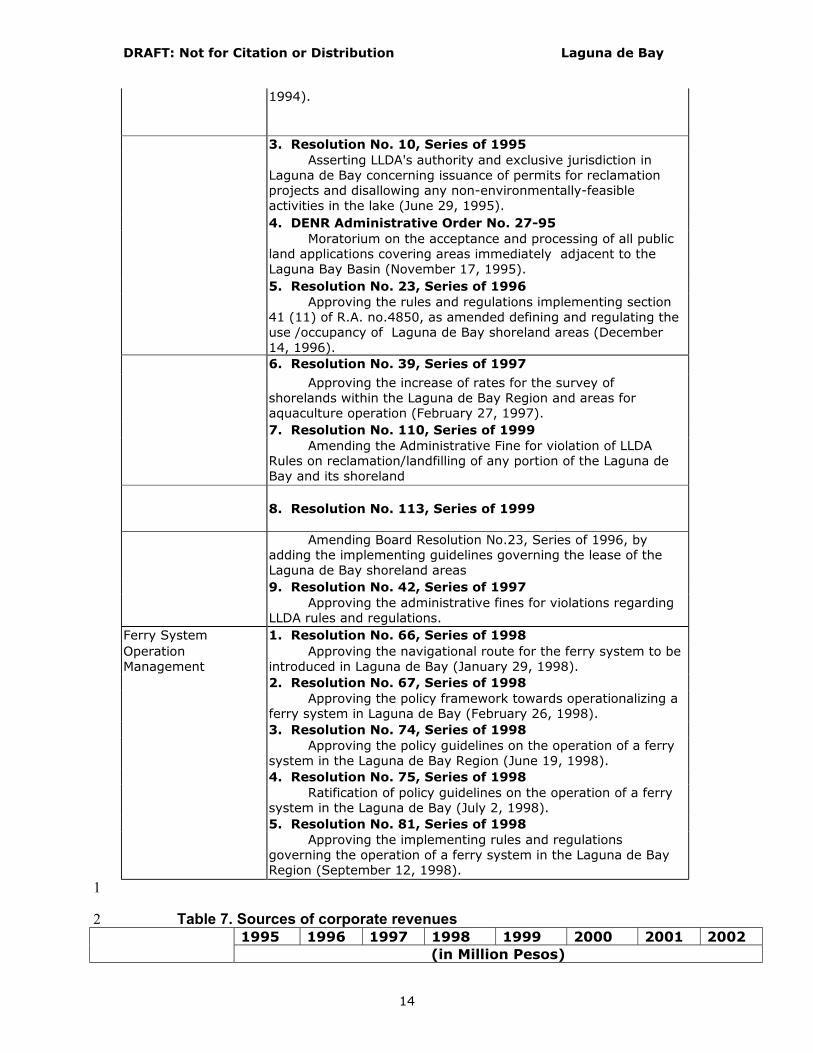
1994).
3. Resolution No. 10, Series of 1995 Asserting LLDA's authority and exclusive jurisdiction in
Laguna de Bay concerning issuance of permits for reclamation projects and disallowing any non-environmentally-feasible activities in the lake (June 29, 1995).
4. DENR Administrative Order No. 27-95 Moratorium on the acceptance and processing of all public
land applications covering areas immediately adjacent to the Laguna Bay Basin (November 17, 1995).
5. Resolution No. 23, Series of 1996 Approving the rules and regulations implementing section
41 (11) of R.A. no.4850, as amended defining and regulating the use /occupancy of Laguna de Bay shoreland areas (December 14, 1996).
6. Resolution No. 39, Series of 1997
Approving the increase of rates for the survey of shorelands within the Laguna de Bay Region and areas for aquaculture operation (February 27, 1997).
7. Resolution No. 110, Series of 1999 Amending the Administrative Fine for violation of LLDA
Rules on reclamation/landfilling of any portion of the Laguna de Bay and its shoreland
8. Resolution No. 113, Series of 1999
Amending Board Resolution No.23, Series of 1996, by adding the implementing guidelines governing the lease of the Laguna de Bay shoreland areas
9. Resolution No. 42, Series of 1997 Approving the administrative fines for violations regarding
LLDA rules and regulations. Ferry System 1. Resolution No. 66, Series of 1998 Operation Management
Approving the navigational route for the ferry system to be introduced in Laguna de Bay (January 29, 1998).
2. Resolution No. 67, Series of 1998 Approving the policy framework towards operationalizing a
ferry system in Laguna de Bay (February 26, 1998). 3. Resolution No. 74, Series of 1998 Approving the policy guidelines on the operation of a ferry
system in the Laguna de Bay Region (June 19, 1998). 4. Resolution No. 75, Series of 1998 Ratification of policy guidelines on the operation of a ferry
system in the Laguna de Bay (July 2, 1998). 5. Resolution No. 81, Series of 1998 Approving the implementing rules and regulations
governing the operation of a ferry system in the Laguna de Bay Region (September 12, 1998).
1
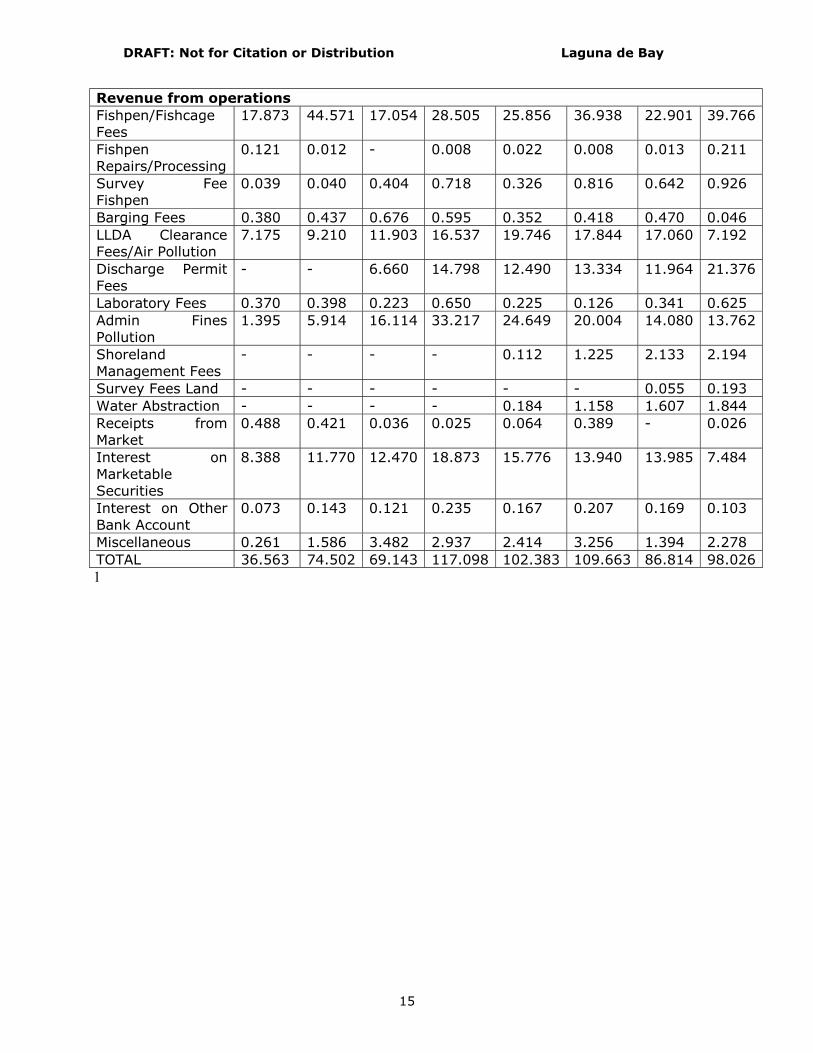
Table 7. Sources of corporate revenues 2 1995 1996 1997 1998 1999 2000 2001 2002 (in Million Pesos)
DRAFT: Not for Citation or Distribution Laguna de Bay
15
Revenue from operations Fishpen/Fishcage Fees
17.873 44.571 17.054 28.505 25.856 36.938 22.901 39.766
Fishpen Repairs/Processing
0.121 0.012 - 0.008 0.022 0.008 0.013 0.211
Survey Fee Fishpen
0.039 0.040 0.404 0.718 0.326 0.816 0.642 0.926
Barging Fees 0.380 0.437 0.676 0.595 0.352 0.418 0.470 0.046 LLDA Clearance Fees/Air Pollution
7.175 9.210 11.903 16.537 19.746 17.844 17.060 7.192
Discharge Permit Fees
- - 6.660 14.798 12.490 13.334 11.964 21.376
Laboratory Fees 0.370 0.398 0.223 0.650 0.225 0.126 0.341 0.625 Admin Fines Pollution
1.395 5.914 16.114 33.217 24.649 20.004 14.080 13.762
Shoreland Management Fees
- - - - 0.112 1.225 2.133 2.194
Survey Fees Land - - - - - - 0.055 0.193 Water Abstraction - - - - 0.184 1.158 1.607 1.844 Receipts from Market
0.488 0.421 0.036 0.025 0.064 0.389 - 0.026
Interest on Marketable Securities
8.388 11.770 12.470 18.873 15.776 13.940 13.985 7.484
Interest on Other Bank Account
0.073 0.143 0.121 0.235 0.167 0.207 0.169 0.103
Miscellaneous 0.261 1.586 3.482 2.937 2.414 3.256 1.394 2.278 TOTAL 36.563 74.502 69.143 117.098 102.383 109.663 86.814 98.026
1