lake characterization study - king county,...
TRANSCRIPT

Kari Moshenberg : SETAC : November, 2004
Kari MoshenbergUW Civil & Environmental Engineering
(Now with Integral Consulting)
LAKE CHARACTERIZATION STUDY:Sediment Triad Analysis of Lakes Sammamish,
Washington, and Union
Technical Assistance Deb Lester (KC-DNR)
Michael Brett (UW)Jim Meador (NOAA)
Dean Wilson (KC-DNR)Jenee Colton (KC-DNR)Richard Jack (KC-DNR)
Deanna Matzen (KC-DNR)Jim Simmonds (KC-DNR)
Dana Walker (KC-DNR)

Kari Moshenberg : SETAC : November, 2004
INTRODUCTION: Study site
RESULTS: Correlation Between 3 Lines-of-Evidence
CONCLUSIONS & RECOMMENDATIONS
Outline
METHODS: Sediment Triad Analysis
Kari Moshenberg : SETAC : November, 2004
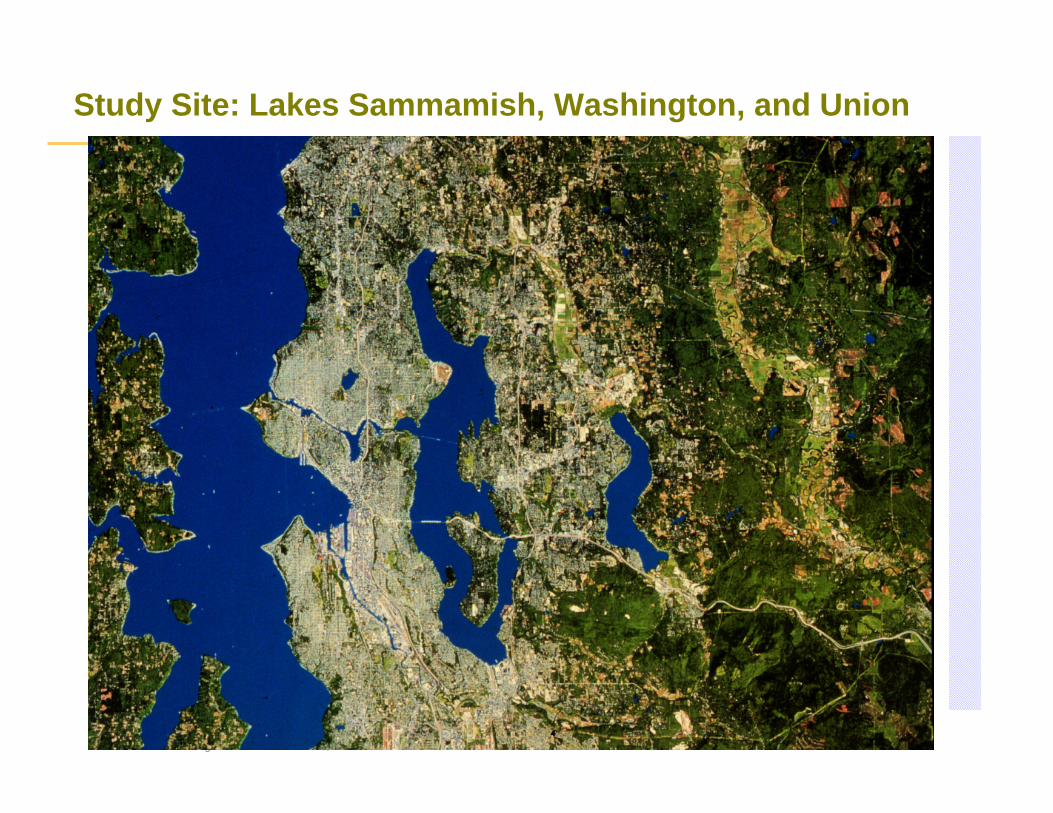
Study Site: Lakes Sammamish, Washington, and Union

Kari Moshenberg : SETAC : November, 2004
Research Questions
What are the contaminants of concern (COC)?
Is there a measurable response to this contamination? If so, are contaminants causing the observed response?
Which lake or areas of the lakes are most impacted?
What are the potential contaminant sources?
Kari Moshenberg : SETAC : November, 2004
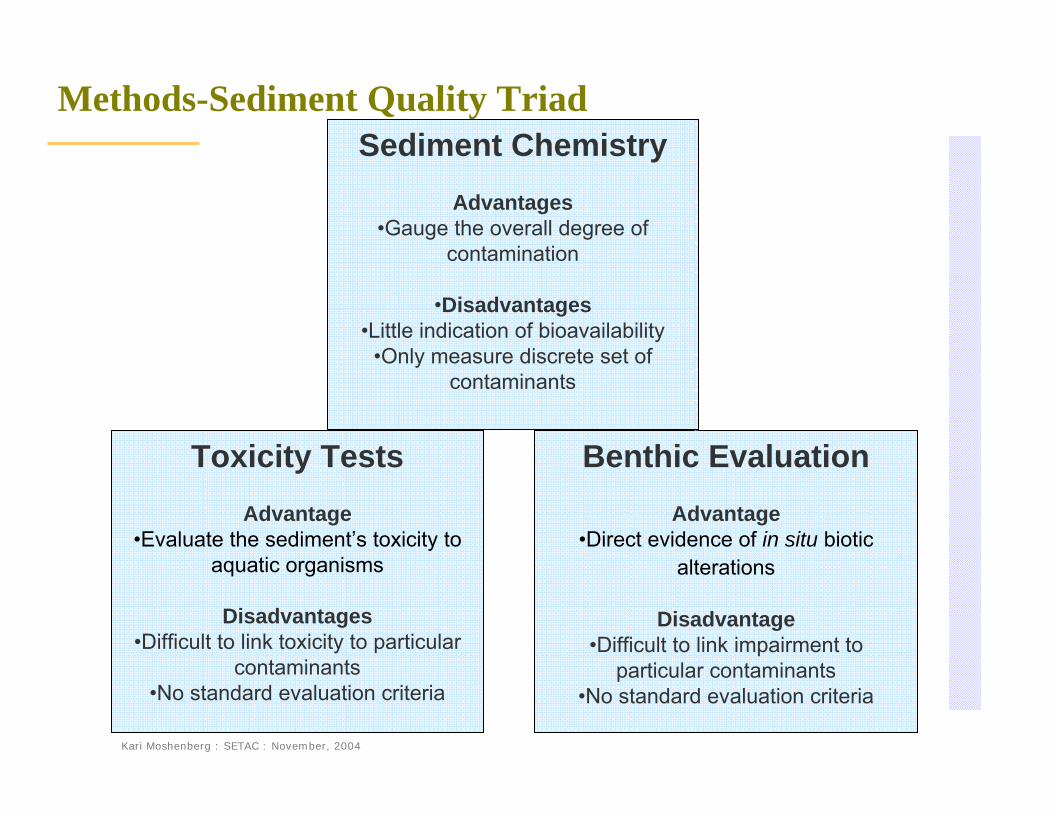
Methods-Sediment Quality Triad
Benthic EvaluationAdvantage
•Direct evidence of in situ biotic alterations
Disadvantage•Difficult to link impairment to
particular contaminants•No standard evaluation criteria
Toxicity TestsAdvantage
•Evaluate the sediment’s toxicity to aquatic organisms
Disadvantages•Difficult to link toxicity to particular
contaminants•No standard evaluation criteria
Sediment ChemistryAdvantages
•Gauge the overall degree of contamination
•Disadvantages•Little indication of bioavailability
•Only measure discrete set of contaminants

Kari Moshenberg : SETAC : November, 2004
Lab Analyses
Sediment Chemistry-KC Environmental Lab» Base/neutral/acid extractable organic compounds (BNAs)» Pesticides and herbicides» PCBs» Metals» Tributyltin and other butyltin isomers» PAHs
Bioassays-KC Environmental Lab» Chironomus tentans and Hyalella azteca mortality» C. tentans growth
Benthic Community Structure and Abundance» Taxa abundances» Benthic Metrics

Kari Moshenberg : SETAC : November, 2004

Kari Moshenberg : SETAC : November, 2004
Chemical Analyses

Kari Moshenberg : SETAC : November, 2004
Sediment Chemistry-Sediment Guidelines
Comparison to SQGs (PEL/TELS and Floating Percentile)
93%100%100%TEL80%97%94%FP
PCBs
93%76%25%TEL80%28%0%FP
Metals
73%17%25%TEL20%0%0%FP
PAHs
73%34%31%FPPhthalates53%34%0%TELDDT33%0%0%TEL
OrganochlorinePesticides
73%10%0%FPTBT13%0%0%FPDibenzofuran
Union Washington SammamishSQGChemical
Group
Percentage of stations in each lake with SQG-Qs >1

Kari Moshenberg : SETAC : November, 2004
Sediment Chemistry – Principle Component Analysis
Principle Component Analysis (PCA) - multivariate statistical technique - reduces variables in a data matrix
Results:» ‘PAHs’ (PC1)- 12 PAHs» ‘Metals’ (PC2)- 6 Metals, Total PCBs, Bis(2-Ethylhexyl)Phthalate,
and Aroclor 1254 » ‘Pesticides’ (PC3)-Arsenic, Total DDT, 4, 4 DDT, and 4, 4 DDE » ‘Butyl Tins’ (PC4)-Butyl Tins; Mono-n-Butyltin, Tri-n-Butyltin, and
Di-n-Butyltin.
150Chemicals
30Chemicals 4 PCsFrequently
< Detection Limit PCA

Kari Moshenberg : SETAC : November, 2004
Bioassay Analyses

Kari Moshenberg : SETAC : November, 2004
Bioassay Analysis
Survival
0% 100%60%
Reference Population
Estimates of the Lowest10th Percentile of theReference Population
a=.05
ToleranceInterval
Comparison to Control: Statistical Significance» ANOVA w/ post hoc Dunnett’s test with at α = 0.05
Comparison to Reference: Reference Envelope» Purpose: Determine if conditions at test site are different from the reference» Method: Tolerance limits are the lower confidence interval bound around some
percentile of the underlying data distribution.» If α = 0.05 & percentile =10%, there is a 95% certainty that a survival values less
than the tolerance interval is as low or lower than the 10th percentile of the distribution of reference site toxicity results.

Kari Moshenberg : SETAC : November, 2004
C. tentans Mortality->C. tentans Growth0.12
H. azteca Mortality->C. tentans Growth0.14
C. tentans Mortality->H. azteca Mortality0.57
Bioassay Comparisonr2

Kari Moshenberg : SETAC : November, 2004
Bioassay Analyses

Kari Moshenberg : SETAC : November, 2004
Correlation Analysis: Chemistry-Toxicity
*Correlation is marginally significant at the .05 level (2-tailed)
**Correlation is significant at the 0.01 level (2-tailed).
0.01**0.2410.052Sig (2-tailed)-0.333-0.151-0.28Pearson CorrelationPC4 (Butyl Tins)0.1970.5020.056Sig (2-tailed)0.1380.0870.244Pearson CorrelationPC3 (Pesticides)
0.00**0.3610.00**Sig (2-tailed)-0.345-0.118-0.558Pearson CorrelationPC2 (PAHs)0.050*0.027*0.00**Sig (2-tailed)-0.25-0.282-0.434Pearson CorrelationPC1 (Metals)
H. aztecaSurvival
C. tentansSurvival
C. tentansGrowthStatisticPredictor

Kari Moshenberg : SETAC : November, 2004
Bootstrap Procedure: Type I Error?
1.03 -0.86 -0.19 -0.58 -0.17 -0.560.82 2.00 1.10 -0.11 0.48 1.701.03 0.11 0.40 -0.30 0.56 -0.281.06 0.50 -0.69 -1.32 -0.48 2.510.86 -1.05 1.00 -1.32 -0.65 3.001.12 -0.49 0.26 -0.55 -0.22 -0.560.85 -0.06 0.45 0.91 0.59 0.070.80 -0.98 -1.19 -0.83 -0.28 -0.56
-0.12 -0.16 -0.25 -0.19 -0.22
-0.471.030.100.110.20-0.310.80-0.77-0.35
1.03 0.11 1.10 -1.32 -0.22 1.70 0.270.82 2.00 0.45 -0.83 0.48 3.00 1.021.03 0.50 1.10 -0.11 -0.22 0.07 0.271.06 -0.86 -1.19 -0.30 0.56 2.51 0.150.86 -1.05 0.26 -0.83 -0.17 -0.56 -0.471.12 -0.49 -0.69 -0.55 0.59 0.07 -0.210.85 -0.98 0.26 0.91 -0.17 -0.56 -0.110.80 -0.98 -1.19 -0.83 0.48 0.07 -0.49
-0.06 -0.01 -0.08 0.10 0.14 0.04

Kari Moshenberg : SETAC : November, 2004
Bootstrap: Chemistry-Toxicity
Chemicals (r2)r2 (r) of top 5 Chemicals Endpoint
Bis(2-Ethylhexyl)Phthalate(0.32), Cu (0.23), Phenanthrene(0.22), Anthracene(0.19), Benzo(k)fluoranthene(0.18)
Aroclor 1254(0.35), Anthracene(0.35), Bis(2-Ethylhexyl)Phthalate(0.35), Benzo(k)fluoranthene (0.32), Total PCBs(0.32)
DBT (0.15), Pyrene(0.14), Phenanthrene(0.14), Chrysene(0.14), Benzo(a)Anthracene(0.14) 0.16 (-0.47) C. tentans
Survival
0.30 (-0.56) H. azteca Survival
0.47 (-0.68)C. tentansGrowth

Kari Moshenberg : SETAC : November, 2004
Benthic Community Structure & Abundance
Shannon-Weaver- # of distinct taxaSpecies Richness- Evaluates both the # of species and the proportional representation of taxa within the benthic community Hilsenhoff Biotic Index- Pollution tolerances of taxa

Kari Moshenberg : SETAC : November, 2004
Benthic Regression ModelsPredictor Variables
» Chemical:4 PCs» Physical: Depth, Grain Size, Extractable Phosphorus, Ammonia Nitrogen
Pearson Correlation
0.200.470.26Model Adjusted r2
0.28-0.17-0.16PC4 (Butyl Tins)0.18-0.48-0.25PC3 (Pesticides)0.24-0.07-0.23PC2 (Metals)0.20-0.07-0.17PC1 (PAHs)
0.12-0.45-0.22Percent Fines
0.17-0.57-0.32Depth
0.38-0.43-0.45Extractable Phosphorus
0.35-0.49-0.45Ammonia Nitrogen
HBISpecies Richness
Shannon-WeaverPredictor
= Significant Term in Regression Model

Kari Moshenberg : SETAC : November, 2004
Benthic Community Structure and Abundance
#
#
#
#
#
#
# #
#
#
#
#
#
#
##
#
#
#
#
#
#
#
#
#
#
#
#
#
#
#
#
#
###
#
##
#
#
#
##
#
#
#
##
#
#
#
#
#
#
#
#
#
#
#
Lakes
Benthic MetricsHBISpecies RichnessShannon-Weaver
1 0 1 Miles
3 0 3 Miles
Legend

Kari Moshenberg : SETAC : November, 2004
Decision Matrix
Chemistry data» Floating Percentile SQG
Bioassay Data» Weighted statistical significance based on bootstrap r2
» Weighted reference envelope based on bootstrap r2
Benthic Community Structure and Abundance» Weighted statistical significance based on benthic models.
Graded Stations» A (0-10 Points): Minimally Impacted» B (10-20 Points): Moderately Impacted» C (20-30 Points): Severely Impacted

Kari Moshenberg : SETAC : November, 2004

Kari Moshenberg : SETAC : November, 2004
Research Questions
What are the contaminants of concern (COC)?» SQGs: PCBs, metals, PAHs, and phthalates » Aroclor 1254, Zn, Cu, and Pb, Pyrene, and BEHP » **Lake Union**-TBT, metals, PAHs, and phthalate, PCB
Is there a measurable response to this contamination? If so, are the contaminants causing the response?» Bioassay
• Week-Moderate correlation with contamination• C. tentans growth most responsive
» Benthic• Nutrient concentrations, grain size, depth explained most
variation• Species richness most responsive to sediment characteristics
Kari Moshenberg : SETAC : November, 2004
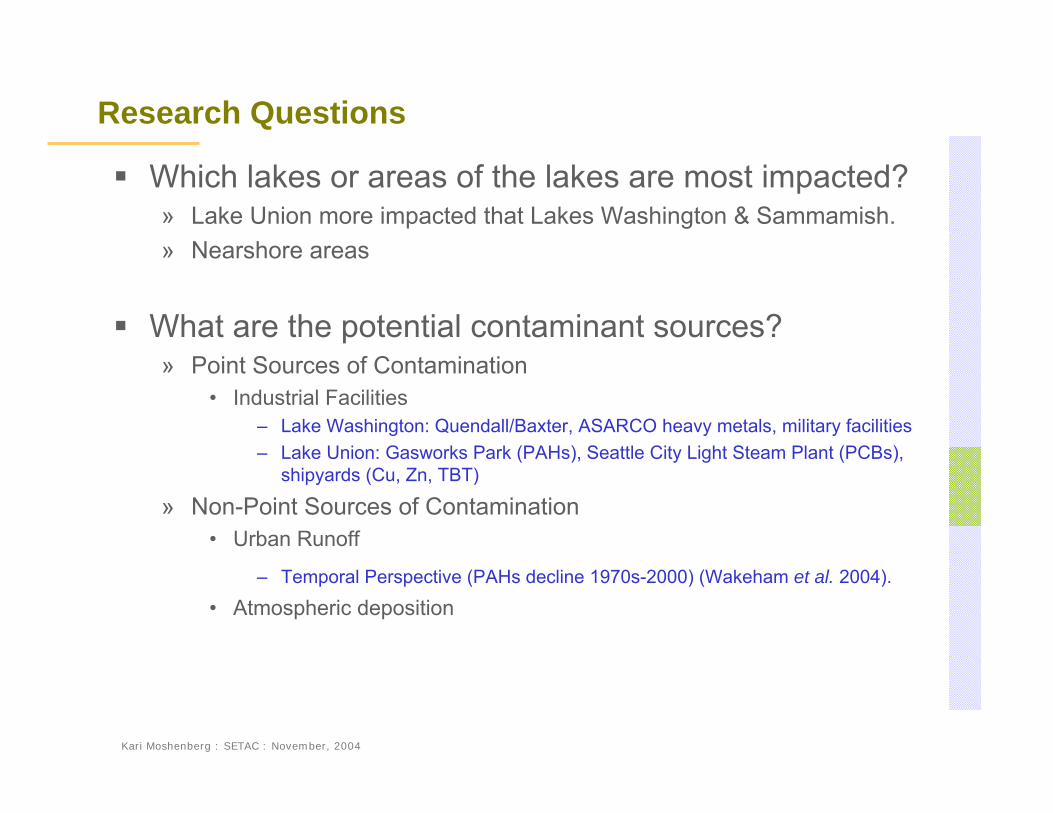
Research Questions
Which lakes or areas of the lakes are most impacted?» Lake Union more impacted that Lakes Washington & Sammamish.» Nearshore areas
What are the potential contaminant sources?» Point Sources of Contamination
• Industrial Facilities– Lake Washington: Quendall/Baxter, ASARCO heavy metals, military facilities– Lake Union: Gasworks Park (PAHs), Seattle City Light Steam Plant (PCBs),
shipyards (Cu, Zn, TBT)
» Non-Point Sources of Contamination• Urban Runoff
– Temporal Perspective (PAHs decline 1970s-2000) (Wakeham et al. 2004).
• Atmospheric deposition

Kari Moshenberg : SETAC : November, 2004
Recommendations
Chemistry» More information about chemicals related to toxicity
Bioassays» Bioassays with chronic and sub-lethal endpoints
Benthic» Continue investigating relationships between physical & chemical
parameters & benthic community
Bioaccumulation» PCBs and Hg present in Lake Washington fish
Station groupings: opportunities for future study» A (78%): Minimally Impacted» B (17%): Moderately Impacted» C (5%): Severely Impacted

Kari Moshenberg : SETAC : November, 2004
Chemistry-Toxicity
Acid Volatile Sulfide/Simultaneously Extractable Metals (AVS/SEM )» Hypothesis: If sufficient SEM<AVS, metals bind to sediment phase sulfides and
are not bioavailable, thus not toxic (Di Toro et al. 1990). » Results
• 40% of Samples had SEM/AVS ratios of >1• 5% of samples had SEM/AVS ratios of >20 (All in Lake Union)• Little predictive power, but could be due to low occurrence of SEM/AVS ratios>20
Correlation analysis» Evaluate relationship between chemical PCs and bioassay test results.
Bootstrap» Investigate correlations between contaminants and bioassay tests results.

Kari Moshenberg : SETAC : November, 2004
Uncertainty
Chemical Contaminants» Not all chemicals analyzed» Detection limits & laboratory procedures» Chemicals without SQGs» Uncertainties in SQGs (only growth & survival)
Bioassay» Acute rather than chronic tests (chronic tests are more sensitive)» No information about bioaccumulation» Statistical methods
Benthos » Is response associated with organic enrichment or contamination?» Statistical methods