lake minnetonka conservation district...
TRANSCRIPT

Lake Minnetonka Conservation District
(LMCD)
Comprehensive Eurasian Watermilfoil
and Curly-Leaf Pondweed Management Plan
Prepared By: LMCD AIS Sub-Committee
Reviewed By: LMCD AIS Task Force (October 12, 2012)
Reviewed By: LMCD Board (October 24, 2012 and November 14, 2012)
LMCD Public Hearing: (December 12, 2012)
Amended Version Adopted By LMCD Board: (March 13, 2013)
23505 Smithtown Road (Suite 120)
Shorewood, MN 55331
www.lmcd.org
2
Table of Contents
Page Number
Introduction I. Background 3
II. History
A. Discovery 3
B. Scientific Management Team 3
C. Professional Guidance 4
D. Whole Bay Coordinated Herbicide Treatments 4
Comprehensive Eurasian Watermilfoil (EWM) and Curly-Leaf Pondweed
(CLP) Management Plan (Plan)
I. Purpose 5
II. Plan Components 5
III. AIS Sub-Committee 5
IV. Goals and Objectives
A. Problem Statement 6
B. Management Goals 6
C. Management Areas 6
D. Management Tools 6
Implementation I. Mechanical Harvesting 7
II. Whole Bay or Large Scale Herbicide Treatments 8
III. Roles and Responsibilities 10
Appendix A: Chip Welling 9/5/12 Excerpt on Benefits of Native Plants 11
(6 Pages)
Appendix B: Assessment of 2008-2011 Coordinated Herbicide Treatments 12
on Carmans, Grays, and Phelps Bays Summary Report (6 Pages)
Appendix C: Table 1- MN DNR Comparison of Mechanical Harvesting 13
vs. Herbicides (1 Page)
Appendix D: Table 2- Lake Minnetonka Invasive Plant Information 14
(2 Pages)
Appendix E: Whole Bay or Large Scale Herbicide Treatment 15
Matrix (2 Pages)
Appendix F: Table 3- Lake Minnetonka Key Features (5 pages) 16
3
INTRODUCTION
I. Background
Lake Minnetonka is a 14,043 acre public body of water located in Hennepin and Carver counties.
The Lake Minnetonka Conservation District (LMCD), which was created by state statute in 1967,
balances the interests of the abutting property owners and the interests of the general public.
Watercraft types on Lake Minnetonka are diverse, and include recreational watercraft (cruisers and
runabouts), fishing, sailing, pontoons, and personal watercraft. There are also a number of
pathways for the public to access Lake Minnetonka. These pathways include: 1) docks and
moorings on abutting properties; 2) docks at commercial marinas, restaurants, municipal sites, and
yacht clubs; 3) public and private accesses; and 4) watercraft for hire (charter boats). When
preparing this Plan, the sub-committee took into consideration the public and private interests of all
Lake Minnetonka stakeholders.
Aquatic plants provide habitat for fish and wildlife, as well as water quality benefits. Studies have
consistently shown that fish abundance is greater in vegetated habitats than in un-vegetated habitats
(Dibble et al. 1996; Pratt and Smokorowski 2003; Wei et al. 2004). Aquatic plants provide fish
and wildlife with food, spawning, nesting habitat, and cover from predators (Dibble et al. 1996;
Petr 2000; Valley et al. 2004). In addition, aquatic plants anchor sediments and sequester nutrients
like phosphorous and nitrogen, thus reducing turbidity caused by sediment and algae blooms
(Barko and James 1998, Petr 2000). However, excessive growth of invasive species such as
Eurasian watermilfoil (EWM) and Curly-leaf pondweed (CLP) can negatively affect recreational
use of the lake and displace native plant species. Control of these invasive species is periodically
warranted to minimize these impacts. This Plan discusses the LMCD’s involvement in the control
of these species. See Appendix A for further details on the benefit of native aquatic plants.
II. History
A. Discovery
In 1987, EWM was discovered on Lake Minnetonka. In response to this, the LMCD
coordinated a series of public meetings and forums to evaluate the best means of managing
EWM. At that time, it was determined that mechanical harvesting was the best means to
manage EWM on Lake Minnetonka. Additionally, a EWM Task Force was established with
the primary goal to provide professional guidance to the LMCD on:
1. The EWM Mechanical Harvesting Program; and
2. Other EWM management techniques.
B. Scientific Management Team
Early on, a Scientific Management Team was established as a sub-committee of the EWM Task
Force. This sub-committee included representatives from the LMCD, Minnesota Department
of Natural Resources (MN DNR), Freshwater Foundation, University of Minnesota (U of M),
U.S. Army Corps of Engineers (Army Corps), Three Rivers Park District (TRPD), Lake
Restoration, Lake Management, and Midwest Aquacare. This group researched EWM control
methods throughout the country; tracked the spread of EWM in Lake Minnetonka and other
lakes; and reviewed proposed control projects such as whole bay herbicide treatments, “weed
pullers”, iron applications, and biological control research. Dr. Ray Newman from the U of M

4
was an integral part of this committee. At that time, the LMCD EWM Task Force was the
multi-agency committee for aquatic invasive species (AIS) in Minnesota.
C. Professional Guidance
A summary of the historical guidance provided by the EWM Task Force on the primary goal
listed above is as follows:
LMCD EWM Mechanical Harvesting Program
The involvement of the Task Force was more substantial during the initial stages of this
program (in particular when the LMCD and the various stakeholders were discussing the best
means to manage EWM on Lake Minnetonka). Once the harvesting equipment was purchased
in 1989, the Task Force provided guidance with regards to the LMCD contracting for
harvesting vs. the hiring of seasonal employees. The Task Force continues to play a supporting
role for this program on an as-needed basis.
Exploring Other Management Techniques
The Task Force has been quite active over the years on this goal. A summary of the activity is
as follows:
1) Research in the early 1990’s on the use of biological control (weevils). This was closely
coordinated between the MN DNR and Dr. Ray Newman at the University of Minnesota.
This project was on-going for a number of years on Smiths Bay and funded through the
Legislative Commission on Minnesota Resources. An augmentation study was conducted
on this in 2001.
2) An assessment in the mid 1990’s on the use of equipment that “pulls weeds” as an
alternative to sickle-bar harvesting equipment.
3) Participation in a number of herbicide treatment projects over the years. Some of these
include:
a. The use of Sonar (fluridone) in the early 1990’s on Libbs Lake (consideration was also
given to St. Albans Bay).
b. Triclopyr studies on Lake Minnetonka in the mid and late 1990’s.
c. A Milfoil Demonstration Project on Carmans, Grays, and Phelps Bays in 2006. This
was the impetus for the creation of a formal Lake Vegetation Management Plan
(LVMP) in 2007 and 2008 for these three bays.
d. Five year, three bay coordinated herbicide treatments on Carmans, Grays, and Phelps
Bays from 2008 through 2012.
D. Whole Bay Coordinated Herbicide Treatments
During the winter of 2007 and 2008, an LVMP for coordinated herbicide treatments was
prepared for Carmans, Grays, and Phelps Bays. The primary goals of this demonstration
project were to:
1. Evaluate whether EWM and CLP could be managed with lower dosages of herbicides on a
whole bay.
2. Evaluate whether these treatments would damage the native plants in these three bays.
The LVMP was co-signed by the LMCD and the Lake Minnetonka Association (LMA) and
was prepared by the LMCD’s Aquatic Invasive Species (AIS) Task Force (formerly known as

5
the EWM Task Force). At that time, the Task Force was comprised of agency and technical
representatives who served as the LVMP’s advisory committee.
Representatives on this Task Force in 2012 include appointed LMCD Board members (Task
Force Chairman Kelsey Page and Task Force Vice Chairman Jeff Morris), Hennepin County
Environmental Services (Hennepin County), LMA, Minnehaha Creek Watershed District
(MCWD), MN DNR, TRPD, Lisa Whalen (former LMCD Board member), Dick Woodruff
(former LMCD Board member), Gabriel Jabbour (Tonka Bay Marina), and Jay Green (Anglers
for Habitat).
In April of 2012, the AIS Task Force assessed the results of the treatments from 2008 through
2011 based on the LVMP goals and objectives. A Summary Report from the Task Force was
prepared and presented to the LMCD Board of Directors (see Appendix B). The consensus of
the Task Force was that the LMCD Board should not extend the three-bay project beyond 2012,
or expand the project to other bays, until a comprehensive vegetation management plan is
developed for all of Lake Minnetonka. The LMCD Board concurred with this
recommendation.
COMPREHENSIVE EWM AND CLP MANAGEMENT PLAN (PLAN)
I. Purpose
This Plan is to provide guidance to the LMCD and its local partners for the management and
control of existing EWM and CLP in Lake Minnetonka. This Plan is not a formal MN DNR
LVMP.
II. Plan Components
The most problematic plants in Lake Minnetonka, which produce surface mats and interfere with
recreational activities, are EWM and CLP (in particular EWM). When preparing this Plan, the sub-
committee agreed that the Plan needs to reflect the following considerations:
The Plan needs to be balanced, cost effective, environmentally sound, and not cause
detrimental ecological impacts.
The Plan needs to reflect how the general public and property owners use the lake and how
these uses are affected by aquatic vegetation.
Conversely, recreational uses affect aquatic vegetation and impact the health of the lake.
The Plan needs to balance the lake’s use and lake’s health.
Management activities will maintain or increase native aquatic plants and water quality.
Management activities for invasive aquatic plants, which lead to the increase of native aquatic
plant population, will be given preference.
The Plan needs to be flexible because vegetation growth and lake conditions change.
The Plan must provide a long-term, holistic approach.
III. AIS Sub-Committee
In June of 2012, the LMCD’s AIS Task Force met to discuss how to prepare a Plan for Lake
Minnetonka. The consensus was to establish a sub-committee to prepare the first draft of the Plan
to be reviewed. Task Force members that agreed to serve on this sub-committee include John
Barten (TRPD), Eric Fieldseth (MCWD), Dick Osgood (LMA), and Chip Welling (MN DNR).
Additionally, Task Force Chairman Kelsey Page and LMCD Executive Director Greg Nybeck have

6
participated on this sub-committee. After a series of seven meetings from June into September, the
first draft of the Plan was presented to the AIS Task Force on October 12, 2012.
IV. Goals and Objectives
A. Problem Statement
EWM and CLP are problematic plants where they produce surface mats that interfere with
recreational activities. This Plan recognizes that there are additional invasive aquatic plants,
not yet or marginally established in Lake Minnetonka, which have the potential to cause
problems affecting recreational use of the lake, negatively affecting the health of the lake, or
could serve as a source of spread to other uninfested water bodies. Therefore, a monitoring
plan would need to be established for early detection, rapid response, and roles and
responsibilities.
B. Management Goals
The following management goals have been established by the sub-committee for this Plan:
1. Enhance navigability for recreational and commercial use in public areas of Lake
Minnetonka affected by EWM and CLP.
2. Management activities will maintain or increase native aquatic plants and water quality.
3. Management activities will leverage the broadest sources of available funds.
C. Management Areas
Public Areas- The sub-committee is recommending that the LMCD limit financial participation
for control activities to public areas of the lake where there will be an identified public benefit.
For this Plan, the sub-committee has defined public areas as the following:
1. All areas 100 feet offshore and outside of the authorized dock use areas as established by
LMCD Code; or
2. All areas adjacent to publically owned land or other public access points and destinations.
Private Areas - Plant control in areas outside of the defined public use areas would be the
responsibility of the private property owners. Generally, these are areas within 100 feet of the
lake shoreline.
D. Management Tools
A number of EWM and CLP management tools were considered as part of this Plan. These
included:
1. Mechanical harvesting;
2. Systemic herbicides;
3. Contact herbicide;
4. Hand-pulling; and
5. Biological weevils. Of these tools, the sub-committee recommends that the use of mechanical harvesting and herbicides (both systemic and contact) should be used to manage EWM and CLP on Lake Minnetonka. Both tools have pros and cons and Table 1 in Appendix C provides a summary of the strengths and weakness of each tool. The sub-committee recommends that mechanical harvesting continue to be used on Lake Minnetonka; while also adding herbicide treatments where whole bay or large scale treatments are appropriate and cost effective. In 2012, the MCWD conducted demonstration projects to establish whether hand-pulling is a useful tool to manage flowering rush on some parts of Lake Minnetonka, and whether biological weevils are a useful tool to manage EWM on Christmas Lake. Table 2 (see Appendix D) was established to guide planning and decision making, but not guide operations, to determine whether EWM or CLP are, or could become, nuisances within the public use areas of Lake Minnetonka. Table 2 provides an overview of potential problem areas only because these areas are over estimates of the actual problem areas. Specific notes for considering this information in this table include the following:
• CLP has not generally been problematic nor the principal target of vegetation control in Lake Minnetonka.
• The littoral area refers to the area where rooted plants inhabit, which is generally limited by light penetration. The MN DNR defines the littoral area as the 15 foot water depth contour. EWM and other plants may grow deeper (especially in clear water) or shallower (especially in turbid water). The depth of the colonization does not necessarily indicate the overall extent of problematic EWM growth.
• Potential problem area, in this context, is only the littoral area. For operations, a detailed delineation of actual problem areas will be required prior to implementation of any controls.
• Private areas of the lake, as used here, refer to those areas within the littoral area that are adjacent to privately owned property. The public/private demarcation used here only serves as a guideline for delineating areas where public funds might be used for broader invasive plant control.
IMPLEMENTATION
I. Mechanical Harvesting
A. Project Management Mechanical harvesting will be used to manage EWM and CLP in public areas. Private areas are the responsibility of the abutting property owners to manage EWM and CLP. The LMCD currently owns a fleet of three harvesters (with ancillary equipment) that has historically operated from mid June through mid August. Harvesting priorities are based on impediments to public navigation, which are addressed through a combination of channel and clear cutting. The LMCD has historically served as the project manager and the sub-committee recommends that this continue in the future. The LMCD may decide, on an as-needed basis, to use contact or systemic herbicides in smaller areas, as a complement to mechanical harvesting.
B. Funding There are currently two established funding sources for the LMCD’s Mechanical Harvesting Program on Lake Minnetonka. These sources include: 1) a taxable levy through the 14 Lake
7

8
Minnetonka communities consistent with the LMCD’s state enabling legislation, and 2) an
annual grant from the MN DNR.
C. Monitoring, Evaluation, and Reporting
The LMCD has historically assessed EWM growth by an aerial survey, complemented by an
on-the-water survey during operations. Pre-season, mid-season, and post-season reports are
prepared by LMCD staff and presented to the LMCD Board to update them on plans and
accomplishments of the program. Key statistical data documented by the LMCD staff includes,
harvester loads, truck loads, and acres harvested. The general public is kept informed on the
program, in particular the location of past and upcoming harvesting locations, through a weekly
update that is posted on the LMCD’s website. The sub-committee recommends that additional
efforts should be explored to further inform the general public.
II. Whole Bay or Large Scale Herbicide Treatments The sub-committee has identified eight management areas as suitable candidates for whole bay or
large scale herbicide treatments (within current financial, technical, and regulatory constraints) as a
complement to existing mechanical harvesting in public areas. The criteria used by the sub-
committee to rank the suitability of the 42 areas on Lake Minnetonka, as well as a matrix
spreadsheet, are detailed in Appendix E. Additionally, Table 3 in Appendix F outlines key
information such as; existence of licensed multiple docks, public launch ramps, Quiet Water Areas,
an average of MN DNR permits for herbicide treatments, and average Secchi disc readings; which
was used in preparing the herbicide treatment matrix in Appendix E. The areas identified as
suitable for whole bay or large scale treatments, meeting the criteria in Section B2 (as follows),
currently include:
1. St. Albans Bay
2. Grays Bay
3. St. Louis Bay
4. Carsons Bay
5. Carmans Bay
6. Phelps Bay
7. Gideon Bay
8. North Arm Bay (*)
(*) A pre-inventory of EWM, CLP, and other aquatic vegetation has not been conducted on this
bay, which would be a prerequisite for a whole bay or large scale herbicide treatment.
A. Funding
The LMCD Board recognizes that sources of both private and public funding may be available
to support herbicide treatments on Lake Minnetonka. It is expected that funds provided by
other public agencies or via grant programs will likely be directed through the LMCD, although
the LMCD has no specific requirements for this to occur. The LMCD is also willing to accept
and manage private funds; recognizing that not all private sources may want to rely on public
agencies to accomplish specific treatment results. The LMCD is also aware that private funding
tends to be greater when treatments provide localized benefits.
Where privately funded or managed large scale treatments coexist with public efforts, it is
expected that all treatment providers will operate though a single annual treatment plan
coordinated by a sub-committee of the LMCD’s AIS Task Force. The LMCD Board feels this

9
type of lake-wide plan is needed to minimize additive or adverse effects of large scale herbicide
treatments, and to ensure common and consistent methods are applied to reporting treatment
effectiveness.
B. Monitoring, Evaluation, and Reporting
1. The sub-committee is recommending that the efficacy and need to treat be determined by
use of objective measurement criteria. The previous measurement matrix included point-
intercept frequency of occurrence and biomass measurements. However, the point intercept
method did not appear to reflect the actual levels of nuisance plant growth, and biomass
monitoring as an alternative was very expensive. The committee is therefore
recommending that a combination of point-intercept sampling, supplemented by hydro-
acoustic biomass estimates be used to determine treatment needs and efficacy. At a
minimum, sampling needs to be completed in a targeted area once before a treatment and
once post-treatment, preferably in mid to late summer. Delineation of the actual treatment
area prior to treatment will be done through a visual survey of plant locations.
2. Evaluation – The sub-committee recommends that the LMCD participate in treatment
projects only when the point-intercept and hydro-acoustic data, collected by a third party
vendor, determine that an impediment to public recreation exists or is likely to occur in the
following year. The assessment of problem conditions will be completed by a sub-
committee of the LMCD’s AIS Task Force.
3. The criteria used to determine treatment needs are as follows:
Frequency of occurrence, as measured by the point-intercept method, exceeds 50
percent;
Hydro-acoustic measurements indicate the EWM/CLP bio-volume is problematic or
has the potential to be problematic in over half of the targeted littoral area;
EWM plants are observed to be forming surface mats in areas that boaters cannot
avoid;
This information will be provided to the LMCD and LMA by October 15 of the year
preceding a proposed treatment.
4. Reporting – Following each whole bay or large scale chemical treatment, the project
manager will provide to the LMCD Board a summary report including the following:
Acres treated and chemical used;
Pre- and Post-treatment point intercept and hydro-acoustic data;
An analysis of target plant control efficacy;
A summary of non-target plant percent frequency and density;
Cost of the program, both total and per-acre;
Areas where native plant damage is observed or measured; projected or
recommended treatment in the following year; and
Report indicating the data collection would be due by October 15th
of the preceding
year.
C. Project Management
In the 2008-2012 whole bay or large scale herbicide treatments, the LMA served as the project
manager. Project management for future whole bay or large scale herbicide treatments could
be done by the public agency, most likely the LMCD, a non-public sector organization such as
the LMA, or private operators. The Task Force could not reach a consensus on the ongoing
ownership of project management. Because of this, it is expected that multiple treatment
10
providers will exist in any given year and the LMCD’s role will provide coordination of all
large scale treatment providers on an annual basis.
III. Roles and Responsibilities
LMCD
1. Serve as the project manager for the mechanical harvesting program and possibly
herbicide treatment projects (most likely those with a significant level of public funding).
2. Facilitate annual assessment of EWM and CLP by the AIS Task Force or through an AIS Sub
Committee, including recommendations to the LMCD Board on the management tool(s) to be
used.
3. Secure the necessary permits and grant funds from the MN DNR for the mechanical
harvesting program and for LMCD managed herbicide treatment project(s).
4. Provide some level of annual funding for the mechanical harvesting program and herbicide
treatment project(s).
5. Request a whole bay or large scale herbicide treatment.
6. Facilitate lake-wide coordination of all large scale treatment programs on an annual basis.
MN DNR
1. Participation on the LMCD’s AIS Task Force and AIS Sub-Committee.
2. Participation in the monitoring, evaluation, reporting of the herbicide treatment project(s).
3. Issue the necessary permits for the mechanical harvesting and herbicide treatment project(s).
4. Grant funds to some level.
LMA
1. Participation on the LMCD’s AIS Task Force and AIS Sub-Committee.
2. Serve as the liaison between the LMCD and the abutting property owners on bays where
whole bay or large scale herbicide treatment projects are planned.
3. Raise private or matching funds to some level.
4. Request a whole bay or large scale treatment.
5. Where funding sources prescribe, manage large scale herbicide treatments, within the lake-
wide AIS Task Force annual treatment framework.
Other Governmental Agencies (Hennepin County, MCWD, TRPD, and Army Corps)
1. Participation on the LMCD’s AIS Task Force and AIS Sub-Committee.
2. Potential matching funds by other governmental agencies.
3. Provide in-kind services where possible.
4. Provide knowledge transfer for other treatment methodologies and programs from across the
nation.

11
Appendix A
Chip Welling
Excerpt on Benefits of Native Plants
9/5/12

\\SERVER\Shared\Greg\Documents\AIS\AIS Sub-Committee\Comprehensive Vegetation Management Plan\Adopted\Apendix
A-F (Final Documents)\Appendix A (Chip Welling).doc p. 1 of 6
For the Minnetonka plan
5 September 2012
Chip Welling
MnDNR
Aquatic plants provide habitat for fish and wildlife as well as water quality benefits. Studies have
consistently shown that fish abundance is greater in vegetated habitats than in un-vegetated habitats
(Dibble et al. 1996; Pratt and Smokorowski 2003; Wei et al. 2004). Aquatic plants provide fish and
wildlife with food, spawning, and nesting habitat, and cover from predators (Dibble et al. 1996; Petr
2000; Valley et al. 2004)). In addition, aquatic plants anchor sediments and sequester nutrients like
phosphorous and nitrogen, thus reducing turbidity caused by sediment and algae blooms (Barko and
James 1998, Petr 2000).
Recent research in Minnesota on the effects on fish of lake-wide selective control of invasive
aquatic plants showed that this management did not affect the number of species or abundance of
littoral fish (Kovalenko et al. 2010).
Near-shore aquatic plants, which are the most frequent targets of control efforts by shoreline
property owners, are particularly important as habitat for young or small fish (Poe et al. 1986; Bryan and
Scarnecchia 1992; Weaver et al. 1997). Ongoing DNR surveys show that shallow vegetated bays have
greater species diversity of nongame fish and amphibians than other habitat types (personal
communication, Pam Perry, DNR nongame wildlife biologist). Surveys have also documented functional
extirpations (i.e., absence of species in targeted surveys) of blackchin shiners, blacknose shiners, and
banded killifish in several metro-area lakes that have likely suffered aquatic plant habitat degradation
(personal communication, Ray Valley, DNR fisheries research biologist).
Many species of birds and mammals are likewise dependent on aquatic plants for food and
nesting sites. Waterfowl eat the seeds and tubers produced by various water plants (Bellrose 1976).
Aquatic plants support numerous insects and other aquatic invertebrates, which are eaten by waterfowl
(Krull 1970) and are important sources of food (protein) for laying females (Batt et al. 1992:7-9). The
reproductive success of waterfowl is closely tied to available aquatic plants, which provide food and
cover for laying hens (Bellrose 1976).

\\SERVER\Shared\Greg\Documents\AIS\AIS Sub-Committee\Comprehensive Vegetation Management Plan\Adopted\Apendix
A-F (Final Documents)\Appendix A (Chip Welling).doc p. 2 of 6
Emergent aquatic vegetation provides nesting cover for a variety of waterfowl, shorebirds,
wading birds and songbirds (Bellrose 1976). The muskrat, an important furbearer, is almost entirely
dependent on aquatic vegetation for food and shelter (Errington 1941).
There seems to be an overall positive effect of submersed aquatic plants on water clarity in lakes.
Scheffer et al. (1993:275) showed that lakes with abundant submersed plants tend to have higher clarity
than lakes with similar levels of nutrients in which vegetation is sparse or absent. Carter et al. (1988)
documented higher Secchi disk transparencies within a bed of submersed plants in comparison with a
location in open water without plants. The importance of submersed plants in maintaining water clarity is
reflected in observations of decreases in water clarity following lake-wide reductions in submersed plants
resulting from treatment with herbicides (O’Dell et al. 1995:314; Welling et al. 1997; Valley et al. 2006).
While the science documenting the habitat and water quality value of aquatic plants is strong, the
relationship between aquatic plants and the abundance of fish and other wildlife is complex and studies
point to the difficulty in defining a precise threshold in aquatic plant abundance at which habitat quality
declines. As a result, it is necessary and reasonable to take a “precautionary management approach” in
setting limits for aquatic plant control (Rosenberg 2002; Valley et al. 2004). This approach
acknowledges that aquatic plants are important habitat and that control limits need to be conservative to
avoid negative impacts to the state’s public waters. This rationale was supported in a previous
administrative law judge’s report when the DNR defended the current rule, which limits pesticide control
of submersed aquatic plants to 15% of the littoral area, even though scientific research had not
documented that 15% was the best limit for all lakes (Exhibit 1).
Invasive aquatic plants may displace native species and hinder recreation more than native
species. At the same time, invasive and native plants often occur together; therefore, while it is necessary
and reasonable to consider this criterion when determining how much control to allow, the presence of
invasive aquatic plants should not be considered the sole criterion in determining whether or not to allow
the maximum amount of control. In addition, in some heavily degraded lakes that have abundant invasive
aquatic plants, few native plants, and low water clarity, excessive control may result in worse problems
such as a net loss in aquatic plant cover, algae blooms, and increased turbidity (Welling et al. 1997;
Valley et al. 2006).
It is necessary and reasonable to consider whether a water body subject to a proposed permit is a
shallow lake or bay, or wetland that naturally supports abundant aquatic plants. These areas are

\\SERVER\Shared\Greg\Documents\AIS\AIS Sub-Committee\Comprehensive Vegetation Management Plan\Adopted\Apendix
A-F (Final Documents)\Appendix A (Chip Welling).doc p. 3 of 6
extremely important for fish and wildlife habitat and wetland loss and habitat degradation is considered a
major environmental issue affecting waterfowl and other wildlife abundance (Dahl 2006; Dahl 1990;
Bellrose 1976). It is necessary and reasonable to view aquatic plant control differently in these areas than
on deeper lakes, because aquatic plant control should not be permitted to change the ecological character
of a wetland or shallow lake. It is not reasonable for the DNR to permit shoreline owners to alter the
natural character of a shallow lake or wetland in order to engage in unimpeded surface water recreation.

\\SERVER\Shared\Greg\Documents\AIS\AIS Sub-Committee\Comprehensive Vegetation Management Plan\Adopted\Apendix
A-F (Final Documents)\Appendix A (Chip Welling).doc p. 4 of 6
Literature Cited
Alexander, M.L., M.P. Woodford, S.C. Hotchkiss. 2008. Freshwater macrophyte communities in lakes of variable landscape position and
development in northern Wisconsin, U.S.A. Aquatic Botany 88:77-86.
Barko, J. W., and W.F. James. 1998. Effects of submerged aquatic macrophytes on nutrient dynamics,
sedimentation, and resuspension. 197-214 IN: Jeppesen, E., M. Sondergaard, M. Sondergaard, and K.
Christoffersen, Editors. The structuring role of submerged macrophytes in lakes. Ecological Studies 131.
Springer-Verlag, NY
Batt, B.D.J., A.D. Afton, M.G. Anderson, C. D. Ankeny, D.H. Johnson, J.A. Kadlec, and G.L. Krapu, editors. Ecology and management of
breeding waterfowl. University of Minnesota Press, Minneapolis and London.
Bellrose, F.C. 1976. Ducks, geese and swans of North America. Stackpole Books, Cameron and Keller Streets, Harrisburg, PA, 17105.
Bolduan, B.R., G.C. Van Eeckhout, H.W. Quade, and J.E. Gannon. 1994. Potamogeton crispus – the other invader. Lake and reservoir
management 10:113-125.
Bremigan, M.T., S.M. Hanson, P.A, Soranno, K.S. Cheruvelil, and R.D. Valley. 2005. Aquatic vegetation, largemouth bass, and water quality
responses to low-dose fluridone two years post treatment. Journal of Aquatic Plant Management 43:57-64.
Byran, M.D., and D.L. Scarnecchia. 1992. Species richness, composition, and abundance of fish larvae and juveniles inhabiting natural and
developed shorelines of a glacial Iowa lake. Environmental Biology of Fishes 35: 329-341.
Carter, V., J.W. Barko, G.L. Godshalk, and N.B. Rybicki. 1988. Effects of submersed macrophytes on water quality in the tidal Potomac
River, Maryland. Journal of Freshwater Ecology 4:493-501.
Chase, J.M., and T.M. Knight. 2006. Effects of eutrophication and snails on Eurasian Watermilfoil (Myriophyllum spicatum) invasion.
Biological Invasions, 8:1643-1649.
Craig, R.E., and R.M. Black. 1986. Nursery habitat of muskellunge in Southern Georgian Bay. Lake Huron, Canada. American Fisheries Society
Symposium 15:79-86.
Crowell, W.J., N.A. Proulx, and C.H. Welling. 2006. Effects of repeated fluridone treatments over nine years to control Eurasian
watermilfoil in a mesotrophic lake. Journal of Aquatic Plant Management 44:133-136.
Dahl, T.E. 1990. Wetland losses in the United States 1780's to 1980's. U.S. Department of the Interior; Fish and Wildlife Service, Washington,
D.C. 13pp.
Dahl, T.E. 2006. Status and trends of wetlands in the conterminous United States 1998 to 2004. U.S. Department of the Interior; Fish and
Wildlife Service, Washington, D.C. 112pp. (see page 17)
Dibble, E.D., K.J. Killgore, and S.L. Harrel. 1996. Assessment of fish-plant interactions. American Fisheries Society Symposium 16:357-372.
Drake, M.T., and R.D. Valley. 2005. Validation and application of a fish-based index of biotic integrity for small central Minnesota lakes. North
American Journal of Fisheries Management 25:1095-1111. Egertson, C.J., and J.A. Downing. 2004. Relationship of fish catch and composition to water quality in a suite of agriculturally eutrophic lakes.
Canadian Journal of Fisheries and Aquatic Sciences 61:1784-1796. (see abstract)
Engel, S. 1990. Ecosystem responses to growth and control of submerged macrophytes: a literature review. Wisconsin Department of Natural
Resources, Technical Bulletin 170, Madison.
Engel, S., and J.L. Pederson. 1998. The construction, aesthetics, and effects of lakeshore development: A literature review. Research Report
177. PUBL-SS-577-99 Wisconsin Department of Natural Resources, Box 7921, Madison, WI 53707.
Errington, P.L. 1941. Versatility in feeding and population maintenance of the muskrat. Journal of Wildlife Management 5:68-89.
Henderson, C.L., C.J. Dindorf, and F.J. Rozumalski. 1998. Lakescaping for Wildlife and Water Quality. Minnesota Department of Natural
Resources
James, W.F., J.W. Barko, H.L. Eakin, and P.W. Sorge. 2002. Phosphorus budget and management strategies for an urban Wisconsin lake. Lake
and Reservoir Management 18:149-163.

\\SERVER\Shared\Greg\Documents\AIS\AIS Sub-Committee\Comprehensive Vegetation Management Plan\Adopted\Apendix
A-F (Final Documents)\Appendix A (Chip Welling).doc p. 5 of 6
James, W.F., D.I. Wright, H.L. Eakin, and J.W. Barko. 2004. Impacts of Mechanical Macrophyte Removal Devices on Sediment Scouring in Littoral Habitats: I. Historical survey of operations in Minnesota lakes. Technical Note APCRP-EA-13, U.S. Army Engineer Research
and Development Center, Vicksburg, MS.
James, W.F., D.I. Wright, J.W. Barko, and H.L. Eakin. 2006. Impacts of Mechanical Macrophyte Removal Devices on Sediment Scouring
in Littoral Habitats: II. Experimental Operation in the Littoral Zone of Eau Galle Reservoir, Wisconsin. Technical Note APCRP-EA-13,
U.S. Army Engineer Research and Development Center, Vicksburg, MS.
Kelly, T., and J. Stinchfield. 1998. Lakeshore development patterns in northeast Minnesota: status and trends. Minnesota DNR, Office of
Management and Budget Services, St. Paul.
Kovalenko, K.E., E.D. Dibble, and J.G. Slade. 2010. Community effects of invasive macrophyte control: Role of invasive plant abundance and habitat complexity. Journal of Applied Ecology 47:318-328.
Krull, J.N. 1970. Aquatic plant-macroinvertebrate associations and waterfowl. Journal of Wildlife Management 34:707-718
Lyons, J. 1989. Changes in the abundance of small littoral-zone fishes in Lake Mendota, Wisconsin. Canadian Journal of Zoology 67:2910-2916.
Madsen, J.D., J.W. Sutherland, J. A. Bloomfield, L.W. Eichler, and C.W. Boylen. 1991. The decline of native vegetation under dense Eurasian
watermilfoil canopies. Journal of Aquatic Plant Management 29:94-99.
Madsen, J.D., K.D. Getsinger, R.M. Stewart, and C.S. Owens. 2002. Whole lake fluridone treatments for selective control of Eurasian
watermilfoil: II. Impacts on submersed plant communities. Lake and Reservoir Management 18:191-200.
Moyle, P.B., and T. Light. 1996. Biological invasions of freshwater: empirical rules and assembly theory. Biological Conservation 78:149-161.
O’Dell, K.M., J. van Arman, B.H. Welch, and S.D. Hill. 1995. Changes in water chemistry in a macrophyte-dominated lake before and after herbicide treatment. Lake and Reservoir Management 11:311-316.
Olson, M.H., S.R. Carpenter, P. Cunningham, S. Gafney, B.R. Herwig, N.P. Nibbelink, T. Pellet, C. Storlie, A.S. Trebitz, and K.A. Wilson. 1998. Managing macrophytes to improve fish growth: a multi-lake experiment. Fisheries 23: 6-12.
Petr, T. 2000. Interactions between fish and macrophytes in inland waters: a review. Food and Agriculture Organization of the United Nations,
Fisheries Technical Report 396. Rome.
Pierce, R.B. 2006. Ecological and life history associations of northern pike
with aquatic vegetation - a literature review. Minnesota Dept. of Natural Resources, Division of Fish and Wildlife unpublished report.
Poe, T.P., C.O. Hatcher, and C.L. Brown. 1986. Comparison of species composition and richness of fish assemblages in altered and
unaltered littoral habitats. Journal of Freshwater Ecology. Vol. 3, No. 4: 525-536.
Pothoven, S.A., B. Vondracek, and D.L. Pereira. 1999. Effects of vegetation removal on bluegill and largemouth bass in two Minnesota lakes.
North American Journal of Fisheries Management 19:748-757.
Pratt, T.C., and K.E. Smokorowski. 2003. Fish habitat management implications of the summer habitat use by littoral fishes in a north
temperate, mesotrophic lake. Canadian Journal of Fisheries and Aquatic Science. 60: 286-3000.
Radomski, P. 2006a. Historical changes in abundance of floating-leaf and emergent vegetation in Minnesota lakes. North American Journal of
Fisheries Management, in press.
Radomski, P. 2006b. An assessment and rationale for the alternative shoreland management standards. Minnesota DNR, Division of Waters, St.
Paul.
Radomski, P., and T.J. Goeman. 2001. Consequences of human lakeshore development on emergent and floating-leaf vegetation abundance.
North American Journal of Fisheries Management 21: 46-61.
Rosenberg, A.A. 2002. The precautionary approach in application from a manager’s perspective. Bulletin of Marine Science 70:577-588.
Rybicki, N.B., and J.M. Landwehr. 2007. Long-term changes in abundance and diversity of macrophyte and waterfowl populations in an estuary with exotic macrophytes and improving water quality. Limnology and Oceanography 52(3):1195-1207/
\\SERVER\Shared\Greg\Documents\AIS\AIS Sub-Committee\Comprehensive Vegetation Management Plan\Adopted\Apendix
A-F (Final Documents)\Appendix A (Chip Welling).doc p. 6 of 6
Scheffer, M., S.H. Hosper, M-L. Meijer, B. Moss, and E. Jeppesen. 1993. Alternative equilibria in shallow lakes. Trends in ecology and
evolution 8:275-279.
Scheffer, M., and S.R. Carpenter. 2003. Catastrophic regime shifts in ecosystems: linking theory to observation. Trends in Ecology and
Evolution 18:648-656.
Skogerboe, J.G., and Getsinger, K.D. 2006. Selective control of Eurasian watermilfoil and curlyleaf pondweed using low doses of endothall
combined with 2,4-D. Technical Note APCRP-CC-05, U.S. Army Engineer Research and Development Center, Vicksburg, MS.
Smith, C.S. and J.W. Barko. 1990. Ecology of Eurasian watermilfoil. Journal of Aquatic Plant Management 28: 55-64.
Valley, R.D., T.K. Cross, and P. Radomski. 2004. The role of submersed aquatic vegetation as habitat for fish in Minnesota lakes, including the
implications of non-native plant invasions and their management. Minnesota Department of Natural Resources, Special Publication 160,
St. Paul.
Valley, R.D., W. Crowell, C.H. Welling, and N. Proulx. 2006. Effects of a low dose fluridone treatment on submersed aquatic vegetation
in a eutrophic Minnesota lake dominated by Eurasian watermilfoil and Coontail. Journal of Aquatic Plant Management 44:19-25.
Wagner, K.I., J. Hauxwell, P.W. Rasmussen, F. Koshere, P. Toshner, K. Aron, D.R. Helsel, S. Toshner, S. Provost, M. Gansberg, J. Masterson,
and S. Warwick. 2007. Whole-lake herbicide treatments for Eurasian watermilfoil in four Wisconsin lakes: Effects on vegetation and water clarity. Lake and Reservoir Management 23:83-94.
Weaver, M.J., J.J. Magnuson, and M.K. Clayton. 1997. Distribution of littoral fishes in structurally complex macrophytes. Canadian Journal of Fisheries and Aquatic Sciences 54:2277-2289.
Wei, A., P. Chow-Fraser, and D. Albert. 2004. Influence of shoreline features on fish distribution in the Laurentian Great Lakes. Canadian Journal of Fisheries and Aquatic Sciences 61:1113-1123.
Welling, C., W. Crowell, and D. Perleberg. 1997. Evaluation of fluridone herbicide for selective control of Eurasian watermilfoil: Final
Report. Unpublished report dated 15 April by the Minnesota Department of Natural Resources, Ecological Services Section, 500 Lafayette
Road, Box 25, St. Paul MN 55155-4025.
Wilcox, D.A., and J.E. Meeker. 1992. Implications for faunal habitat related to altered macrophyte structure in regulated lakes in northern Minnesota. Wetlands 12:192-203.

12
Appendix B
Assessment of 2008-2011 Coordinated
Herbicide Treatments on
Carmans, Grays, and Phelps Bays
(Summary Report)
Assessment of 2008-2011 Coordinated Herbicide
Treatments on Carmans, Grays, and Phelps Bays
Summary Report from the Aquatic Invasive Species (AIS)
Task Force to the LMCD Board of Directors

Page 2 of 6
BACKGROUND
In 2008, the Aquatic Invasive Species (AIS) Task Force created a Lake Vegetation Management Plan
(LVMP) for a five-year demonstration project on Carmans, Grays, and Phelps Bays. The problems to
be addressed in this LVMP included the following:
1. Eurasian watermilfoil (EWM) is the most problematic plant in the three bays because it
interferes with most recreational activities, creates a shoreland cleanup and maintenance chores,
and probably diminishes ecological health. Other invasive species, such as curlyleaf pondweed
(CLP), should be controlled as well.
2. Native submersed plants also interfere with recreational use and riparian access in some areas;
but it is recognized that some kind of rooted submersed plants will always be present, so control
of native plants should be balanced with their protection.
3. Water lilies are sometimes problematic, although there is an appreciation that water lilies
provide valuable habitat.
4. The overall plant management is poorly coordinated.
LMCD STRATEGIC PLAN
The Lake Minnetonka Conservation District (LMCD) Board of Directors has adopted a Strategic Plan
for Lake Minnetonka. One objective in this Plan is to “Reduce the levels of existing AIS.” A goal for
this objective is for the LMCD to “Manage the three-bay treatment project on Carmans, Grays, and
Phelps Bays.” Per Agreement, the Lake Minnetonka Association (LMA) has served as the project
manager from 2008-2011, with the LMCD contributing financially and utilizing the AIS Task Force as
the technical committee, per the approved LVMP.
A task was established for this goal in 2011. In particular, to “Evaluate the three bay treatment project
with the goals and objectives established in the 2008 LVMP.” A detailed Report from the AIS Task
Force, with recommendations as to expansion to other bays and funding options, is the deliverable to
the LMCD Board. Representatives on this Task Force include appointed LMCD Board members
(Kelsey Page and Jeff Morris), Hennepin County Environmental Services (Hennepin County), Lake
Minnetonka Association (LMA), Minnehaha Creek Watershed District (MCWD), Minnesota
Department of Natural Resources (MN DNR), Three Rivers Park District (TRPD), Lisa Whalen
(former LMCD Board member), Dick Woodruff (former LMCD Board member), Gabriel Jabbour
(Tonka Bay Marina), and Jay Green (Anglers For Habitat).
ASSESSMENT OF LVMP GOALS AND OBJECTIVES
A number of goals and objectives were established in the LVMP for the management of aquatic plants
on Lake Minnetonka. A summary of these goals and objectives, including an assessment of the
herbicide treatments conducted, are detailed below within this Report.
Goal A- EWM and other invasive plants, such as CLP, will be controlled throughout the
respective bays in manner that is safe and effective to reduce interference with recreational
activities, reduce lakeshore clean-up, and improve ecological health.
Objective A-1. EWM will be controlled to levels of 20% occurrence (littoral zone) during the
year of treatment (year 1) and maintained to frequencies below 20% in subsequent years (years
2-5). CLP levels will be evaluated in the early season of year 2, then controlled to levels of 20%

Page 3 of 6
occurrence (littoral zone) during the year of treatment (year 1) and maintained to frequencies
below in subsequent years (years 2-5). A metric relating to the density or matting coverage of
EWM will be developed during year 1 and EWM will be controlled to less than that benchmark
in years 2-5.
A great deal has been learned on this objective, which is summarized as follows:
An initial assumption was that bay-wide treatments would take place in the first three years (2008-
2010), with spot treatments planned on an as-needed basis in the final two years (2011-2012). This
assumption has not held true. Whole bay treatments were required in 2011 in Carmans and Phelps
Bays to reduce EWM occurrence to target levels.
LMA representatives and lakeshore residents on the treatment bays report reduced interference with
recreational activities and reduced lakeshore cleanup. The overall goal of controlling EWM and
CLP in a safe and efficient manner to reduce these nuisance conditions appears to have been
accomplished.
Measuring the ecological health of the treatments bays proved extremely difficult. No conclusions
regarding this aspect of the goal can be made.
The objective of developing a measurement metric relating to density or matting coverage of EWM
proved difficult and expensive and was dropped from the program after year one.
Spot treatments in 2010 did not reduce the frequency of EWM in either Grays or Phelps Bays. The
desired control objectives were achieved only in the years of whole bay treatments in 2009 (Grays
and Phelps Bays) and 2011 (Carmans Bay).
EWM frequency of occurrence typically increased within one year of partial or no treatment. It
appears that bay-wide treatments will be needed on a reoccurring basis (approximately every two
years) in order to achieve the 20% frequency control objective.
Despite EWM frequencies above 45% in Grays Bay and Phelps Bay in 2010, whole bay treatments
were not performed. The observed high occurrence frequency of EWM did not cause a reported
increase in nuisance conditions, thus, the treatment objectives were modified.
The herbicide treatment protocols have changed each year, in consultation with the technical
committee. These changes have factored in: 1) the amount of herbicide to which the plants are
exposed, and 2) the timing of the exposure. In 2008 and 2010, early season treatment of EWM and
CLP was done through a combination of triclopyr and endothall. These treatments were not very
effective for EWM control but appeared to be successfully control CLP. In 2009 and 2011, late
season treatment of EWM was done utilizing triclopyr. These treatments were much more
effective; although there was some damage to native species (see Goal B below for further details
below).
EWM frequencies (early season/late season) for 2007 through 2011 were as follows:
Bays 2007 2008 2009 2010 2011
Carmans 58/60 59/72 --/77 74/77 60/4
Grays 86/86 50/54 37/1 45/57 (*) 56/90
Phelps 65/67 60/69 29/20 50/51 (*) 41/24
Note: Yellow colored cells represent early season treatments and green colored cells represent
late season treatments. Asterisk represent spot treatments.

Page 4 of 6
CLP frequencies (early season/late season) for 2007 through 2011 were as follows:
Bays 2007 2008 2009 2010 2011
Carmans 28/4 4/0 --/0 3/0 21/0
Grays 20/3 5/0 23/1 0/0 0/0
Phelps 36/5 1/7 40/3 0/0 24/1
Objective A-2. The water clarity in the bays will not be diminished as a result of the treatments.
This objective has been complied with. Data collected by the MCWD confirm that no declines in water
quality in the treatment bays occurred during the four years of the project.
Objective A-3. An annual assessment of user perceptions with respects to treatments’ impacts on
reducing interference with recreational activities and a reduction in lakeshore cleanup chores will
be conducted to provide an additional basis for evaluating treatment effects.
In 2008, the LMA polled all bay residents on the treated bays via e-mail. Questions that feedback was
received on, which were coordinated through the technical committee, included:
1. Did EWM interfere with recreation?
2. Were there improvements in your lakeshore clean up chores?
3. What was the overall effectiveness of the treatments?
The total number of responses to this survey, 17, was low so little weight can be given to these
responses. However, some anecdotal feedback has been received from bay residents that they have
been pleased with the outcome of the treatments, which cannot be substantiated. A similar survey was
not conducted in 2009-2011.
Goal B- Native submersed plants should be protected, except in localized areas where they
pose a nuisance (see Goal C), although control will be allowed in localized areas where native
plants inhibit access to open water or prohibit recreation (see Goal C).
Objective B-1. The overall native submersed plants, as measured by the mean number of native
plants per point (littoral zone), will be maintained or allowed to increase. The biomass of native
submersed plants will be measured from 35 random sites (per bay) in year 1, and that will be
used as a benchmark such that native submersed plant biomass will be maintained at or above
that level in years 2-5.
A great deal has been learned on this objective, which is summarized as follows:
The measurement of native plant biomass was not completed for any treatment years. The expense
and time demands of biomass sampling were the main impediments to the completion of this
objective.
Biomass assessments would be valuable because of the discrepancy between the reported %
frequency data and anecdotal reports of treatment effectiveness. For example, although the %
frequency in Grays Bay increased to 90 in the fall of 2011, LMA representatives reported that

Page 5 of 6
residents experienced a significant reduction in nuisance conditions. Likewise, the % of frequency
data suggest minimal impact on native plants by 2011, but lake users reported significant loss of lily
pads and other native plants in the treatment bays.
There was a decrease in the mean number of native species per point in 2008 and 2009 relative to
2007 (the pre-treatment year). Decreases in the number of native plants per sample point tended to
occur following whole bay late season treatments. The native plant population appeared to recover
by 2011. The MN DNR has accepted this temporary decrease as an acceptable level of risk.
Objective B-1 was modified to indicate the critical objective is to maintain the native plant
population over multiple years, not necessarily in the year of the treatment.
The mean number of submersed native plants per littoral sampling point are summarized below:
Bays 2007 2008 2009 2010 2011
Carmans 1.6/1.6 1.2/1.8 --/1.7 2.0/2.1 1.7/1.9
Grays 2.9/2.9 2.4/2.7 2.3/2.3 2.8/2.8 1.8/3.2
Phelps 2.2/2.4 1.8/2.3 2.0/2.1 2.2/2.5 2.0/2.5
Goal C- Provide limited individual nuisance or access control when bay-wide selective control
applications are performed.
Objective C-1. Any subsequent chemical treatments within the same season shall be subject to
inspection and shall be granted no more than 50 shoreline feet, or half their lake frontage
whichever is less, by 50 feet lakeward plus a 15 foot channel to open water. Off shore treatment
of native submersed plants shall not be permitted. Should native submersed plants rebound to a
large extent causing recreational nuisance, this limitation will be revisited. These treatments for
submersed plants other than CLP or EWM shall require a separate permit and shall require
annual signatures for such treatment. No permit fee will be assessed to those already having paid
a permit fee for early season control of non-native submersed plants.
This objective has been complied with.
Goal D- This plan will be considered as a framework for possible expansion in the future to
other bays in Lake Minnetonka
Objective D-1. This LVMP will be expanded to other bays in Lake Minnetonka, depending on a
number of factors, included, but not limited to: a) the outcomes of the control and protection
actions in the three bays (this plan), b) interest or demand from other bays, c) a significant
change in the EWM or CLP situation elsewhere in Lake Minnetonka, and d) availability of
financial resources.
After the treatments occurred in 2009, a request was made to expand the herbicide treatments to Gideon
and St. Albans Bays. The Task Force recommendations were: 1) this was a three-bay project, for five
years, and 2) that expansion would be premature due to the necessary scientific analysis to measure the
goals outlined in the LVMP for remaining three years of this project. However, the Task Force stated
that the LMA (or some other group) could propose a stand alone program and submit a permit
Page 6 of 6
application(s) to the MN DNR. The MN DNR would then make a decision on whether to approve (or
deny) the application(s). The LMCD Board concurred with this recommendation.
Subsequent applications were submitted by Gideon and St. Albans Bay residents, in partnership with
the LMA, and approved by the MN DNR prior to herbicide treatments on these bays in 2011. These
treatments are stand alone programs and are not being assessed in this Report.
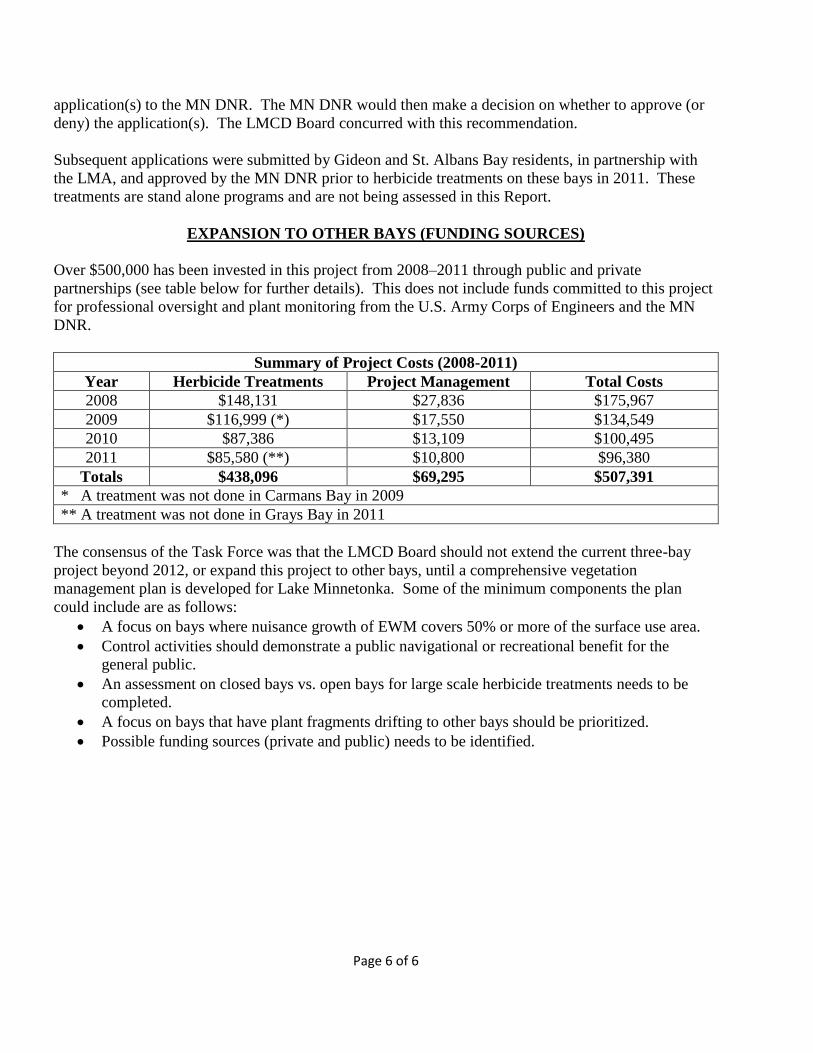
EXPANSION TO OTHER BAYS (FUNDING SOURCES)
Over $500,000 has been invested in this project from 2008–2011 through public and private
partnerships (see table below for further details). This does not include funds committed to this project
for professional oversight and plant monitoring from the U.S. Army Corps of Engineers and the MN
DNR.
Summary of Project Costs (2008-2011)
Year Herbicide Treatments Project Management Total Costs
2008 $148,131 $27,836 $175,967
2009 $116,999 (*) $17,550 $134,549
2010 $87,386 $13,109 $100,495
2011 $85,580 (**) $10,800 $96,380
Totals $438,096 $69,295 $507,391
* A treatment was not done in Carmans Bay in 2009
** A treatment was not done in Grays Bay in 2011
The consensus of the Task Force was that the LMCD Board should not extend the current three-bay
project beyond 2012, or expand this project to other bays, until a comprehensive vegetation
management plan is developed for Lake Minnetonka. Some of the minimum components the plan
could include are as follows:
A focus on bays where nuisance growth of EWM covers 50% or more of the surface use area.
Control activities should demonstrate a public navigational or recreational benefit for the
general public.
An assessment on closed bays vs. open bays for large scale herbicide treatments needs to be
completed.
A focus on bays that have plant fragments drifting to other bays should be prioritized.
Possible funding sources (private and public) needs to be identified.

13
Appendix C
Table 1- MN DNR Comparison of
Mechanical Harvesting vs. Herbicides

Comparison of Mechanical Harvesting vs. Herbicides
(Prepared by MN DNR)
Mechanical Harvesting Herbicides
Effectiveness of Control
Reliability [difficulty in obtaining
consistent results in different
lakes (Potential failure of
treatments)]
Never fails [to remove plants] Can fail
Time to relief Immediate 7 to 14 days
Vegetation is collected and
removed from the lake
Yes
(Nutrients in plants are removed
from lake)
No
(Nutrients in plants are NOT
removed from lake)
Duration of control (and need for
multiple treatments)
Shorter? Longer?
Creation of channels Good Not so good
Control of plants over a large area Not so good Good
Additional Considerations
Cost Often higher Often lower
Percentage of cost attributable to
labor
high low
Capital investment high None [for customer]
Duration of work Continues over the season One or a few days
Variability in cost higher lower
Disposal of harvested plants Can be difficult to find a place
where plants can be delivered
Not applicable (plants decompose
in lake)
Potential spread within a lake Should not be employed on lakes
where the distribution of milfoil
is limited
Can be employed on lakes where
the distribution of milfoil is
limited
Effects on non-target organisms or lake ecosystem
Removes invertebrates, fish,
frogs, snakes, turtles, etc
Yes No
When target plant is an exotic,
removal or destruction of native
vegetation
Yes Yes or no, depending on
particular herbicide used
Increased fragmentation More Less
Disturbs sediment and causes
suspension of sediment in the
water column, which in turn may
reduce water clarity
Often does, likely to a greater
extent
May do so, likely to a lesser
extent
Potential negative effects of
introducing chemicals into the
aquatic environment
No
(except hydraulic fluid and oil
from breaks in lines)
Yes
Restrictions on use of water after
treatment
No In some cases
Selectivity Limited or none Some are, some are not
Minnesota Regulations (M.R. 6280)
Small area can be treated without
a permit to control milfoil or
other submersed aquatic plants
Yes No
(Always requires a permit from
the DNR)
Limit on the amount of area that
may be treated
50% of the littoral zone 15% of the littoral zone

14
Appendix D
Table 2- Lake Minnetonka Invasive Plant
Information

Appendix D
Table 2 was developed as follows:
Individual lake segments or bays were derived from the LMCD ‘Index of Lake Minnetonka Areas’
– some areas have been combined.
Total (surface) Areas were taken from the LMCD’s Management Plan (Table 2-1).
Historic Problem is a category intended to indicate where EWM or CLP have historically been
problematic in the respective areas. Problems are ranked as:
o Yes – EWM is problematic and/or has been controlled throughout most of the area.
o No - EWM is not problematic. Some areas have not had control due to physical constraints
(eg. Bridges) for the harvesters.
o Limited – Indicates EWM is only problematic or requires control in limited areas.
Shore Length (Miles and Feet) - were taken from the LMCD’s Management Plan (Table 2-1).
Littoral Acres – was taken from the LMCD’s ‘Allowable Harvest Area,’ which is an attachment to
their harvesting permit from the MN DNR (see clarification of ‘littoral’ below).
Potential Problem Areas – is identical to Littoral Acres except here it is divided into Public and
Private Acres (see clarification of ‘problem’ and ‘private’ below):
o Private Acres is the Shore Length multiplied by 100-feet (and converted to acres).
o Public Acres is Littoral Acres minus Private Acres.
Total Problem Acres (percentage of the area) – is the Littoral Area as a percentage of the Total
Acres.

Area # Management Area Total Area Historic Problem Littoral Area (% of Mgmt. Area)
(Acres) (Yes, No, Limited) (miles) (feet) TOTAL Public Private TOTAL Public Private
1 Halsted Bay 545 No 7.3 38,544 322 234 88 59 43 16
2 Priests Bay 144 Yes 2.1 11,088 76 51 25 53 35 18
3 Cooks Bay 343 Yes 2.2 11,616 131 104 27 38 30 8
4 W. Upper Lake 873 Yes 4.6 24,288 193 137 56 22 16 6
5 S. Upper Lake 722 Yes 6.6 34,848 320 240 80 44 33 11
6 Smithtown Bay 110 Yes 1.2 6,336 33 18 15 30 17 13
7 Phelps Bay 345 Yes 3.7 19,536 272 227 45 79 66 13
8 & 10 E. Upper Lake/Old Channel Bay 920 Yes 4.9 25,872 261 202 59 28 22 6
9 Carmans Bay 294 Yes 3.9 20,592 187 140 47 64 48 16
11 Spring Park Bay 378 Yes 2.6 13,728 141 109 32 37 29 8
12 Black Lake 76 Yes 3.2 16,896 64 25 39 84 33 51
13 Emerald Lake 13 Yes 1.0 5,280 15 3 12 115 22 93
14 Seton Lake 44 Yes 2.2 11,616 41 14 27 93 33 61
15 Harrisons Bay 215 Limited 3.5 18,480 183 141 42 85 65 20
16 Jennings Bay 290 No 3.5 18,480 174 132 42 60 45 15
17 & 19 West Arm Bay & Coffee Cove 571 Limited 5.7 30,096 383 314 69 67 55 12
18 Forest Lake 82 No 1.8 9,504 49 27 22 60 33 27
20 & 21 Crystal Bay (East & West) 812 Yes 6.7 35,376 285 204 81 35 25 10
22 North Arm Bay 319 Yes 4.7 24,816 186 129 57 58 40 18
23 Stubbs Bay 195 No 2.5 13,200 104 74 30 53 38 16
24 Maxwell Bay 300 Yes 3.7 19,536 174 129 45 58 43 15
25 Lafayette Bay 454 Yes 3.8 20,064 195 149 46 43 33 10
26 Smiths Bay 266 Yes 1.9 10,032 244 221 23 92 83 9
27 Tanager Lake 51 No 1.1 5,808 50 37 13 98 72 26
28 Browns Bay 696 Yes 3.5 18,480 209 167 42 30 24 6
29 Wayzata Bay 778 Yes 5.5 29,040 198 131 67 25 17 9
30 Grays Bay 180 Yes 3.2 16,896 127 88 39 71 49 22
31 Libbs Lake 17 Yes 1.1 5,808 23 10 13 135 57 78
32 Robinsons Bay 92 Yes 3.5 18,480 27 (15) 42 29 (17) 46
33 St. Louis Bay 20 Yes 0.6 3,168 20 13 7 100 64 36
34 Carsons Bay 116 Yes 2.7 14,256 88 55 33 76 48 28
35 St. Albans Bay 161 Yes 2.9 15,312 102 67 35 63 42 22
36 Excelsior Bay 90 Yes 1.2 6,336 79 64 15 88 72 16
37 Gideons Bay 330 Yes 4.4 23,232 150 97 53 45 29 16
38, 39, 40, 41 Echo Bay, Lower Lake S., Big Island Passage, & Veterans Bay 1,111 Yes 6.8 35,904 310 228 82 28 20 7
42 Lower Lake N. 2,090 No 5.5 29,040 450 383 67 22 18 3
TOTALS 14043 125.3 661,584 5,866 4,347 1,519
Shore Length Littoral Area (acres)
15
Appendix E
Whole Bay or Large Scale Herbicide
Treatment Matrix

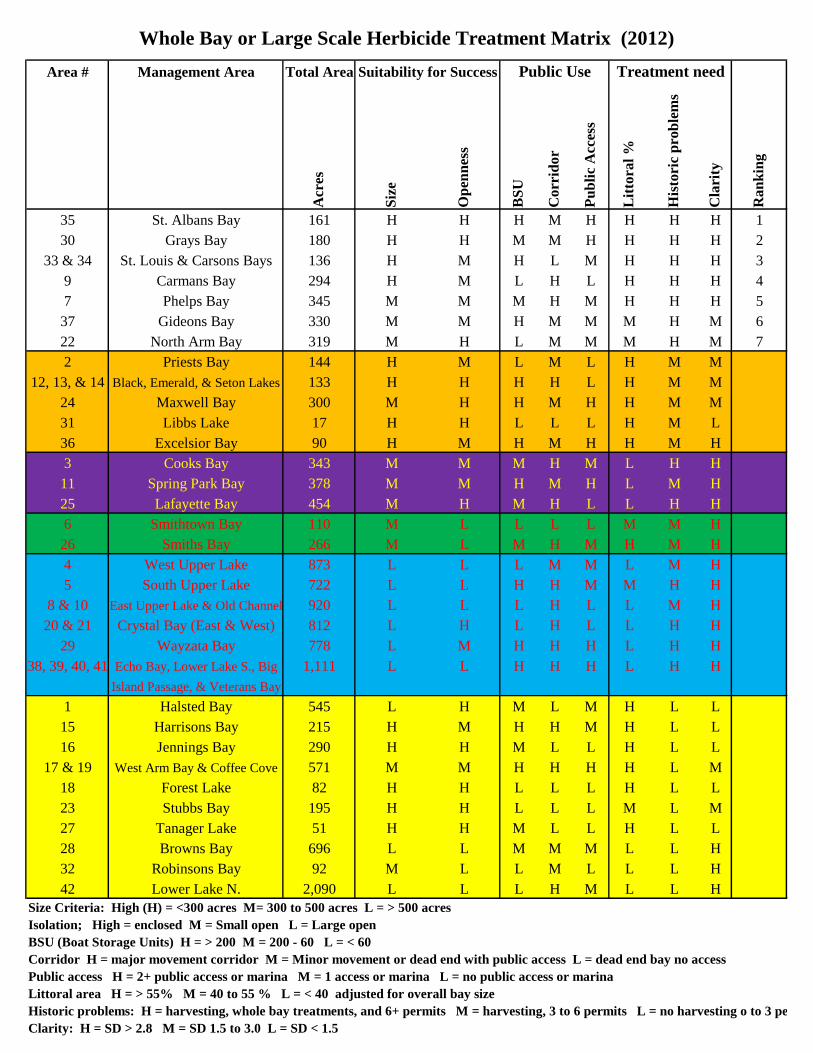
Appendix E
This Plan has prepared a decision matrix to identify which management areas could be candidates for
whole bay or large scale herbicide treatments. All of the management areas were ranked using criteria
that summarizes key features on a management area basis. This information was further refined into a
decision matrix that took into account the three criteria. These included: 1) suitability for success
(considers the size of the management area and whether it was an open area), 2) public use (considers
the number of Boat Storage Units (BSUs) on the management area, whether it is a public corridor, and
whether it has a public access), and 3) treatment need (considers littoral zone percentage, whether there
have been historic problems, and water clarity).
Eight management areas have been ranked as suitable candidates for whole bay or large scale herbicide
treatments. These included: 1) St. Albans Bay, 2) Grays Bay, 3) St. Louis and Carsons Bays, 4)
Carmans Bay, 5) Phelps Bay, 6) Gideon Bay, and 7) North Arm Bay. A series of autoranking certain
criteria were conducted by the sub-committee to reduce the number of management areas from 42 to
eight. This included:
Assigning a low Priority to management areas that have had minimal amount of historic EWM
problems (highlighted in “yellow” on the decision matrix).
Assigning a low priority to management areas that were greater than 500 acres in size
(highlighted in “blue” on the decision matrix).
Assigning a low priority to management areas that were large and open (highlighted in “green”
on the decision matrix).
Assigning low priority to management areas that had a littoral percentage of less than 40%
based on overall area size (highlighted in “purple” on the decision matrix).
Assigning low priority to management areas that had a “Moderate” amount of historic EWM
problems (highlighted in “tan” on the decision matrix).
Although only eight management areas are currently considered suitable candidates for whole bay or
large scale herbicide treatments, the plan recognizes that additional management areas may be added to
the list if conditions change. In the event that problematic EWM growth occurs in management areas
that historically have not had nuisance conditions, these areas would be considered for treatment.
Likewise, as the water quality in bays such as Jennings and Halsteds improves, the potential for
nuisance EWM growth will increase. These bays could then be considered for herbicide treatment.
Area # Management Area Total Area
Acr
es
Siz
e
Op
enn
ess
BS
U
Co
rrid
or
Pu
bli
c A
cces
s
Lit
tora
l %
His
tori
c p
rob
lem
s
Cla
rity
Ra
nk
ing
35 St. Albans Bay 161 H H H M H H H H 1
30 Grays Bay 180 H H M M H H H H 2
33 & 34 St. Louis & Carsons Bays 136 H M H L M H H H 3
9 Carmans Bay 294 H M L H L H H H 4
7 Phelps Bay 345 M M M H M H H H 5
37 Gideons Bay 330 M M H M M M H M 6
22 North Arm Bay 319 M H L M M M H M 7
2 Priests Bay 144 H M L M L H M M
12, 13, & 14 Black, Emerald, & Seton Lakes 133 H H H H L H M M
24 Maxwell Bay 300 M H H M H H M M
31 Libbs Lake 17 H H L L L H M L
36 Excelsior Bay 90 H M H M H H M H
3 Cooks Bay 343 M M M H M L H H
11 Spring Park Bay 378 M M H M H L M H
25 Lafayette Bay 454 M H M H L L H H
6 Smithtown Bay 110 M L L L L M M H
26 Smiths Bay 266 M L M H M H M H
4 West Upper Lake 873 L L L M M L M H
5 South Upper Lake 722 L L H H M M H H
8 & 10 East Upper Lake & Old Channel 920 L L L H L L M H
20 & 21 Crystal Bay (East & West) 812 L H L H L L H H
29 Wayzata Bay 778 L M H H H L H H
38, 39, 40, 41 Echo Bay, Lower Lake S., Big 1,111 L L H H H L H H
Island Passage, & Veterans Bay
1 Halsted Bay 545 L H M L M H L L
15 Harrisons Bay 215 H M H H M H L L
16 Jennings Bay 290 H H M L L H L L
17 & 19 West Arm Bay & Coffee Cove 571 M M H H H H L M
18 Forest Lake 82 H H L L L H L L
23 Stubbs Bay 195 H H L L L M L M
27 Tanager Lake 51 H H M L L H L L
28 Browns Bay 696 L L M M M L L H
32 Robinsons Bay 92 M L L M L L L H
42 Lower Lake N. 2,090 L L L H M L L H
Size Criteria: High (H) = <300 acres M= 300 to 500 acres L = > 500 acres
Isolation; High = enclosed M = Small open L = Large open
BSU (Boat Storage Units) H = > 200 M = 200 - 60 L = < 60
Corridor H = major movement corridor M = Minor movement or dead end with public access L = dead end bay no access
Public access H = 2+ public access or marina M = 1 access or marina L = no public access or marina
Littoral area H = > 55% M = 40 to 55 % L = < 40 adjusted for overall bay size
Historic problems: H = harvesting, whole bay treatments, and 6+ permits M = harvesting, 3 to 6 permits L = no harvesting o to 3 permits
Clarity: H = SD > 2.8 M = SD 1.5 to 3.0 L = SD < 1.5
Suitability for Success Public Use Treatment need
Whole Bay or Large Scale Herbicide Treatment Matrix (2012)

16
Appendix F
Table 3- Lake Minnetonka Key Features

Area # Management
Area
Licensed Multiple Dock Licenses Public Launch Ramps Quiet Water
Areas
MN DNR Permits Average Secchi
Depths
Other
1 1. Cardinal Cove Beach Assoc. (5 BSUs) None 2009 (6 permits for 26 properties) 2009- 1.06 meters
2. Eagle Bluff Assoc. (6 BSUs) 2010 (6 permits for 21 properties) 2010- 0.98 meters
3. Halstead Acres Improvement Assoc. (8 BSUs) 2011 (11 permits for 25 properties) 2011- 1.07 meters
4. Trillium Bay HOA (17 BSUs)
5. Woodland Cove (117 BSUs)
Sub-Total: 153 BSUs
2 None None 2009 (4 permits for 21 properties) 2009- 1.95 meters
2010 (6 permits for 19 properties) 2010- 2.09 meters
Sub-Total: 30 BSUs 2011 (6 permits for 19 properties) 2011- 1.42 meters
3 1. Al & Alma's (26 BSUs) None 2009 (15 permits for 31 properties) 2009- 2.28 meters
2. Chapman Place Marina (27 BSUs) 2010 (11 permits for 23 properties) 2010- 2.84 meters
3. City of Mound- Lost Lake (61 BSUs) 2011 (11 permits for 21 properties) 2011- 1.79 meters 2. 24 transient BSUs on Lost Lake
4. City of Mound Commons Docking Program (# of
boats have historically been approx. 53)
3. Parking restrictions at Mound public access (Sat.,
Sun. and Holidays)
Sub-Total: 167 BSUs
4 None 2009 (8 permits for 14 properties) 2009- 2.71 meters
2010 (8 permits for 12 properties) 2010- 3.25 meters
2. Lake Minnetonka Regional Park (20 BSUs) 2011 (10 permits for 13 properties) 2011- 1.94 meters
3. Loring Acres Beach Assoc. (8 BSUs)
4. Maple Forest Association (8 BSUs)
5. Woodend Shores Beach Assoc. (23 BSUs)
Sub-Total: 63 BSUs
5 1. Baycliffe POA (15 BSUs) None None 2009 (9 permits for 20 properties)
2. Bayshore III HOA (8 BSUs) 2010 (6 permits for 19 properties)
3. Boulder Bridge HOA (40 BSUs) 2011 (5 permits for 18 properties)
4. Crane Island Assoc. (36 BSUs)
5. Howards Point Marina (96 BSUs)
6. Palmer Point HOA (6 BSUs)
7. A.F. Rossberg (6 BSUs)
8. ULMYC (30 BSUs)
Sub-Total: 237 BSUs
6 1. Harborage HOA (9 BSUs) None None 2009 (5 permits for 9 properties) 2009- 2.77 meters
2. Smithtown Bay Assoc. (17 BSUs) 2010 (5 permits for 11 properties) 2010- 3.62 meters
Sub-Total: 26 BSUs 2011 (4 permits for 9 properties) 2011- 2.04 meters
7 None 2009 (6 permits for 75 properties) 2009- 2.67 meters
2010 (7 permits for 94 properties) 2010- 3.09 meters
Sub-Total: 123 BSUs 2011 (10 permits for 54 properties) 2011- 2.13 meters
1. Clay Cliffe HOA (9 BSUs) None None 2009 (4 permits for 13 properties)
2010 (3 permits for 11 properties)
Sub-Total: 9 BSUs 2011 (2 permits for 10 properties)
9 1. Pheasant Lawn HOA (10 BSUs) None None 2009 (15 permits for 141 properties) 2009- 3.09 meters
2. Walters Port Assoc. (5 BSUs) 2010 (6 permits for 132 properties) 2010- 3.57 meters
Sub-Total: 15 BSUs 2011 (6 permits for 153 properties) 2011- 2.22 meters
1. The breakdown of the BSUs at Al & Alma's
includes: 1) 20 transient BSUs, and 2) 6 overnight
storage BSUs for LMCD licensed charter boats
2. Woodend Shores Beach Assoc. has a private
access (presumably for its residents)
1. The 20 BSUs at the Lake Minnetonka Regional
Park are transient
Lake Minnetonka Conservation District (LMCD)
Aquatic Invasive Species (AIS) Sub-Committee
Lake Minnetonka Key Features
8 & 10
1. City of Mound (estimated 29 c/t
spaces in and outside of the lot.
1. Lake Minnetonka Regional Park
(59 c/t spaces)
1. City of Minnetrista- Tuxedo Blvd.
(4 c/t spaces, no on-street parking)
Smithtown Bay
Phelps Bay
East Upper
Lake and Old
Channel Bay
1. City of Mound Commons Docking Program (# of
boats have historically been approximately 30)
1. City of Mound Commons Docking Program (# of
boats have historically been approx. 4)
On-lake facilities provided at Howards Point Marina
are detailed on the current Hennepin County map
1. City of Mound Commons Docking Program (# of
boats have historically been approximately 123)
1. City of Minnetrista- Halstead Drive
(40 c/t spaces)
Carmans Bay
Halsted Bay
Priests Bay
Cooks Bay
West Upper
Lake
South Upper
Lake

Area # Management
Area
Licensed Multiple Dock Licenses Public Launch Ramps Quiet Water
Areas
MN DNR Permits Average Secchi
Depths
Other
Lake Minnetonka Conservation District (LMCD)
Aquatic Invasive Species (AIS) Sub-Committee
Lake Minnetonka Key Features
1. City of Minnetrista- Halstead Drive
(40 c/t spaces)
Halsted Bay11 1. Bayview Apts. (26 BSUs) None 2009 (4 permits for 7 properties) 2009- 2.90 meters
2. Hennepin County (65 BSUs) 2010 (4 permits for 7 properties) 2010- 3.22 meters
3. Lakewinds Assoc. (57 BSUs) 2011 (4 permits for 9 properties) 2011- 2.24 meters
4. Mtka Edgewater Apts. (16 BSUs)
5. Pelican Point HOA (40 BSUs)
6. RDP Partners (32 BSUs)
Sub-Total: 236 BSUs
12 None 2009 (6 permits for 16 properties) 2009- 2.05 meters
2010 (7 permits for 16 properties) 2010- 2.33 meters
2. Presbyterian Homes on Lake Mtka. (11 BSUs) 2011 (4 permits for 14 properties) 2011- 1.69 meters
Sub-Total: 81 BSUs
13 None Entire Bay 2009 (2 permits for 4 properties)
2010 (0 permits for 0 properties)
2. Seton Twin Homes (6 BSUs) 2011 (0 permits for 0 properties)
Sub-Total: 11 BSUs
14 None Entire Bay 2009 (1 permit for 1 property)
2010 (0 permits for 0 properties)
2. 5th Street Ventures (13 BSUs) 2011 (0 permits for 0 properties)
3. Park Island Apts. (50 BSUs)
4. Seton View Assoc. (8 BSUs)
Sub-Total: 104 BSUs
15 None 2009 (7 permits for 15 properties) 2009- 1.11 meters
2010 (6 permits for 10 properties) 2010- 1.22 meters
2. Driftwood Shores HOA (10 BSUs) 2011 (4 permits for 8 properties) 2011- 1.07 meters
3. Harrison Harbor Twinhome Assoc. (7 BSUs)
4. Minnetonka Boat Rentals (44 BSUs)
Sub-Total: 231 BSUs
16 None None 2009 (3 permits for 11 properties) 2009- 1.31 meters
2010 (6 permits for 11 properties) 2010- 1.11 meters
2. Jennings Cove DOA (20 BSUs) 2011 (5 permits for 10 properties) 2011- 1.06 meters
3. Maple Crest Estates (5 BSUs)
4. Ridegwood Cove DOA (7 BSUs)
5. Seahorse Condominiums (76 BSUs)
Sub-Total: 166 BSUs
17 & 19 None None 2009 (3 permits for 15 properties) 2009- 1.52 meters
2010 (6 permits for 17 properties) 2010- 1.37 meters
2. Lord Fletchers Apts. (32 BSUs) 2011 (3 permits for 14 properties) 2011- 1.31 meters
3. Lord Fletchers of the Lake (71 BSUs)
4. Rockvam Boatyards, Sites 1 & 2 (180 BSUs)
5. Seton Village (20 BSUs)
6. West Beach Apts. (5 BSUs)
Sub-Total: 313 BSUs
2. On-lake facilities provided at Mtka. Boat Rentals
are detailed on the current Hennepin County map
1. City of Mound Commons Docking (# of boats
have historically been approx. 58)
Seahorse Condominiums has a private launch ramp
(presumably for its residents)
2. All 71 BSUs at Lord Fletchers of the Lake are
transient
1. 2 of the 44 BSUs at Minnetonka Boat Rentals are
transient
1. City of Mound Commons Docking (# of boats
have historically been approx. 5)
1. Lord Fletchers Apts. has a private launch ramp
(presumably for its residents)
3. On-lake facilities provided at Rockvam Boatyards
are detailed on the current Hennepin County map
1. Hennepin County Public Access
(80+ c/t spaces in lot & at overflow
lot).
North portion of the
entire bay.
Small area leading
out of Seton
Channel.
West Arm Bay
& Coffee Cove
40 of the 65 Hennepin County BSUs are transient
1. City of Mound Commons Docking (# of boats have
historically been approx. 70)
Spring Park
Bay
Black Lake
Emerald Lake 1. City of Mound Commons Docking (# of boats have
historically been approx. 5)
1. City of Mound Commons Docking (# of boats have
historically been approx. 33)
1. City of Mound Commons Docking (# of boats have
historically been approx. 170)
Seton Lake
Harrisons Bay
Jennings Bay

Area # Management
Area
Licensed Multiple Dock Licenses Public Launch Ramps Quiet Water
Areas
MN DNR Permits Average Secchi
Depths
Other
Lake Minnetonka Conservation District (LMCD)
Aquatic Invasive Species (AIS) Sub-Committee
Lake Minnetonka Key Features
1. City of Minnetrista- Halstead Drive
(40 c/t spaces)
Halsted Bay18 1. Forest Arms Improvement Assoc. (14 BSUs) None None 2009 (0 permits for 0 properties) 2009- 0.87 meters
2. Rita Zebeck Residence (7 BSUs) 2010 (0 permits for 0 properties) 2010- 1.50 meters
Sub-Total: 21 BSUs 2011 (0 permits for 0 properties) 2011- 1.07 meters
20 & 21 1. Lafayette Club (24 BSUs) None None 2009 (13 permits for 29 properties) 2009- 3.04 meters The 24 BSUs at the Lafayette Club are transient
2. City of Minnetonka Beach (20 BSUs) 2010 (5 permtis for 15 properties) 2010- 3.34 meters
Sub-Total: 44 BSUs 2011 (6 permits for 15 properties) 2011- 1.77 meters
22 1. Victoria Estates HOA (6 BSUs) 2009 (12 permits for 41 properties) 2009- 2.02 meters
2010 (11 permits for 38 properties) 2010- 2.15 meters
Sub-Total: 6 BSUs 2011 (13 permits for 29 properties) 2011- 1.91 meters
23 1. Kevin Garnett Residence (8 BSUs) None None 2009 (4 permits for 9 properties) 2009- 1.32 meters
2. Dr. Glen Nelson Residence (8 BSUs) 2010 (3 permits for 7 properties) 2010- 1.41 meters
3. Jon Schwartzman Residence (8 BSUs) 2011 (1 permit for 8 properites) 2011- 1.32 meters
Sub-Total: 24 BSUs
24 1. North Shore Marina (162 BSUs) 2009 (4 permits for 17 properties) 2009- 1.93 meters
2. Wayzata Marine (77 BSUs) 2010 (6 permits for 28 properties) 2010- 1.93 meters
2011 (8 permits for 20 properties) 2011- 1.97 meters
Sub-Total: 239 BSUs
25 1. City of Minnetonka Beach (58 BSUs) None Huntington Point 2009 (7 permits for 30 properties) 2009- 3.33 meters
2. Lafayette Ridge HOA (16 BSUs) 2010 (6 permits for 28 properties) 2010- 3.36 meters
3. West Point Place HOA (8 BSUs) 2011 (3 permits for 24 properties) 2011- 2.38 meters
Sub-Total: 82 BSUs
26 1. Foxhill HOA (16 BSUs) None 2009 (1 permit for 2 properties)
2. North Shore Marina- Smiths Bay (79 BSUs) 2010 (2 permits for 2 properties)
Sub-Total: 95 BSUs 2011 (9 permits for 9 properties)
27 1. Browns Bay, LLC (40 BSUs) None 2009 (0 permits for 0 properties) 2009- 1.02 meters
2. North Shore Marina- Browns Bay (67 BSUs) 2010 (0 permits for 0 properties) 2010- 1.28 meters
Sub-Total: 107 BSUs 2011 (0 permits for 0 properties) 2011- 0.93 meters 2. On-lake facilities provided at North Shore Marina
are detailed on the current Hennepin County map
28 1. Browns Bay, LLC (58 BSUs) None None 2009 (6 permits for 11 properties)
2010 (6 permits for 10 properties)
2011 (6 permits for 11 properties)
Sub-Total: 105 BSUs
29 1. Groveland HOA (32 BSUs) 2009 (5 permits for 19 properties) 2009- 3.81 meters
2. Herzog Acres (15 BSUs) 2010 (9 permits for 23 properties) 2010- 3.88 meters
3. Taylor Residence (5 BSUs) 2011 (3 permits for 19 properties) 2011- 3.12 meters
4. City of Wayzata (116 BSUs)
5. WCSC & WYC (232 BSUs)
6. Wayzata Bay Mgmt. (80 BSUs)
Sub-Total: 480 BSUs
2. North Shore Marina- Browns Bay (47 BSUs, which
includes 1 for service)2. On-lake facilities provided at North Shore Marina
are detailed on the attached Hennepin County map
1. Cedar Point East
Channel
2. East side of bay
along County Road
101 Causeway.
1. On-lake facilities provided at North Shore Marina
are detailed on the current Hennepin County map
2. On-lake facilities provided at Wayzata Marine are
detailed on the current Hennepin County map
1. 16 of the City of Wayzata's 116 BSUs are
transient.
2. On-lake facilities provided at Wayzata Bay Mgmt.
are detailed on the current Hennepin County map
On-lake facilities provided at North Shore Marina are
detailed on the current Hennepin County map
1. On-lake facilities provided at Browns Bay, LLC
are detailed on the current Hennepin County map
1. On-lake facilities provided at Browns Bay, LLC
are detailed on the current Hennepin County map
South portion of the
entire bay &
Norenberg inlet.
West side of bay
near Arcola Bridge.
East side of bay near
commercial docks.
1. MN DNR Public Access (90 c/t
spaces in lot, on-street parking
prohibited).
1. City of Wayzata-Co. Rd. 16 Public
Access (24 on-street c/t spaces).
Forest Lake
West and East
Crystal Bay
North Arm Bay Small area near
Windjammer Point.
1. Hennepin County Public Access
(59 c/t spaces in lot, on-street parking
prohibited).
Stubbs Bay
Maxwell Bay
Lafayette Bay
Smiths Bay
Tanager Lake
Browns Bay
Wayzata Bay

Area # Management
Area
Licensed Multiple Dock Licenses Public Launch Ramps Quiet Water
Areas
MN DNR Permits Average Secchi
Depths
Other
Lake Minnetonka Conservation District (LMCD)
Aquatic Invasive Species (AIS) Sub-Committee
Lake Minnetonka Key Features
1. City of Minnetrista- Halstead Drive
(40 c/t spaces)
Halsted Bay30 1. Grays Landing HOA (10 BSUs) 2009 (6 permits for 76 properties) 2009- 2.34 meters
2. City of Minnetonka (30 BSUs) 2010 (6 permits for 80 properties) 2010- 2.58 meters
3. Locust Hills (44 BSUs) 2011 (3 permits for 25 properties) 2011- 3.39 meters
4. Meadowbrook Boat Club (4 BSUs)
Sub-Total: 88 BSUs
31 1. Libbs Lake Boat Club (16 BSUs) None Entire bay 2009 (0 permits for 0 properties)
2. Meadowbrook Boat Club (6 BSUs) 2010 (0 permits for 0 properties)
Sub-Total: 22 BSUs 2011 (0 permits for 0 properties)
32 1. Cedarhurst Assoc. (22 BSUs) None None 2009 (2 permits for 2 properties)
2010 (3 permits for 4 properties)
Sub-Total: 22 BSUs 2011 (3 permits for 4 properties)
33 1. City of Deephaven (168 BSUs) None Entire Bay 2009 (2 permits for 7 properties)
2. MYC- Sites 2 & 3 (126 BSUs) 2010 (3 permits for 7 properties)
3. Walden Tract X (6 BSUs) 2011 (3 permits for 9 properties) 2. 46 of the 126 MYC BSUs are transient
Sub-Total: 300 BSUs
34 1. Chimo HOA (16 BSUs) Entire Bay 2009 (9 permits for 59 properties) 2009- 3.36 meters
2. City of Deephaven (108 BSUs) 2010 (7 permits for 55 properties) 2010- 3.23 meters
3. Grandview Pont Assoc. (8 BSUs) 2011 (5 permits for 56 properties) 2011- 2.72 meters
4. Maple Hills HOA (9 BSUs)
5. T. Michael Miller Residence (6 BSUs)
6. MYC- Site 1 (56 BSUs)
Sub-Total: 203 BSUs
35 1. Beans Greenwood Marina (120 BSUs) None 2009 (13 permits for 29 properties) 2009- 3.46 meters
2. City of Greenwood (27 BSUs) 2010 (14 permits for 19 properties) 2010- 3.76 meters
3. Hary T Kreslins Residence (8 BSUs) 2011 (10 permits for 14 properties) 2011- 2.63 meters
4. St. Albans Bay Villas (19 BSUs)
5. Tonka Bay Sales- Site 2 (90 BSUs)
Sub-Total: 264 BSUs
36 1. Bayshore Manor Condos (20 BSUs) None Most of the Bay 2009 (3 permits for 7 properties)
2. Baview Event Center (37 BSUs) 2010 (5 permits for 7 properties)
3. City of Excelsior (140 BSUs) 2011 (3 permits for 3 properties)
4. Excelsior Bay Associates (49 BSUs)
5. Excelsior Bay Harbor (93 BSUs)
6. Maynards (40 BSUs)
Sub-Total: 379 BSUs
2. 20 of the 56 MYC BSUs are a District Moorning
Area
1. On-lake facilities provided at Beans Greenwood
Marina are detailed on the current Hennepin County
map
2. On-lake facilities provided at Tonka Bay Sales are
detailed on the current Hennepin County map
1. Of the 140 City of Excelsior BSUs, 16 are
transient and 12 are a District Mooring Area
2. On-lake facilities provided at Excelsior Bay
Harper are detailed on the current Hennepin County
map
St. Louis Bay
Carsons Bay
St. Albans Bay
Excelsior Bay
1. MN DNR Public Access (119 c/t
spaces).
1. 28 of the 168 City of Deephaven BSUs are a
District Mooring Area
1. 25 of the 108 City of Deephaven BSUs are a
District Mooring Area
Entire bay (holidays
& weekends from 4
p.m. on Fridays until
midnight on
Sundays).
West side of bay
near Excelsior Bay
channel.
Grays Bay
Libbs Lake
Robinsons Bay
1. City of Deephaven Public Access
(19 on-street & remote lot c/t spaces).
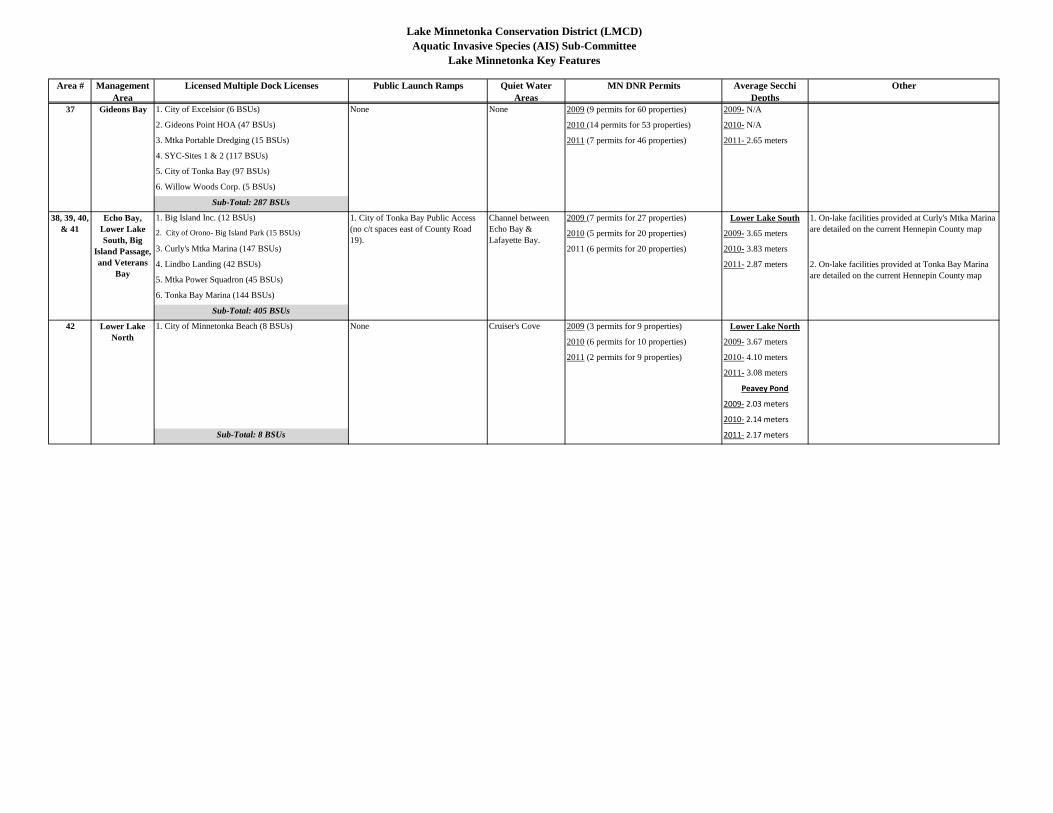
Area # Management
Area
Licensed Multiple Dock Licenses Public Launch Ramps Quiet Water
Areas
MN DNR Permits Average Secchi
Depths
Other
Lake Minnetonka Conservation District (LMCD)
Aquatic Invasive Species (AIS) Sub-Committee
Lake Minnetonka Key Features
1. City of Minnetrista- Halstead Drive
(40 c/t spaces)
Halsted Bay37 1. City of Excelsior (6 BSUs) None None 2009 (9 permits for 60 properties) 2009- N/A
2. Gideons Point HOA (47 BSUs) 2010 (14 permits for 53 properties) 2010- N/A
3. Mtka Portable Dredging (15 BSUs) 2011 (7 permits for 46 properties) 2011- 2.65 meters
4. SYC-Sites 1 & 2 (117 BSUs)
5. City of Tonka Bay (97 BSUs)
6. Willow Woods Corp. (5 BSUs)
Sub-Total: 287 BSUs
1. Big Island Inc. (12 BSUs) 2009 (7 permits for 27 properties) Lower Lake South
2. City of Orono- Big Island Park (15 BSUs) 2010 (5 permits for 20 properties) 2009- 3.65 meters
3. Curly's Mtka Marina (147 BSUs) 2011 (6 permits for 20 properties) 2010- 3.83 meters
4. Lindbo Landing (42 BSUs) 2011- 2.87 meters
5. Mtka Power Squadron (45 BSUs)
6. Tonka Bay Marina (144 BSUs)
Sub-Total: 405 BSUs
42 1. City of Minnetonka Beach (8 BSUs) None Cruiser's Cove 2009 (3 permits for 9 properties) Lower Lake North
2010 (6 permits for 10 properties) 2009- 3.67 meters
2011 (2 permits for 9 properties) 2010- 4.10 meters
2011- 3.08 meters
Peavey Pond
2009- 2.03 meters
2010- 2.14 meters
Sub-Total: 8 BSUs 2011- 2.17 meters
38, 39, 40,
& 41
Channel between
Echo Bay &
Lafayette Bay.
Gideons Bay
Echo Bay,
Lower Lake
South, Big
Island Passage,
and Veterans
Bay
1. On-lake facilities provided at Curly's Mtka Marina
are detailed on the current Hennepin County map
2. On-lake facilities provided at Tonka Bay Marina
are detailed on the current Hennepin County map
Lower Lake
North
1. City of Tonka Bay Public Access
(no c/t spaces east of County Road
19).