lake pepin watershed tmdl update - minnesota pollution ... · lake pepin watershed tmdl update...
TRANSCRIPT
Lake Pepin WatershedTMDL Update
December 18, 2007
Lake Pepin Photo by Guy Schmickle
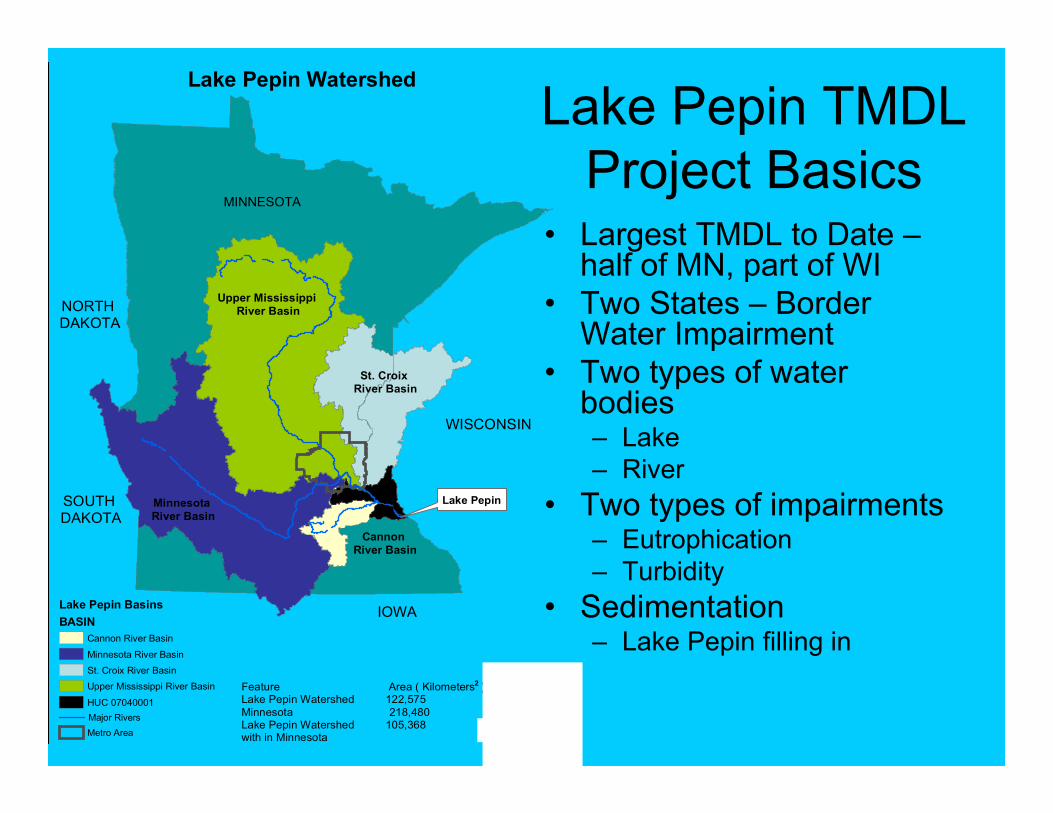
Lake Pepin TMDL Project Basics
• Largest TMDL to Date –half of MN, part of WI
• Two States – Border Water Impairment
• Two types of water bodies– Lake– River
• Two types of impairments– Eutrophication– Turbidity
• Sedimentation – Lake Pepin filling in
Minnesota River Basin
Upper Mississippi River Basin
St. Croix River Basin
Cannon River Basin
MINNESOTA
WISCONSIN
IOWA
NORTH DAKOTA
SOUTH DAKOTA
Lake Pepin
Lake Pepin BasinsBASIN
Cannon River Basin
Minnesota River BasinSt. Croix River BasinUpper Mississippi River Basin
HUC 07040001Major RiversMetro Area
Feature Area ( Kilometers )Lake Pepin Watershed 122,575 Minnesota 218,480Lake Pepin Watershed 105,368with in Minnesota
2
Lake Pepin Watershed
Minnesota PollutionControal Agency
MINNESOTA R.
ST C
RO
IX R
MISSISSIPPI R
MISS
ISSIP
PI R
MISSISSIPPI R
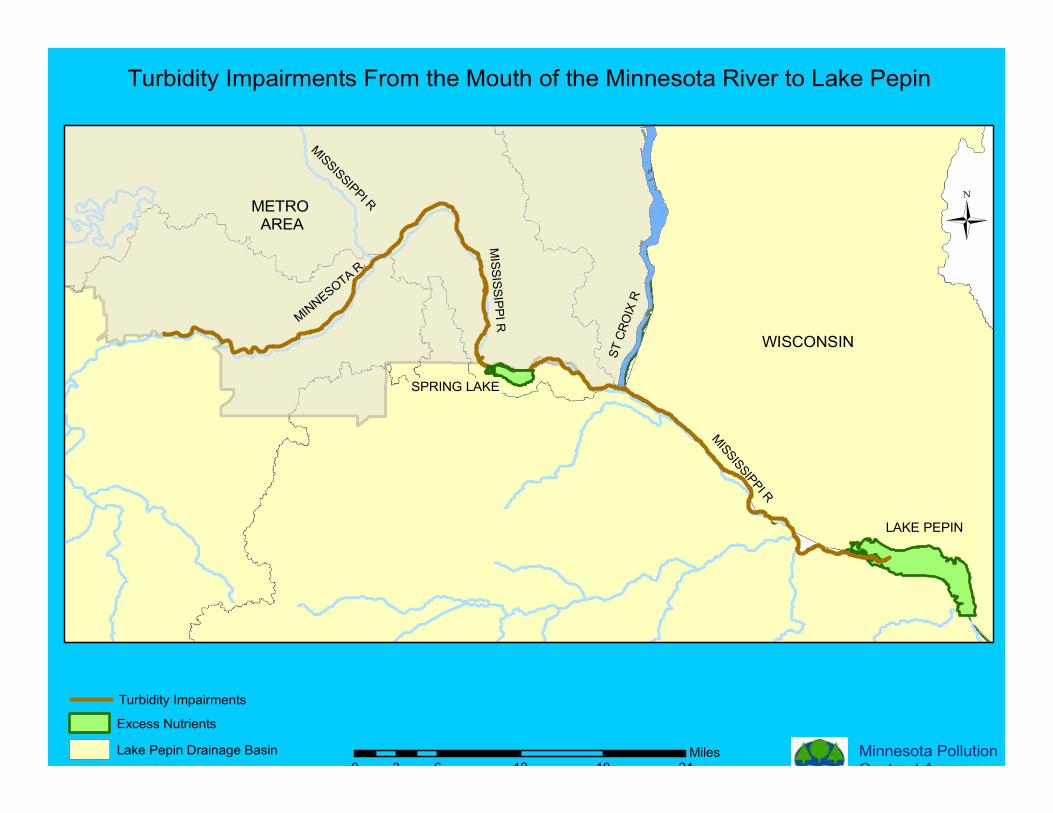
Turbidity Impairments From the Mouth of the Minnesota River to Lake Pepin
LAKE PEPIN
WISCONSIN
METRO AREA
Minnesota PollutionControal Agency0 6 12 18 243
Miles
Turbidity Impairments
Excess Nutrients
Lake Pepin Drainage Basin
SPRING LAKE
−
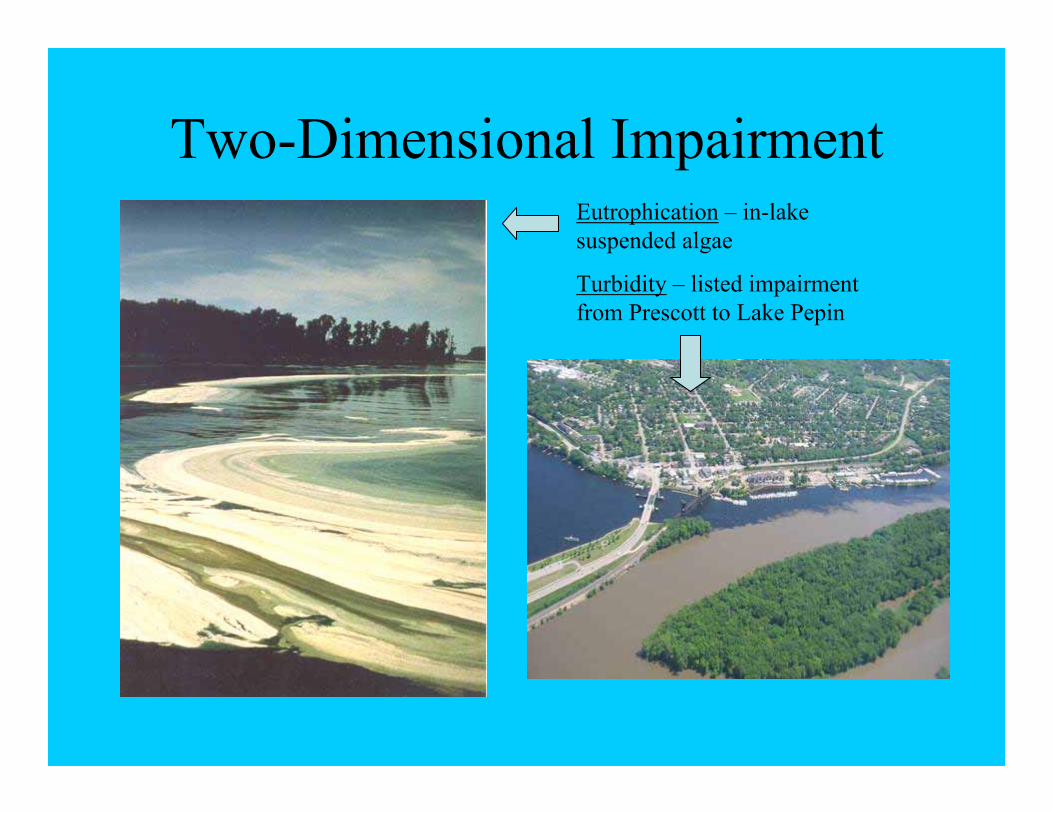
Two-Dimensional ImpairmentEutrophication – in-lake suspended algae
Turbidity – listed impairment from Prescott to Lake Pepin
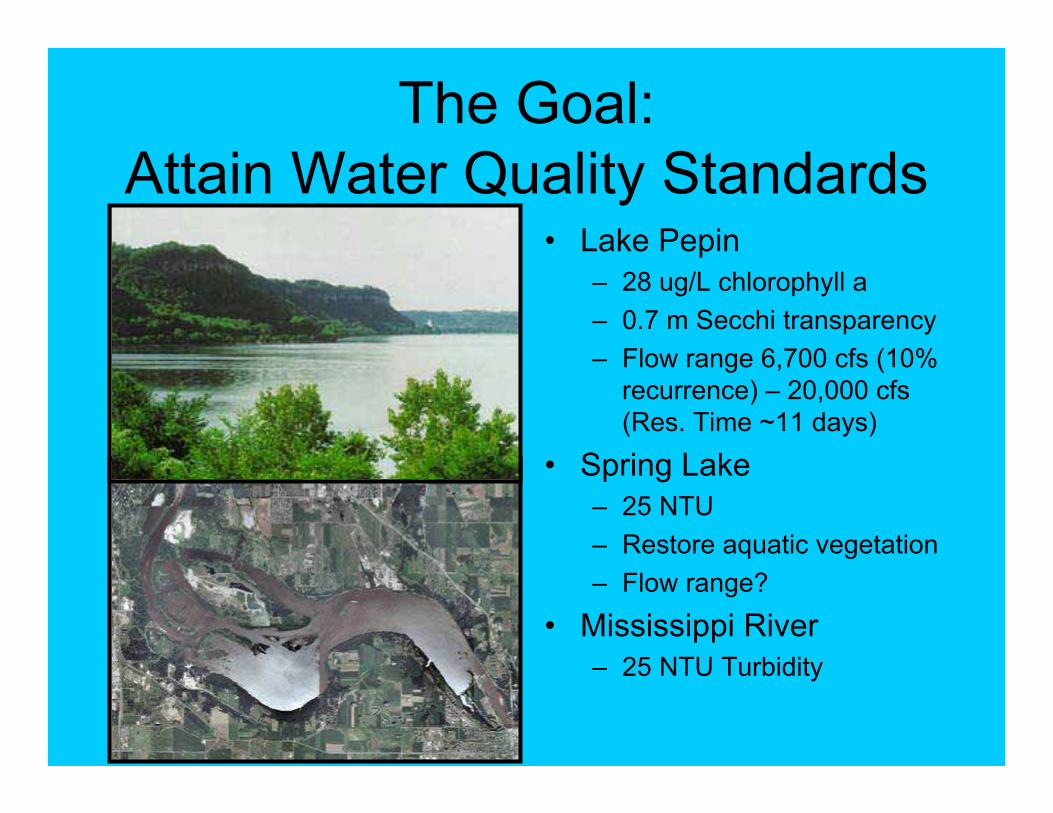
The Goal: Attain Water Quality Standards
• Lake Pepin– 28 ug/L chlorophyll a– 0.7 m Secchi transparency– Flow range 6,700 cfs (10%
recurrence) – 20,000 cfs(Res. Time ~11 days)
• Spring Lake – 25 NTU– Restore aquatic vegetation – Flow range?
• Mississippi River– 25 NTU Turbidity
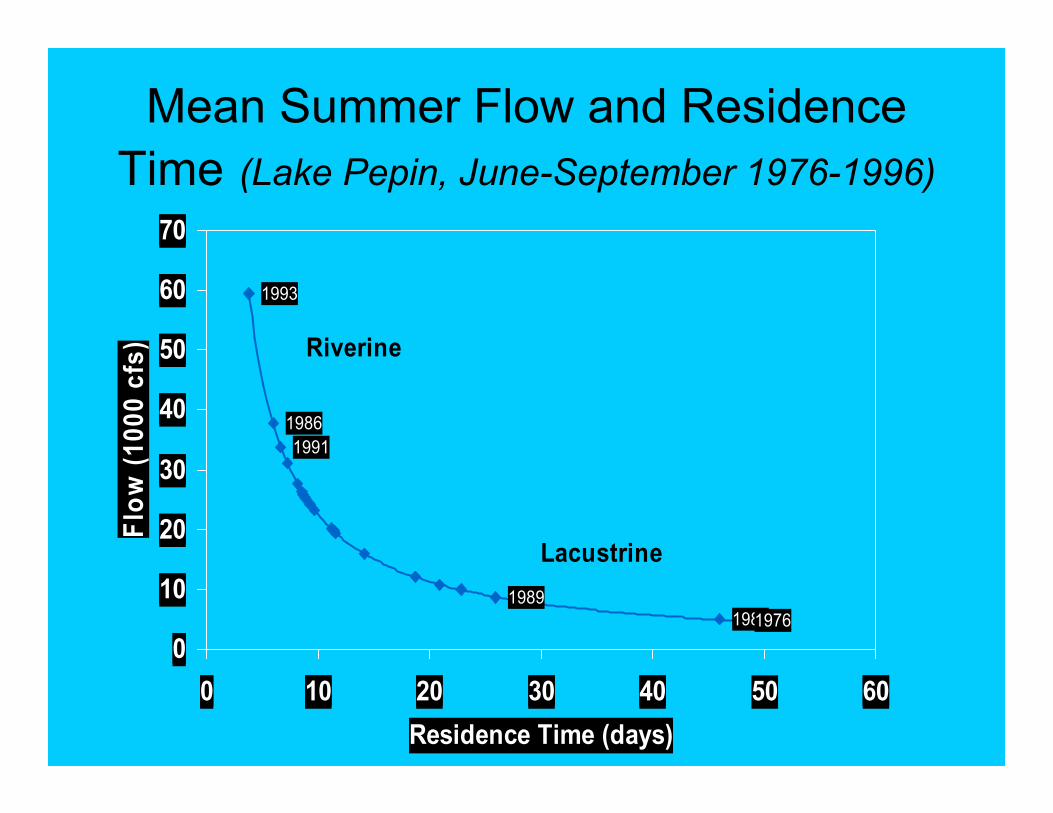
Mean Summer Flow and Residence Time (Lake Pepin, June-September 1976-1996)
198919881976
19911986
1993
0
10
20
30
40
50
60
70
0 10 20 30 40 50 60Residence Time (days)
Flow
(100
0 cf
s) Riverine
Lacustrine
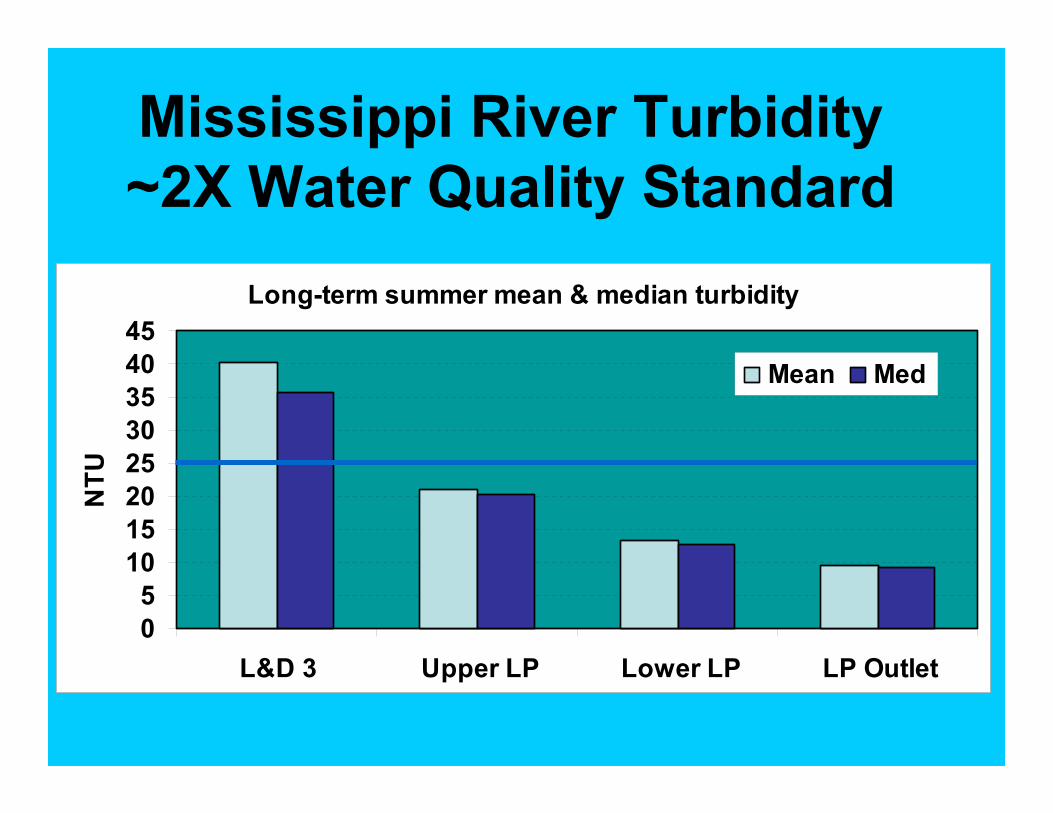
Long-term summer mean & median turbidity
05
1015202530354045
L&D 3 Upper LP Lower LP LP Outlet
NTU
Mean Med
Mississippi River Turbidity ~2X Water Quality Standard

Total Maximum Daily Load
point source (waste load allocation)
+ nonpoint source
(load allocation)
+ margin of safety
+ reserve capacity
Example Allocation
urban runoff
rural runoff
WWTFsuburban runoff
MOS
RC
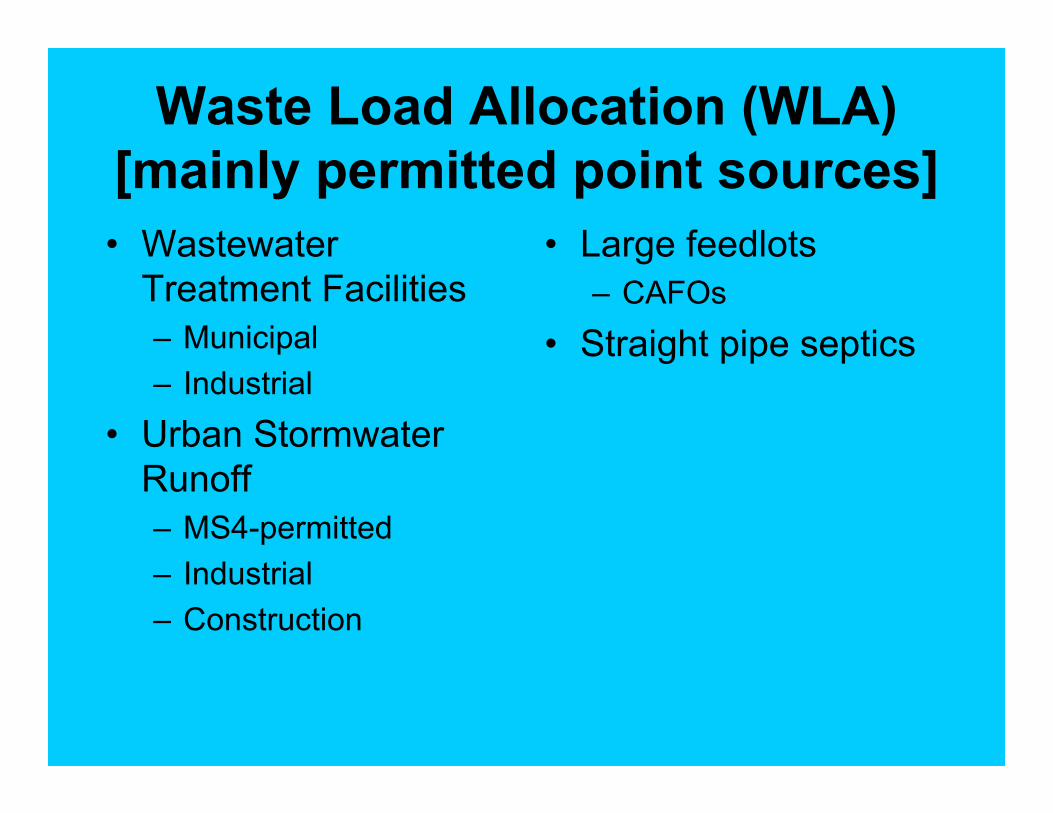
Waste Load Allocation (WLA)[mainly permitted point sources]• Wastewater
Treatment Facilities– Municipal– Industrial
• Urban Stormwater Runoff– MS4-permitted– Industrial– Construction
• Large feedlots – CAFOs
• Straight pipe septics
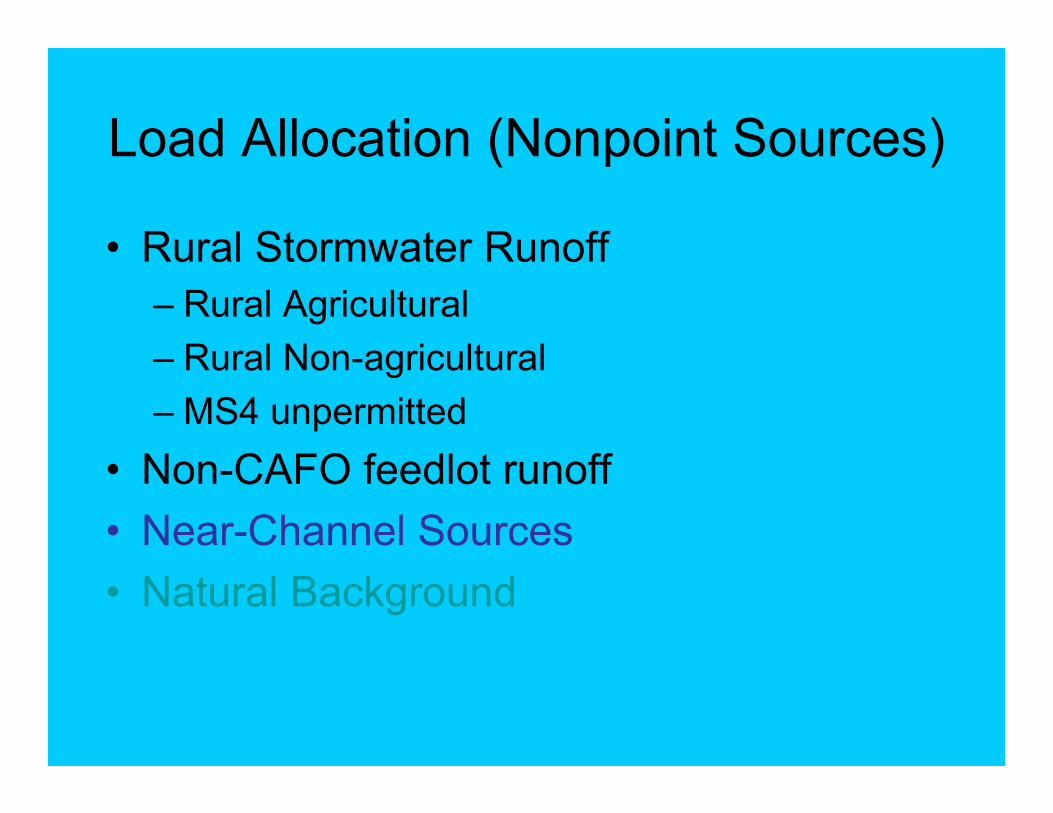
Load Allocation (Nonpoint Sources)
• Rural Stormwater Runoff– Rural Agricultural– Rural Non-agricultural– MS4 unpermitted
• Non-CAFO feedlot runoff • Near-Channel Sources• Natural Background
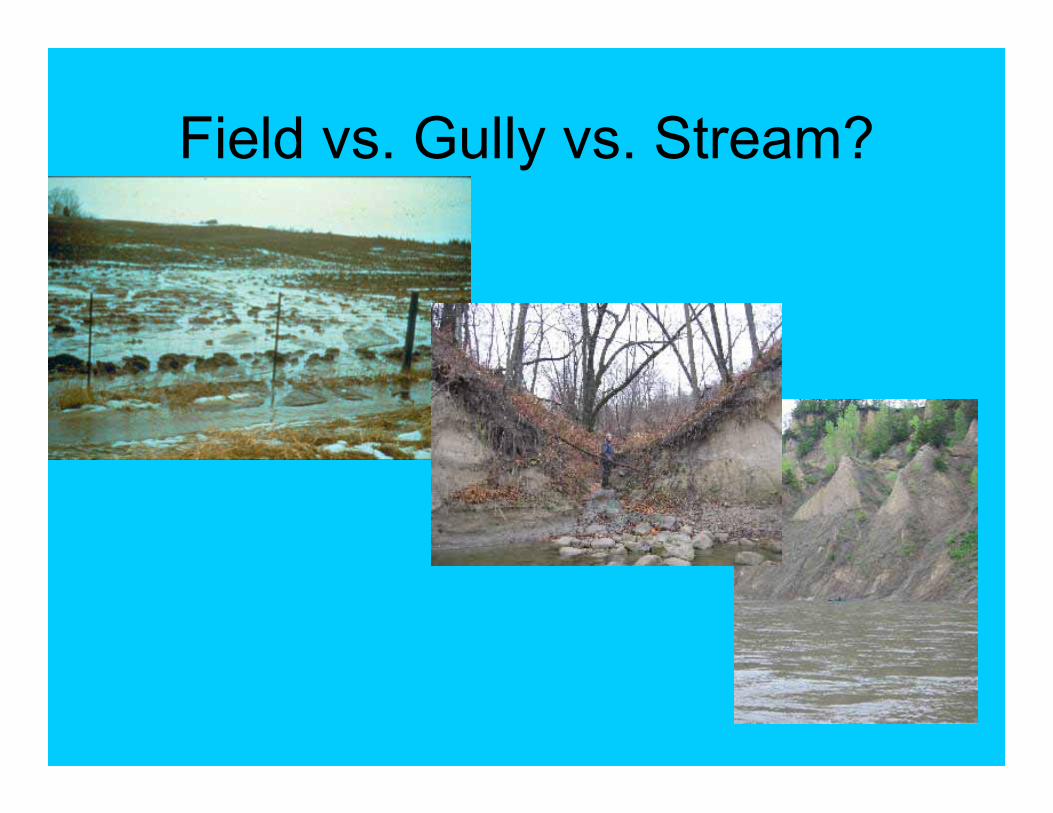
Field vs. Gully vs. Stream?
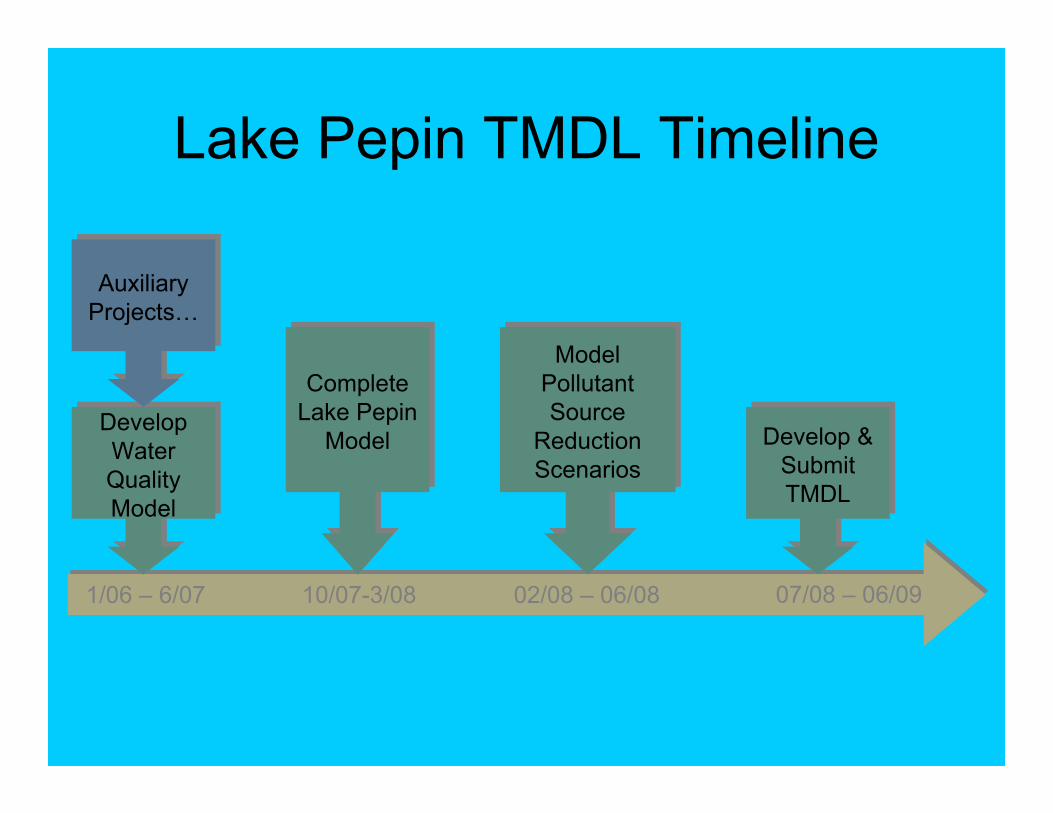
Lake Pepin TMDL Timeline
1/06 – 6/07
Develop Water Quality Model
Develop Water Quality Model
Auxiliary Projects…Auxiliary
Projects…
CompleteLake Pepin
Model
CompleteLake Pepin
Model Develop & Submit TMDL
Develop & Submit TMDL
Model Pollutant Source
Reduction Scenarios
Model Pollutant Source
Reduction Scenarios
10/07-3/08 02/08 – 06/08 07/08 – 06/09

Work Plan-II Review
• Objective A: Large Watershed Model Development– Minn River HSPF, on track, model runs winter
08– Crow River HSPF model – under
development– Loads from smaller watersheds, Cannon, etc.
– completed– ECOMSED model data enhancement -- done
Objective B: Small Watershed Model Development
• Contract Delayed• MPCA Modeler Hired December 07.
– Kahlil Ahmad, M.Sc., Agricultural Engineering, Iowa State University
• Small watershed modeling included in full-cost-accounting project
Objective C: Stream Channel vs. Upland Erosion Estimates
• Geochemical Fingerprinting Project– Science Museum of Minnesota
• Sediment Budget of Le Sueur River Watershed– National Center for Earth Surface Dynamics
• Ravine, Bluff and Streambank GIS Study– University of Minnesota
Objective D: Estimate Gully Erosion
• Gullies grouped under “ravines” in near-channel category in Objective C.
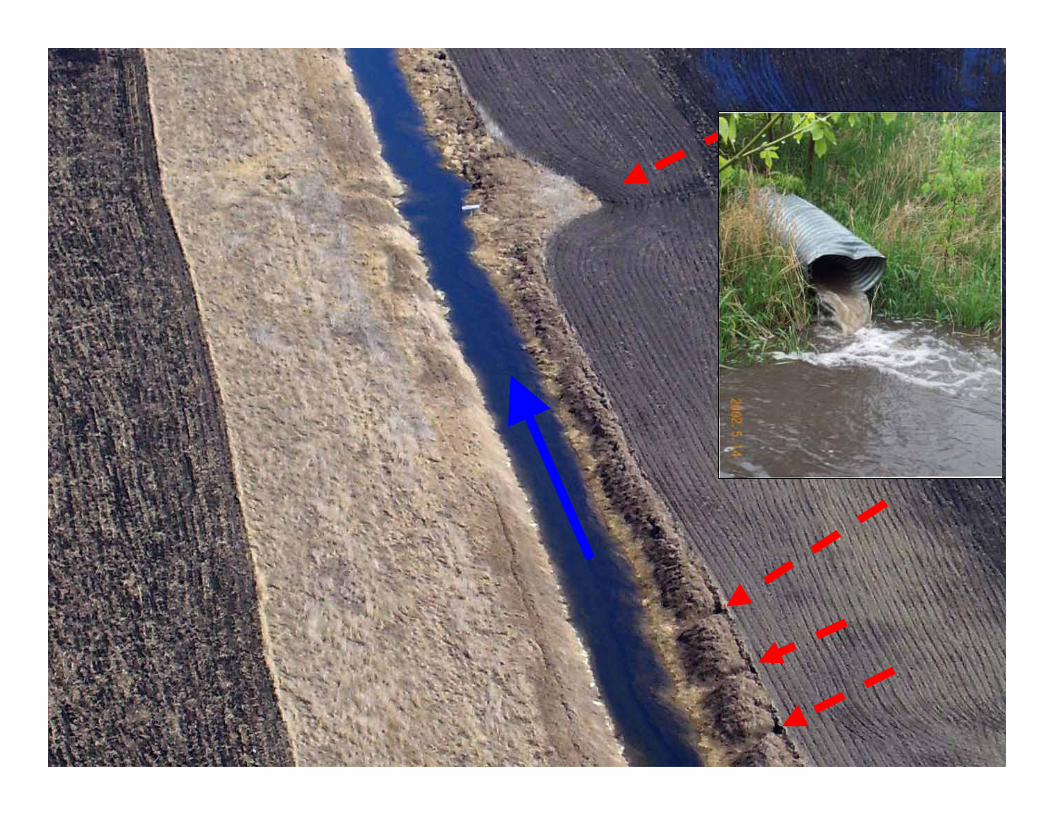
• Gullies taking on high importance…..• Edge of field dynamics: tile outlets
exacerbate gully erosion.
Objective E: HydologicRemediation Analysis
• Need for better understanding of drainage, hydrology & stream impacts.
• Based on this understanding, design solutions that reduce drainage impacts by restoring hydrology
• Little progress
Objective F: Upper Mississippi Channel Process Model
• Scoping Study Completed Dec. 07 by LTI– Tasks 1-3
• Tasks F4-F5 to be completed through another contract in 2008;
Objective G: Internal resuspension
• Lower Pool 2 examined for wind resuspension in shallow south shore of Spring Lake;
• TP recycling – observed late in 2006 and 2007.
• Boat traffic effects being examined as part of sediment mass balance at L&D 2….
Objective H: Submersed Aquatic Vegetation in Shallow Waters
• Bathymetry data collected on Lower Pool 2, Spring Lake area
• LTI has used USACE model to estimate effects of reduced turbidity on SAV –dramatic responses observed in Sturgeon Lake.
• Working through Dakota Co. to integrate river management and near shore land management with TMDL for Spring Lake.
Obj. I: Small Watershed Evaluation of Load Reduction Options
• MPCA Modeler Position added in 12-07. • Potential for Small Watershed Modeling
Project.• Component of Full-Cost Accounting
project (Objective J)
Obj. J: Estimate benefits & costs of alternative load-reduction scenarios• Full-Cost Accounting Project with Insitute
on the Environment, University of Minnesota– Watershed model determines land-use
changes needed to meet Lake Pepin targets.– Ecological models used to estimate ecological
services resulting from land-use changes.– Economic models used to assign costs and
benefits to market and non-market products and services
Objective K: Identify barriers to BMP Adoption
• Minnesota River Turbidity TMDL stakeholder process exploring through extended conversation……
• No scientific study planned….
GOAL 4
• Determine optimal combination of load-reductions for meeting TMDL targets.– Some input needed for determining TMDL
Allocations;– More detailed information will be used to
develop implementation plans after the TMDL has been approved.
• Transition to Schedule of Tasks for Next 12-18 months.
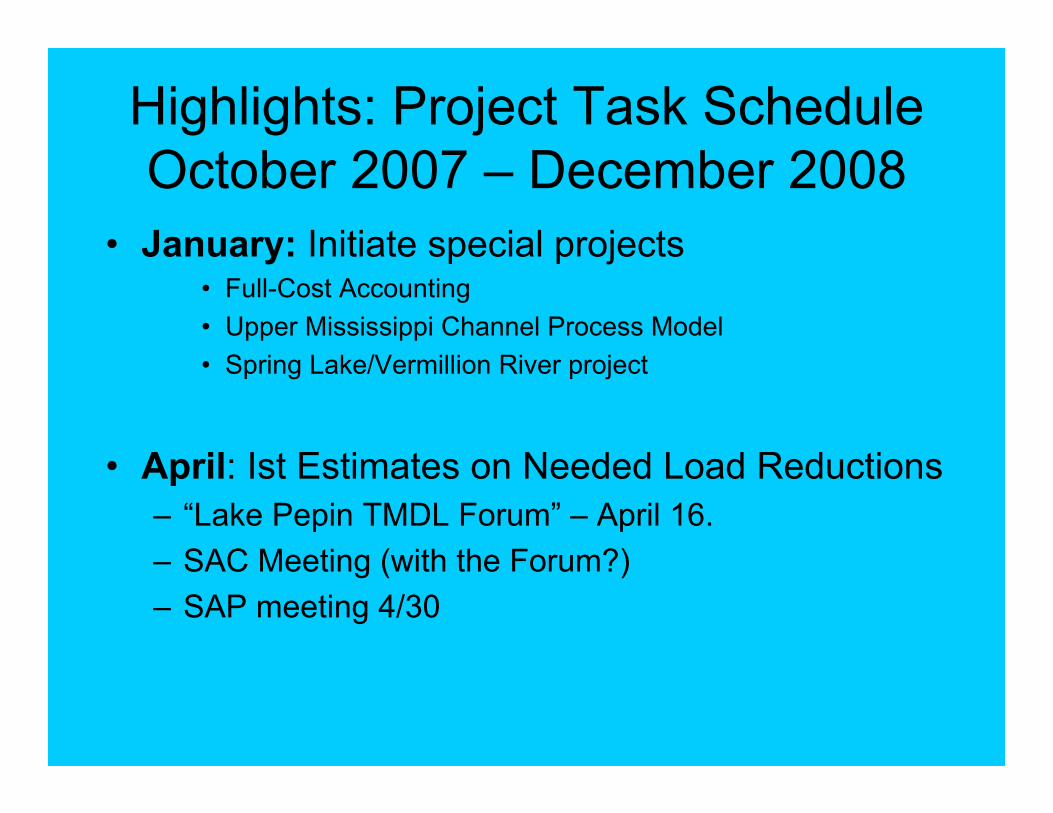
Highlights: Project Task ScheduleOctober 2007 – December 2008
• January: Initiate special projects• Full-Cost Accounting• Upper Mississippi Channel Process Model• Spring Lake/Vermillion River project
• April: Ist Estimates on Needed Load Reductions – “Lake Pepin TMDL Forum” – April 16.– SAC Meeting (with the Forum?)– SAP meeting 4/30

May - July
• May: Model Training & Support• June: Sector Workshops
• Agriculture as Source Sector • Municipalities as Source Sector • Environmental Stakeholders
• June 30: Final Modeling Report from LTI
• July: Model Alternative Allocations
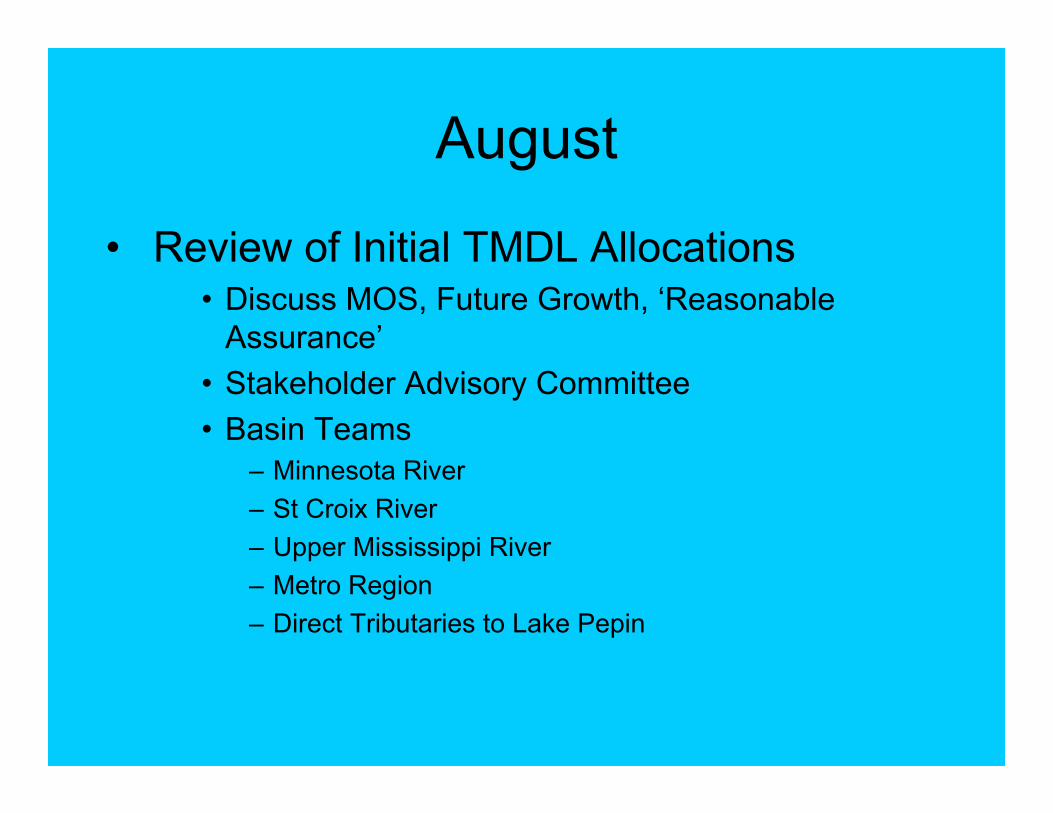
August
• Review of Initial TMDL Allocations • Discuss MOS, Future Growth, ‘Reasonable
Assurance’• Stakeholder Advisory Committee• Basin Teams
– Minnesota River– St Croix River– Upper Mississippi River– Metro Region– Direct Tributaries to Lake Pepin
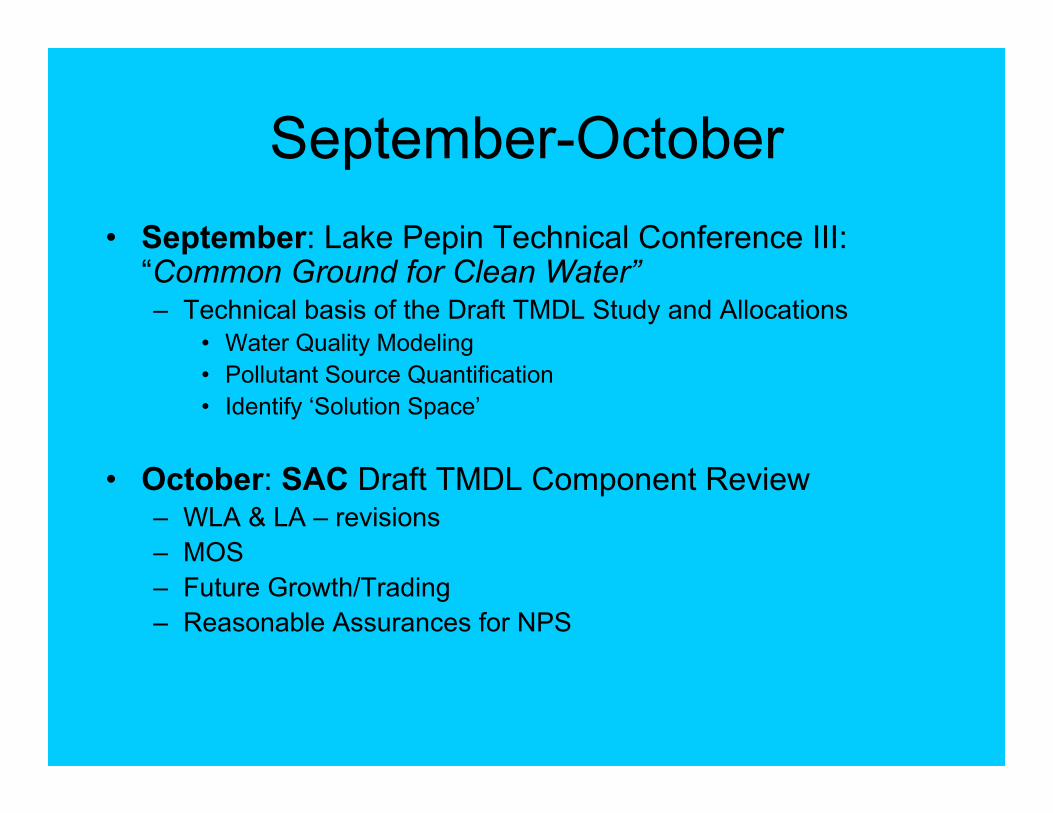
September-October• September: Lake Pepin Technical Conference III:
“Common Ground for Clean Water”– Technical basis of the Draft TMDL Study and Allocations
• Water Quality Modeling• Pollutant Source Quantification• Identify ‘Solution Space’
• October: SAC Draft TMDL Component Review– WLA & LA – revisions– MOS– Future Growth/Trading– Reasonable Assurances for NPS
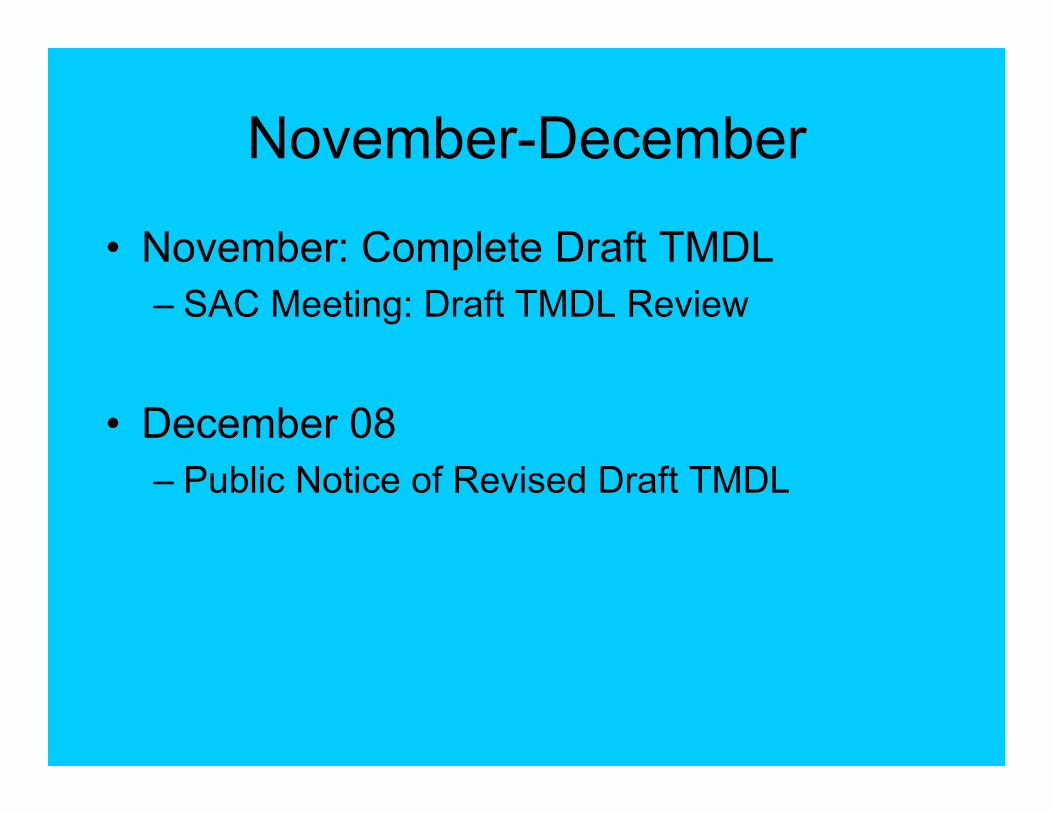
November-December
• November: Complete Draft TMDL– SAC Meeting: Draft TMDL Review
• December 08 – Public Notice of Revised Draft TMDL
Coming Events
• April 16: Lake Pepin TMDL Policy Forum. – St James Hotel, Red Wing– ‘Direct watershed’ stakeholders
• SAC Meetings Scheduled:– April 16– August– October– November
T ogether (with Wisconsin)
M innesotans
D eveloping
L egaciesRep. Dennis Ozment, 2004