lbsresearch.london.edu · lakshmanan shivakumar london business school regent’s park london, nw1...
TRANSCRIPT

LBS Research Online
L Shivakumar and R Ball and X LiContractibility of financial statement information prepared under IFRS: Evidence from debt contractsaround IFRS adoptionArticle
This version is available in the LBS Research Online repository: http://lbsresearch.london.edu/194/
Shivakumar, L and Ball, R and Li, X
(2015)
Contractibility of financial statement information prepared under IFRS: Evidence from debt contractsaround IFRS adoption.
Journal of Accounting Research, 53 (5). pp. 915-963.
DOI: https://doi.org/10.1111/1475-679X.12095
Reuse of this item is allowed under the Creative Commons licence:http://creativecommons.org/licenses/by/4.0/Wileyhttp://onlinelibrary.wiley.com/doi/10.1111/1475-67...
c© 2015, University of Chicago on behalf of the Accounting Research Center
Users may download and/or print one copy of any article(s) in LBS Research Online for purposes ofresearch and/or private study. Further distribution of the material, or use for any commercial gain, isnot permitted.

Contractibility and transparency of financial statement information
prepared under IFRS: Evidence from debt contracts around IFRS
adoption *
Ray Ball
The University of Chicago Booth School of Business
5807 South Woodlawn Avenue
Chicago, IL 60637-1610
Tel. (773) 834-5941
Xi Li
Fox School of Business, Temple University
1801 Liacouras Walk
Philadelphia, PA 19122
Lakshmanan Shivakumar
London Business School
Regent’s Park
London, NW1 4SA
United Kingdom
28 August, 2015
This is the peer reviewed version of the following article: Contractibility of
financial statement information prepared under IFRS: Evidence from debt
contracts around IFRS adoption, Journal of Accounting Research 53(5) p915-963
(2015), which has been published in final form at http://dx.doi.org/10.1111/1475-
679X.12095. This article may be used for non-commercial purposes in
accordance with Wiley Terms and Conditions for Self-Archiving.
*Accepted by Christian Leuz. This paper was circulated earlier under the title “Mandatory IFRS
Adoption, Fair Value Accounting and Accounting Information in Debt Contracts”. We appreciate
comments received from Hans Christensen, Scott Liao (discussant), Regina Wittenberg Moerman,
Valeri Nikolaev, Scott Richardson, two anonymous referees, and participants in workshops at London
Business School, Manheim University, Temple University, University of Michigan, and Peking
University, and at the University of Minnesota Empirical Conference and Singapore Management
University Accounting Symposium. We thank Jose Carabias, Maria Kamenetsky, Stephanie Markman,
Han-Up Park, and Heran Wang for research assistance. Ball gratefully acknowledges research support
from the University of Chicago, Booth School of Business.

Abstract
We outline several properties of IFRS that potentially affect the contractibility or the
transparency of financial statement information, and hence the use of that information
in debt contracts. Those properties include the increased choice among accounting
rules IFRS gives to managers, enhanced rule-making uncertainty, and increased
emphasis on fair value accounting. Consistent with reduced contractibility of IFRS
financial statement information, we find a significant reduction in accounting-based
debt covenants following mandatory IFRS adoption. The reduction in accounting
covenant use is associated with measures of the difference between prior domestic
standards and IFRS. Because IFRS adoption changed financial reporting in many
ways simultaneously, it is difficult to trace the decline in accounting covenant use to
individual IFRS properties, though we report larger declines in accounting covenant
use in banks, which have a higher proportion of assets and liabilities that are fair-
valued. Our findings are better explained by reduced contractibility than by increased
transparency, which would predict reduced non-accounting covenant use as well,
whereas we observe increases. Overall, we conclude that IFRS rules sacrifice debt
contracting usefulness to achieve other objectives, such as provision of accounting
information relevant to valuation.
Keywords: Bonds, Contractibility, Covenants, Debt, Enforcement, Fair Value
Accounting, IFRS, Loans, Transparency
JEL codes: M40, M41, D86, G30

1
1. Introduction
We study changes to debt contracting around mandatory adoption of International
Financial Reporting Standards (IFRS). Mandatory IFRS adoption changed the rules
governing financial statement preparation and presentation, in some countries substantially,
providing an ideal opportunity to investigate the contractibility of financial information.
Prior studies on mandatory IFRS adoption generally focus on equity markets and
address the transparency of financial statement information, not contractibility. Most (e.g.,
Armstrong et al., 2010; Landsman et al., 2012) conclude that equity market participants
respond positively to IFRS adoption and that share prices respond more to accounting
numbers in the post-IFRS period. Daske and Gebhardt (2006) report perceived disclosure
quality increases. Aharony et al. (2011) report increased value relevance of goodwill, R&D
and asset revaluations. Barth et al. (2012) report increased value relevance and comparability
with US firms. Yip and Young (2012) report increased similarity of accounting functions and
increased information transfer. This body of evidence is consistent with the widely held belief
that IFRS improved financial statement transparency and comparability, and hence
informativeness. Against this, several studies conclude that informativeness increased in post-
IFRS period only for firms with greater incentives to comply, or in countries concurrently
improving enforcement (Ball et al., 2003; Daske et al., 2008; Christensen et al., 2013a; Daske
et al., 2013; Cascino and Gassen, 2014). These latter studies cast doubt on IFRS reports being
the cause for observed changes in informativeness and suggest that the transparency benefits
of IFRS per se are not substantial. Regardless of the conclusions reached on transparency,
prior studies on mandatory IFRS adoption do not address a different but important property
of financial statement information: its usefulness in contracting contexts, or contractibility.
It is well known that the optimal accounting system depends on the use made of the
information it produces. Gjesdal (1981) demonstrates this proposition by comparing firm
valuation and contracting with managers. Crawford and Sobel (1982) demonstrate that

2
principals withhold information from agents when there is conflict of interest. Bresnahan et
al. (1992) and Paul (1992) show that market prices incorporate information about asset value
but optimal compensation contracts incorporate information about value added by managers..
Because the rankings of alternative accounting systems are user-dependent, there is not
necessarily a one-for-one correspondence between the extent to which financial statements
incorporate contemporary information that is useful in valuation (in equity and even debt
markets) and its usefulness in contracting (including debt contracting).
While it is difficult to observe precisely in the data, the conceptual distinction
between the contractibility of information and its usefulness for valuation is central to our
analysis. For example, managers’ private information about expected cash flows from an
asset can be informative to many or all users, but at the same time a calculation of the asset’s
fair value based on the cash flow estimates that managers publicly disclose can lack
contractibility. Basing contractual outcomes on one contracting party’s disclosure of
unobservable private information invites moral hazard that other contracting parties will seek
to avoid. Another example is the IFRS option to record firms’ own liabilities at fair value.
This information might be more value-relevant to equity investors but, we argue below, it
might be more useful for debt contracting purposes if balance sheets reflected the amount of
the firm’s contractual obligation to repay.
It follows that rankings of accounting systems based on equity market metrics, such as
value relevance, timeliness, liquidity, information asymmetry, Tobin’s q, and cost of equity
capital, can be misleading indicators of debt contracting usefulness. Even usefulness in debt
pricing does not necessarily carry over to contracting.1 Similarly, we argue below that
enforcement effectiveness does not have the same consequences in debt contracting as in
equity market valuation contexts.
We propose that the debt contracting effects of IFRS are likely to be substantial, and
1 We address only the explicit use of financial statement information in formal written debt contracts. and not
the use of accounting information in informal unwritten contracts or in debt pricing or negotiation.

3
report evidence consistent with that view. We canvass a variety of reasons why financial
statements prepared under IFRS could be less useful in debt contracts, even if at the same
time they provide more information that is useful in valuation. While there are several
logically feasible debt-contracting responses to IFRS introduction, we argue that these
responses involve costs, and that some would not be feasible in practice.
IFRS adoption could be viewed by lenders as affording greater discretion to
opportunistic managers, because its standards are perceived to be more principles-based than
many prior domestic rules-based standards and give borrowers greater choice among
alternative accounting policies as well as greater discretion in their implementation.
The above concerns likely were compounded by uncertainty about the immediate and
longer term effects of IFRS adoption on accounting covenants, together with uncertainty
about future IASB rule-making. Such uncertainties add risk to both borrowers and lenders,
including covenants being tripped by rule changes alone (Deloitte, 2011), and thereby reduce
the efficiency of accounting covenants relative to alternatives. First-time adoption is an
immediate one-time effect, impacting financial statements when they initially are converted
to IFRS, but increased uncertainty in future rule-making for IFRS relative to local GAAP
could be an on-going structural property of IASB rule-making, as it juggles an increasing
range of national political and economic interests.
Relative to prior domestic standards, IFRS also make more use of fair value
accounting, which has several properties that could reduce the effectiveness of financial
statement information in debt contracting. Fair value gains and losses incorporate shocks to
assets’ cash flows that are transitory (Samuelson, 1965), making current-period earnings a
poorer predictor of future debt service capacity, particularly for longer-maturity debt (Li,
2010; Christensen and Nikolaev, 2012). Fair value gains and losses also include shocks to
assets’ expected returns that are expected to reverse at least in part before the debt matures,
making both balance sheet and earnings variables less efficient in debt contracting. Further,

4
the IFRS option to fair value certain financial liabilities lowers its contracting value because
debt contracts require repayment of principal and interest, not the debt’s fair value.
We investigate the effect of IFRS adoption on debt contracting in a sample of new
debt issues between 2001 and 2010 in twenty-two IFRS-adopting countries and twenty-one
non-IFRS countries. Employing a difference-in-difference specification that controls for firm
and debt issue characteristics as well as country and year fixed effects, we document a
significant decline in both the frequency and intensity of accounting-based covenants in
IFRS-adopting countries after adoption, but not in other countries. The decline in accounting
covenant use is observed for both income statement and balance sheet covenants. Greater
declines in accounting covenant use are observed in countries whose pre-IFRS domestic
standards differed more from IFRS, and for banks (whose financial statements are more
exposed to fair value accounting), but not in countries with higher scores on enforcement.
The results are robust to a variety of specifications.
An alternative explanation for these results is based on Demerjian (2014), who notes
that information-asymmetry prior to lending can be reduced by incorporating covenants that
trigger loan renegotiation when material information about borrower credit quality is
subsequently revealed. If IFRS introduction and associated regulatory changes improve
reporting quality and thus information asymmetry prior to lending, then there would be lesser
need for future renegotiation. This would reduce the demand for debt contract covenants,
both accounting and non-accounting. However, we find that non-accounting covenants
actually increase in frequency after IFRS adoption, particularly in loans, implying that our
findings are better explained by IFRS reducing contractibility than increasing transparency.
This paper contributes to the literature on economic consequences of IFRS adoption.
Our evidence suggests that IFRS financial statements are less useful for covenant design than
adopting countries’ prior reporting. This is a “market test” of IFRS, analogous to Christensen

5
and Nikolaev (2013). We do not study IFRS usefulness in debt pricing, in either primary or
secondary markets.2
The paper also contributes to the literature on the use of accounting information in
debt contracting generally. Several studies have documented that properties of accounting
numbers influence their use. Nikolaev (2010) finds that accounting covenant use is associated
with the degree of timely loss recognition. Costello and Wittenberg-Moerman (2011) find
that accounting covenant use falls when internal control weaknesses impede financial
statement reliability. Our study is related to the seminal Leftwich (1983) study of non-GAAP
contracting in private loan agreements, to the Demerjian (2011) evidence that increased fair
value accounting in the US has eroded the use of balance sheet based debt covenants, and
also to Christensen and Nikolaev (2012).
Our hypotheses, data and conclusions differ from those of a concurrent paper, Chen et
al. (2015), which also reports a decline in accounting covenant use. Chen et al. (2015) study
how transparency changes affect loan contracts, whereas our study examines both
contractibility and transparency effects for both loans and bonds. Additionally, by studying
substitution between accounting and non-accounting covenants and by separately studying
banks, we are able to address alternative explanations for our findings. Finally, Chen et al.
(2015) treat loans where data vendors record no covenants as covenant-free in fact. This
occurs in approximately 90% of non-US loans in our sample, and since loans rarely are
issued without any covenants, we view it as a missing data issue.
Brown (2013) examines accounting covenant changes around IFRS adoption for
domestic loans (i.e. loan contracts between a borrower and a bank domiciled in the same
country) relative to international loan contracts (i.e. contracts between a borrower and a
banker domiciled in different countries). Consistent with our findings, she documents a
2 Chen et al. (2015) find that mandatory IFRS adoption is associated with increases in interest rates in
syndicated bank loans. In contrast, Florou and Kosi (2015) find that interest rates are lower for public bonds
issued after mandatory IFRS adoption.

6
decline in accounting covenants for domestic loan contracts. However, for international
loans she finds that performance-based covenants (which are essentially income-statement
based covenants) decrease after IFRS adoption, whereas capital-based covenants (essentially
balance-sheet based covenants) increase. While we do not attempt to explain these mixed
results for international loans, they are obtained from a comparison within IFRS firms, and
not between IFRS and non-IFRS firms as in our study. Like Chen et al. (2015), Brown
(2013) assumes debt contracts are covenant-free whenever data vendors record no covenants
(accounting or non-accounting).
Our results contrast with those reported in a US setting by Demerjian et al. (2015),
who find no evidence of changes in accounting covenant use following SFAS 159 adoption.
We provide several plausible explanations for the difference, the most important of which lies
in timing. Fair value accounting already was widely adopted in the US before SFAS 159
modified its rules, and accounting covenant use already had fallen (Demerjian, 2011).
There are several potential policy implications. The joint IASB/FASB Conceptual
Framework project (FASB, 2010, ¶OB2) views the information needs of “investors, lenders,
and other creditors” and decisions involving “buying, selling, or holding equity and debt
instruments and providing or settling loans and other forms of credit” as homogeneous. The
contrasting analyses and results for debt contracting and equity valuation challenge the
rationale for general purpose accounting standards. Our arguments and results also imply that
for debt contracting it is not optimal to use a consistent accounting measurement model for
all assets and liabilities, as apparently favoured by IASB and FASB, and advocated by
researchers ranging from Chambers (1966) to Barth (2013).
We hasten to add that our arguments and our results do not imply that IFRS are
inferior to the adopting countries’ prior domestic standards. Our more modest conclusion is
that financial statements cannot serve all masters and, in particular, financial statements
prepared under IFRS have important limitations in terms of debt contractibility, the unique

7
properties of which do not appear to be reflected in standard-setting. We acknowledge that,
while our difference-in-difference analyses with country and year fixed effects indicate a
decline in accounting covenant use after IFRS adoption, the result could also be due to
omitted correlated variables or concurrent events. These concerns are specifically germane in
IFRS-adoption context as IFRS adoption by countries is clustered in time. We also
acknowledge that the distinction between contractibility and transparency, while central to
our analysis, is not clear-cut in practice. Finally, we note that our post-adoption sample of
loan (but not bond) issuances in IFRS adopting countries is small, due to limited covenant
data.
The remainder of the paper is organized as follows. Section 2 develops testable
hypotheses. Section 3 describes the data and sample selection. Section 4 discusses results.
Section 5 provides conclusions. An Internet Appendix contains additional data analyses and
numerical examples to illustrate our hypotheses.
2. Hypotheses
This section outlines several ways in which, we conjecture, the changes heralded by
mandating IFRS affected the use of debt covenants.
2.1 Uncertainties about IFRS first-time adoption effects and future IFRS revisions
2.1.1 Uncertain first-time adoption. The IASB issued IFRS 1 (First-time Adoption of
International Financial Reporting Standards) in June 2003. The standard requires firms
reporting for the first time under IFRS to thoroughly revise balance sheets previously
prepared under domestic rules. This involves adding, deleting, and remeasuring assets and
liabilities. Christensen et al. (2009) argue that IFRS introduction consequently transferred
wealth between debt and equity investors. Thus, prior to introduction, the first-time effect of
IFRS on covenanted accounting ratios, and any attendant wealth transfers, would have been

8
uncertain. This would have constituted risk to both borrowers and lenders, including the risk
of covenants being tripped by rule changes alone. Subsequent experience with IFRS is likely
to have reduced uncertainty about its effects on accounting covenants over time, but it is
unclear how long this uncertainty would have persisted.
2.1.2 Uncertainty about future IASB rule-making. We also conjecture that uncertainty about
future IASB rule-making adds further risk to using accounting covenants based on IFRS
financials. The IASB made frequent changes to IFRS prior to adoption by many countries in
2005. Figure 1 plots the number of new standards or amendments to existing standards by
year from 1997 to 2012. The frequency of changes to IFRS standards substantially increased
after the European Union’s (EU) 2002 commitment to adopt them for publicly-listed firms
and after the actual adoption in 2005. In addition, borrowers and lenders face uncertainty
about the adoption or modification of individual IFRS standards BY their jurisdictions.
The IASB’s governing body acknowledged this issue (IASC Foundation 2002, ¶22):
The IASB has no general policy of exempting transactions occurring before a specific
date from the requirements of new financial reporting standards. When financial
statements are used to monitor compliance with contracts and agreements, a new
Standard may have consequences that were not foreseen when the contract or
agreement was finalised. For example, covenants contained in banking and loan
agreements may impose limits on measures shown in a borrower’s financial statements.
The IASB believes the fact that financial reporting requirements evolve and change
over time is well understood and would be known to the parties when they entered into
the agreement. It is up to the parties to determine whether the agreement should be
insulated from the effects of a future accounting standard, or, if not, the manner in
which it might be renegotiated to reflect changes in reporting rather than changes in the
underlying financial position.
No mention is made of the expected cost of renegotiation in response to future changes to
accounting rules (and to terminology), which reduces the efficiency of accounting covenants.
Frequent revision could be a temporary phenomenon associated with the development
of the first complete set of IFRS standards and their adoption. Alternatively, it could be a
structural property of the IASB rule-making process and multi-jurisdictional adoption of its
rules. The IASB is subject to a considerably wider range of economic and political influences

9
than domestic standard setters, so it is reasonable to expect greater uncertainty about its
future actions. This creates risk to borrowers and lenders using accounting covenants,
including covenants being tripped by rule changes alone, and imposes costs of renegotiation.
We conjecture that these effects cause borrowers and lenders to use fewer accounting
covenants.
2.2 Managerial discretion under IFRS
Relative to the prior domestic standards in many adopting countries, IFRS are more
principles-based, laying down broad rather than specific requirements that require more
management judgement in application. Schipper (2003) argues that the detailed guidance
provided by rules-based standards improves the verifiability of reported numbers.
Verifiability is critical to contracting generally (Watts, 2003), so there is reason to expect that
IFRS principles-based standards reduce the usefulness of accounting numbers for debt
contracting purposes.
IFRS also provide managers with substantial choice of accounting methods,
apparently to gain acceptability across diverse political, economic, institutional, and legal
regimes. Moody’s (2008) reports IFRS reduced standardisation across firms, in both
interpretation and application of accounting rules. Capkun et al. (2012) point out that nearly a
third of the standards were revised between 2003 and 2005, and that every revision, as well as
the six additional standards issued during this period, allowed firms greater flexibility in
choosing among alternative accounting methods. For example, IAS 40 allows firms to report
investment property at either fair value or historical cost. IAS 19 gives an option to recognize
actuarial gains and losses on post-retirement employee benefits fully in the income statement
or in the statement of comprehensive income, or to partly defer recognition.3
Further, the fair value orientation of IFRS allows greater managerial flexibility over
accounting estimates. Fair value manipulation can occur in two broad ways: trading at period-
3 The European Commission (2008) reports that, among IFRS-adopting European firms, the choice of
accounting for post-retirement employee benefits varies across industries and countries.

10
end to manipulate asset prices in imperfectly liquid markets (Heaton et al., 2010; Milbradt,
2009); or manipulating subjective estimates of fair value when traded prices are unavailable
(Watts, 2003; Benston, 2008).4 Either way, from the perspective of lenders considering using
accounting numbers for triggers, fair value manipulation creates uncertainties. While
historical cost accounting also allows manipulation through delayed write-offs and strategic
asset sales, it is unclear that fair value accounting improves accounting-based covenants.
Consistent with greater discretion under IFRS, Ahmed et al. (2013) find that IFRS
firms exhibit increases in income smoothing, aggressive reporting of accruals, and decreased
timeliness of loss recognition, relative to firms from countries that did not adopt IFRS. They
also document that strong enforcement mechanisms at the time of IFRS adoption are
insufficient to offset the greater flexibility relative to domestic GAAP. Similarly, Christensen
et al. (2015) find evidence of a modest increase in earnings smoothing for German firms that
switched to IFRS after it was mandated and Capkun et al. (2012) report an increase in
earnings management for European firms reporting under IFRS in the post-2005 period.
Finally, Magnan et al. (2015) find that analyst forecast accuracy is adversely affected by on
the use of level 3 fair values, supporting the view that greater IFRS discretion increases
uncertainties for capital market participants.
2.3 IFRS, fair value accounting, and debt contracting
IFRS adoption brings a strong tilt toward “fair value” accounting, reporting many
assets and liabilities at fair value instead of historical cost (Ernst and Young, 2005). Fair
value is defined as: “The price that would be received to sell an asset or paid to transfer a
liability in an orderly transaction between market participants at the measurement date”
4 Mutual fund managers purchase illiquid stocks in which they already hold overweight positions on the last day
of the quarter (Gallagher et al., 2009). Carhart et al. (2002) find that price manipulation is more intense at
quarter-ends and primarily occurs in the last half hour before the daily close. Focussing on prosecutions by SEC
for closing-price-manipulation, Comerton-Forde and Putniņš (2011) report that price manipulations are
associated with substantial abnormal day-end returns, subsequent reversals, increased trading volume and wider
spreads. Zuckerman and Fitzpatrick (2012) report evidence of managers manipulating their fair value marks. A
notorious case of fair value manipulation is Enron (Benston and Hartgraves, 2002; Haldeman, 2006).

11
(IFRS 13, Appendix). Fair value measurements are incorporated in IAS 16 (Property, Plant
and Equipment), IAS 19 (Employee Benefits), IAS 22 or IFRS 3 (Business Combinations),
IAS 36 (Impairment of Assets), IAS 37 (Provisions, Contingent Liabilities and Contingent
Assets), IAS 38 (Intangible Assets), IAS 39 and IFRS 9 (Financial Instruments: Recognition
and Measurement), IAS 40 (Investment Property), IAS 41 (Agriculture), IFRS 2 (Share-based
Payments), IFRS 4 (Insurance Contracts), IFRS 5 (Non-current Assets Held for Sale and
Discontinued Operations), and IFRS 13 (Fair Value Measurement). In this section, we
describe some of the potential shortcomings of fair value from a debt contracting perspective,
and discuss the costs and feasibility of attempting to “contract around” those shortcomings.
2.3.1 Effect of transitory fair value gains and losses on income covenants. Following
Campbell (1991), unexpected changes in asset prices can be decomposed into shocks to cash
flows and shocks to expected returns (i.e., discount rates). Fair value gains and losses on
assets that arise from shocks to expected cash flows are both transitory (Samuelson, 1965)
and large (capitalized quantities, not flows). We therefore expect IFRS to incorporate
substantial transitory components into earnings. Consistent with this expectation, Hung and
Subramanyam (2007) report that, for German voluntary IFRS adopters, IFRS earnings are
more volatile and transitory than previously reported under domestic standards.
A central role of debt covenants is to act as ex-post trip wires that transfer decision
rights to lenders in states characterized by poor economic performance. Following Li (2010)
and Christensen and Nikolaev (2012), we conjecture that an earnings variable incorporating
transitory shocks is a less efficient predictor of future debt service capacity and hence less
efficient for transferring decision rights to lenders in adverse future states. A numerical
illustration of this effect is provided in the Internet Appendix.
2.3.2 Effect of FV gains and losses due to discount rate shocks on income and balance
sheet covenants. In contrast to the effects of cash flow shocks, fair value gains and losses that
arise from discount rate shocks are expected to reverse over asset lives. Given expected cash

12
flows, fair value gains (losses) due to an unanticipated falls (rises) in discount rates are
expected to be offset by lower (higher) future returns. To the extent that fair value reversion
is expected before the firm’s debt matures, the shock is irrelevant for predicting future debt
service capacity and hence for debt covenants, because it does not reflect a change in the
expected cash available for servicing. We propose that any reversion in asset value due to
discount rate shocks that is expected to occur before a debt instrument matures makes both
book value and accounting income poorer indicators of capacity to repay if the asset is fair-
valued. A numerical illustration of this effect is provided in the Internet Appendix.
This proposition supports the following observation in Cochrane (2011, p. 1088):
“I am not arguing that mark-to-market accounting is bad, or that fudging the
numbers is a good idea. The point is only that what you do with a mark-to-
market number might be quite different in a world driven by discount-rate
variation than in a world driven by cashflow variation. The mark-to-market
value is no longer a sufficient statistic.”
The reversion problem also applies to asset impairment standards. IAS 36 ¶56
specifies that the discount rate used for fair value impairment measurement is the current
market rate. If the maturity of an impaired asset is less than that of the firm’s debt, the fair
value reduction is expected to completely reverse before debt maturity. It could be more
efficient to contract on a leverage covenant that could not be violated due to discount rate
shocks which do not affect debt service capacity.5
2.3.3 Effect of firms fair valuing their own liabilities on balance sheet covenants. IAS 39
(revised slightly in IFRS 9) gives firms an option to fair value certain of their own liabilities.
This does not appear to be optimal from the viewpoint of debt contracting, because debt is an
agreement to repay principal and interest, not to repay fair value.6 Leverage covenants
transfer to lenders some decision rights, such as veto rights on financing and investment
5 The comparable US standard (SFAS 121 and SFAS 142) triggers impairment based on undiscounted cash
flows. However, if triggered, impairment is to fair value calculated at the current discount rate. Thus, while this
inconsistency might seem nonsensical from an abstract accounting measurement model perspective, it makes
more sense from a debt contracting perspective. 6 It should be emphasized that fair values could be relevant for valuation roles of accounting. Our focus in this
section is on the debt contracting use of accounting numbers.

13
transactions, repricing of debt or repayment, in states when the borrower’s credit risk
deteriorates according to agreed-upon metrics. Leverage covenants based on balance sheet
data therefore involve comparing asset values with the amount of outstanding debt
obligations, not with its fair value. However, fair valuing debt reduces the balance sheet
amount of debt in tandem with the ability of the borrower to service it, so balance sheet ratios
become inefficient trip-wires. A numerical illustration of this effect is provided in the
Internet Appendix.
Fair value accounting apparently is founded on an accounting measurement model in
which all users make more informed decisions if (1) the basis of measurement for all assets
and liabilities is consistent (FASB, 2006 ¶P4; FASB, 2008 ¶P4) and (2) that basis is a
measure of current market value (e.g., Chambers, 1966; Barth, 2013). This might be optimal
for valuation uses, but debt contracts inherently require mismatched measurement bases for
assets (fair value) and debt (the firm’s contractual historical debt obligations).7
A similar issue arises for bonds with an attached option to convert to equity that is
exercisable by lenders. IFRS 9 (previously, IAS 32 and IAS 39) requires the separate
components of the issuance price to be valued and recorded as debt and equity. If credit
quality deteriorates sufficiently, the option is not exercised and the full amount of the debt is
repayable, but previous balance sheets will have recorded only part of that obligation.
2.4 Effect of changes in transparency on covenant use
IFRS adoption generally is viewed by some academics and practitioners as having
significantly improved financial transparency.8 For instance, IFRS adoption forced Italian and
Spanish firms to report cash flow statements, which previously were not mandatory. IFRS
also requires more detailed disclosures and additional recognition of liabilities, such as off-
balance sheet transactions and pensions. Increased use of fair values leads to timelier
7 Unrecorded assets create an additional problem. Consider a firm whose credit is downgraded due to an event
that reduces enterprise value but is not recognized on the balance sheet. The fair value of liabilities decreases,
but there is no offsetting decrease in fair value of assets, perversely causing balance sheet leverage to decline. 8 See De George, Li and Shivakumar (2015).

14
recognition of gains and losses in the accounts. Whether these changes provided lenders with
materially more useful information about borrowers is unclear, but if they did increase
financial statement informativeness they could have impacted accounting and non-accounting
covenant use.
Any effects of improved financial transparency could differ between loans and bonds.
Our analysis builds on Demerjian (2014). Lenders have imperfect information about
borrower credit quality (i.e., future capacity to meet contractual commitments) and can
manage their exposure to this uncertain default risk in two ways. They can acquire
information about borrower quality ex ante and thus make better risk screening and pricing
decisions. Alternatively, Demerjian (2014) points out that lenders can insert contractual
covenants that, conditional on subsequent contractible information about borrower quality
being revealed as adverse ex post, trigger lender rights such as early repayment, repricing, the
option to veto future borrower financing and investment, or renegotiation. Relative to private
loans, it is costlier to obtain agreement among public bond holders on renegotiating terms or
on deciding whether to exercise veto options. Hence, other things equal, bonds tend to
contain fewer covenants (Smith and Warner, 1979) and bond issuance correspondingly
involves greater acquisition of information prior to lending.9
If IFRS introduction and correlated regulatory enforcement changes were associated
with an increase in financial reporting informativeness, the effects could vary between loans
and bonds. Prior literature raises doubts on whether IFRS adoption alone leads to an
improvement in informativeness, but also documents significant enforcement effects (Ball et
al. 2003; Daske et al., 2008; Christensen et al., 2013a; Daske et al., 2013; Cascino and
Gassen, 2014). For bonds, enhanced financial reporting informativeness could reduce
lenders’ initial uncertainty about borrower quality and make pre-screening more effective,
9 Kim et al. (2011) argue that banks are less likely to impose covenants on borrowers using IFRS because
greater financial transparency reduces the demand for ex post monitoring and recontracting. Unlike Demerjian
(2014), they predict reduced use of both accounting and non-accounting covenants. They find support for their
arguments in a sample of voluntary IFRS adopters, but selection effects confound the result.

15
reducing the demand for both accounting and non-accounting covenants. For loans, a
reduction in contractibility of financial statement information could cause substitution from
accounting to non-accounting covenants, in addition to any increased pre-screening of
borrowers.10
2.5 Costs of “contracting around” IFRS standards
If it was costless, borrowers and lenders could contract around any limitations of
IFRS. They could contract on the basis of pro-forma financial statements prepared under their
country’s pre-IFRS rules (“frozen GAAP”), or on numbers recalculated without applying
specific IFRS standards such as IAS 39 on financial assets and liabilities, or excluding
specific parts of an IFRS standard such as fair valuing financial liabilities.
These actions might not be easy in practice. Frozen GAAP incurs the cost of keeping
parallel books and of auditing them. These costs would increase over time, as cumulative
changes in training, practice guides, software and other inputs to financial statement
production make old GAAP more difficult to implement. Borrowers typically have
outstanding debt that was issued at different dates in the past, when different sets of standards
were in place, so frozen GAAP would require them to maintain multiple parallel books . In
addition, to the extent that GAAP changes are optimal responses to changes in state variables,
contractually excluding all changes might not be efficient. Kvaal and Nobes (2010) report
that, when allowed under IFRS, many firms continue to use their country’s pre-adoption
domestic standards, but this also requires parallel books.
The costs of contracting around mandatory implementation of IFRS are unobservable
to us. If IFRS introduction reduced the contractibility of financial statement information,
borrowers and lenders presumably would have trade off these costs against the costs of
reducing their use of accounting covenants. For firms required to report under IFRS, we
observe frozen GAAP provisions in only 1% of a hand-collected sample of bonds, as
10
This analysis is similar to the two-period budgetary model of Demski and Feltham (1978).

16
described in the Internet Appendix. We therefore expect to observe the adjustment to IFRS
occurring primarily in reduced accounting covenant use.
Demerjian et al. (2015) discuss the costs and benefits of alternative responses to
SFAS 159, which expanded US borrowers’ fair value options. They find that 85% of US
private loan contracts did not provide for the exclusion of fair value gains and losses after the
standard became effective. When covenants did make exclusions, they typically related to fair
value gains and losses on liabilities, but not on assets. While this evidence is broadly
consistent with what we observe in IFRS-adopting countries, we are hesitant to draw general
conclusions from it for several reasons. First, Demerjian et al. (2015) examine private loan
contracts but, as noted above, adjustments for accounting standards are even rarer in our
public bonds sample. Second, they study a single optional accounting standard whose effects
are separately disclosed, whereas mandatory IFRS adoption introduced a wide range of fair
value and other rule changes, the total effects of which are not separately reported. Third, fair
value accounting already was widely adopted in the US before SFAS 159 was enacted, and
accounting covenant use already had fallen (Demerjian, 2011).
3. Data and Sample Selection
The primary data set combines multiple sources to compile a relatively large sample
of new debt issues made between 2001 and 2010 by firms in 43 countries. Public bond
issuance data are obtained from Mergent FISD, Capital IQ, SDC Thomson One, and
Bloomberg. Private loan issuance data are obtained from DealScan and SDC Thomson One.11
We match borrowers from these databases with Compustat Global and WorldScope data
using available company identifiers such as Excel Company ID, Cusip, Sedol, ISIN, Ticker,
11
The bond sample starts with Mergent FISD data, and is augmented with (in order) Capital IQ, Bloomberg, and
SDC, excluding duplication. The loan sample starts with DealScan and is augmented with SDC, again excluding
duplication. We consider each loan facility as a separate observation, because loan features, such as yield
spread, maturity, and offering amount, vary across facilities (Qian and Strahan, 2007; Kim et al., 2011). When
data sources provide different numbers of accounting covenants, we use the one with the largest number. Nini et
al. (2009) observe that DealScan under-reports the use of capital expenditure restrictions in loan contracts.

17
and CIK. For borrowers that cannot be matched by these identifiers, we manually match by
borrower name and country.12
We merge each debt issue with the borrower’s accounting
information on Compustat Global and WorldScope in the fiscal year immediately before the
issuance date.13
Countries that mandated IFRS in the sample period are the treatment sample.
We ignore any pre-IFRS convergence of countries’ standards to IFRS, possibly under-
estimating the true effects of IFRS adoption.14
Countries that retained their domestic
accounting standards during the period are the control.
For each issue, we require non-missing information on issue date, debt amount, yield
spread, covenants, and maturity. We exclude issues with no covenants recorded by the data
providers.15
This generates 30,228 debt issues (16,429 loans and 13,799 bonds). We exclude
firm-year observations in the control sample of non-IFRS countries that voluntarily used
IFRS (55 observations). For our main analyses, we also exclude firm-years in the treatment
sample of IFRS-adopting countries that voluntarily used IFRS or IAS before the mandatory
adoption date (176 observations), or did not use IFRS after the mandatory adoption date (381
observations).16
We exclude firm-years that did not disclose the accounting standards used
12
For borrowers in Mergent FISD, we use Cusip, Sedol, Ticker, and borrower name and country for matching.
For borrowers in Capital IQ, we use the Excel Company ID-Gvkey and Excel Company ID-ISIN link tables
provided by Capital IQ. For borrowers in SDC, we use CIK, Cusip, Sedol, and borrower name and country. For
borrowers in Bloomberg, we use ISIN. For borrowers in DealScan, we use DealScan-Compustat link provided
by Chava and Roberts (2008) for US firms and manually match by name and country for non-US firms. 13
We use Compustat Global as the primary data source for borrower’s accounting information and augment it
with WorldScope. For the information on borrower’s reported accounting standards, we primarily rely on
WorldScope, as Daske et al. (2013) find that such information is less accurate in Compustat Global. 14
While Brazil adopted IFRS in December 2010, the last year of our sample period, we treat it as a non-IFRS
country because we use accounting data one year before the debt issuance date. 15
Only 10% of international debt issues have at least one recorded covenant. We exclude the remainder because
our data providers inform us this is likely to be caused by them failing to collect covenant information, rather
than covenant-free debt. Excluding issues without covenants is consistent with prior literature (e.g., Demerjian,
2011; Christensen and Nikolaev, 2012). While this excludes some debt issues that actually are covenant-free,
our data providers and extant research suggest that covenant-free debt was rare during the sample period.
Nonetheless, we repeated our main regression (reported in Table 4) for an expanded constant sample that
includes firms without covenant data and excludes US firms (which have substantially better covenant coverage
than non-US firms in the database). We obtain essentially identical conclusions to those reported here (reported
in Internet Appendix, Table IA9). 16
Firms in the treatment sample that do not use IFRS after the mandatory adoption date are either not required
to adopt IFRS, such as non-EU firms listed in UK’s Alternative Investment Market and companies listed in
Switzerland that are not multi-nationals, or were allowed to delay adoption, such as EU firms reporting under
US GAAP at the time of mandatory IFRS adoption. We follow the coding scheme in Daske et al. (2013, Table

18
(325 observations).
For our main analyses we exclude debt issued by firms in financial industries (SIC 6)
and analyse them separately because they face different regulatory, financial reporting, and
debt contracting issues. We drop observations with insufficient data to calculate all variables.
To calculate country fixed effects, we require each IFRS country to have at least one debt
issue in each of the pre-adoption and post-adoption periods, and correspondingly require each
non-IFRS country to have at least two debt issues. This results in a sample of 18,284
observations (10,865 loans and 7,419 bonds).
The final decision is whether to exclude US firms from the control group. Other
things equal, expanding the size of the control group is desirable. There are two offsetting
disadvantages. First, in September 2002, FASB and IASB formalized the “Norwalk
Agreement,” under which they agreed to work toward converging US GAAP and IFRS. Prior
to that point, the US had already moved substantially toward the fair value orientation
imposed by IFRS.17
This suggests that including US in the control group could taint the
control with the treatment effect.18
Second, US firms are larger in number and they also
attract better coverage from the data vendors, so they are disproportionately represented and
could unduly influence the results. Our data include more than 14,000 debt issuances by US
firms, but only 2,712 issuances by firms in other non-IFRS countries and 1,479 debt
issuances in the IFRS treatment sample. We balance these considerations by randomly
selecting US observations until they comprise one third of the total control, and by separately
A1) to identify firm-years reporting under IFRS. In the Internet Appendix, we also directly use the hand-
collected data in Daske et al. (2013) and analyze voluntary adopters separately (Table IA2). 17
Demerjian et al. (2015) observe that “In the years subsequent to adoption of SFAS 115, FASB has moved
increasingly towards fair value accounting. This movement has largely departed from rules requiring that fair
values be based on prices generated by organized exchanges. Examples include mortgage servicing rights
(SFAS 122 / ASC 948), hedging transactions (SFAS 133 / ASC 815), and securitizations (SFAS 156 / ASC
860). Standards related to impairments, such as for goodwill (SFAS 142 / ASC 350) and fixed assets (SFAS 144
/ ASC 360), have also expanded the use of estimated fair values, where carrying values are based on
management’s estimated market values.” SFAS 115 mandated fair valuation of marketable securities in 1993. 18
Consistent with tainting, we report below that including US firms in the control sample generally weakens the
statistical significance of IFRS-adoption effects, but largely leaves our conclusions unaffected.

19
reporting results without US issuances in the control.19
The final sample comprises 5,547 observations (1,698 loans and 3,849 bonds),
including1,479 debt issues (273 loans and 1,206 bonds) from 22 IFRS adoption countries and
4,069 debt issues (1,425 loans and 2,643 bonds) from 21 non-IFRS adoption countries.
A potential concern with our analysis is that it could be affected by endogenous
changes in the data vendors’ coverage of covenants. This concern is to a degree mitigated by
collecting data from a variety of sources, as it is unlikely that all vendors change coverage
simultaneously in the same direction. The difference-in-difference design also assuages this
concern. Moreover, as reported later, accounting covenant use is not affected for firms that
adopt IFRS on a different date.
All non-ratio accounting variables are converted from local currencies to US dollars
using the exchange rate at the fiscal year end. For debt denominated in local currencies, the
borrowing amount is converted into US dollars using the exchange rate at the issue date. All
continuous variables are Winsorized at their 1 and 99 percentage levels.
Table 1 reports the distribution of the primary sample of debt issues by country. For
the loan sample, UK occupies 25% of the treatment group and US and Taiwan dominate the
control group. For the bond sample, 47% of the treatment group are from UK and France,
while within the control group, 78% of the observations are from US, Japan, and Canada.
4. Results
4.1 Sample statistics
Panel A of Table 1 reports, by country the IFRS adoption date, the sample frequency
of debt issues with accounting covenants (the mean of D_ACov) and the intensity of use,
19
At the other extreme, when the entire US sample is the only control, results similar to Table 4 are obtained,
though the coefficients of interest in OLS accounting-covenant intensity regressions are not statistically
significant for loans, consistent with control sample tainting due to prior IFRS-US GAAP convergence. These
results are reported in Internet Appendix, Table IA7.

20
defined as the average number of accounting covenants (the mean of Num_ACov). At least
two-thirds of loans issued in most IFRS-adoption countries and in all non-IFRS-adoption
countries contain at least one accounting covenants. The average number of accounting
covenants ranges from one to three across the sample countries. There is larger variation in
use across countries for bond sample. Among IFRS-adoption countries, more than 40% of
bonds issued by firms in Israel, Philippines, Singapore, and South Africa contain accounting
covenants, while none of the bonds issued in Denmark, Finland, New Zealand, or Portugal
contain any accounting covenants. Among non-IFRS-adoption countries, more than 70% of
bonds issued by firms in Indonesia, Malaysia, and Thailand contain accounting covenants,
with the average contract containing two to three, while no bond issued in Cayman Islands,
China, Russia, or Taiwan contains any. For both IFRS-adoption and non-IFRS-adoption
countries, loans generally contain more accounting covenants than bonds.
Panel B reports country-level institutional variables we use in cross-sectional tests
within the IFRS-adopting treatment sample. First, we report two measures of the distance
between prior domestic accounting standards and IFRS. The Bae Total Index is constructed
from Bae et al. (2008, Table 1). Using the Nobes (2001) GAAP 2001 survey, they assign a
score of 1 for each of 21 key properties of domestic reporting that does not conform to IAS,
the predecessor of IFRS.20
We also use a modified index, Bae Acct Index, computed as the
sum of the scores on those items that directly affect financial statement numbers, excluding
requirements on non-numerical disclosure that are not used in debt covenants.21
The two
20
Nobes’ (2001) survey is based on accounting standards effective on Dec. 31, 2001 and does not reflect any
subsequent revisions. After the 2002 EU vote to adopt IFRS, several IFRS-adoption countries changed their
domestic standards to ease the transition to IFRS. Also, the survey ignores differences that might arise from IAS
permitting alternative policies, but national rules allowing only one of those alternatives or providing more
detailed or more restrictive standards. These factors are expected to weaken our estimates of adoption effects. 21
Items excluded from Bae et al. (2008) are Item 1 (IAS No. 1.7: Do not require a primary statement of changes
in equity), Item 3 (IAS No. 14: Require no or very limited segment reporting), Item 7 (IAS No. 2.36: Do not
require disclosure of FIFO inventory cost when LIFO is used), Item 9 (IAS No. 24: Have no or very limited
disclosure requirements for related-party transactions), Item 11 (IAS No. 32.77: Do not require the disclosure of
the fair value of financial assets and liabilities), Item 12 (IAS No. 35: Do not have rules outlining the treatment
of discontinued operations), and Item 19 (IAS No. 7: Do not require a statement of cash flow). The above items
are listed in Nobes (2001) in the section titled “There are no specific rules requiring disclosures of.”

21
indexes are highly correlated (Pearson correlation = 0.96). Higher index values indicate
greater differences between prior domestic rules and IFRS. Based on these indexes,
Luxembourg and Spain had the biggest difference between prior local rules and IFRS, while
South Africa, Singapore, United Kingdom, and Ireland had the least differences. The sample
medians for the Bae Total Index and Bae Acct Index are 10 and 6.5, respectively (above and
below or equal to median scores are denoted in the table by H and L).
Results based on an index of only those differences between prior local rules and
IFRS pertaining to using fair value accounting (FV Index) are similar to those based on all
rule differences, which is not surprising because the indexes are highly correlated (Pearson
correlation > 0.83).22
This is consistent with, but does not prove, that a primary change
introduced by IFRS is an increased emphasis on fair value accounting.
Panel B also reports, for IFRS adopting countries, the index of regulatory quality in
Kaufmann et al. (2009). As in Christensen et al. (2013a, 2013b), we use the index to proxy
for a country’s IFRS enforcement level. We classify countries as high or low regulatory
quality.
Table 2 reports accounting covenant use by calendar year of debt issuance. Figure 2,
Panels A and B plot the frequency and average number of accounting covenants,
respectively. The vertical lines indicate the date of IFRS adoption for most countries in our
sample, December 2005, and the start of recent financial crisis, July 2007. Excluding the
three countries that did not adopt IFRS in 2005 (viz., Israel, New Zealand, and Singapore),
which account for less than 5% of the sample, has little impact in this figure or the
conclusions drawn in the paper.
Prior to 2006, IFRS countries and non-IFRS countries are roughly comparable in
accounting covenant use. For the combined loan and bond sample, D_ACov appears steady
between 40% and 67% in IFRS countries and between 50% and 60% in non-IFRS countries.
22
The value of FV Index by country and results using this index are reported in Internet Appendix, Table IA12.

22
From 2006 onward, the usage rates diverge. Both the frequency and intensity of accounting
covenant use decline substantially in IFRS-adoption countries in 2006 and are relatively
constant subsequently. In IFRS-adoption countries, debt issued with accounting covenants
declines sharply in one year, from 45% in 2005 to 20% in 2006. In contrast, the
corresponding numbers for non-IFRS countries are 50% and 47%, respectively.23
This pattern
is similar for loans and bonds. IFRS adoption is associated with substantially reduced
accounting covenant use.24
Table 2 also reports a noticeable decrease after 2005 in the number of loans in IFRS
countries, but not in non-IFRS countries. In contrast, bond issuances increase in both the
treatment and control samples. Florou and Kosi (2015) attribute these trends to improved
transparency under IFRS, though equity market research indicates the transparency benefits
of IFRS are not large. However, these trends are also consistent with loans being more
sensitive to IFRS-induced reductions in covenant effectiveness and consequently losing their
comparative advantage relative to bonds, viz. easier renegotiation conditional on contractible
variables triggering covenants.
Table 3, Panels A and B report summary statistics for the debt-specific variables for
the treatment and control samples, aggregated across all years separately in the pre- and post-
adoption periods.25
Panel A reports statistics for loans. In IFRS-adopting countries, there are
accounting covenants in 94% of loans issued in the pre-adoption period, but only 77% in the
post-adoption period. The average number of accounting covenants (Num_ACov) included in
loans declines from 2.4 to 1.6 around IFRS adoption. These differences are statistically
significant. While these decreases by themselves are consistent with IFRS adversely affecting
23
The correlation between IFRS and non-IFRS countries of average D_ACov (Num_ACov) is 0.62 (0.61) from
2001 to 2005 and -0.43 (-0.32) from 2006 to 2010. 24
This would increase the monitoring costs for loans, leading to higher interest rates. Consistent with this
expectation, Florou and Kosi (2015) find a positive coefficient on IFRS adoption in regressions of loan interest
rates, but it is statistically insignificant. Chen et al. (2015) report a statistically significant increase in loan rates. 25
For non-IFRS countries, we define the “post-adoption” period as fiscal years ending on or after December 31,
2005, since the majority of our treatment countries adopted IFRS in 2005.

23
debt covenant use, we are careful not to draw strong inference from univariate analyses of
treatment firms alone because the characteristics of debt issuances in the pre- and post-IFRS
periods are then not held constant. Our conclusions are based on difference-in-difference
analyses and on multivariate analyses that control for firm and debt characteristics.
In contrast to the declines in accounting covenant usage and intensity for IFRS firms,
there is an increase (insignificant change) in usage of accounting covenants (accounting
covenant intensity) in loans issued in non-IFRS countries. In these countries, over the same
period the percentage of loans with accounting covenants increases marginally from 94% to
98%, while the average Num_ACov is largely unchanged at approximately 2.8 covenants per
loan. These statistics indicate that the decline in accounting covenants around IFRS adoption
is not part of a global trend. The last column of Table 3, Panel A reports difference-in-
difference statistics, comparing the change in covenant usage between IFRS and non-IFRS
countries. The mean difference-in-difference values for D_ACov and for Num_ACov are -
0.216 (t-stat = -3.18) and -0.887 (t-stat = -4.17).
Table 3, Panel B reports equivalent statistics for bonds. In IFRS-adopting countries,
we observe a significant decrease in both the frequency and intensity of accounting covenant
use in bond contracts. In non-IFRS countries, there is a significant decrease in the average
number (intensity) of accounting covenants. The mean difference-in-difference is negative
and significant (insignificant) for accounting covenant frequency (intensity). As noted above,
the changes in accounting covenant use in bonds are smaller than those in loans.
These difference-in-difference results from univariate analyses provide preliminary
evidence that IFRS adoption leads to a decline in both the frequency and intensity of
accounting covenant use in debt contracts.

24
4.2 Accounting covenant use pre- and post-IFRS: Regression model results
We use the following difference-in-difference models to estimate the change in
accounting covenant use around mandatory IFRS adoption, where debt issued in non-IFRS
mandating countries is the control sample:
Pr(D_ACov=1) = β1 Post_IFRS +Control Variables + Country F. E. + Year F. E. (1)
Log(1+Num_ACov) = β1 Post_IFRS +Control Variables + Country F. E. + Year F. E. (2)
Post_IFRS is an indicator variable set to one for debt issued by firms in IFRS-mandating
countries in fiscal years ending on or after the mandatory adoption date in the firm’s country.
D_ACov and Num_ACov are alternative measures of accounting covenant use. Equation (1) is
a Probit model examining the presence of accounting covenants in debt contracts. D_ACov is
an indicator variable defined as one if the debt contract contains at least one accounting-based
covenant, and zero otherwise.26
Equation (2) is an OLS model examining the intensity of
accounting covenant use.27
Log(1+Num_ACov) is the logarithm of one plus the count of the
total number of accounting-based covenants. In both models, a negative (positive) β1
indicates a decline (increase) in accounting covenant use after mandatory IFRS adoption.
We include fixed effects for country and the calendar year of the debt issuance date,
to control for unobserved country-specific and year-specific factors.28
We control for firm
and debt characteristics that might affect accounting covenant use. Firms that are smaller,
higher-growth, less profitable, more levered or have fewer tangible assets likely have higher
26
For public bonds, we follow Nikolaev (2010) and identify declining net worth, indebtedness, leverage test,
maintenance net worth, net earnings test, and fixed charge coverage covenants as accounting-based. For private
loans, we follow Demerjian (2011) and Christensen and Nikolaev (2012) and identify interest coverage, fixed
charge coverage, debt-to-earnings, leverage, net worth, and current ratio covenants as accounting-based. We
also include dividend restrictions as accounting-based covenants, as they typically are based on the amount of
accounting earnings or retained earnings (Healy and Palepu, 1990). As reported later, our conclusions are not
sensitive to excluding dividend restrictions from accounting-based covenants. 27
The main conclusions are unaffected when Equation (2) is estimated using Poisson or Negative Binomial
models. These results are reported in Internet Appendix, Table IA10. 28
Replacing country fixed-effects with country-level characteristics does not change the conclusions. These
results are reported in Internet Appendix, Table IA12. The conclusions also are not affected by controlling for
the total amount of debt issued in a country-year, as a proxy for debt-financing demand. These results are
reported in Internet Appendix, Table IA6. Restricting the analysis to the pre-financial crisis period (defined as
ending in either June 2007 or September 2008) does not change our conclusions, as reported in Internet
Appendix Table, IA9.

25
agency costs of debt and hence greater demand for covenants. 29
Consequently, we control
for firm size (logarithm of market value of equity), market-to-book ratio (market value of
equity divided by book value of equity), asset tangibility (net PP&E divided by total assets),
profitability (EBITDA divided by total assets), and leverage (total debt divided by total
assets). The control variables are measured in the fiscal year immediately before debt
issuance date. We include an indicator variable for the availability of US filings, since
borrowers with public debt or equity traded in the US might be subject to different financial
reporting incentives and face different agency costs.30
To control for debt-level determinants of covenant use, we include debt size
(borrowing amount), maturity (number of months to maturity), yield spread (offering yield to
maturity over benchmark risk-free rate)31
, and indicators for secured debt, availability of
credit ratings, and investment grade.32
In robustness analysis reported in the Internet Appendix, we allow the regression
coefficients to vary between IFRS and non-IFRS countries to control for institutional
differences and for changes in firm-level measures upon IFRS adoption. Our conclusions are
unchanged (Table IA11).
We estimate standard errors clustered at the 2-digit SIC industry level, chosen as a
trade-off between clustering at the most aggregate level possible versus having sufficient
29
Leverage reflects prior debt contracts with covenants or prior lending relationships, reducing the demand for
covenants in new issues, though De Franco et al. (2013) report covenant use is persistent over time. Yi (2005)
shows that the number of covenants in a loan contract decreases with the intensity of the lending relationship.
Beatty et al. (2012) find that public bondholders may delegate borrower monitoring to existing senior creditors. 30
For example, Ball et al. (2013) find that public bonds issued by foreign firms cross-listed in the US have
lower interest rates. In robustness analysis included in Internet Appendix, Table IA12, we also include a dummy
variable for the availability of London Stock Exchange filings, and our conclusions are unchanged. 31
For public bonds, the proxy for the benchmark risk-free rate is the three-month LIBOR (interbank) rate at the
country where the issuing firm is domiciled, obtained from Datastream. If the LIBOR rate is not available, we
use the local Treasury bill or government bond rate obtained from IMF. For private loans, consistent with prior
literature, we directly use the variable all-in-drawn. Results are not sensitive to the choice of the benchmark rate. 32
We use the average credit rating of the issue provided by Standard & Poor, Moody’s, and Fitch. If a rating is
not available, we use the average rating for the issuer within one year of the issuance date. Credit ratings of
“BBB” or above for Standard & Poor and Fitch and “Baa” or above for Moody’s are identified as investment
grade. As these debt characteristics are potentially simultaneously determined with covenant usage, in the
robustness analysis included in the Internet Appendix, we evaluate the sensitivity of the results using three-
stage-least-squares (Table IA3).

26
clusters to consistently estimate the within cluster variance-covariance matrix. Although our
sample includes 43 countries, after imposing data requirements and country-level fixed
effects in our regressions, some regressions would have fewer than 30 clusters at the country
level. Petersen (2009) shows that standard errors based on fewer than approximately 40
clusters suffer from small sample bias, so we do not use country-level clustering for the main
tables. However, as reported later, clustering at country-level yields similar conclusions, as
does two-way clustering by industry and year or country and year. Table IA8 of the Internet
Appendix reports results from alternative choices for clustering and fixed effects.
Public bond contracts and syndicated bank loans generally differ in borrowing
incentives, monitoring, and contractual features. Syndicated bank lenders can monitor
borrowers and renegotiate loans at lower cost than public bondholders, due to concentrated
loan ownership, financial expertise, and access to private information (Smith and Warner,
1979). Thus, bank loans typically have a larger number of tightly set accounting covenants
that are more frequently violated and renegotiated (Nini et al., 2012). In addition, public
bonds often are subordinated and contain callable and/or convertible features, while
syndicated bank loans often involve revolving credit or include performance pricing. These
differences could interact with the effects of IFRS adoption, so we report all results
separately for loans and bonds, as well as for the combined loan and bond sample with an
indicator variable for loans. For the loan sample, we control for loan-specific features
(indicators for revolving loan, term loan, and performance pricing feature). For the bond
sample, we control for bond-specific features (indicators for subordinated bond, callable
bond, and convertible bond).
Table 4 reports marginal effects for Equation (1) and regression coefficients for
Equation (2). Consistent with the prediction that accounting covenant use declines after
mandatory IFRS adoption, the coefficients on Post_IFRS are negative and significant in all
specifications. When both loan and bond samples are considered together, the marginal effect

27
of Post_IFRS on D_ACov is -0.264 (t-stat = -4.63), indicating that IFRS adoption lowered the
likelihood of at least one accounting covenant in a new debt issue by 26.4%, controlling for
other factors. A similar decline is reflected in the OLS regressions of accounting covenant
intensity, where the coefficient on Post_IFRS is -0.141 (t-stat = -3.98). Column (2) for loans
and Column (3) for bonds show that IFRS adoption is associated with significant accounting
covenant-frequency declines. The marginal effect of Post_IFRS is -0.175 (t-stat = -5.47) for
loans and is -0.110 (t-stat = -4.01) for bonds in the Probit regressions. Similar results are
shown in Columns (5) and (6) for accounting covenant intensity.
The coefficients on the firm and debt control variables generally are consistent with
expectations. The negative coefficient on firm size is consistent with small firms facing
higher agency costs of debt and therefore having more accounting covenants. The positive
coefficient on ROA is consistent with the findings in Nikolaev (2010) for US bonds. The
positive coefficient could indicate that accounting covenants, particularly those based on
earnings, are less effective for less profitable or loss-making firms, or that accounting
covenants could be unduly restrictive for such firms. Similarly, the negative coefficient on
the market-to-book ratio could indicate that earnings and balance sheet data are less efficient
measures for growth firms, or that such firms need more operating flexibility. The coefficient
on leverage tends to be insignificant, suggesting that more borrowing by itself does not affect
accounting covenant use.
Among debt-level control variables, the coefficient on yield spread is significantly
positive for bond issuances, while those on the investment grade indicator for bonds are
significantly negative. D_Rating has a significantly positive coefficient for bonds, suggesting
that rated bonds include more accounting covenants. Maturity is negatively related to bond
covenants, but positively to loan covenants. We caution against drawing strong inferences
from these coefficients due to potential endogenous effects. Our conclusions on IFRS
adoption effects are unaffected by excluding these debt-level controls (reported in Internet

28
Appendix, Table IA11).
The pseudo R2 in Column (1) and Adjusted R
2 in Column (4) are at least 60%,
suggesting that the models explain a substantial part of the variation in accounting covenant
use. In additional analysis excluding all controls and fixed effects (reported in Internet
Appendix, Table IA11), we confirm that Post_IFRS alone explains a significant amount of
variation, with a pseudo R2 of 6.0% in Column (1) and adjusted R
2 of 7.5% in Column (4).
4.3 Robustness of the regression model
As discussed earlier, including US issuances in the control sample could taint it with
the treatment (IFRS adoption) effect, because the FASB-IASB convergence project moved
US reporting toward IFRS prior to the sample period. To test this, in Panel B of Table 4 we
re-estimate Equations (1) and (2) after dropping US firms from the control. The estimated
coefficient and t-statistic magnitudes for Post_IFRS generally increase, despite the reduction
in control sample size. For example, for the combined loans and bonds sample in Column (4),
the coefficient on Post_IFRS decreases from -0.14 to -0.18 and the corresponding t-statistic
decreases from -3.98 to -4.93, consistent with tainting. Nevertheless, the results are similar.
To address the concern that the results might be driven by different sample
compositions in the pre- and post-adoption periods, we repeat the analysis for a constant
sample of firm issuing debt in both the pre- and post-adoption periods, excluding US firms
from the control. The resulting sample size is 3,283 debt issues of which 920 are loans and
2,363 are bonds. The results, reported in Table 4, Panel C, show that the main conclusions are
unchanged. The coefficients on Post_IFRS are negative and significant in all model
specifications and are comparable to those reported in Panel B. In additional robustness
analysis, we also find similar results by requiring a constant sample and keeping US firms in
the analysis (Internet Appendix, Table IA7). Differences between the pre- and post-IFRS
periods in the types of firms raising debt do not appear to explain our results.
Results from using alternative definitions of accounting covenants are reported in

29
Table 4, Panel D. First, we estimate the regressions separately for income statement
(performance) and balance sheet (capital) covenants, following Christensen and Nikolaev
(2012). We report only the coefficients on Post_IFRS. There is a significant decline in use of
both categories of covenants following IFRS adoption, with the exception of balance sheet
covenants in loans. Second, we exclude dividend restriction covenants from the definition of
accounting covenants, because dividend decisions, while related to earnings, are not
completely related on a period-to-period basis with accounting numbers. The results reported
in Table 4, Panel E continue to show a negative and significant coefficient on Post_IFRS.
We also apply the method of Heckman et al. (1997, 1998), estimating regressions
based on a Kernel propensity score matching combined with a difference-in-difference
analysis between the matched samples.33
This controls for both observable differences and
time-invariant unobservable differences between the treatment and control groups. The
results in Table 4, Panel E indicate that our conclusions remain unchanged.
Finally, we examine the sensitivity of our results to alternative measures of standard
errors, using a bootstrap method that clusters standard errors at the industry level and
alternatively by clustering at the country level. The results are similar to those reported in
Panel A except that the t-statistics are slightly lower.34
We advise caution when interpreting
the loan regressions clustered at the country level because they have as few as 25 clusters,
which affects both the power and the unbiasedness of these standard errors.
The results are also robust to replacing the country fixed effects with firm-level fixed
effects or additionally including industry-level fixed effects, and also to including country-
level controls for legal origin, creditor rights index, and importance of the country’s private
33
We match firms in the treatment and control samples on Kernel propensity scores calculated using all firm-
and debt-specific controls and year fixed effects. We then conduct a standard two-way difference-in-difference
analysis by taking into account the propensity scores. Countries that adopted IFRS in years other than 2005 are
excluded. For an application of the Heckman et al. (1997, 1998) approach in the Accounting literature and for
details of the implementation of this approach, see Shivakumar et al. (2014). We obtain qualitatively similar
conclusions when we employ regular propensity matching (results reported in Internet Appendix, Table IA9.) 34
When using the Kernel propensity score matching and bootstrap method, we can only fit OLS regressions, so
the coefficients in regressions on D_ACov are not directly comparable with those in Table 4, Panel A.

30
debt market (results reported in Internet Appendix, Tables IA8 and IA12, respectively).
4.4 Effect of the difference between IFRS and prior domestic standards
If the observed covenant changes are caused by IFRS adoption, they should increase
with the degree to which IFRS alters a country’s accounting standards. To test this
implication, we classify IFRS countries as “High GAAP difference” and “Low GAAP
difference” based on whether their Bae Total Index or Bae Acct Index is above or below the
median. We then estimate whether the coefficient on Post_IFRS varies between the groups.
Results are reported in Table 5.35
The coefficients on Post_IFRS are negative for both
groups for both loans and bonds and in all model specifications. The magnitudes of the
coefficients for the “Low-GAAP-difference” group are lower than those for the “High-
GAAP-difference” group in all specifications (except for one tie), and in many cases by a
substantial margin. The likelihood of reduced accounting covenant use thus was an increasing
function of how radical a departure IFRS was from prior domestic standards. The reduction
in accounting covenant use is more pronounced in loans, one comparative advantage of
which (relative to bonds) is ease of renegotiation when triggered by covenant violations.
Loans thus are more affected by perceived reductions in accounting covenant effectiveness.
4.5 Banks versus Non-banks
If fair value accounting plays an important role in the observed decline in accounting
covenant use following IFRS adoption, the decline should be more pronounced in firms with
a higher proportion of financial assets and financial liabilities on their balance sheets. These
firms’ financial statements are more affected by the change to fair value standards. We test
this hypothesis by comparing debt issued by banks with issuances by non-banks. As
Armstrong et al. (2010) note, fair value standards (primarily IAS 39 and to a lesser degree
IAS 32) have a larger effect on banks. This presumably underlies the strong opposition of EU
banks to these standards before the eventual modification of IAS 39 in 2005.
35
Similar results are observed in a constant sample, excluding US from the control and in a propensity-score-
matched sample (results reported in Internet Appendix, Table IA13).

31
We add financial firms to the sample and re-estimate Equations (1) and (2), including
all controls but allowing the coefficient on Post_IFRS to differ between banks and non-banks.
As in Armstrong et al. (2010), banks are defined as firms with a 2-digit SIC code of 60 or 61.
Results are reported in Table 6.36
The central result is that in all regressions of D_ACov, the
coefficients are significantly more negative for banks than non-banks. For loans, the
coefficients on Post_IFRS in the regressions of D_ACov are -0.64 for banks and -0.20 for
non-banks. The difference is significant, with a p-value of 0.03. This implies that the
reduction in accounting covenant use in loans is three times as large in banks. In regressions
of accounting intensity (Num_Acov) for loans, the coefficient on Post_IFRS again is
significantly more negative for banks. The corresponding coefficient for bonds is marginally
larger for banks, but the test has low power. There are only four bonds issued by IFRS banks
that have more than one accounting covenant, consistent with bonds generally using them
less frequently.37
In additional analysis using Poisson and Negative Binomial regression
models for Num_ACov, we find the coefficients on Post_IFRS are significantly more negative
for banks than for non-banks in all samples (reported in Internet Appendix, Table IA14).
The finding that banks are more likely than other firms to reduce accounting
covenants after IFRS adoption, especially in loan contracts, is consistent with fair value
accounting being an important contributor to the post-IFRS reduction in accounting covenant
use generally. As always, this result could reflect differences between banks and non-banks
that are not captured in the control variables.
The stronger results in Table 4 when the US is omitted from the control sample also
are consistent with fair value accounting being an important contributor to reduced
accounting covenant use. Prior to the treatment sample adopting IFRS, the US had a
substantial fair value orientation (Demerjian et al., 2015).
36
Similar results are obtained in a constant sample excluding US firms, with weakened statistical significance
(results reported in Internet Appendix, Table IA14). 37
The coefficients for non-banks are not directly comparable to those in baseline analysis, because non-banks
here include firms in financial industries but not operating as banks.

32
4.6 Transparency and non-accounting covenant use in loans and bonds
The observed post-IFRS reduction in accounting covenants could be due to reduced
contractibility of financial statement information or to improved financial transparency
(which we interpret as informativeness). It is not possible to precisely separate these effects
in the data, but some insight can be obtained from observing associated changes in non-
accounting covenant use. If IFRS adoption improved transparency, and thereby reduced
lenders’ uncertainty about borrowers’ default risk, it would attenuate the demand from
lenders to protect themselves through covenants. There would be increased use of
information to pre-screen borrowers, and correspondingly reduced demand for all types of
covenants, both accounting and non-accounting. In contrast, if IFRS reduced the
contractibility of financial statement variables, it would reduce the demand for accounting
covenants and increase the demand for non-accounting covenants, to the extent they are
substitutes. These transparency and contractibility effects are not mutually exclusive, so we
attempt to evaluate their relative importance.
Furthermore, as noted in Section 2.4, the relative importance of informativeness and
contractibility could vary between bonds and loans. Bonds are more widely held than loans,
and hence more costly to renegotiate, so they generally rely more on pre-screening and less
on enforceable covenant rights that trigger renegotiation. Enhanced pre-screening could be
expected to reduce their use of both accounting and non-accounting covenants. Loans would
also benefit from increased pre-screening of borrowers, but generally rely more on covenants,
so in addition they could be expected to respond to reduced financial statement contractibility
by substituting from accounting to non-accounting covenants.
To examine these predictions, we identify four common types of non-accounting
covenants based on their functionality: investment restrictions, asset sale restrictions, equity
issue restrictions, and debt issue restrictions, as in Bratton (2006). We also examine

33
prepayment restrictions that are used in loans, as well as cross default clauses, merger
restrictions, and prior claim restrictions that are used in bonds.
Panels A and B of Table 7 report separate difference-in-difference regressions results
for loans and bonds, respectively. In the first five columns of Panel A, the dependent variable
is defined as one if the loan contract has at least one covenant of the specified type, and zero
otherwise. Four of the five covenant types exhibit increases, with equity and debt restrictions
increasing significantly at the five and ten percent levels, respectively. The last two columns
report an Ordered Probit regression where the dependent variable is the sum of the five
dummies defined above (NACov_Types), and an OLS regression of the accounting covenant
to non-accounting covenant ratio. Overall, Panel A shows weak evidence of substitution of
accounting covenants for non-accounting covenants in loans.
Panel C of Table 7 shows that the overall evidence of substitution from accounting to
non-accounting covenants in loans appears weak due to combining heterogeneous effects.
Significant substitution occurs in “High GAAP difference” countries, but there is no evident
increase in non-accounting covenants in “Low GAAP difference countries”. The coefficient
on POST_IFRSIndex_L is insignificant in all regressions, indicating that substitution toward
non-accounting-covenants was associated with the changes brought through IFRS adoption.38
The results for bonds are less straightforward. The difference-in-difference
regressions in Table 7, Panel B reveal that six of the seven non-accounting covenant
categories decline in the post-IFRS period, three significantly. The exception is merger
restrictions, which increase.39
The Ordered Probit regression of the combined seven non-
accounting covenants indicates a significant decline. However, the OLS regression reveals no
38
The marginal effect implies the probabilities of zero, one, two, three, four, and five non-accounting covenants
are 32%, 19%, 15%, 19%, 11%, and 3% (insignificant), respectively, for High-GAAP-difference countries after
IFRS is adopted and when other variables are set at their mean values. In contrast, the equivalent probabilities
for Low-GAAP-difference countries are 82%, 10%, 5% (insignificant), 2% (insignificant), 1% (insignificant),
and 0% (insignificant). Due to the small sample size, we are unable to estimate the coefficient on Post_IFRS for
the high index group in the regression on prepayment restrictions. 39
The sample size is smaller for some regressions of non-accounting covenants in the bond sample due to
missing information on these covenant types from some of the data sources.

34
evidence of the ratio of accounting to non-accounting covenants in bonds changing (i.e., of
substitution).
Panel D shows that the observed changes in bonds primarily occur in countries that
are least affected by IFRS adoption. For example, the Ordered Probit regression of the seven
non-accounting covenants combined reveals no significant change around IFRS adoption in
‘High GAAP difference’ countries, but a significant decline for ‘Low GAAP difference.’40
If
the decline in non-accounting covenant use among bonds is associated with IFRS adoption,
then why does it occur mainly in countries that are least affected by IFRS adoption?
The answer to this question lies in the controls. We repeated the analyses after
excluding US firms from the control sample to avoid the potential tainting from US and IFRS
convergence. To control for differences in types of firms issuing bonds in the pre- and post-
IFRS periods, we also conducted a propensity score-matching analysis.41
The analyses reveal
that, following IFRS adoption, non-accounting covenants (NACov_Types) actually increase
for firms in ‘High GAAP difference’ countries, while there is no significant change for ‘Low
GAAP difference’ countries. These results for bonds are more in line with those observed for
loans in Table 7, Panel C. The OLS analysis of the accounting to non-accounting covenants
ratio continues to reveal insignificant evidence of substitution effect. These methodological
choices do not affect the conclusions reported above for the loan sample.
Further, when we analyse a constant sample of treatment firms, for loans we find a
significantly positive coefficient on Post_IFRS in the Ordered Probit for NACov_Types and a
significantly negative coefficient in the OLS regression of the accounting to non-accounting
covenants ratio. The corresponding coefficients are insignificant in the bond sample (results
reported in Internet Appendix, Table IA15).
40
Due to the small sample size, we are unable to estimate the coefficient on Post_IFRS for the low index group
in the regressions on investment, equity issue, and debt issue restrictions. 41
We are unable to estimate a Kernel propensity score matching as in Table 4, Panel E and use regular
Propensity score matching. These results are reported in Internet Appendix, Table IA15.

35
Substitution of accounting for non-accounting covenants might not be observed in the
bond sample due to ambiguity in how the data providers classify them. For example, a
restriction on issuing additional debt if the fixed charge coverage ratio is below 2:1 could be
flagged as a fixed charge coverage covenant (classified as accounting) or as a debt issue
restriction covenant (classified as non-accounting). The data providers confirm this is not a
concern for loans, and we observe substitution for non-accounting covenants in a hand-
collected bond covenant sample (reported in Internet Appendix, Table IA4) that is free of this
ambiguity.
It also is possible that increased transparency could affect covenant use in loan
contracts by affecting the structure of loan syndicates. For example, Ball et al. (2008) find
that improvements in the ability of accounting numbers to predict borrower credit quality
leads to a decline in the syndicate share held by the lead arranger. Increased transparency also
could lead to loans being more widely held, making their contracts more like bonds, using
fewer accounting and more non-accounting covenants. To test this, we studied the number of
lenders in a syndicate, lender share concentration, and the fraction of loans held by the lead
arranger. Difference-in-difference regressions (reported in Internet Appendix, Table IA16)
reveal no evidence of changes in syndicate structure following IFRS adoption. We also were
unable to uncover any (empirical or anecdotal) evidence to indicate major structural changes
in the loan market, particularly in Europe, around IFRS introduction.42
In sum, we observe increases in non-accounting covenant use in loans after IFRS
adoption, inconsistent with transparency being the important driving force since that would
predict a decline in all types of covenants. Significant substitution occurs in countries with
the greatest distance between IFRS and prior domestic standards, indicating that substitution
was associated with the changes associated with IFRS adoption. The mixed results for the
bond sample do not paint a clear picture of either increased transparency or reduced
42
While covenant-lite loans (i.e., loans with fewer accounting-based maintenance covenants) have increased in
Europe, these have occurred mainly after 2011, which is beyond our sample period.

36
contractibility. We do see a significant increase in non-accounting covenants for countries
that were most affected by IFRS adoption once we exclude US firms from the control sample
or control for differences in characteristics of firms issuing bonds before and after IFRS
adoption, which also is inconsistent with transparency being an important driving force.
Thus, even in the bond sample there is little evidence to support the argument that IFRS
improved transparency, and some evidence against it.
Although we do not find clear evidence to support the contention that IFRS improved
transparency for lenders, this conclusion is not very different to those made in recent studies
that conclude that transparency benefits of IFRS are not substantial in the equity markets
(Daske et al., 2008; Christensen et al., 2013a; Daske et al., 2013; Cascino and Gassen, 2014).
Nevertheless, we caution that our empirical distinction between contractibility and
transparency effects is not totally clear.
4.7 Effect on covenants of increased competition for domestic banks
Another alternative explanation for the observed decrease in accounting covenants,
especially for the private loan sample, is increased globalization of the loan market, which
could increase competition among capital providers and cause a “race to the bottom.” Facing
increased competition from foreign banks, domestic lenders could reduce the number of
covenants to attract borrowers. This argument does not explain the substitution between
accounting and non-accounting covenants observed in our sample. Nevertheless, we test the
proposition by examining the differential effect of IFRS on the domestic versus international
loans in our sample. We follow Brown’s (2013) methodology and define a loan as
international if the borrower and the lead lender/arranger’s parent firm are from different
countries. Among the 1,698 loans in our main sample, we are able to determine the
geographic location of 796 loans, among which we identify 288 as international and 508 as
domestic. We then repeat the baseline analysis by adding an indicator for international loans

37
(International) and its interaction term with Post_IFRS dummy (Post_IFRS*International).
Consistent with the findings in Brown (2013), we observe a negative coefficient on
International and a positive coefficient on Post_IFRS*International. However, neither
coefficient is statistically significant. These results suggest that the post-IFRS reduction in
accounting covenant use in our loan sample is not due to increased competition among banks,
although we are aware that the lack of significant results could be due to low statistical
power.
4.8 Effect of enforcement on accounting covenant use
Mere adoption of standards is not expected to affect financial reporting unless
combined with incentives to do so, including effective enforcement by monitors such as
auditors, boards and analysts or by regulatory bodies (e.g., Ball, 2001; Ball et al., 2003).
Consistent with this argument, Daske et al. (2008) find that the equity market benefits of
IFRS adoption are observed only in countries where firms have incentives to be transparent
and where legal enforcement is strong. Byard et al. (2011) find that IFRS adoption is
associated with improvements in equity analysts’ information environment only in countries
with strong enforcement and where IFRS significantly differs from local GAAP. Christensen
et al. (2013a) document that increases in equity market liquidity around IFRS adoption are
restricted to countries that concurrently improved their financial reporting enforcement and
conclude that controlling for factors associated with the enforcement changes can be
important in studies investigating IFRS effects. These studies address equity market effects.
The implications of stronger enforcement on debt contracting are not clear. One could
argue that stronger enforcement mitigates the opportunistic use of flexibility accorded
borrowers under IFRS and thereby increases the usefulness of financial statement information
for debt contracting. Alternatively, one could argue that stronger enforcement requires
borrowers to implement fair value accounting and thereby decreases the usefulness of

38
financial statement information for debt contracting. Further, the degree of enforcement does
not affect some limitations of IFRS for debt contracting, including the increased flexibility
IFRS gives to managers in both selecting among and applying its standards, and the increased
rule-making uncertainty that the IASB’s multi-jurisdictional user base implies. All things
considered, the expected effect of enforcement on debt contracting is ambiguous.
We test these opposing views using measures of cross-country variation in
enforcement quality and in enforcement changes concurrent with IFRS adoption. The
country-level measures are reported in Table 1. Initially, we follow Christensen et al. (2013a,
2013b) and use the index of regulatory quality provided by Kaufmann et al. (2009) to classify
countries as high or low quality. We then re-estimate Equations (1) and (2) allowing the
coefficient on Post_IFRS to vary between the two groups.
The results presented in Table 8, Panel A show that the coefficient of interest is
significantly negative for both the high and low regulatory quality groups. In general, there is
little difference in coefficients between the two groups, suggesting that IFRS-adoption by
itself, irrespective of enforcement levels, adversely affects the use of accounting covenants in
debt contracts. The only exception is in the regression of D_ACov for the sample of loans,
where the coefficient on Post_IFRS is significantly more negative for the low-regulatory-
quality countries. This is consistent with IFRS in low-enforcement regimes more adversely
affecting the effectiveness of accounting numbers for use in debt contracts, possibly
reflecting the increased managerial discretion afforded by IFRS domestically.
In additional analysis, we observe significantly negative coefficients of interest in a
constant sample that also excludes US firms from the control group (reported in Internet
Appendix, Table IA17). Moreover, the differences in coefficients between the high- and low-
regulatory-quality groups are insignificant in all regressions except in the regression of
D_ACov for the sample of loans, similar to the results using the full sample.

39
Christensen et al. (2013a) document that equity market effects around IFRS adoption
are confined to a small number of EU countries that concurrently enhanced enforcement. We
test for this effect on debt covenants by allowing the coefficient on Post_IFRS in Equations
(1) and (2) to vary among three groups of countries: Non-EU countries (Post_IFRSnon-EU); EU
countries identified by Christensen et al. (2013a) as changing enforcement concurrently with
IFRS adoption (Post_IFRSEU_ENF); and EU countries that did not change enforcement
concurrently with IFRS adoption (Post_IFRSEU_nonENF). If enforcement changes explain the
observed decline in accounting covenant usage, we expect the coefficient on
Post_IFRSEU_ENF to be significantly negative, and the other two coefficients (particularly,
Post_IFRSEU_nonENF) to be insignificant.
The results are reported in Table 8, Panel B. For the loan sample, we observe a
negative and significant coefficient for EU countries without concurrent enforcement. This
indicates that, even in the absence of any changes in enforcement, IFRS adoption by itself is
associated with a decline in accounting covenants. We cannot estimate the coefficient for
non-EU countries in the regression on D_ACOV due to small variation of the dependent
variable. For the bond sample, we observe a significantly negative coefficient for all three
country groups (EU with concurrent enforcement, Other EU, and Non-EU). Moreover, the
coefficient on Post_IFRS is more negative for EU countries without concurrent enforcement
than for those with concurrent enforcement. The differences in coefficients are statistically
significant for regression of D_ACov. These results suggest that the effects of IFRS are not
restricted to the sample of EU countries with concurrent enforcement changes.
The results in this section are not consistent with the observed decline in accounting
covenant use being due to improved financial transparency associated with better
enforcement. They are more consistent with direct IFRS effects.

40
5. Conclusions
Relative to the prior domestic standards they replaced, IFRS have a variety of
attributes that, we argue, compromise the external contracting usefulness of financial
statements. We predict a consequential decline in use of accounting debt covenants. This
prediction is confirmed in our analyses of debt contracts issued by firms in countries that
mandated IFRS adoption, and is not evident in countries that did not. Reduced accounting
covenant use is, at least in part, substituted by greater reliance on non-accounting debt
covenants. The decline in accounting covenant use increases in the aggregate difference
between prior domestic GAAP and IFRS, and is larger for loans. It is also more pronounced
for banks than for non-banks, consistent with the greater fair value exposure of the banks
affecting usage of accounting covenants more for these firms.
These arguments and results do not imply that IFRS are dominated by adopting
countries’ prior domestic standards. They do imply that financial statements prepared under
IFRS have important limitations for debt contracting, and possibly for contracting more
generally, a result that does not appear to be reflected in standard-setting. The reader also
should be aware that, while we attempt to address omitted correlated variables and concurrent
events by using a difference-in-difference design with country and year fixed effects, these
problems are germane in IFRS adoption studies because adoptions are clustered in time. We
also caution that our post-adoption sample of loan issuances in IFRS adopting countries is
small. Nevertheless, the results are robust with respect to a variety of tests, and hopefully
shed some light on the wider issue of the relative roles of transparency and contractibility in
financial reporting.

41
References
Aharony, J., R. Barniv, and H. Falk. 2010. The impact of mandatory IFRS adoption on equity
valuation of accounting numbers for security investors in the EU. European Accounting Review
19 (3): 535-578.
Ahmed, S. A., M. Neel, and D. Wang. 2013. Does mandatory adoption of IFRS improve accounting
quality? Preliminary evidence. Contemporary Accounting Research 30 (4): 1344-1372.
Armstrong, C. S., M. E. Barth, A. D. Jagolinzer, and E. J. Riedl. 2010. Market reaction to the
adoption of IFRS in Europe. The Accounting Review 85 (1): 31–61.
Bae, K.-H., H. Tan, and M. Welker. 2008. International GAAP differences: The impact on foreign
analysts. The Accounting Review 83 (3): 593–628.
Ball, R. 2001. Infrastructure requirements for an economically efficient system of public financial
reporting and disclosure. Brookings-Wharton papers on financial services 2001 (1): 127–169.
Ball, R., A. Robin, and J. S. Wu. 2003. Incentives versus standards: Properties of accounting income
in four East Asian countries. Journal of Accounting and Economics 36 (1–3): 235–270.
Ball, R. T., R.M. Bushman and F.P. Vasvari. 2008. The debt contracting value of accounting
information and loan structure syndicate, Journal of Accounting Research 46(2): 247-287.
Ball, R. T., L. Hail, and F. P. Vasvari. 2013. Equity cross-listings in the U.S. and the price of debt.
ECGI Finance Working Paper.
Barth, M. E. 2013. Measurement in financial reporting: The need for concepts. Working Paper,
Stanford University.
Barth, M. E., W. R. Landsman, and M. H. Lang. 2008. International Accounting Standards and
accounting quality. Journal of Accounting Research 46 (3): 467–498.
Barth, M. E., W. R. Landsman, M. Lang, C. Williams. 2012. Are IFRS-based and US GAAP-based
accounting amounts comparable? Journal of Accounting and Economics 54 (1): 68-93.
Beatty, A., S. Liao, and J. Weber. 2012. Evidence on the determinants and economic consequences of
delegated monitoring. Journal of Accounting and Economics 53 (3): 555-576.
Benston, G. J. 2008. The shortcomings of fair-value accounting described in SFAS 157. Journal of
Accounting and Public Policy 27 (2): 101-114.
Benston, G. J., and A. L. Hartgraves. 2002. Enron: What happened and what we can learn from it?
Journal of Accounting and Public Policy 21 (2): 105–127.
Bharath, S. T., S. Dahiya, A. Saunders, and A. Srinivasan. 2011. Lending relationships and loan
contract terms. Review of Financial Studies 24 (4): 1141–1203.
Bratton, W. 2006. Bond covenants and creditor protection: Economics and law, theory and practice,
substance and process. European Business Organization Law Review 7, 39-87.
Bresnahan T., P. Milgrom, and J.M. Paul, 1992. The Real Output of the Stock Exchange, in Z.
Griliches (ed.), Output Measurement in the Services Sector, University of Chicago Press,
Chicago.
Brown, A. B. 2013. Financial reporting differences and debt contracting. Working Paper, City
University of New York – Baruch College.
Byard, D., Y. Li, and Y. Yu. 2011. The Effect of mandatory IFRS adoption on financial analysts’
information environment. Journal of Accounting Research 49 (1): 69–96.
Campbell, J. Y. 1991. A variance decomposition for stock returns. Economic Journal 101, 157-179.
Capkun, V., D.W. Collins, and T. Jeanjean. 2012. Does adoption of IAS/IFRS deter earnings
management? Working Paper, University of Iowa.
Carhart, M., R. Kaniel, D. Musto, and A. Reed. 2002. Leaning for the tape: Evidence of gaming
behavior in equity mutual funds. Journal of Finance 57 (2): 661-693.
Cascino, S., and J. Gassen. 2014. What drives the comparability effect of mandatory IFRS
adoption?” Review of Accounting Studies, Forthcoming.
Chambers, R. J. 1966. Accounting, evaluation, and economic behavior. Englewood Cliffs, N.J.:
Prentice-Hall.
Chava, S., and M. R. Roberts. 2008. How does financing impact investments? The role of debt
covenants. The Journal of Finance 63 (5): 2085-2121.
Chen, T., C. L. Chin, S. Wang, and C. Yao. 2015. The effects of financial reporting on bank loan
contracting in global markets: Evidence from mandatory IFRS adoption. Journal of
International Accounting Research, Forthcoming.

42
Christensen, H. B., L. Hail, and C. Leuz. 2013a. Mandatory IFRS reporting and changes in
enforcement. Journal of Accounting and Economics 56 (2-3): 147-177.
Christensen, H. B., L. Hail, and C. Leuz. 2013b. Capital market effects of securities regulation: Prior
conditions, implementation, and enforcement. Working Paper, University of Chicago.
Christensen, H. B., E. Lee, and M. Walker. 2015. Incentives or standards: What determines
accounting quality changes around IFRS adoption? European Accounting Review 24(1): 31-61.
Christensen, H. B., E. Lee, and M. Walker. 2009. Do IFRS reconciliations convey information? The
effect of debt contracting. Journal of Accounting Research 47 (5): 1167-1199.
, and V. V. Nikolaev. 2012. Capital versus performance covenants in debt contracts. Journal
of Accounting Research 50 (1): 75–116.
———. 2013. Does fair value accounting for non-financial assets pass the market test? Review of
Accounting Studies 18 (3): 734–775. Cochrane, J. H., 2011. Discount rates. Journal of Finance 66, 1048-1108.
Comerton-Forde, C., and T.J. Putniņš. 2011. Measuring closing price manipulation. Journal of
Financial Intermediation 20 (2): 135-158.
Costello, A. M., and R. Wittenberg-Moerman. 2011. The impact of financial reporting quality on
debt contracting: Evidence from internal control weakness reports. Journal of Accounting
Research 49 (1): 97–136.
Daske, H., and G. Gebhardt. 2006. International financial reporting standards and experts’
perceptions of disclosure quality. Abacus 42 (3-4):461-498.
Daske, H., L. Hail, C. Leuz, and R. Verdi. 2008. Mandatory IFRS reporting around the world: Early
evidence on the economic consequences. Journal of Accounting Research 46 (5): 1085–1142.
Daske, H., L. Hail, C. Leuz, and R. Verdi, 2013. Adopting a label: Heterogeneity in the economic
consequences around IAS/IFRS adoptions. The Journal of Accounting Research 51(3): 495-
547.
De Franco, G., F. Vasvari, D. Vyas, and R. Wittenberg-Moerman. 2013. Sticky covenants. Working
Paper, University of Toronto.
De George, E.T., X. Li and L. Shivakumar, 2015. Consequences and Effects of IFRS-Adoption: A
Review of Empirical Evidence. Working Paper, London Business School.
Deloitte. 2011. CFO insights: Will IFRS trip up your debt covenants? Deloitte Touche Tohmatsu, at:
http://filesite.deloittenet.deloitte.com/FileHost/2011-05-
09/deloitte_us_cfo_ifrsdebt_021611.pdf.
Demerjian, P. R. 2011. Accounting standards and debt covenants: Has the “balance sheet approach”
led to a decline in the use of balance sheet covenants? Journal of Accounting and Economics 52
(2–3): 178–202.
———. 2014. Uncertainty and debt covenants. Working Paper, University of Washington.
Demerjian, P. R., J. Donovan and C. R. Larson. 2015. Fair Value Accounting and Debt Contracting:
Evidence from Adoption of SFAS 159. Working Paper, University of Washington.
Demski, J.S. and G. A. Feltham. 1978. Economic incentives in budgetary control systems. The
Accounting Review 53, 336-359.
Ernst and Young. 2005. How fair is fair value? IFRS Stakeholder Series, London, Ernst and Young.
European Commission. 2008. Evaluation of the application of IFRS in the 2006 financial statements
of EU companies, available at
http://ec.europa.eu/internal_market/accounting/docs/studies/2009-report_en.pdf.
FASB. 2006. Conceptual framework for financial reporting. Preliminary Views Norwalk,
Connecticut: Financial Accounting Standards Board.
FASB. 2008. Conceptual framework for financial reporting. Exposure Draft. Norwalk, Connecticut:
Financial Accounting Standards Board.
FASB. 2010. Statement of financial accounting concepts No. 8: Conceptual framework for financial
reporting. Norwalk, Connecticut: Financial Accounting Standards Board.
Florou, A., and U. Kosi. 2015. Does mandatory IFRS adoption facilitate debt financing? Review of
Accounting Studies, Forthcoming.
Gallagher, D. R., P. Gardner, and P. L. Swan. 2009. Portfolio pumping: An examination of
investment manager quarter-end trading and impact on performance. Pacific-Basin Finance
Journal 17 (1): 1–27.
Gjesdal, F. 1981. Accounting for stewardship. Journal of Accounting Research 19, 208-231.

43
Haldeman, R. G. 2006. Fact, fiction, and fair value accounting at Enron. The CPA Journal 76 (11):
14-21.
Hanlon, M., S. Rajgopal, and T. Shevlin. 2003. Are executive stock options associated with future
earnings? Journal of Accounting and Economics 36 (1–3): 3–43.
Healy, P. M., and K. G. Palepu. 1990. Effectiveness of accounting-based dividend covenants.
Journal of Accounting and Economics 12 (1–3): 97–123.
Heaton, J.C., D. Lucas, and R. L. McDonald. 2010. Is mark-to-market accounting destabilizing?
Analysis and implications for policy. Journal of Monetary Economics 57 (1): 64-75.
Heckman, J. J., H. Ichimura, and P.E. Todd. 1997. Matching as an econometric evaluation estimator:
Evidence from evaluating a job training programme. The Review of Economic Studies 64 (4):
605-654.
Heckman, J. J., H. Ichimura, and P. Todd. 1998. Matching as an econometric evaluation estimator.
The Review of Economic Studies 65 (1): 261-294.
Hung, M., and K. R. Subramanyam. 2007. Financial statement effects of adopting international
accounting standards: The case of Germany. Review of Accounting Studies 12 (4): 623-657.
IASC Foundation. 2002. Draft Preface to International Financial Reporting Standards. London,
United Kingdom: IASC Foundation. International Accounting Standards Board (IASB). 2006. Discussion Paper: Preliminary Views on an
Improved Conceptual Framework for Financial Reporting - The Objective of Financial
Reporting and Qualitative Characteristics of Decision-useful Financial Reporting Information.
London, United Kingdom: IASB.
Ivashina, V., and Z. Sun. 2011. Institutional stock trading on loan market information. Journal of
Financial Economics 100 (2): 284–303.
Kaufmann, D., A. Kraay, and M. Mastruzzi. 2009. Governance matters VIII: Governance indicators
for 1996–2008. World Bank Policy Research, Washington, D.C.
Kim, J. -B., J. S. L. Tsui, and C. H. Yi. 2011. The voluntary adoption of International Financial
Reporting Standards and loan contracting around the world. Review of Accounting Studies 16
(4): 779–811.
Kvaal, E., and C. Nobes. 2010. International differences in IFRS policy choice: A research note.
Accounting and Business Research 40 (2): 173–187.
Landsman, W. R., E. L. Maydew, and J. R. Thornock. 2012. The information content of annual
earnings announcements and mandatory adoption of IFRS. Journal of Accounting and
Economics 53 (1–2): 34–54.
Leftwich, R. 1983. Accounting information in private markets: Evidence from private lending
agreements. The Accounting Review 58 (1): 23–42.
Lev, B., and T. Sougiannis. 1996. The capitalization, amortization, and value-relevance of R&D.
Journal of Accounting and Economics 21 (1): 107–138.
Li, N. 2010. Negotiated measurement rules in debt contracts. Journal of Accounting Research 48 (5):
1103–1144.
Magnan, M., A. Menini and A. Parbonetti, 2015, Fair value accounting: Information or confusion for
financial markets, Review of Accounting Studies 20: 559-591.
Moody’s. 2008. Are we better off under IFRS? New York: Moody’s Investors Service, November. Milbradt, K. 2009. Trading and valuing toxic assets. Working Paper. Princeton University.
Nikolaev, V. V. 2010. Debt covenants and accounting conservatism. Journal of Accounting Research
48 (1): 51–89.
Nini, G., D. C. Smith, and A. Sufi. 2009. Creditor control rights and firm investment policy. Journal
of Financial Economics 92 (3): 400–420.
———. 2012. Creditor control rights, corporate governance, and firm value. Review of Financial
Studies 25 (6): 1713–1761.
Nobes, C. 2001. GAAP 2001—A survey of national accounting rules benchmarked against
International Accounting Standards. International Forum on Accountancy Development
(IFAD).
Paul, J.M. 1992. On the efficiency of stock-based compensation. Review of Financial Studies 5, 471-
502.
Petersen, M. A. 2009. Estimating standard errors in finance panel data sets: Comparing approaches.
Review of Financial Studies 22 (1): 435-480.

44
Qian, J., and P. E. Strahan. 2007. How laws and institutions shape financial contracts: The case of
bank loans. The Journal of Finance 62 (6): 2803–2834.
Samuelson, P. A. 1965. Proof that properly anticipated prices fluctuate randomly. Industrial
Management Review 6: 41–49.
Schipper, K. 2003. Principles-based accounting standards. Accounting Horizons 17 (1): 61-72.
Shivakumar, L., B. Sidhu, and R. Gao. 2014. Exchange-sponsored analyst coverage. Working Paper,
London Business School.
Smith Jr., C. W., and J. B. Warner. 1979. On financial contracting: An analysis of bond covenants.
Journal of Financial Economics 7 (2): 117–161.
Voulgaris, G., Stathopoulos, K. and Walker, M., 2014. IFRS and the use of accounting-based
performance measures in executive pay. The International Journal of Accounting 49(4): 479-
514.
Watts, R. L. 2003. Conservatism in accounting Part I: Explanations and implications. Accounting
Horizons 17 (3): 207-221.
Whittington, G. 2008. Fair value and the IASB/FASB conceptual framework project: An alternative
view. Abacus 44, 139-168.
Yi, S. 2005. Firm characteristics, lending relationship, and loan covenant strictness. Unpublished
Dissertation, Michigan State University.
Yip, R.Y.W., and D. Young. 2012. Does mandatory IFRS adoption improve information
comparability? The Accounting Review 87 (5): 1767-1789.
Zuckerman, G., and D. Fitzpatrick. 2012. J.P. Morgan ‘Whale’ was prodded: Bank’s probe concludes
trader’s boss encouraged boosting values of bets that were losing. Wall Street Journal August 3.
http://online.wsj.com/article/SB10000872396390443545504577565062684880158.html?mod=
WSJ_hp_LEFTWhatsNewsCollection, visited August 3, 2012.

45
Table 1: Accounting covenant use and institutional variables by country
Panel A reports the number of observations and mean values of measures for accounting covenants by country. IFRS countries designates debt (loans and bonds) issued by
firms domiciled in 22 countries that mandated IFRS adoption. Non-IFRS countries include debt (loans and bonds) issued by firms domiciled in 21 countries that did not
mandate IFRS during our sample period. D_ACov is a dummy variable indicating the debt contract contains at least one accounting covenant. Num_ACov is the total number
of accounting covenants. Panel B reports institutional variables for the IFRS adopting countries. Bae Total Index counts the number of accounting requirements that differ
between prior local GAAP and IAS, as reported in Bae et al. (2008, Table 1). Bae Acct Index excludes non-numerical disclosure requirements. H (L) indicates a value higher
than (lower or equal to) the sample median of the index. Enforcement indexes are from Christensen et al. (2013a, Table 1). Regulatory Quality is from Kaufmann et al. (2009)
as of 2003. Indicator variables designate European Union countries (EU), European Union countries with IFRS adoption bundled with substantive change in enforcement
(EU_ENF), and European Union countries having no enforcement changes concurrent with IFRS adoption (EU_nonENF).
Panel A: Sample composition
Country Adoption
Date
Loan & Bond Sample Loan Sample Bond Sample
N D_
ACov
Num_
ACov N
D_
ACov
Num_
ACov N
D_
ACov
Num_
ACov
IFRS countries (Treatment sample)
Australia 12/31/2005 99 0.273 0.556 18 1.000 2.056 81 0.111 0.222
Belgium 12/31/2005 50 0.040 0.120 . . . 50 0.040 0.120
Denmark 12/31/2005 7 0.000 0.000 . . . 7 0.000 0.000
Finland 12/31/2005 34 0.059 0.147 2 1.000 2.500 32 0.000 0.000
France 12/31/2005 281 0.199 0.505 29 0.966 2.414 252 0.111 0.286
Germany 12/31/2005 99 0.242 0.687 10 0.800 2.700 89 0.180 0.461
Hong Kong 12/31/2005 21 0.667 1.143 17 0.765 1.176 4 0.250 1.000
Ireland 12/31/2005 27 0.556 1.741 11 1.000 2.909 16 0.250 0.938
Israel 12/31/2008 35 0.571 1.171 7 1.000 2.571 28 0.464 0.821
Italy 12/31/2005 54 0.204 0.537 9 0.667 1.111 45 0.111 0.422
Luxembourg 12/31/2005 32 0.188 0.625 8 0.250 1.000 24 0.167 0.500
Netherlands 12/31/2005 64 0.469 1.313 27 0.963 2.815 37 0.108 0.216
New Zealand 12/31/2007 13 0.385 0.692 5 1.000 1.800 8 0.000 0.000
Norway 12/31/2005 89 0.371 0.618 5 1.000 3.400 84 0.333 0.452
Philippines 12/31/2005 14 0.786 2.143 7 0.857 1.857 7 0.714 2.429
Portugal 12/31/2005 14 0.000 0.000 . . . 14 0.000 0.000
Singapore 12/31/2003 19 0.789 2.421 13 0.923 2.769 6 0.500 1.667
South Africa 12/31/2005 17 0.588 1.471 5 1.000 2.000 12 0.417 1.250

46
Spain 12/31/2005 44 0.295 0.500 5 1.000 1.200 39 0.205 0.410
Sweden 12/31/2005 38 0.079 0.184 2 0.500 2.000 36 0.056 0.083
Switzerland 12/31/2005 50 0.480 1.240 24 0.917 2.500 26 0.077 0.077
United Kingdom 12/31/2005 378 0.251 0.614 69 0.957 2.304 309 0.094 0.236
Total 1,479 273 1,206
Non-IFRS countries (Control sample)
Bermuda
77 0.779 1.909 65 0.815 1.938 12 0.583 1.750
Brazil
99 0.475 1.020 8 0.875 2.750 91 0.440 0.868
British Virgin Islands
7 1.000 2.857 7 1.000 2.857 . . .
Canada
706 0.473 1.329 182 0.951 2.742 524 0.307 0.838
Cayman Islands
41 0.878 2.756 37 0.973 3.054 4 0.000 0.000
China
17 0.235 0.529 4 1.000 2.250 13 0.000 0.000
Curaçao
3 0.667 2.667 3 0.667 2.667 . . .
India
117 0.393 0.880 40 1.000 2.425 77 0.078 0.078
Indonesia
48 0.771 1.417 9 1.000 2.111 39 0.718 1.256
Japan
675 0.025 0.052 14 0.929 2.000 661 0.006 0.011
Jersey
10 0.700 1.400 6 0.833 2.000 4 0.500 0.500
Liberia
7 1.000 2.714 7 1.000 2.714 . . .
Malaysia
92 0.902 1.935 4 1.000 2.500 88 0.898 1.909
Marshall Islands
44 0.773 2.091 39 0.795 2.077 5 0.600 2.200
Mexico
123 0.520 1.244 21 0.810 2.238 102 0.461 1.039
Panama
6 0.833 2.000 6 0.833 2.000 . . .
Russia
5 0.600 1.400 3 1.000 2.333 2 0.000 0.000
South Korea
80 0.575 0.725 13 0.923 1.615 67 0.507 0.552
Taiwan
483 0.979 3.110 481 0.983 3.123 2 0.000 0.000
Thailand
72 0.875 1.125 1 1.000 3.000 71 0.873 1.099
United States
1,356 0.510 1.680 475 0.985 2.973 881 0.254 0.983
Total 4,068 1,425 2,643

47
Panel B: Institutional variables for IFRS countries
Country
GAAP Distance Indexes Enforcement Indexes
Bae Total
Index
Bae Acct
Index
Regulatory
Quality EU EU_ENF EU_nonENF
IFRS countries (Treatment sample)
Australia 4 L 3 L 1.60 L 0 0 0
Belgium 13 H 8 H 1.36 L 1 0 1
Denmark 11 H 8 H 1.79 H 1 0 1
Finland 15 H 8 H 1.90 H 1 1 0
France 12 H 8 H 1.18 L 1 0 1
Germany 11 H 6 L 1.51 L 1 1 0
Hong Kong 3 L 2 L 1.76 H 0 0 0
Ireland 1 L 1 L 1.66 H 1 0 1
Israel 6 L 4 L 0.91 L 0 0 0
Italy 12 H 7 H 1.02 L 1 0 1
Luxembourg 18 H 12 H 1.94 H 1 0 1
Netherlands 4 L 3 L 1.76 H 1 1 0
New Zealand 3 L 3 L 1.71 H 0 0 0
Norway 7 L 6 L 1.39 L 1 1 0
Philippines 10 L 9 H -0.06 L 0 0 0
Portugal 13 H 8 H 1.21 L 1 0 1
Singapore 0 L 0 L 1.84 H 0 0 0
South Africa 0 L 0 L 0.58 L 0 0 0
Spain 16 H 9 H 1.29 L 1 0 1
Sweden 10 L 7 H 1.69 H 1 0 1
Switzerland 12 H 7 H 1.63 H 0 0 0
United Kingdom 1 L 1 L 1.68 H 1 1 0
Median 10 6.5 1.62

48
Table 2: Sample composition and accounting covenant use by year
This table reports the number of observations and the mean values of measures for accounting covenants by the
calendar year of debt issuance date. The panel titled “IFRS countries” report statistics on debt (loans and bonds)
issued by firms domiciled in IFRS-adopting countries, while the panel titled “Non-IFRS countries” report
statistics from firms domiciled in countries that did not mandate IFRS during the sample period. D_ACov is a
dummy variable indicating that the debt contract contains at least one accounting-based covenant. Num_ACov is
the total number of accounting covenants contained in a debt contract.
Year
Loan & Bond Sample Loan Sample Bond Sample
N D_
ACov
Num_
ACov N
D_
ACov
Num_
ACov N
D_
ACov
Num_
ACov
IFRS countries(Treatment sample)
2001 114 0.404 1.096 30 0.967 2.667 84 0.202 0.536
2002 113 0.504 1.478 46 0.913 2.630 67 0.224 0.687
2003 126 0.460 1.389 54 0.907 2.741 72 0.125 0.375
2004 90 0.667 1.411 45 0.956 1.689 45 0.378 1.133
2005 128 0.453 1.086 45 0.933 2.133 83 0.193 0.518
2006 136 0.199 0.463 23 0.783 2.087 113 0.080 0.133
2007 178 0.180 0.382 8 0.625 1.500 170 0.159 0.329
2008 137 0.095 0.190 7 0.857 1.571 130 0.054 0.115
2009 313 0.125 0.224 5 1.000 1.800 308 0.110 0.198
2010 144 0.181 0.340 10 0.900 1.600 134 0.127 0.246
Non-IFRS countries (Control sample)
2001 243 0.568 1.807 114 0.921 2.816 129 0.256 0.915
2002 253 0.585 1.806 114 0.904 2.728 139 0.324 1.050
2003 326 0.534 1.733 137 0.905 2.927 189 0.265 0.868
2004 355 0.603 1.868 159 0.956 2.830 196 0.316 1.087
2005 361 0.499 1.374 128 0.984 2.680 233 0.232 0.657
2006 354 0.466 1.319 108 0.954 2.731 246 0.252 0.699
2007 542 0.456 1.216 147 0.993 2.714 395 0.256 0.658
2008 460 0.489 1.415 170 0.988 2.994 290 0.197 0.490
2009 593 0.482 1.255 163 0.975 3.086 430 0.295 0.560
2010 581 0.499 1.368 185 0.995 2.892 396 0.268 0.657
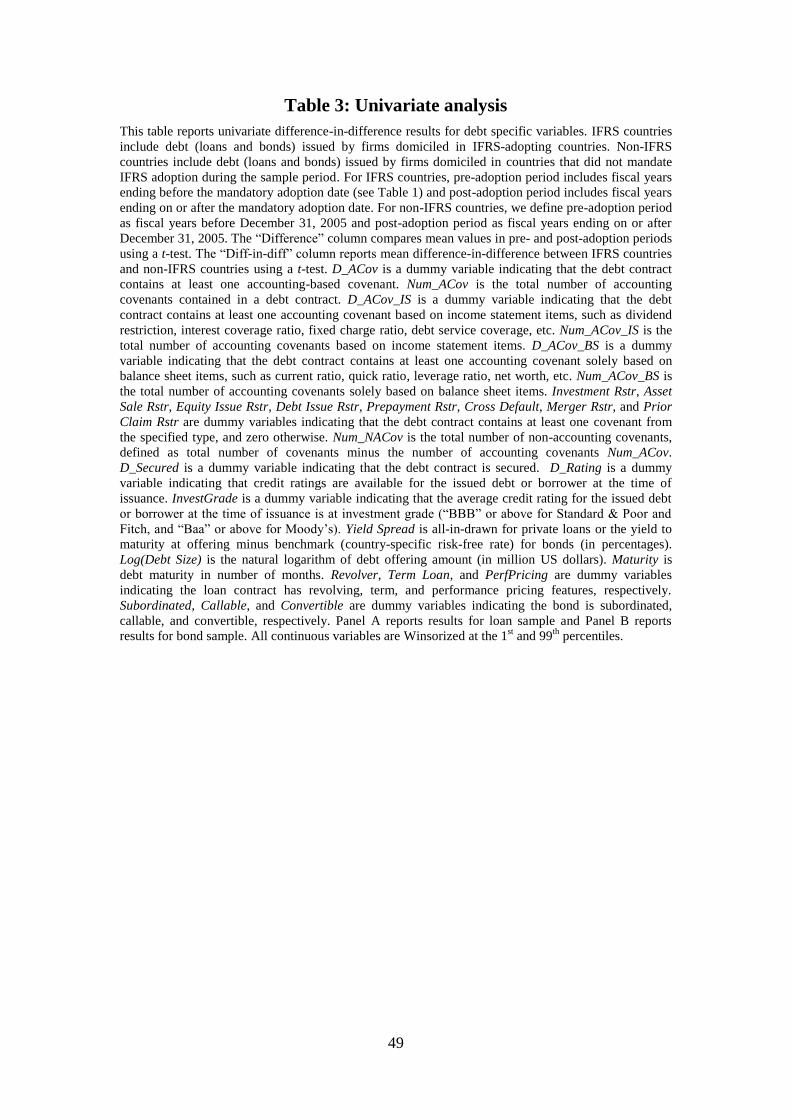
49
Table 3: Univariate analysis
This table reports univariate difference-in-difference results for debt specific variables. IFRS countries
include debt (loans and bonds) issued by firms domiciled in IFRS-adopting countries. Non-IFRS
countries include debt (loans and bonds) issued by firms domiciled in countries that did not mandate
IFRS adoption during the sample period. For IFRS countries, pre-adoption period includes fiscal years
ending before the mandatory adoption date (see Table 1) and post-adoption period includes fiscal years
ending on or after the mandatory adoption date. For non-IFRS countries, we define pre-adoption period
as fiscal years before December 31, 2005 and post-adoption period as fiscal years ending on or after
December 31, 2005. The “Difference” column compares mean values in pre- and post-adoption periods
using a t-test. The “Diff-in-diff” column reports mean difference-in-difference between IFRS countries
and non-IFRS countries using a t-test. D_ACov is a dummy variable indicating that the debt contract
contains at least one accounting-based covenant. Num_ACov is the total number of accounting
covenants contained in a debt contract. D_ACov_IS is a dummy variable indicating that the debt
contract contains at least one accounting covenant based on income statement items, such as dividend
restriction, interest coverage ratio, fixed charge ratio, debt service coverage, etc. Num_ACov_IS is the
total number of accounting covenants based on income statement items. D_ACov_BS is a dummy
variable indicating that the debt contract contains at least one accounting covenant solely based on
balance sheet items, such as current ratio, quick ratio, leverage ratio, net worth, etc. Num_ACov_BS is
the total number of accounting covenants solely based on balance sheet items. Investment Rstr, Asset
Sale Rstr, Equity Issue Rstr, Debt Issue Rstr, Prepayment Rstr, Cross Default, Merger Rstr, and Prior
Claim Rstr are dummy variables indicating that the debt contract contains at least one covenant from
the specified type, and zero otherwise. Num_NACov is the total number of non-accounting covenants,
defined as total number of covenants minus the number of accounting covenants Num_ACov.
D_Secured is a dummy variable indicating that the debt contract is secured. D_Rating is a dummy
variable indicating that credit ratings are available for the issued debt or borrower at the time of
issuance. InvestGrade is a dummy variable indicating that the average credit rating for the issued debt
or borrower at the time of issuance is at investment grade (“BBB” or above for Standard & Poor and
Fitch, and “Baa” or above for Moody’s). Yield Spread is all-in-drawn for private loans or the yield to
maturity at offering minus benchmark (country-specific risk-free rate) for bonds (in percentages).
Log(Debt Size) is the natural logarithm of debt offering amount (in million US dollars). Maturity is
debt maturity in number of months. Revolver, Term Loan, and PerfPricing are dummy variables
indicating the loan contract has revolving, term, and performance pricing features, respectively.
Subordinated, Callable, and Convertible are dummy variables indicating the bond is subordinated,
callable, and convertible, respectively. Panel A reports results for loan sample and Panel B reports
results for bond sample. All continuous variables are Winsorized at the 1st and 99
th percentiles.

50
Panel A: Loan sample
Pre-adoption period Post-adoption period
Difference
(Post-Pre)
Diff-in-diff
(IFRS-Non-
IFRS)
Variable N Mean Std
Dev N Mean
Std
Dev Mean t Mean t
IFRS countries(Treatment sample)
D_ACov 230 0.935 0.247 43 0.767 0.427 -0.167 -2.49 -0.216 -3.18
Num_ACov 230 2.383 1.312 43 1.605 1.198 -0.778 -3.85 -0.887 -4.17
D_ACov_IS 230 0.870 0.338 43 0.698 0.465 -0.172 -2.31 -0.224 -2.92
Num_ACov_IS 230 1.948 1.192 43 1.256 1.071 -0.692 -3.82 -0.125 -0.65
D_ACov_BS 230 0.391 0.489 43 0.256 0.441 -0.135 -1.81 -0.310 -3.93
Num_ACov_BS 230 0.435 0.586 43 0.349 0.686 -0.086 -0.77 -0.762 -6.14
Investment Rstr 230 0.170 0.376 43 0.070 0.258 -0.100 -2.15 0.126 2.48
Asset Sale Rstr 230 0.300 0.459 43 0.326 0.474 0.026 0.33 0.217 2.66
Equity Issue Rstr 230 0.213 0.410 43 0.395 0.495 0.182 2.27 0.301 3.66
Debt Issue Rstr 230 0.209 0.407 43 0.395 0.495 0.187 2.33 0.293 3.56
Prepayment Rstr 230 0.122 0.328 43 0.093 0.294 -0.029 -0.58 0.013 0.25
D_Secured 230 0.257 0.438 43 0.302 0.465 0.046 0.60 -0.108 -1.33
D_Rating 230 0.504 0.501 43 0.488 0.506 -0.016 -0.19 0.220 2.52
InvestGrade 230 0.170 0.376 43 0.186 0.394 0.016 0.25 0.085 1.27
Yield Spread 230 1.523 1.325 43 1.610 1.348 0.087 0.39 0.467 2.01
Log(Debt Size) 230 5.761 1.353 43 6.369 1.408 0.609 2.62 0.978 4.00
Maturity 230 45.652 27.8 43 43.953 25.1 -1.699 -0.40 -8.016 -1.80
Revolver 230 0.483 0.501 43 0.349 0.482 -0.134 -1.66 -0.041 -0.48
Term Loan 230 0.357 0.480 43 0.349 0.482 -0.008 -0.10 -0.154 -1.83
PerfPricing 230 0.557 0.498 43 0.442 0.502 -0.115 -1.38 0.164 1.89
Non-IFRS countries (Control sample)
D_ACov 666 0.935 0.246 759 0.984 0.125 0.049 4.62
Num_ACov 666 2.796 1.422 759 2.905 1.029 0.109 1.64
D_ACov_IS 666 0.835 0.372 759 0.887 0.317 0.052 2.81
Num_ACov_IS 666 1.938 1.347 759 1.372 0.966 -0.567 -9.02
D_ACov_BS 666 0.568 0.496 759 0.742 0.438 0.174 6.99
Num_ACov_BS 666 0.857 0.917 759 1.534 1.138 0.676 12.41
Investment Rstr 666 0.302 0.459 759 0.076 0.266 -0.225 -11.13
Asset Sale Rstr 666 0.359 0.480 759 0.167 0.374 -0.192 -8.32
Equity Issue Rstr 666 0.209 0.407 759 0.090 0.286 -0.119 -6.31
Debt Issue Rstr 666 0.215 0.411 759 0.108 0.311 -0.107 -5.47
Prepayment Rstr 666 0.117 0.322 759 0.075 0.264 -0.042 -2.67
D_Secured 666 0.392 0.489 759 0.545 0.498 0.154 5.87
D_Rating 666 0.452 0.498 759 0.216 0.412 -0.236 -9.66
InvestGrade 666 0.117 0.322 759 0.049 0.215 -0.068 -4.64
Yield Spread 666 1.814 1.251 759 1.434 1.093 -0.380 -6.07
Log(Debt Size) 666 4.805 1.437 759 4.436 1.430 -0.369 -4.85
Maturity 666 46.805 25.0 759 53.123 23.7 6.318 4.88
Revolver 666 0.524 0.500 759 0.431 0.496 -0.093 -3.53
Term Loan 666 0.374 0.484 759 0.520 0.500 0.147 5.61
PerfPricing 666 0.514 0.500 759 0.235 0.424 -0.279 -11.27

51
Panel B: Bond sample
Pre-adoption period Post-adoption period
Difference
(Post-Pre)
Diff-in-diff
(IFRS-Non-
IFRS)
Variable N Mean Std
Dev N Mean
Std
Dev Mean t Mean t
IFRS countries(Treatment sample)
D_ACov 373 0.217 0.413 833 0.104 0.306 -0.113 -4.72 -0.099 -3.29
Num_ACov 373 0.595 1.291 833 0.204 0.689 -0.391 -5.51 -0.118 -1.26
D_ACov_IS 373 0.155 0.363 833 0.062 0.242 -0.093 -4.52 -0.057 -2.16
Num_ACov_IS 373 0.271 0.655 833 0.079 0.351 -0.192 -5.31 -0.114 -2.34
D_ACov_BS 373 0.204 0.403 833 0.088 0.283 -0.116 -5.03 -0.037 -1.30
Num_ACov_BS 373 0.324 0.679 833 0.125 0.429 -0.200 -5.22 -0.004 -0.07
Investment Rstr 229 0.013 0.114 174 0.006 0.076 -0.007 -0.78 -0.022 -1.95
Asset Sale Rstr 373 0.595 0.492 833 0.221 0.415 -0.374 -12.80 -0.052 -1.49
Equity Issue Rstr 229 0.148 0.356 174 0.017 0.131 -0.131 -5.14 -0.006 -0.20
Debt Issue Rstr 229 0.188 0.391 174 0.017 0.131 -0.171 -6.16 -0.067 -1.97
Cross Default 373 0.692 0.462 833 0.715 0.451 0.024 0.83 0.023 0.66
Merger Rstr 373 0.649 0.478 833 0.624 0.485 -0.025 -0.82 0.230 6.62
Prior Claim Rstr 373 0.426 0.495 833 0.131 0.337 -0.295 -10.48 -0.026 -0.76
D_Secured 373 0.021 0.145 833 0.000 0.000 -0.021 -2.86 0.008 0.80
D_Rating 373 0.753 0.432 833 0.753 0.432 -0.001 -0.02 0.145 4.54
InvestGrade 373 0.576 0.495 833 0.562 0.496 -0.015 -0.47 -0.002 -0.04
Yield Spread 373 1.900 2.690 833 2.673 3.175 0.773 4.36 1.399 6.49
Log(Debt Size) 373 5.945 1.114 833 5.944 1.251 -0.001 -0.01 0.167 2.02
Maturity 373 138.975 91.0 833 107.923 87.0 -31.053 -5.55 -0.760 -0.12
Subordinated 373 0.064 0.246 833 0.018 0.133 -0.046 -3.42 0.035 1.84
Callable 373 0.534 0.500 833 0.298 0.458 -0.236 -7.77 0.079 2.22
Convertible 373 0.129 0.335 833 0.082 0.274 -0.047 -2.38 -0.020 -0.81
Non-IFRS countries (Control sample)
D_ACov 927 0.273 0.446 1,716 0.259 0.438 -0.014 -0.79
Num_ACov 927 0.885 1.567 1,716 0.611 1.315 -0.273 -4.52
D_ACov_IS 927 0.230 0.421 1,716 0.194 0.396 -0.036 -2.13
Num_ACov_IS 927 0.415 0.785 1,716 0.338 0.842 -0.077 -2.35
D_ACov_BS 927 0.251 0.434 1,716 0.172 0.378 -0.079 -4.66
Num_ACov_BS 927 0.469 0.829 1,716 0.273 0.634 -0.196 -6.27
Investment Rstr 671 0.004 0.067 567 0.019 0.138 0.015 2.35
Asset Sale Rstr 927 0.769 0.422 1,716 0.446 0.497 -0.323 -17.61
Equity Issue Rstr 671 0.224 0.417 567 0.099 0.299 -0.125 -6.12
Debt Issue Rstr 671 0.207 0.406 567 0.104 0.306 -0.103 -5.09
Cross Default 927 0.629 0.483 1,716 0.630 0.483 0.001 0.05
Merger Rstr 927 0.803 0.398 1,716 0.548 0.498 -0.255 -14.34
Prior Claim Rstr 927 0.565 0.496 1,716 0.296 0.457 -0.269 -13.69
D_Secured 927 0.043 0.203 1,716 0.013 0.115 -0.030 -4.11
D_Rating 927 0.814 0.389 1,716 0.669 0.471 -0.145 -8.51
InvestGrade 927 0.433 0.496 1,716 0.420 0.494 -0.013 -0.64
Yield Spread 927 2.986 2.986 1,716 2.360 3.025 -0.625 -5.12
Log(Debt Size) 927 5.431 0.881 1,716 5.263 1.167 -0.168 -4.16
Maturity 927 137.224 88.9 1,716 106.932 80.1 -30.293 -8.64
Subordinated 927 0.154 0.361 1,716 0.073 0.260 -0.081 -6.06
Callable 927 0.712 0.453 1,716 0.397 0.489 -0.315 -16.58
Convertible 927 0.162 0.368 1,716 0.135 0.341 -0.027 -1.86

52
Table 4: Difference-in-difference analysis on usage of accounting
covenants
This table reports our multivariate regression results for difference-in-difference analysis. Panel A
reports the results for baseline analysis for the loan and bond combined sample, loan sample, and bond
sample separately. We use Probit model for regressions on the binary variable D_ACov and OLS model
for regressions on the natural logarithm of 1+Num_ACov. Marginal effects are reported for all Probit
models and regression coefficients are reported for OLS models. D_ACov is a dummy variable
indicating that the debt contract contains at least one accounting-based covenant. Num_ACov is the
total number of accounting covenants contained in a debt contract. Post_IFRS is defined as one for
observations from the IFRS countries and with fiscal year ends on or after mandatory adoption date,
and zero otherwise. Size is the natural logarithm of market capitalization (in million US dollars). MTB
is market capitalization to book value of equity. Leverage is total debt divided by total assets. ROA is
EBITDA divided by total assets. Tangibility is net PP&E divided by total assets. USFiling is a dummy
variables indicating that a firm has SEC filings available, i.e. when the firm has public equity, ADR, or
debt listed in the US. Loan Indicator is defined as one if the debt is a loan, and zero otherwise. Other
variables are as defined in Table 3. Panel B reports the regression results after excluding US firms from
the sample. In Panel C, we require a constant sample in addition to excluding US firms as done in
Panel B. To be included in the constant sample, we require a firm to issue at least one debt in pre-
adoption period and a debt in post-adoption periods if the firm is located in an IFRS country and a firm
to issue at least two debts during the sample period if the firm is located in a non-IFRS country. In
Panel D, we use alternative definitions for accounting covenants. In columns titled “Income
Statement/Performance Covenants”, D_ACov_IS and Num_ACov_IS are used as dependant variables.
D_ACov_IS is a dummy variable indicating that the debt contract contains at least one accounting
covenant based on income statement items, such as dividend restriction, interest coverage ratio, fixed
charge ratio, debt service coverage, etc. Num_ACov_IS is the total number of accounting covenants
based on income statement items. In columns titled “Balance Sheet/Capital Covenants”, D_ACov_BS
and Num_ACov_BS are used as dependant variables. D_ACov_BS is a dummy variable indicating that
the debt contract contains at least one accounting covenant solely based on balance sheet items, such as
current ratio, quick ratio, leverage ratio, net worth, etc. Num_ACov_BS is the total number of
accounting covenants solely based on balance sheet items. In columns titled “Ex. Dividend Rstr for
ACov”, we exclude dividend restrictions when counting accounting-based covenants. Panel E reports
robustness results based on employing one of the following approaches: (i) Kernel propensity score
matching difference-in-difference method, where IFRS countries that adopted IFRS in years other than
2005 are excluded from this analysis; (ii) standard errors computed from bootstraping technique that
re-samples data 1000 times and estimates bootstrapped standard errors clustered by industry; and (iii)
standard errors clustered at the country level. Note that for the first two approaches, we use OLS model
for regressions on both D_ACov and Num_ACov. The table reports marginal effects for all Probit
models, regression coefficients for all OLS models, and z- or t-statistics in parentheses. Standard errors
are clustered by industry (2-digit SIC) unless otherwise stated. All regressions include country fixed
effects and year (calendar year of debt issuance date) fixed effects. In Panels B to E, coefficients for
control variables are omitted for brevity. All continuous variables are Winsorized at the 1st and 99
th
percentiles. ***, **, and * indicate significance at 1%, 5%, and 10% levels, respectively.

53
Table 4 (contd)
Panel A: Baseline analysis
Probit: D_ACov OLS: Log (1+Num_ACov)
Loan & Bond
(1)
Loan
(2)
Bond
(3)
Loan & Bond
(4)
Loan
(5)
Bond
(6)
M. E. M. E. M. E. Coeff. Coeff. Coeff.
Post_IFRS -0.264*** -0.175*** -0.110*** -0.141*** -0.187*** -0.127***
(-4.63) (-5.47) (-4.01) (-3.98) (-3.30) (-3.63)
Leverage 0.074 0.022 -0.012 0.041 0.065 -0.025
(1.03) (1.31) (-0.24) (0.70) (0.91) (-0.32)
Size -0.059*** -0.002 -0.038*** -0.056*** -0.025** -0.074***
(-4.34) (-0.93) (-4.82) (-5.39) (-2.01) (-5.31)
MTB -0.002 -0.001** 0.002 -0.002 -0.006* 0.004
(-0.52) (-2.55) (0.86) (-0.72) (-1.78) (1.24)
ROA 0.863*** 0.046 0.342*** 0.656*** 0.449*** 0.386***
(7.73) (1.31) (4.17) (7.85) (3.28) (2.96)
Tangibility -0.062 -0.028*** -0.007 0.023 -0.070 0.071
(-1.01) (-2.64) (-0.20) (0.59) (-1.41) (1.32)
USFiling 0.085** 0.008 0.063*** 0.114*** 0.085* 0.124***
(2.02) (1.38) (2.83) (4.29) (1.81) (4.29)
D_Secured 0.117* 0.004 0.044 0.052 0.007 0.235
(1.72) (0.66) (0.73) (1.36) (0.23) (1.64)
D_Rating 0.164*** 0.001 0.057*** 0.195*** 0.064** 0.200***
(4.81) (0.15) (3.41) (6.84) (2.55) (6.57)
InvestGrade -0.261*** -0.008 -0.162*** -0.280*** -0.268*** -0.298***
(-7.29) (-1.04) (-9.44) (-8.57) (-6.72) (-7.87)
Yield Spread 0.073*** 0.003 0.027*** 0.063*** 0.014 0.052***
(9.50) (1.17) (5.45) (8.85) (1.14) (7.34)
Log(Debt Size) 0.013 -0.003 0.001 0.013 -0.024* 0.025
(0.76) (-1.24) (0.10) (1.12) (-1.74) (1.27)
Log(Maturity) -0.050** 0.009*** -0.045*** -0.044*** 0.043** -0.076***
(-2.23) (2.71) (-2.58) (-3.31) (2.06) (-3.89)
Loan Indicator 0.765***
0.755***
(14.71)
(20.17)
Revolver
0.002
-0.006
(0.44)
(-0.14)
Term Loan
-0.005
0.040
(-1.09)
(1.10)
PerfPricing
0.015**
0.160***
(2.47)
(5.19)
Subordinated
0.128***
0.249***
(3.26)
(4.58)
Callable
0.012
0.072**
(0.49)
(2.61)
Convertible
-0.139***
-0.391***
(-7.39)
(-8.23)
Fixed effects Country;
Year
Country;
Year
Country;
Year
Country;
Year
Country;
Year
Country;
Year
N 5,547 1,698 3,849 5,547 1,698 3,849
Pseudo/Adj. R2 60.0% 33.5% 43.9% 62.8% 23.2% 43.7%

54
Table 4 (contd)
Panel B: Excluding US firms
Probit: D_ACov OLS: Log (1+Num_ACov)
Loan & Bond
(1)
Loan
(2)
Bond
(3)
Loan & Bond
(4)
Loan
(5)
Bond
(6)
M. E. M. E. M. E. Coeff. Coeff. Coeff.
Post_IFRS -0.289*** -0.219*** -0.112*** -0.183*** -0.251*** -0.119***
(-5.38) (-5.87) (-4.04) (-4.93) (-3.87) (-3.50)
N 4,191 1,223 2,968 4,191 1,223 2,968
Pseudo/Adj. R2 59.6% 34.7% 44.3% 65.1% 25.6% 42.2%
All control variables included
Fixed effects Country;
Year
Country;
Year
Country;
Year
Country;
Year
Country;
Year
Country;
Year
Panel C: Constant sample excluding US firms
Probit: D_ACov OLS: Log (1+Num_ACov)
Loan & Bond
(1)
Loan
(2)
Bond
(3)
Loan & Bond
(4)
Loan
(5)
Bond
(6)
M. E. M. E. M. E. Coeff. Coeff. Coeff.
Post_IFRS -0.299*** -0.382*** -0.094*** -0.181*** -0.366*** -0.116***
(-5.05) (-4.87) (-3.92) (-4.03) (-3.53) (-2.71)
N 3,283 920 2,363 3,283 920 2,363
Pseudo/Adj. R2 62.8% 37.8% 48.8% 67.5% 26.4% 44.6%
All control variables included
Fixed effects Country;
Year
Country;
Year
Country;
Year
Country;
Year
Country;
Year
Country;
Year

55
Table 4 (contd)
Panel D: Alternative definitions on accounting covenants
Probit: D_ACov OLS: Log (1+Num_ACov)
Loan & Bond Loan Bond
Loan &
Bond Loan Bond
M. E. M. E. M. E. Coeff. Coeff. Coeff.
Income Statement/Performance Covenants
Post_IFRS -0.202*** -0.309*** -0.048*** -0.105*** -0.196*** -0.072***
(-4.59) (-4.65) (-2.86) (-4.38) (-3.15) (-3.35)
N 5,547 1,698 3,849 5,547 1,698 3,849
Pseudo/Adj. R2 58.2% 24.4% 52.3% 60.9% 43.3% 43.5%
Balance Sheet/Capital Covenants
Post_IFRS -0.117*** -0.107 -0.072*** -0.053* -0.018 -0.079***
(-3.56) (-1.11) (-4.01) (-1.77) (-0.27) (-2.91)
N 5,547 1,698 3,849 5,547 1,698 3,849
Pseudo/Adj. R2 37.4% 32.0% 40.9% 45.9% 50.7% 38.0%
Ex. Dividend Rstr from ACov
Post_IFRS -0.239*** -0.181*** -0.082*** -0.111*** -0.108* -0.097***
(-4.41) (-3.71) (-3.63) (-3.78) (-1.96) (-3.60)
N 5,547 1,698 3,849 5,547 1,698 3,849
Pseudo/Adj. R2 55.5% 24.6% 40.3% 64.8% 25.0% 37.8%
All control variables included
Fixed effects Country; Year

56
Table 4 (contd)
Panel E: Robustness analysis
Kernel Propensity Score Diff-in-Diff
OLS: D_ACov OLS: Log (1+Num_ACov)
Loan &
Bond Loan Bond Loan & Bond Loan Bond
Coeff. Coeff. Coeff. Coeff. Coeff. Coeff.
Post 0.118 0.286 0.053 0.137 0.418* 0.063
(1.13) (1.66) (1.01) (1.22) (1.77) (1.25)
Post_IFRS -0.136*** -0.205*** -0.152*** -0.156*** -0.248*** -0.138***
(-3.80) (-4.35) (-3.25) (-4.37) (-3.55) (-3.39)
N 5,480 1,673 3,784 5,480 1,673 3,784
Adj. R2 53.7% 33.0% 35.4% 53.8% 38.5% 38.4%
Bootstrap
OLS: D_ACov OLS: Log (1+Num_ACov)
Loan &
Bond Loan Bond Loan & Bond Loan Bond
Coeff. Coeff. Coeff. Coeff. Coeff. Coeff.
Post_IFRS -0.130*** -0.141*** -0.107*** -0.141*** -0.187*** -0.127***
(-3.09) (-3.10) (-3.09) (-2.88) (-2.66) (-2.75)
N 5,547 1,698 3,849 5,547 1,698 3,849
Adj. R2 63.6% 15.4% 42.3% 62.8% 23.2% 43.7%
Cluster by country
Probit: D_ACov OLS: Log (1+Num_ACov)
Loan &
Bond Loan Bond Loan & Bond Loan Bond
M. E. M. E. M. E. Coeff. Coeff. Coeff.
Post_IFRS -0.264*** -0.175** -0.110*** -0.141** -0.187 -0.127***
(-3.46) (-2.32) (-3.27) (-2.43) (-1.62) (-3.31)
N 5,547 1,698 3,849 5,547 1,698 3,849
Pseudo/Adj. R2 60.0% 33.5% 43.9% 62.8% 23.2% 43.7%
All control variables included
Fixed effects Country; Year

57
Table 5: Effect of degree of IFRS departure from prior domestic
standards
This table splits the treatment effect into countries with high and low values based on difference between
domestic GAAP index and IFRS, as measured by either the Bae Total Index or Bae Acct Index.
Post_IFRSIndex_H (Post_IFRSIndex_L )is defined as one for observations from the IFRS countries with a
high (low ) value of Bae Total Index or Bae Acct Index and with fiscal year ends on or after mandatory
adoption date, and zero otherwise. The table reports marginal effects for all Probit models, regression
coefficients for all OLS models, and z- or t-statistics (in parentheses) based on standard errors clustered
by industry (2-digit SIC). Country and year (calendar year of debt issuance date) fixed effects are
included. The table also reports p-values of χ2-test or F-test from testing the null hypothesis of whether
Post_IFRSIndex_H = Post_IFRSIndex_L and clustering standard errors by industry. Control variables as
defined in Table 4 are included in the regressions, but their coefficients are omitted for brevity. ***, **,
and * indicate significance at 1%, 5%, and 10% levels, respectively.
Probit: D_ACov OLS: Log (1+Num_ACov)
Loan &
Bond Loan Bond
Loan &
Bond Loan Bond
M. E. M. E. M. E. Coeff. Coeff. Coeff.
Bae Total Index
Post_IFRSIndex_H -0.333*** -0.992*** -0.122*** -0.180*** -0.499** -0.171***
(-4.69) (-8.11) (-4.73) (-3.69) (-2.64) (-3.58)
Post_IFRSIndex_L -0.183*** -0.002 -0.067** -0.110*** -0.064 -0.094**
(-3.30) (-0.26) (-2.51) (-2.87) (-1.01) (-2.49)
Test for difference [p-value]:
Post_IFRSIndex_H=
Post_IFRSIndex_L [0.01] [0.00] [0.00] [0.16] [0.05] [0.10]
N 5,547 1,698 3,849 5,547 1,698 3,849
Pseudo/Adj. R2 60.0% 35.1% 44.1% 62.8% 23.5% 43.7%
Bae Acct Index
Post_IFRSIndex_H -0.313*** -0.427*** -0.119*** -0.153*** -0.379** -0.127***
(-3.93) (-4.59) (-4.15) (-3.20) (-2.41) (-3.05)
Post_IFRSIndex_L -0.220*** -0.050* -0.082*** -0.133*** -0.094 -0.127***
(-4.12) (-1.76) (-3.19) (-3.40) (-1.63) (-3.04)
Test for difference [p-value]:
Post_IFRSIndex_H=
Post_IFRSIndex_L [0.13] [0.02] [0.03] [0.69] [0.11] [0.99]
N 5,547 1,698 3,849 5,547 1,698 3,849
Pseudo/Adj. R2 60.0% 33.8% 44.0% 62.8% 23.3% 43.7%
All control variables included
Fixed effects Country; Year

58
Table 6: Banks vs. Non-banks
In this table, we split the treatment effect into banking and non-banking industries. Firms with 2-digit
SIC code between 60 and 61 are defined as operating in banking industries. The sample used in this
table additional includes financial firms which were initially excluded from our sample. Post_IFRSBank
is defined as one for observations from the IFRS countries operating in banking industries and with
fiscal year ends on or after mandatory adoption date, and zero otherwise. Post_IFRSnon-Bank is defined as
one for observations from the IFRS countries operating in non-banking industries and with fiscal year
ends on or after mandatory adoption date, and zero otherwise. The table reports marginal effects for all
Probit models, regression coefficients for all OLS models, and z- or t-statistics (in parentheses) based
on standard errors clustered by industry (2-digit SIC). Country and year (calendar year of debt issuance
date) fixed effects are included in all regressions. We also report p-values of χ2-test or F-test by
comparing coefficients of Post_IFRSBank with Post_IFRSnon-Bank and clustering standard errors by
industry. Control variables are as defined in Table 4 and their coefficients are omitted for brevity. All
continuous variables are Winsorized at the 1st and 99
th percentiles. ***, **, and * indicate significance
at 1%, 5%, and 10% levels, respectively.
Probit: D_ACov OLS: Log (1+Num_ACov)
Loan &
Bond Loan Bond Loan & Bond Loan Bond
M. E. M. E. M. E. Coeff. Coeff. Coeff.
Post_IFRSBank -0.240*** -0.641*** -0.086*** -0.037 -0.626*** -0.022
(-7.66) (-4.35) (-4.89) (-1.43) (-8.16) (-0.86)
Post_IFRSnon-Bank -0.148** -0.203*** -0.055 -0.118*** -0.176*** -0.083**
(-2.37) (-6.38) (-1.60) (-4.10) (-2.91) (-2.31)
Test for difference [p-value]:
Post_IFRSBank
=Post_IFRSnon-Bank [0.02] [0.03] [0.04] [0.02] [0.00] [0.09]
N 7,615 1,896 5,719 7,615 1,896 5,719
Pseudo/Adj. R2 55.9% 27.3% 38.9% 61.5% 23.6% 38.8%
All control variables included
Indicators for banking industries included
Fixed effects Country; Year

59
Table 7: Non-accounting covenant use
Panels A and B report difference-in-difference regression results on the use of non-accounting covenants as well as on the ratio of accounting to non-accounting covenants for
loan and bond samples, respectively. Covenants on investment restriction, asset sale restriction, equity issue restriction, and debt issue restriction are common to both loan
and bond contracts. Columns “Investment Rstr”, “Asset sale Rstr”, “Equity Issue Rstr”, and “Debt Issue Rstr” report the Probit regression results on D_NACov, which is
defined as one if the debt contract contains at least one non-accounting covenant from the specified type, and zero otherwise. Covenant on prepayment restriction is specific
to loan contracts. Column “Prepayment Rstr” reports the Probit regression results on D_NACov, which is defined as one if the loan contract contains at least one prepayment
restriction, and zero otherwise. Covenants on cross default provision, merger restriction, and prior claim restriction are specific to bond contracts. Columns “Cross Default”,
“Merger Rstr”, and “Prior Claim Rstr” report the Probit regression results on D_NACov, which is defined as one if the bond contract contains at least one covenant from the
specified type, and zero otherwise. Column “Ordered Probit (NACov_Types)” presents Ordered Probit regression results where the dependant variable is the sum of dummy
variables indicating different types of non-accounting covenants as described above. NACov_Types includes five non-accounting covenant types for the loan sample and
seven non-accounting covenant types for the bond sample. In the columns titled “Acct to Non-acct ratio”, we run OLS regressions on the natural logarithm of the ratio of
accounting to non-accounting covenants, defined as (1+Num_ACov)/(1+Num_NACov), where Num_NACov is the total number of covenants minus the number of accounting
covenants Num_ACov. Post_IFRS is defined as one for observations from the IFRS countries and with fiscal year ends on or after mandatory adoption date, and zero
otherwise. In Panels C and D, we repeat the analysis in Panels A and B by splitting the treatment effect into countries with high and low values for Bae Total Index, as
defined in Table 5. See Tables 4 and 5 legends for definitions on other variables. The table reports marginal effects for all Probit models, regression coefficients for all
Odered Probit and OLS models, and z- or t-statistics (in parentheses) based on standard errors clustered by industry (2-digit SIC). Firm-level control variables, debt-level
control variables, and country and year (calendar year of debt issuance date) fixed effects, as in Table 4, are included in all regressions, but are not reported for brevity. All
continuous variables are Winsorized at the 1st and 99
th percentiles. ***, **, and * indicate significance at 1%, 5%, and 10% levels, respectively.

60
Panel A: Non-accounting covenants for loans
Probit: D_NACov Ordered Probit:
NACov_Types
OLS:
Log (Ratio)
Investment
Rstr
Asset Sale
Rstr
Equity Issue
Rstr
Debt Issue
Rstr
Prepayment
Rstr
Five Non-acct
Types
Acct to
Non-acct ratio
M. E. M. E. M. E. M. E. M. E. Coeff. Coeff.
Post_IFRS 0.011 0.191 0.345** 0.244* -0.033 0.565* -0.254
(0.22) (1.23) (2.54) (1.66) (-0.70) (1.76) (-1.65)
N 1,698 1,698 1,698 1,698 1,698 1,698 1,698
Pseudo/Adj. R2 39.3% 22.2% 22.9% 22.3% 35.6% 27.1% 61.1%
Country fixed effects and year fixed effects included
All control variables included

61
Panel B: Non-accounting covenants for bonds
Probit (D_NACov) Ordered Probit:
NACov_Types
OLS:
Log (Ratio)
Investment
Rstr
Asset
Sale Rstr
Equity
Issue Rstr
Debt Issue
Rstr
Cross
Default
Merger
Rstr
Prior Claim
Rstr
Seven Non-acct
Types
Acct to
Non-acct ratio
M. E. M. E. M. E. M. E. M. E. M. E. M. E. Coeff. Coeff.
Post_IFRS -0.001 -0.060 -0.034*** -0.066*** -0.066 0.207*** -0.133*** -0.494*** -0.007
(-0.87) (-1.30) (-2.97) (-2.76) (-1.10) (3.22) (-4.47) (-2.62) (-0.13)
N 1,641 3,849 1,641 1,641 3,849 3,849 3,849 1,641 3,849
Pseudo/Adj. R2 35.6% 48.8% 50.8% 40.8% 15.7% 58.1% 57.2% 15.8% 41.8%
Country fixed effects and year fixed effects included
All control variables included

62
Panel C: Non-accounting covenants in loans by GAAP distance measured using Bae Total Index
Probit: D_NACov Ordered Probit:
NACov_Types
OLS:
Log (Ratio)
Investment
Rstr
Asset Sale
Rstr
Equity Issue
Rstr
Debt Issue
Rstr
Prepayment
Rstr
Five Non-acct
Types
Acct to
Non-acct ratio
M. E. M. E. M. E. M. E. M. E. Coeff. Coeff.
Post_IFRSIndex_H 0.418** 0.396 0.547** 0.644** 1.494*** -1.018***
(2.40) (1.60) (2.01) (2.53) (3.26) (-3.99)
Post_IFRSIndex_L -0.041 0.091 0.219 0.054 -0.027 0.115 0.047
(-1.46) (0.56) (1.64) (0.39) (-0.50) (0.31) (0.32)
Test for difference [p-value]:
Post_IFRSIndex_H=
Post_IFRSIndex_L [0.00] [0.23] [0.28] [0.02] [0.01] [0.00]
N 1,698 1,698 1,698 1,698 1,698 1,698 1,698
Pseudo/Adj. R2 39.6% 22.3% 23.0% 22.8% 35.5% 27.3% 61.5%
Country fixed effects and year fixed effects included
All control variables included

63
Panel D: Non-accounting covenants in bonds by GAAP distance measured using Bae Total Index
Probit (D_NACov)
Ordered
Probit:
NACov_Types
OLS:
Log (Ratio)
Investment
Rstr
Asset
Sale
Rstr
Equity
Issue Rstr
Debt Issue
Rstr
Cross
Default
Merger
Rstr
Prior
Claim
Rstr
Seven Non-
acct Types
Acct to
Non-acct
ratio
M. E. M. E. M. E. M. E. M. E. M. E. M. E. Coeff. Coeff.
Post_IFRSIndex_H -0.001 -0.099* -0.020 -0.069 0.099 0.217*** -0.142*** -0.038 -0.041
(-0.76) (-1.70) (-0.77) (-1.60) (1.30) (2.61) (-3.61) (-0.14) (-0.49)
Post_IFRSIndex_L
-0.032
-0.215*** 0.178*** -0.107*** -0.785*** 0.019
(-0.58)
(-2.82) (2.58) (-2.74) (-3.22) (0.42)
Test for difference [p-value]:
Post_IFRSIndex_H=
Post_IFRSIndex_L
[0.30]
[0.00] [0.60] [0.41] [0.03] [0.36]
N 1,641 3,849 1,641 1,641 3,849 3,849 3,849 1,641 3,849
Pseudo/Adj. R2 35.3% 48.8% 49.8% 39.5% 16.1% 58.1% 57.2% 15.9% 41.8%
Country fixed effects and year fixed effects included
All control variables included

64
Table 8: Enforcement effects
In Panel A, we split the treatment effect into countries with high and low enforcement based on
regulatory quality index in Kaufmann et al. (2009). High enforcement group includes countries with
regulatory quality index higher than sample median and low enforcement group includes countries with
regulatory quality index lower or equal to sample median. Sample median is calculated using IFRS
countries only. Post_IFRSENF_H is defined as one for observations from the high enforcement IFRS
countries and with fiscal year ends on or after mandatory adoption date, and zero otherwise.
Post_IFRSENF_L is defined as one for observations from the low enforcement IFRS countries and with
fiscal year ends on or after mandatory adoption date, and zero otherwise. We also report p-values of χ2-
test or F-test by comparing coefficients of Post_IFRSENF_H with Post_IFRSENF_L and clustering standard
errors by industry. In Panel B, we split the treatment effect into countries within and outside European
Union and the former is further split into those with and without bundled enforcement, as classified by
Christensen et al. (2013a). Post_IFRSEU_ENF is defined as one for observations from EU countries with
bundled enforcement and with fiscal year ends on or after mandatory adoption date, and zero
otherwise. Post_IFRSEU_nonENF is defined as one for observations from EU countries that do not have
bundled enforcement and with fiscal year ends on or after mandatory adoption date, and zero
otherwise. Post_IFRSnon-EU is defined as one for observations from the IFRS countries but outside
European Union (EU=0) and with fiscal year ends on or after mandatory adoption date, and zero
otherwise. We also report p-values of χ2-test or F-test by comparing coefficients of Post_IFRSEU_ENF
and Post_IFRSEU_nonENF with Post_IFRSnon-EU and clustering standard errors by industry. See Table 1,
Panel B for definitions on Regulatory Quality, EU, EU_ENF, and EU_nonENF. The table reports
marginal effects for all Probit models, regression coefficients for all OLS models, and z- or t-statistics
(in parentheses) based on standard errors clustered by industry (2-digit SIC). Country and year
(calendar year of debt issuance date) fixed effects are included in all regressions. We use the full
sample as defined in Table 4, Panel A for the regressions. Panel B reports results for only sample of
bonds, as there are insufficient observations to estimate coefficients for the sample of loans. Firm-level
control variables, debt-level control variables, and country and year (calendar year of debt issuance
date) fixed effects, as in Table 4, are included in all regressions, but are not reported for brevity. All
continuous variables are Winsorized at the 1st and 99
th percentiles. ***, **, and * indicate significance
at 1%, 5%, and 10% levels, respectively.
Panel A: Regulatory quality index
Probit: D_ACov OLS: Log (1+Num_ACov)
Loan &
Bond Loan Bond
Loan &
Bond Loan Bond
M. E. M. E. M. E. Coeff. Coeff. Coeff.
Post_IFRSENF_H -0.232** -0.040* -0.089** -0.139** -0.151* -0.118**
(-2.35) (-1.79) (-2.08) (-2.50) (-1.68) (-2.15)
Post_IFRSENF_L -0.276*** -0.462*** -0.105*** -0.142*** -0.237** -0.135***
(-4.33) (-4.32) (-3.81) (-3.40) (-2.50) (-3.09)
Test for difference [p-value]:
Post_IFRSENF_H=
Post_IFRSENF_L [0.67] [0.02] [0.74] [0.96] [0.56] [0.80]
N 5,547 1,698 3,849 5,547 1,698 3,849
Pseudo/Adj. R2 60.0% 33.9% 43.9% 62.8% 23.1% 43.7%
All control variables included
Country fixed effects and year fixed effects included

65
Panel B: Debt issuances by non-EU firms and EU firms with concurrent or non-
concurrent enforcement changes
Probit: D_ACov OLS: Log (1+Num_ACov)
Loan &
Bond Loan Bond
Loan &
Bond Loan Bond
M. E. M. E. M. E. Coeff. Coeff. Coeff.
Post_IFRSEU_ENF -0.214*** -0.031 -0.077** -0.136*** -0.107 -0.107*
(-3.26) (-1.59) (-2.46) (-2.71) (-1.31) (-1.90)
Post_IFRSEU_nonENF -0.350*** -0.994*** -0.121*** -0.178*** -0.569*** -0.164***
(-4.92) (-13.31) (-4.64) (-3.47) (-3.18) (-3.87)
Post_IFRSnon-EU -0.147
-0.071* -0.079 0.076 -0.108*
(-1.39)
(-1.96) (-1.30) (0.56) (-1.70)
Test for difference [p-value]:
Post_IFRSEU_ENF=
Post_IFRSnon-EU [0.56]
[0.94] [0.50] [0.28] [0.99]
Post_IFRSEU_nonENF=
Post_IFRSnon-EU [0.03]
[0.06] [0.22] [0.01] [0.50]
Post_IFRSEU_ENF=
Post_IFRSEU_nonENF [0.02] [0.00] [0.01] [0.47] [0.02] [0.33]
N 5,547 1,698 3,849 5,547 1,698 3,849
Pseudo/Adj. R2 60.0% 34.8% 44.0% 62.8% 23.6% 43.7%
All control variables included
Country fixed effects and year fixed effects included

66
Figure 1: New IFRS statements and amendments
This figure plots the histogram of new statements and amendment to existing statements issued by
IFRS between 1997 and 2012. Changes to multiple accounting standards from the issuance of a new
standard or amendment of a standard are counted as a single change.
0
5
10
15
20
25
30
1997 1998 1999 2000 2001 2002 2003 2004 2005 2006 2007 2008 2009 2010 2011 2012
By publication year By effective year

67
Figure 2: Accounting covenant use over time
In Panel A (B), the red solid line labelled “IFRS countries” plots the mean value of D_ACov
(Num_ACov) for debt (loans and bonds) issued by firms domiciled in IFRS-adopting countries. The
blue dotted line labelled “Non-IFRS countries” plots the mean value of D_ACov (Num_ACov) for debt
issued by firms domiciled in countries that did not mandate IFRS adoption during the sample period.
D_ACov is a dummy variable indicating that the debt contract contains at least one accounting-based
covenant. Num_ACov is the total number of accounting covenants contained in a debt contract. The
vertical line “IFRS adoption” indicates the date when IFRS was mandated in the treatment sample
(December 2005). The line “Financial Crisis” indicates the date when the recent financial crisis started
(July 2007).
Panel A: Average accounting covenant frequency
Panel B: Average accounting covenant intensity
0.000
0.100
0.200
0.300
0.400
0.500
0.600
0.700
0.800
20
01
20
02
20
03
20
04
20
05
20
06
20
07
20
08
20
09
20
10
Acc
ou
nti
ng
Co
ven
an
t
Fre
qu
ency
Loan & Bond Sample
Non-IFRS countries IFRS countries
IFRS adoption Financial Crisis
0.000
0.200
0.400
0.600
0.800
1.000
1.200
1.400
1.600
1.800
2.000
20
01
20
02
20
03
20
04
20
05
20
06
20
07
20
08
20
09
20
10
Acc
ou
nti
ng
Co
ven
an
t
Inte
nsi
ty
Loan & Bond Sample
Non-IFRS countries IFRS countries
IFRS adoption Financial Crisis