lambda-cyhalothrin - us forest service - caring for the land and
TRANSCRIPT

` SERA TR-052-21-03a
Lambda-Cyhalothrin Human Health and Ecological Risk Assessment
Final Report
Submitted to: Paul Mistretta, COR
USDA/Forest Service, Southern Region 1720 Peachtree RD, NW Atlanta, Georgia 30309
USDA Forest Service Contract: AG-3187-C-06-0010 USDA Forest Order Number: AG-43ZP-D-09-0015
SERA Internal Task No. 52-21
Submitted by: Patrick R. Durkin
Syracuse Environmental Research Associates, Inc. 8125 Solomon Seal
Manlius, New York 13104
Fax: (315) 637-0445 E-Mail: [email protected] Home Page: www.sera-inc.com
February 25, 2010

ii
Table of Contents List of Figures ................................................................................................................................. v List of Tables ................................................................................................................................. vi List of Attachments........................................................................................................................ vi ACRONYMS, ABBREVIATIONS, AND SYMBOLS ............................................................... vii COMMON UNIT CONVERSIONS AND ABBREVIATIONS................................................... ix CONVERSION OF SCIENTIFIC NOTATION ............................................................................ x EXECUTIVE SUMMARY ........................................................................................................... xi 1. INTRODUCTION ..................................................................................................................... 1
2.1. OVERVIEW ........................................................................................................................ 3 2.2. CHEMICAL DESCRIPTION AND COMMERCIAL FORMULATIONS........................ 3 2.3. APPLICATION METHODS.............................................................................................. 6 2.4. MIXING AND APPLICATION RATES ........................................................................... 7
2.3.1. Foliar Air Blast Applications (Chico Site).................................................................... 7 2.3.2. Applications to Individual Trees (Forest Hill Site)....................................................... 7 2.3.3. Application Rates Used in Risk Assessment ................................................................ 8
2.5. USE STATISTICS.............................................................................................................. 9 2.6. SITE DESCRIPTIONS....................................................................................................... 9
2.6.1. Chico Site.................................................................................................................... 10 2.6.2. Foresthill Site .............................................................................................................. 10
3.1. HAZARD IDENTIFICATION........................................................................................ 12 3.1.1. Overview..................................................................................................................... 12 3.1.2. Mechanism of Action.................................................................................................. 12 3.1.3. Pharmacokinetics and Metabolism ............................................................................. 13
3.1.3.1. General Considerations........................................................................................ 13 3.1.3.2. Absorption............................................................................................................ 13 3.1.3.3. Excretion .............................................................................................................. 15
3.1.4. Acute Oral Toxicity .................................................................................................... 15 3.1.5. Subchronic or Chronic Systemic Toxic Effects.......................................................... 16 3.1.6. Effects on Nervous System......................................................................................... 17 3.1.7. Effects on Immune System ......................................................................................... 18 3.1.8. Effects on Endocrine System...................................................................................... 18 3.1.9. Reproductive and Developmental Effects .................................................................. 19
3.1.9.1. Developmental Studies ........................................................................................ 19 3.1.9.2. Reproduction Studies ........................................................................................... 20
3.1.10. Carcinogenicity and Mutagenicity............................................................................ 22 3.1.11. Irritation and Sensitization (Effects on the Skin and Eyes) ...................................... 22 3.1.12. Systemic Toxic Effects from Dermal Exposure ....................................................... 23 3.1.13. Inhalation Exposure .................................................................................................. 23 3.1.14. Other Ingredients in Formulations and Adjuvants.................................................... 23
3.1.14.1. Other Ingredients in Formulations ..................................................................... 23 3.1.14.2. Adjuvants ........................................................................................................... 24
3.1.15. Impurities and Metabolites ....................................................................................... 25 3.1.16. Toxicological Interactions ........................................................................................ 25

iii
3.2. EXPOSURE ASSESSMENT .......................................................................................... 27 3.2.1. Overview..................................................................................................................... 27 3.2.2. Workers....................................................................................................................... 27
3.2.2.1. General Exposures ............................................................................................... 27 3.2.2.1.1. Airblast Sprayer Applications....................................................................... 27 3.2.2.1.2. High Pressure Foliar Applications ................................................................ 29
3.2.2.2. Accidental Exposures........................................................................................... 30 3.2.3. General Public........................................................................................................... 31
3.2.3.1.1. Likelihood of Exposure................................................................................. 31 3.2.3.1.2. Summary of Assessments ............................................................................. 32
3.2.3.2. Direct Spray ......................................................................................................... 32 3.2.3.3. Dermal Exposure from Contaminated Vegetation............................................... 33 3.2.3.4. Contaminated Water ............................................................................................ 34
3.2.3.4.1. Accidental Spill............................................................................................. 34 3.2.3.4.2. Accidental Direct Spray/drift for a Pond or Stream...................................... 35 3.2.3.4.3. GLEAMS Modeling...................................................................................... 35
3.2.3.4.3.1. Methods for Site-Specific Modeling...................................................... 36 3.2.3.4.3.2. Results of Site-Specific Modeling ......................................................... 39 3.2.3.4.3.3. Results of Generic Modeling ................................................................. 40
3.2.3.4.5. Monitoring Data............................................................................................ 41 3.2.3.4.6. Downstream Contamination ......................................................................... 42 3.2.3.4.7. Concentrations in Water Used for Risk Assessment .................................... 44
3.2.3.5. Oral Exposure from Contaminated Fish .............................................................. 44 3.2.3.6. Dermal Exposure from Swimming in Contaminated Water................................ 44 3.2.3.6. Oral Exposure from Contaminated Vegetation.................................................... 45
3.3. DOSE-RESPONSE ASSESSMENT ................................................................................. 47 3.3.1. Overview..................................................................................................................... 47 3.3.2. Acute RfD ................................................................................................................... 47 3.3.3. Chronic RfD................................................................................................................ 48 3.3.4. Surrogate RfD for Occupational Exposures ............................................................... 48 3.3.5. Dose-Severity Relationships....................................................................................... 48
3.4. RISK CHARACTERIZATION....................................................................................... 49 3.4.1. Overview..................................................................................................................... 49 3.4.2. Workers....................................................................................................................... 49 3.4.3. General Public............................................................................................................. 50 3.4.4. Sensitive Subgroups.................................................................................................... 52 3.4.5. Connected Actions ...................................................................................................... 52 3.4.6. Cumulative Effects...................................................................................................... 52
4.1. HAZARD IDENTIFICATION.......................................................................................... 54 4.1.1. Overview..................................................................................................................... 54 4.1.2. Toxicity to Terrestrial Organisms............................................................................... 54
4.1.2.1. Mammals.............................................................................................................. 54 4.1.2.2. Birds..................................................................................................................... 55 4.1.2.3. Reptiles ................................................................................................................ 56
iv
4.1.2.4. Terrestrial Invertebrates ....................................................................................... 56 4.1.2.5. Terrestrial Plants (Macrophytes).......................................................................... 59 4.1.2.6. Terrestrial Microorganisms.................................................................................. 59
4.1.3. Aquatic Organisms...................................................................................................... 59 4.1.3.1. Fish....................................................................................................................... 59
4.1.3.1.1. Acute Toxicity .............................................................................................. 59 4.1.3.1.2. Chronic Toxicity ........................................................................................... 61 4.1.3.1.3. Field and Mesocosm Studies ........................................................................ 61
4.1.3.2. Amphibians .......................................................................................................... 62 4.1.3.3. Aquatic Invertebrates ........................................................................................... 62
4.1.3.3.1. Acute Toxicity .............................................................................................. 62 4.1.3.3.2. Chronic Toxicity ........................................................................................... 64 4.1.3.3.3. Mesocosm Studies ........................................................................................ 65
4.1.3.4. Aquatic Plants ...................................................................................................... 66 4.2. EXPOSURE ASSESSMENT ............................................................................................ 67
4.2.1. Overview..................................................................................................................... 67 4.2.2. Mammals and Birds .................................................................................................... 67
4.2.2.1. Direct Spray ......................................................................................................... 67 4.2.2.2. Dermal Contact with Contaminated Vegetation .................................................. 67 4.2.2.3. Ingestion of Contaminated Vegetation or Prey.................................................... 68 4.2.2.4. Ingestion of Contaminated Water ........................................................................ 68
4.2.3. Terrestrial Invertebrates .............................................................................................. 69 4.2.3.1. Direct Spray and Drift.......................................................................................... 69 4.2.3.2. Ingestion of Contaminated Vegetation or Prey.................................................... 70 4.2.3.3. Contact with Contaminated Soil .......................................................................... 71
4.2.4. Terrestrial Plants ......................................................................................................... 71 4.2.5. Aquatic Organisms...................................................................................................... 71
4.3. DOSE-RESPONSE ASSESSMENT ................................................................................. 73 4.3.1. Overview..................................................................................................................... 73 4.3.2. Toxicity to Terrestrial Organisms............................................................................... 74
4.3.2.1. Mammals.............................................................................................................. 74 4.3.2.2. Birds..................................................................................................................... 74 4.3.2.3. Terrestrial Invertebrates ....................................................................................... 75
4.3.2.3.1. Contact Toxicity Value (for Direct Spray) ................................................... 75 4.3.2.3.2. Oral Toxicity Value ...................................................................................... 76 4.3.2.3.3. Soil Toxicity Values ..................................................................................... 77
4.3.2.4. Terrestrial Plants (Macrophytes).......................................................................... 77 4.3.2.5. Terrestrial Microorganisms.................................................................................. 77
4.3.3. Aquatic Organisms...................................................................................................... 78 4.3.3.1. Fish....................................................................................................................... 78
4.3.3.1.1. Acute Toxicity Values .................................................................................. 78 4.3.3.1.1. Chronic Toxicity Values ............................................................................... 78
4.3.3.2. Amphibians .......................................................................................................... 80 4.3.3.3. Aquatic Invertebrates ........................................................................................... 80

v
4.3.3.3.1. Aquatic Arthropods....................................................................................... 80 4.3.3.3.2. Other Aquatic Invertebrates.......................................................................... 81
4.3.3.4. Aquatic Plants ...................................................................................................... 82 4.4. RISK CHARACTERIZATION......................................................................................... 83
4.4.1. Overview..................................................................................................................... 83 4.4.2. Terrestrial Organisms.................................................................................................. 84
4.4.2.1. Mammals.............................................................................................................. 84 4.4.2.2. Birds.................................................................................................................... 84 4.4.2.3. Terrestrial Invertebrates ....................................................................................... 85 4.4.2.4. Terrestrial Plants .................................................................................................. 86 4.4.2.5. Terrestrial Microorganisms.................................................................................. 86
4.4.3. Aquatic Organisms...................................................................................................... 86 4.4.3.1. Fish....................................................................................................................... 86
4.4.3.1.1. Accidental Exposures.................................................................................... 86 4.4.3.1.2. Peak Expected Exposures ............................................................................. 86 4.4.3.1.3. Longer-term Expected Exposures................................................................. 88
4.4.3.2. Amphibians .......................................................................................................... 88 4.4.3.3. Aquatic Invertebrates ........................................................................................... 88
4.4.3.3.1 Aquatic Arthropods........................................................................................ 88 4.4.3.3.2. Other Aquatic Invertebrates.......................................................................... 90
4.4.3.4. Aquatic Plants ...................................................................................................... 91 5. REFERENCES ......................................................................................................................... 92
LIST OF FIGURES Figure 1: USGS Use Map for Lambda-Cyhalothrin During 2002.............................................. 119 Figure 2: Chico Site Aerial View................................................................................................ 120 Figure 3: Foresthill Site Aerial View.......................................................................................... 121 Figure 4: Foresthill Precipitation, Comparison of Cligen Simulation to Historical Data........... 122 Figure 5: Daily Peak Stream Flows at Chico Site....................................................................... 123 Figure 6: Acute toxicity values for aquatic animals ................................................................... 124 Figure 7: Impact of DOC on toxicity to Hyalella azteca............................................................ 125
vi
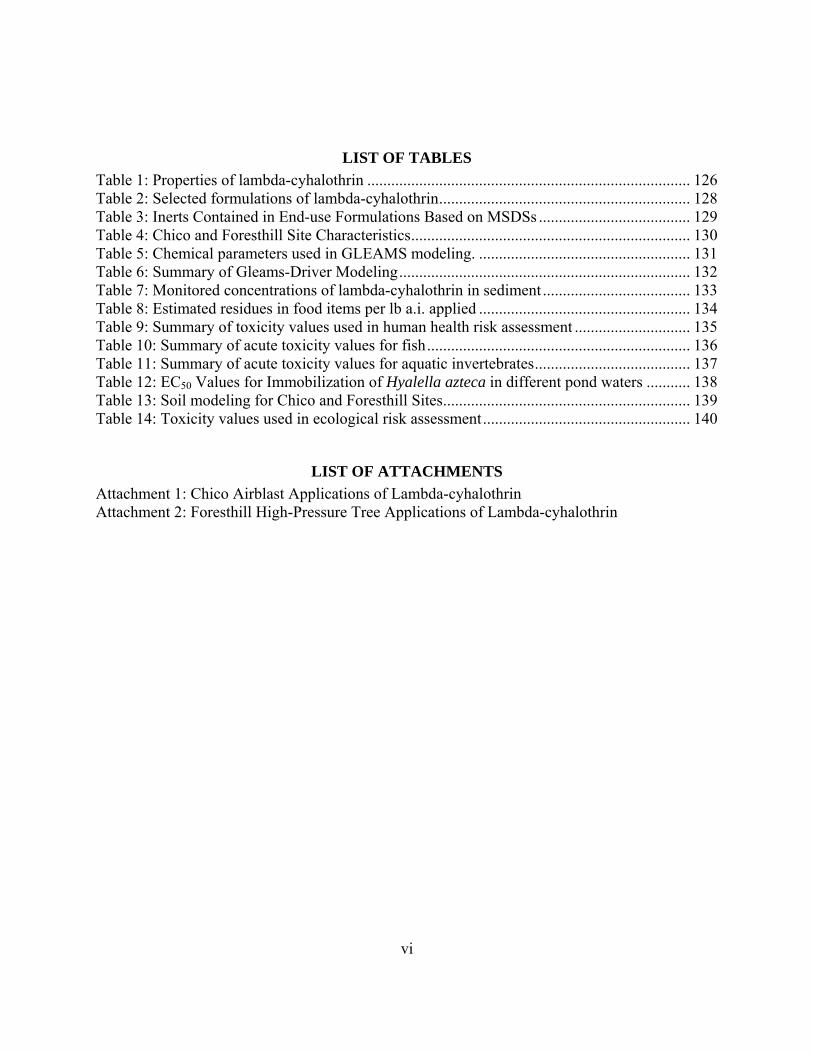
LIST OF TABLES Table 1: Properties of lambda-cyhalothrin ................................................................................. 126 Table 2: Selected formulations of lambda-cyhalothrin............................................................... 128 Table 3: Inerts Contained in End-use Formulations Based on MSDSs ...................................... 129 Table 4: Chico and Foresthill Site Characteristics...................................................................... 130 Table 5: Chemical parameters used in GLEAMS modeling. ..................................................... 131 Table 6: Summary of Gleams-Driver Modeling......................................................................... 132 Table 7: Monitored concentrations of lambda-cyhalothrin in sediment ..................................... 133 Table 8: Estimated residues in food items per lb a.i. applied ..................................................... 134 Table 9: Summary of toxicity values used in human health risk assessment ............................. 135 Table 10: Summary of acute toxicity values for fish.................................................................. 136 Table 11: Summary of acute toxicity values for aquatic invertebrates....................................... 137 Table 12: EC50 Values for Immobilization of Hyalella azteca in different pond waters ........... 138 Table 13: Soil modeling for Chico and Foresthill Sites.............................................................. 139 Table 14: Toxicity values used in ecological risk assessment.................................................... 140
LIST OF ATTACHMENTS Attachment 1: Chico Airblast Applications of Lambda-cyhalothrin Attachment 2: Foresthill High-Pressure Tree Applications of Lambda-cyhalothrin
vii
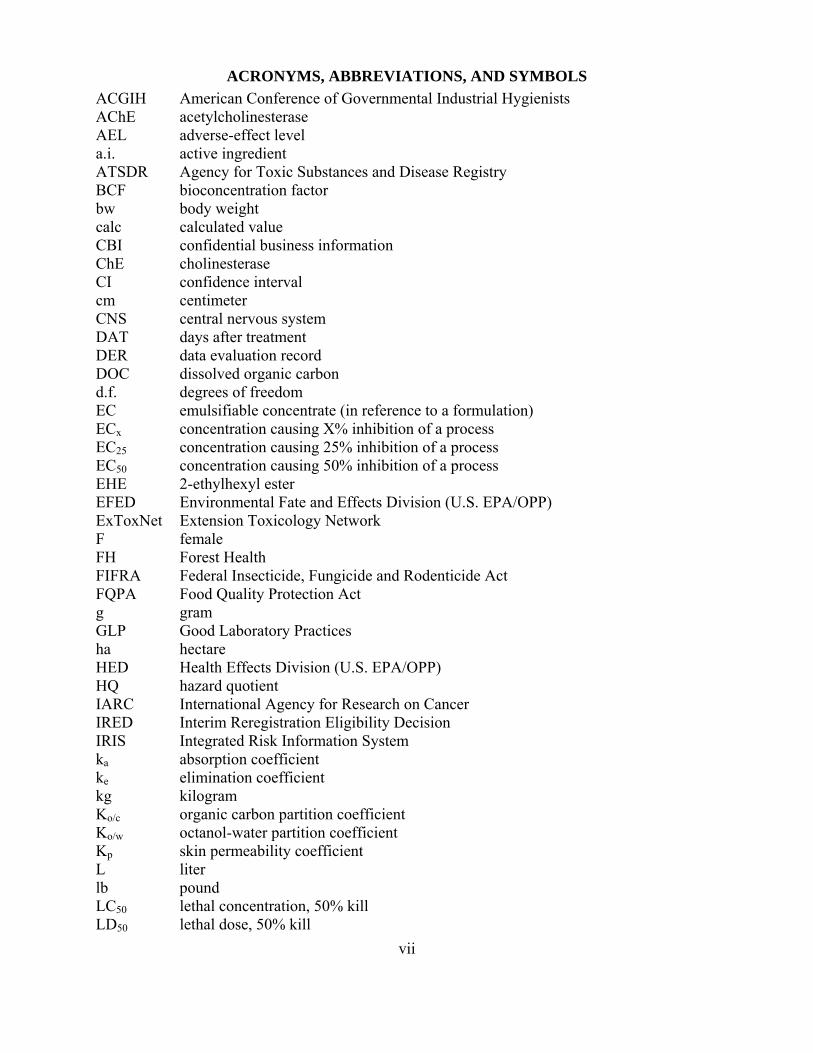
ACRONYMS, ABBREVIATIONS, AND SYMBOLS ACGIH American Conference of Governmental Industrial Hygienists AChE acetylcholinesterase AEL adverse-effect level a.i. active ingredient ATSDR Agency for Toxic Substances and Disease Registry BCF bioconcentration factor bw body weight calc calculated value CBI confidential business information ChE cholinesterase CI confidence interval cm centimeter CNS central nervous system DAT days after treatment DER data evaluation record DOC dissolved organic carbon d.f. degrees of freedom EC emulsifiable concentrate (in reference to a formulation) ECx concentration causing X% inhibition of a process EC25 concentration causing 25% inhibition of a process EC50 concentration causing 50% inhibition of a process EHE 2-ethylhexyl ester EFED Environmental Fate and Effects Division (U.S. EPA/OPP) ExToxNet Extension Toxicology Network F female FH Forest Health FIFRA Federal Insecticide, Fungicide and Rodenticide Act FQPA Food Quality Protection Act g gram GLP Good Laboratory Practices ha hectare HED Health Effects Division (U.S. EPA/OPP) HQ hazard quotient IARC International Agency for Research on Cancer IRED Interim Reregistration Eligibility Decision IRIS Integrated Risk Information System ka absorption coefficient ke elimination coefficient kg kilogram Ko/c organic carbon partition coefficient Ko/w octanol-water partition coefficient Kp skin permeability coefficient L liter lb pound LC50 lethal concentration, 50% kill LD50 lethal dose, 50% kill
ACRONYMS, ABBREVIATIONS, AND SYMBOLS (continued)
viii
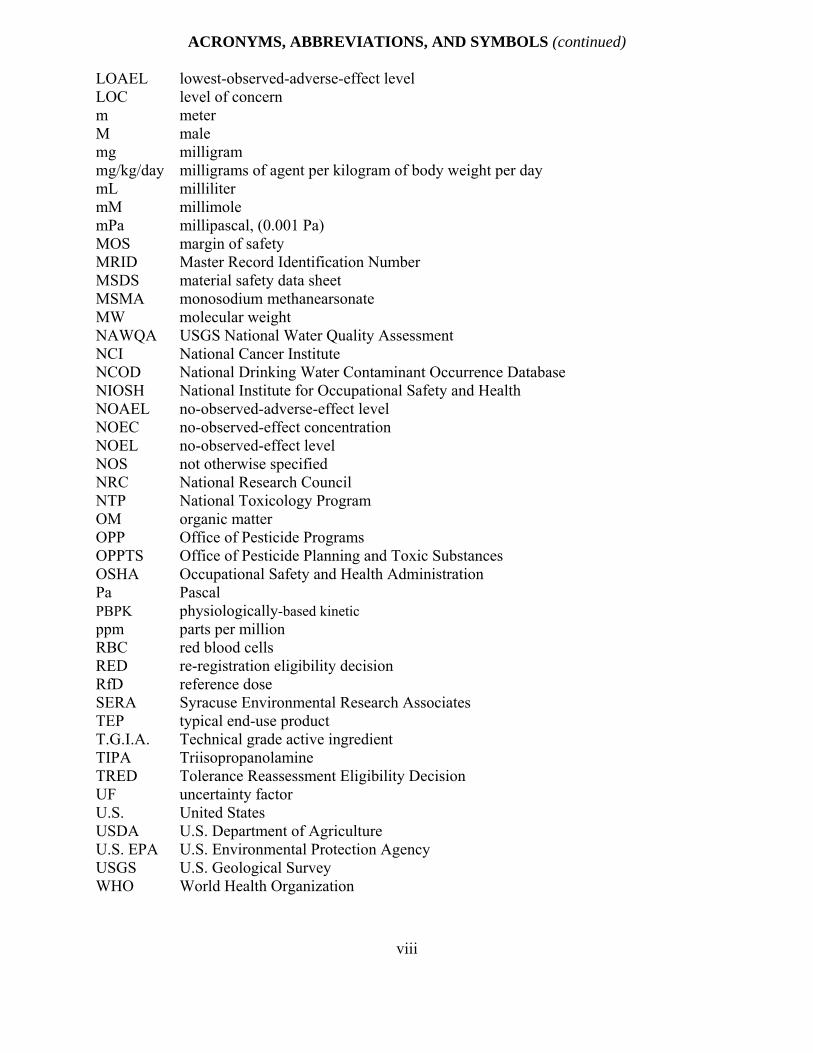
LOAEL lowest-observed-adverse-effect level LOC level of concern m meter M male mg milligram mg/kg/day milligrams of agent per kilogram of body weight per day mL milliliter mM millimole mPa millipascal, (0.001 Pa) MOS margin of safety MRID Master Record Identification Number MSDS material safety data sheet MSMA monosodium methanearsonate MW molecular weight NAWQA USGS National Water Quality Assessment NCI National Cancer Institute NCOD National Drinking Water Contaminant Occurrence Database NIOSH National Institute for Occupational Safety and Health NOAEL no-observed-adverse-effect level NOEC no-observed-effect concentration NOEL no-observed-effect level NOS not otherwise specified NRC National Research Council NTP National Toxicology Program OM organic matter OPP Office of Pesticide Programs OPPTS Office of Pesticide Planning and Toxic Substances OSHA Occupational Safety and Health Administration Pa Pascal PBPK physiologically-based kinetic ppm parts per million RBC red blood cells RED re-registration eligibility decision RfD reference dose SERA Syracuse Environmental Research Associates TEP typical end-use product T.G.I.A. Technical grade active ingredient TIPA Triisopropanolamine TRED Tolerance Reassessment Eligibility Decision UF uncertainty factor U.S. United States USDA U.S. Department of Agriculture U.S. EPA U.S. Environmental Protection Agency USGS U.S. Geological Survey WHO World Health Organization
acres
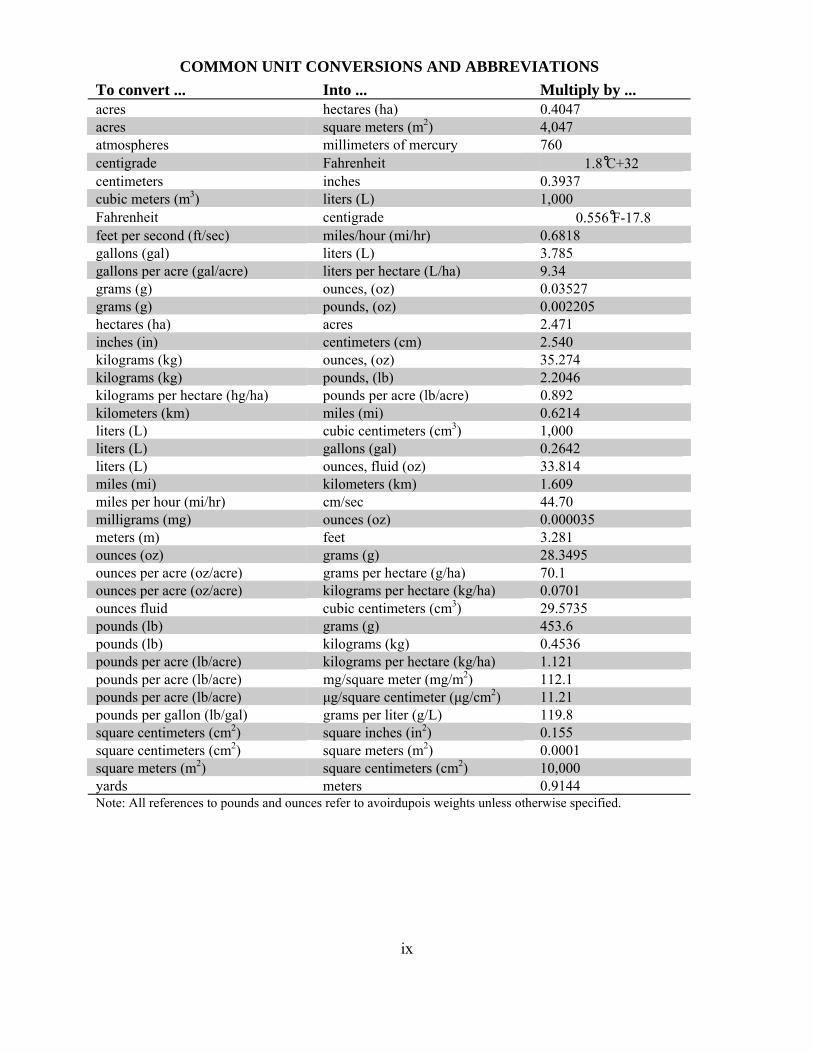
COMMON UNIT CONVERSIONS AND ABBREVIATIONS To convert ... Into ... Multiply by ...
hectares (ha) 0.4047 acres square meters (m2) 4,047 atmospheres millimeters of mercury 760 centigrade Fahrenheit 1.8 ̊C+32 centimeters inches 0.3937 cubic meters (m3) liters (L) 1,000 Fahrenheit centigrade 0.556 ̊F-17.8 feet per second (ft/sec) miles/hour (mi/hr) 0.6818 gallons (gal) liters (L) 3.785 gallons per acre (gal/acre) liters per hectare (L/ha) 9.34 grams (g) ounces, (oz) 0.03527 grams (g) pounds, (oz) 0.002205 hectares (ha) acres 2.471 inches (in) centimeters (cm) 2.540 kilograms (kg) ounces, (oz) 35.274 kilograms (kg) pounds, (lb) 2.2046 kilograms per hectare (hg/ha) pounds per acre (lb/acre) 0.892 kilometers (km) miles (mi) 0.6214 liters (L) cubic centimeters (cm3) 1,000 liters (L) gallons (gal) 0.2642 liters (L) ounces, fluid (oz) 33.814 miles (mi) kilometers (km) 1.609 miles per hour (mi/hr) cm/sec 44.70 milligrams (mg) ounces (oz) 0.000035 meters (m) feet 3.281 ounces (oz) grams (g) 28.3495 ounces per acre (oz/acre) grams per hectare (g/ha) 70.1 ounces per acre (oz/acre) kilograms per hectare (kg/ha) 0.0701 ounces fluid cubic centimeters (cm3) 29.5735 pounds (lb) grams (g) 453.6 pounds (lb) kilograms (kg) 0.4536 pounds per acre (lb/acre) kilograms per hectare (kg/ha) 1.121 pounds per acre (lb/acre) mg/square meter (mg/m2) 112.1 pounds per acre (lb/acre) μg/square centimeter (μg/cm2) 11.21 pounds per gallon (lb/gal) grams per liter (g/L) 119.8 square centimeters (cm2) square inches (in2) 0.155 square centimeters (cm2) square meters (m2) 0.0001 square meters (m2) square centimeters (cm2) 10,000 yards meters 0.9144 Note: All references to pounds and ounces refer to avoirdupois weights unless otherwise specified.
ix

x
CONVERSION OF SCIENTIFIC NOTATION Scientific Notation
Decimal Equivalent
Verbal Expression
1 · 10-10 0.0000000001 One in ten billion
1 · 10-9 0.000000001 One in one billion
1 · 10-8 0.00000001 One in one hundred million
1 · 10-7 0.0000001 One in ten million
1 · 10-6 0.000001 One in one million
1 · 10-5 0.00001 One in one hundred thousand
1 · 10-4 0.0001 One in ten thousand
1 · 10-3 0.001 One in one thousand
1 · 10-2 0.01 One in one hundred
1 · 10-1 0.1 One in ten
1 · 100 1 One
1 · 101 10 Ten
1 · 102 100 One hundred
1 · 103 1,000 One thousand
1 · 104 10,000 Ten thousand
1 · 105 100,000 One hundred thousand
1 · 106 1,000,000 One million
1 · 107 10,000,000 Ten million
1 · 108 100,000,000 One hundred million
1 · 109 1,000,000,000 One billion
1 · 1010 10,000,000,000 Ten billion
xi
1 2 3 4 5 6 7 8 9
10 11 12 13 14 15 16 17 18 19 20 21 22 23 24 25 26 27 28 29 30 31 32 33 34 35 36 37 38 39 40 41 42 43
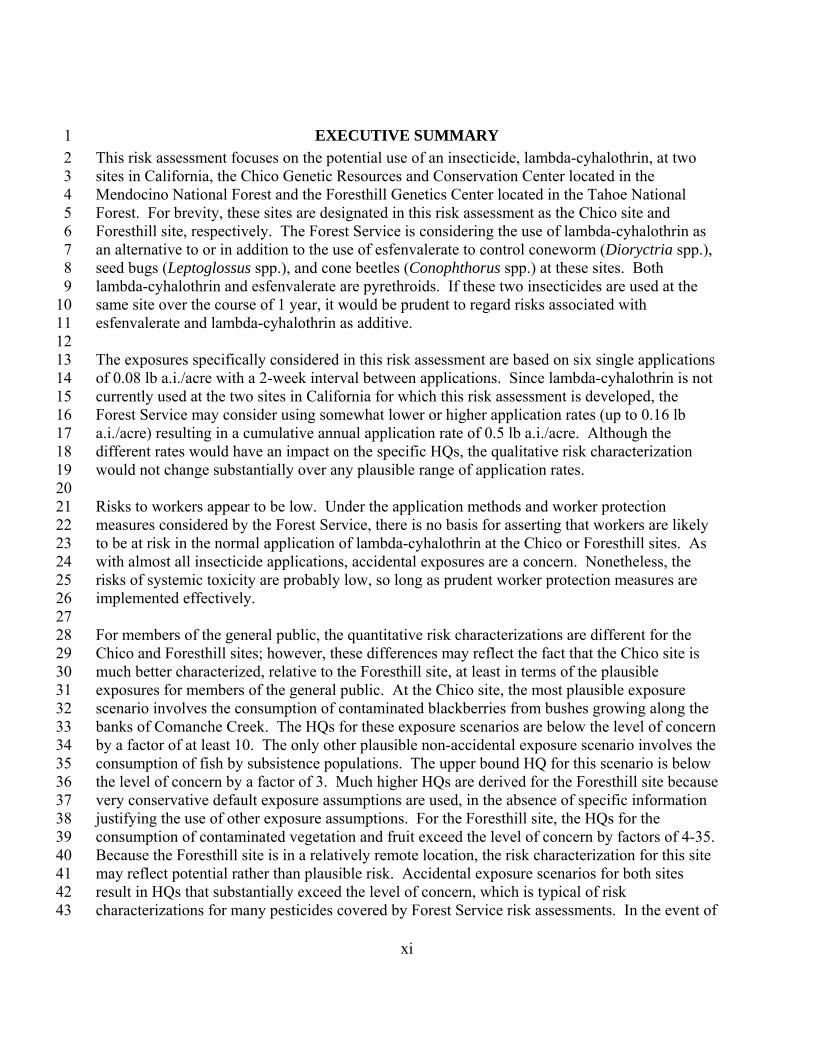
EXECUTIVE SUMMARY This risk assessment focuses on the potential use of an insecticide, lambda-cyhalothrin, at two sites in California, the Chico Genetic Resources and Conservation Center located in the Mendocino National Forest and the Foresthill Genetics Center located in the Tahoe National Forest. For brevity, these sites are designated in this risk assessment as the Chico site and Foresthill site, respectively. The Forest Service is considering the use of lambda-cyhalothrin as an alternative to or in addition to the use of esfenvalerate to control coneworm (Dioryctria spp.), seed bugs (Leptoglossus spp.), and cone beetles (Conophthorus spp.) at these sites. Both lambda-cyhalothrin and esfenvalerate are pyrethroids. If these two insecticides are used at the same site over the course of 1 year, it would be prudent to regard risks associated with esfenvalerate and lambda-cyhalothrin as additive. The exposures specifically considered in this risk assessment are based on six single applications of 0.08 lb a.i./acre with a 2-week interval between applications. Since lambda-cyhalothrin is not currently used at the two sites in California for which this risk assessment is developed, the Forest Service may consider using somewhat lower or higher application rates (up to 0.16 lb a.i./acre) resulting in a cumulative annual application rate of 0.5 lb a.i./acre. Although the different rates would have an impact on the specific HQs, the qualitative risk characterization would not change substantially over any plausible range of application rates. Risks to workers appear to be low. Under the application methods and worker protection measures considered by the Forest Service, there is no basis for asserting that workers are likely to be at risk in the normal application of lambda-cyhalothrin at the Chico or Foresthill sites. As with almost all insecticide applications, accidental exposures are a concern. Nonetheless, the risks of systemic toxicity are probably low, so long as prudent worker protection measures are implemented effectively. For members of the general public, the quantitative risk characterizations are different for the Chico and Foresthill sites; however, these differences may reflect the fact that the Chico site is much better characterized, relative to the Foresthill site, at least in terms of the plausible exposures for members of the general public. At the Chico site, the most plausible exposure scenario involves the consumption of contaminated blackberries from bushes growing along the banks of Comanche Creek. The HQs for these exposure scenarios are below the level of concern by a factor of at least 10. The only other plausible non-accidental exposure scenario involves the consumption of fish by subsistence populations. The upper bound HQ for this scenario is below the level of concern by a factor of 3. Much higher HQs are derived for the Foresthill site because very conservative default exposure assumptions are used, in the absence of specific information justifying the use of other exposure assumptions. For the Foresthill site, the HQs for the consumption of contaminated vegetation and fruit exceed the level of concern by factors of 4-35. Because the Foresthill site is in a relatively remote location, the risk characterization for this site may reflect potential rather than plausible risk. Accidental exposure scenarios for both sites result in HQs that substantially exceed the level of concern, which is typical of risk characterizations for many pesticides covered by Forest Service risk assessments. In the event of
xii
1 2 3 4 5 6 7 8 9
10 11 12 13 14 15 16 17 18 19 20 21 22 23 24 25 26
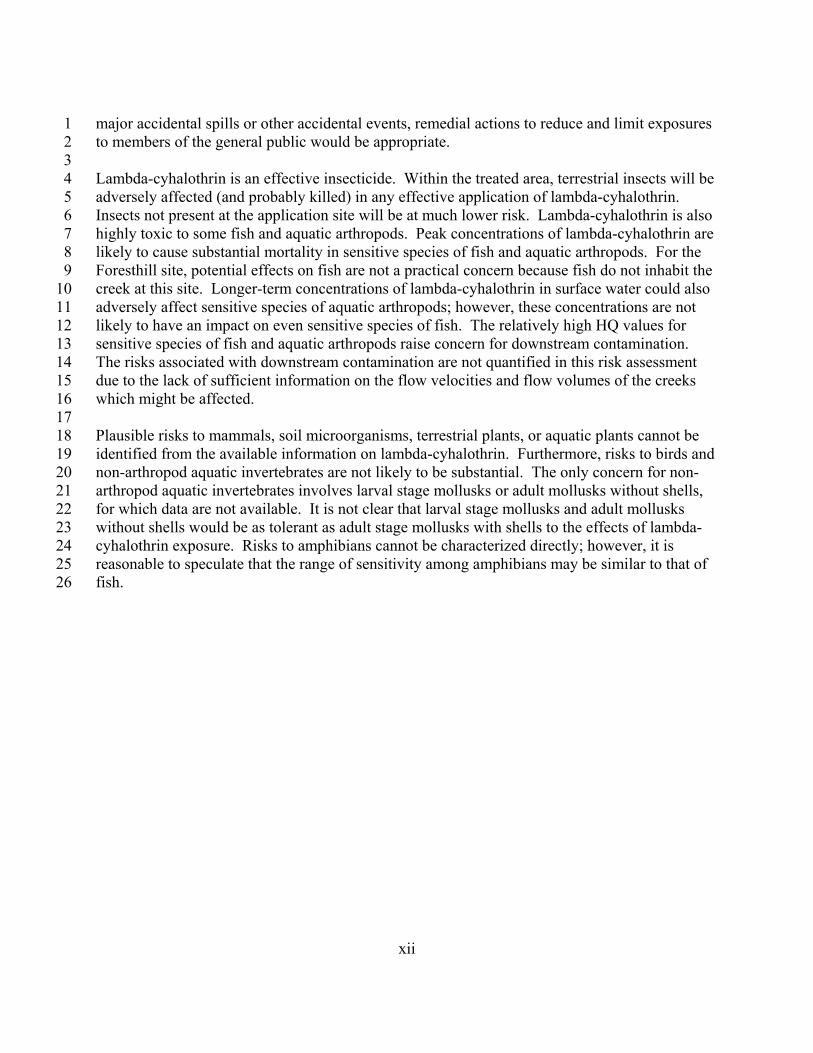
major accidental spills or other accidental events, remedial actions to reduce and limit exposures to members of the general public would be appropriate. Lambda-cyhalothrin is an effective insecticide. Within the treated area, terrestrial insects will be adversely affected (and probably killed) in any effective application of lambda-cyhalothrin. Insects not present at the application site will be at much lower risk. Lambda-cyhalothrin is also highly toxic to some fish and aquatic arthropods. Peak concentrations of lambda-cyhalothrin are likely to cause substantial mortality in sensitive species of fish and aquatic arthropods. For the Foresthill site, potential effects on fish are not a practical concern because fish do not inhabit the creek at this site. Longer-term concentrations of lambda-cyhalothrin in surface water could also adversely affect sensitive species of aquatic arthropods; however, these concentrations are not likely to have an impact on even sensitive species of fish. The relatively high HQ values for sensitive species of fish and aquatic arthropods raise concern for downstream contamination. The risks associated with downstream contamination are not quantified in this risk assessment due to the lack of sufficient information on the flow velocities and flow volumes of the creeks which might be affected. Plausible risks to mammals, soil microorganisms, terrestrial plants, or aquatic plants cannot be identified from the available information on lambda-cyhalothrin. Furthermore, risks to birds and non-arthropod aquatic invertebrates are not likely to be substantial. The only concern for non-arthropod aquatic invertebrates involves larval stage mollusks or adult mollusks without shells, for which data are not available. It is not clear that larval stage mollusks and adult mollusks without shells would be as tolerant as adult stage mollusks with shells to the effects of lambda-cyhalothrin exposure. Risks to amphibians cannot be characterized directly; however, it is reasonable to speculate that the range of sensitivity among amphibians may be similar to that of fish.

1. INTRODUCTION 1 2 3 4 5 6 7 8 9
10 11 12 13 14 15 16
This document is an abbreviated risk assessment of the human health and ecological effects associated with the use of lambda-cyhalothrin in USDA Forest Service programs. Lambda-cyhalothrin is an insecticide which is being considered to control the coneworm (Dioryctria spp.), seed bugs (Leptoglossus spp.), and cone beetles (Conophthorus spp.) at two sites in California. Currently, esfenvalerate is used to control these pests. This risk assessment focuses on the use of lambda-cyhalothrin at these two sites only. In the event that the Forest Service wishes to consider using lambda-cyhalothrin at a wider range of locations, the risk assessment covers the more general use of the insecticide in other regions of the United States. The information covered in this risk assessment is based on a standard search of TOXLINE as well as available reviews and assessments by the U.S. EPA (U.S. EPA/OPP 1988a; U.S. EPA/OPP 2002a; U.S. EPA/OPP 2004a; U.S. EPA/ORD 1988), the World Health Organization (WHO 1990a,b), and the Agency for Toxic Substances and Disease Registry (ATSDR 2003), and the California Department of Pesticide Regulation (http://www.cdpr.ca.gov/docs/registration/reevaluation/chemicals /pyrethroids.htm). An additional source of information included all cleared reviews that are available from the U.S. EPA/OPP (
17 18
http://www.epa.gov/pesticides/foia/reviews/128897/index.htm) as well as a search of the E-Docket (
19 http://www.regulations.gov) for entries related to lambda-
cyhalothrin. A total of 107 cleared reviews relevant to this Forest Service risk assessment were downloaded and are included in the reference list (Section 5). The only documents from the E-Docket search to be reviewed in detail are those that appeared to be directly related to quantitative assessments of risks—e.g., pesticide tolerances. U.S. EPA/OPP is in the process of updating the risk assessments for pyrethroids (
20 21 22 23 24 25
http://www.epa.gov/oppsrrd1/ reevaluation/pyrethroids-pyrethrins.html#epa). At the time this Forest Service risk assessment was prepared, however, REDs or related documents (i.e., science chapters) on or covering lambda-cyhalothrin were not identified.
26 27 28 29 30 31 32 33 34 35 36 37 38 39 40 41 42 43 44
The current risk assessment is abbreviated in the interest of economy because of the limited uses of lambda-cyhalothrin under consideration by the Forest Service (i.e., applications at only two sites). More specifically, efficacy studies were not obtained or reviewed unless the information from the literature search suggested that the efficacy study might contain information on effects to nontarget organisms or sublethal toxicity (e.g., Abro et al. 1987; Li and Harmsen 1993). Emphasis is placed on studies conducted in the United States, particularly studies conducted in California. Studies conducted outside of the United States were not reviewed unless they appeared to be relevant in terms of nontarget effects or the development of resistance in target species. Furthermore, the information and discussion presented in the current Forest Service risk assessment is less detailed than that in standard Forest Service risk assessments —e.g., fewer and less detailed appendices are included, and some topics relevant to the hazard identification place greater reliance on reviews by U.S. EPA and ATSDR than is typical in most Forest Service risk assessments.
1
1 2 3 4 5 6 7 8 9
10 11 12 13 14 15 16 17 18 19 20 21 22 23 24 25 26 27 28 29 30 31 32
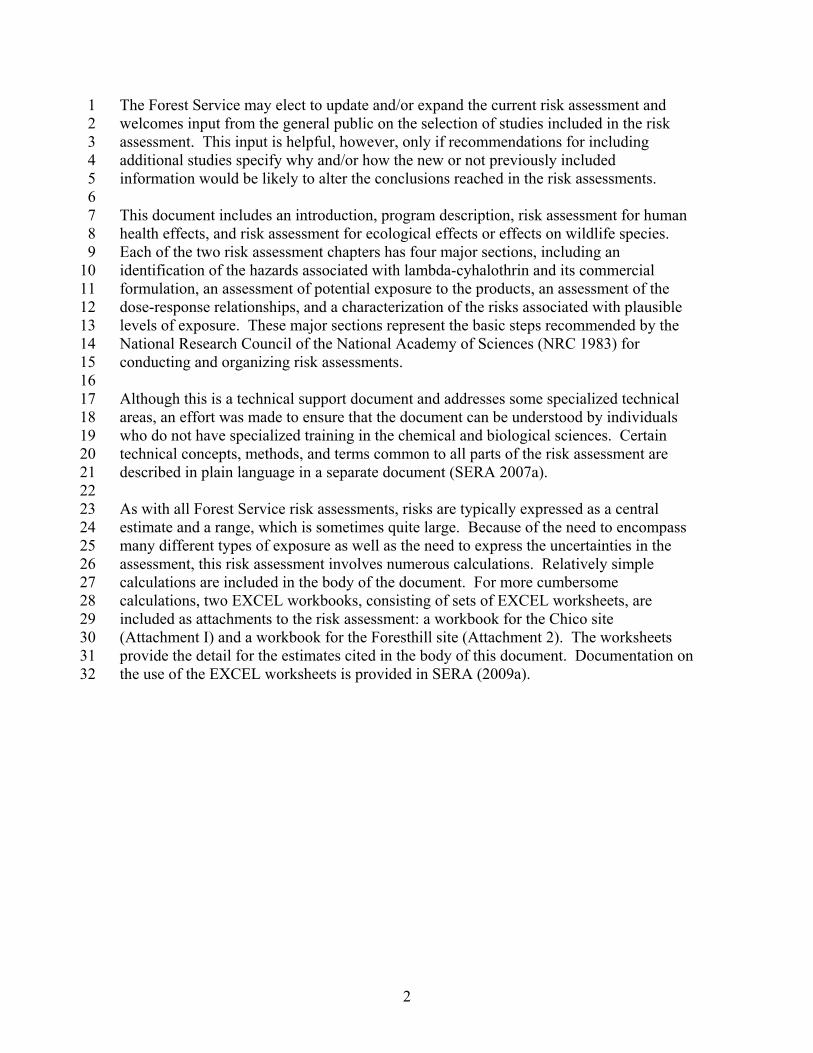
The Forest Service may elect to update and/or expand the current risk assessment and welcomes input from the general public on the selection of studies included in the risk assessment. This input is helpful, however, only if recommendations for including additional studies specify why and/or how the new or not previously included information would be likely to alter the conclusions reached in the risk assessments. This document includes an introduction, program description, risk assessment for human health effects, and risk assessment for ecological effects or effects on wildlife species. Each of the two risk assessment chapters has four major sections, including an identification of the hazards associated with lambda-cyhalothrin and its commercial formulation, an assessment of potential exposure to the products, an assessment of the dose-response relationships, and a characterization of the risks associated with plausible levels of exposure. These major sections represent the basic steps recommended by the National Research Council of the National Academy of Sciences (NRC 1983) for conducting and organizing risk assessments. Although this is a technical support document and addresses some specialized technical areas, an effort was made to ensure that the document can be understood by individuals who do not have specialized training in the chemical and biological sciences. Certain technical concepts, methods, and terms common to all parts of the risk assessment are described in plain language in a separate document (SERA 2007a). As with all Forest Service risk assessments, risks are typically expressed as a central estimate and a range, which is sometimes quite large. Because of the need to encompass many different types of exposure as well as the need to express the uncertainties in the assessment, this risk assessment involves numerous calculations. Relatively simple calculations are included in the body of the document. For more cumbersome calculations, two EXCEL workbooks, consisting of sets of EXCEL worksheets, are included as attachments to the risk assessment: a workbook for the Chico site (Attachment I) and a workbook for the Foresthill site (Attachment 2). The worksheets provide the detail for the estimates cited in the body of this document. Documentation on the use of the EXCEL worksheets is provided in SERA (2009a).
2

2. PROGRAM DESCRIPTION 1
2 3 4 5 6 7 8 9
10 11 12 13 14 15 16 17 18 19 20 21 22 23 24 25 26 27 28 29
30 31 32 33
2.1. OVERVIEW Lambda-cyhalothrin is an insecticide that is being considered by the Forest Service as an alternative to or in addition to esfenvalerate for the control of control of coneworm (Dioryctria spp.), seed bugs (Leptoglossus spp.), and cone beetles (Conophthorus spp.). At this time, the Forest Service is considering using lambda-cyhalothrin at only two sites located in California—i.e., the Chico Genetic Resources and Conservation Center located in the Mendocino National Forest and the Foresthill Genetics Center located in the Tahoe National Forest. For brevity, these sites are designated in this risk assessment as the Chico Site and Foresthill site, respectively. Lambda-cyhalothrin is produced by Syngenta, LG Life Sciences, Ltd, United Phosphorus Inc., and Helm Agro US, Inc., and more than 170 formulations are available. The current risk assessment explicitly considers formulations identified by the Forest Service as candidates for use. The information included in the risk assessment, however, should support an analysis of any formulation registered by the EPA for the pest species of concern. Only two application methods are currently being considered by the Forest Service, low volume ground-based broadcast orchard sprayer (at the Chico site) and high volume individual-tree spray (Foresthill site). For low volume ground applications, the maximum labeled rate for a single application is 0.16 lb a.i./acre with a maximum cumulative annual application rate of 0.5 lb a.i./acre. Thus, up to three applications at 0.16 lb a.i./acre could be made each year. The Forest Service does anticipate multiple applications with an application interval of 2-4 weeks. For high volume applications to individual trees, application rates in units of lb a.i./acre are not given on the product labels. The mixing and application instructions on the labels, however, lead to application rates of 0.002-0.004 lb a.i./tree. Nonetheless, the maximum annual application rate of 0.5 lb a.i./acre is applicable to tree applications as well as airblast applications.
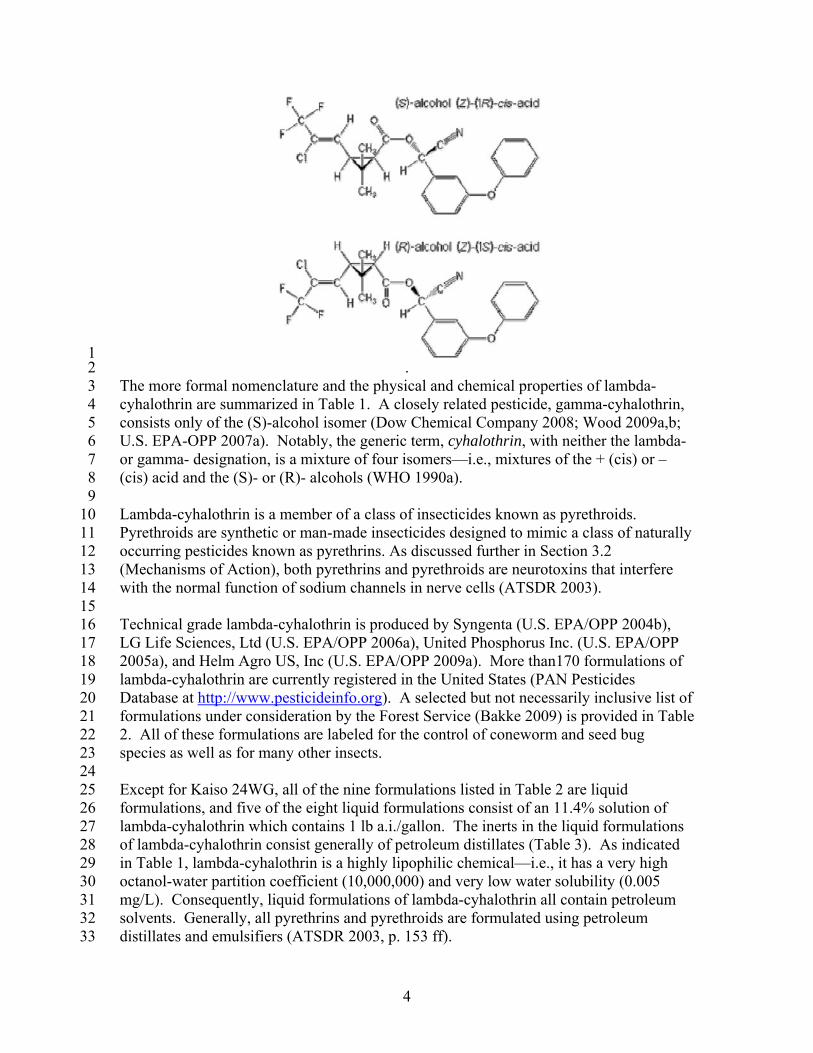
2.2. CHEMICAL DESCRIPTION AND COMMERCIAL FORMULATIONS Lambda-cyhalothrin is the common name for a 1:1 mixture of two enantiomers (i.e., stereoisomers that are nonsuperimposable mirror images) of a phenoxybenzyl halogenated cyclopropane-carboxylate:
3
1 2 3 4 5 6 7 8 9
10 11 12 13 14 15 16 17 18 19
. The more formal nomenclature and the physical and chemical properties of lambda-cyhalothrin are summarized in Table 1. A closely related pesticide, gamma-cyhalothrin, consists only of the (S)-alcohol isomer (Dow Chemical Company 2008; Wood 2009a,b; U.S. EPA-OPP 2007a). Notably, the generic term, cyhalothrin, with neither the lambda- or gamma- designation, is a mixture of four isomers—i.e., mixtures of the + (cis) or – (cis) acid and the (S)- or (R)- alcohols (WHO 1990a). Lambda-cyhalothrin is a member of a class of insecticides known as pyrethroids. Pyrethroids are synthetic or man-made insecticides designed to mimic a class of naturally occurring pesticides known as pyrethrins. As discussed further in Section 3.2 (Mechanisms of Action), both pyrethrins and pyrethroids are neurotoxins that interfere with the normal function of sodium channels in nerve cells (ATSDR 2003). Technical grade lambda-cyhalothrin is produced by Syngenta (U.S. EPA/OPP 2004b), LG Life Sciences, Ltd (U.S. EPA/OPP 2006a), United Phosphorus Inc. (U.S. EPA/OPP 2005a), and Helm Agro US, Inc (U.S. EPA/OPP 2009a). More than170 formulations of lambda-cyhalothrin are currently registered in the United States (PAN Pesticides Database at http://www.pesticideinfo.org). A selected but not necessarily inclusive list of formulations under consideration by the Forest Service (Bakke 2009) is provided in Table 2. All of these formulations are labeled for the control of coneworm and seed bug species as well as for many other insects.
20 21 22 23 24 25 26 27 28 29 30 31 32 33
Except for Kaiso 24WG, all of the nine formulations listed in Table 2 are liquid formulations, and five of the eight liquid formulations consist of an 11.4% solution of lambda-cyhalothrin which contains 1 lb a.i./gallon. The inerts in the liquid formulations of lambda-cyhalothrin consist generally of petroleum distillates (Table 3). As indicated in Table 1, lambda-cyhalothrin is a highly lipophilic chemical—i.e., it has a very high octanol-water partition coefficient (10,000,000) and very low water solubility (0.005 mg/L). Consequently, liquid formulations of lambda-cyhalothrin all contain petroleum solvents. Generally, all pyrethrins and pyrethroids are formulated using petroleum distillates and emulsifiers (ATSDR 2003, p. 153 ff).
4
1 2 3 4 5 6 7 8 9
10 11 12 13 14 15 16 17 18 19 20 21 22 23 24 25 26 27 28 29 30 31 32 33 34 35 36 37 38 39 40 41 42 43 44 45 46
As summarized in Table 3, the formulations designated as Grizzly X, Lambda-T, and Taiga-Z contain the same specifications: 11.4% a.i., ≤1.4% naphthalene, and unspecified amounts of propylene glycol and an unspecified petroleum solvent. The formulation specification for Warrior is quite similar to these formulations differing only slightly in the specification of the amount of naphthalene—i.e., <1.5% in Warrior vs ≤1.4% for Grizzly X, Lambda-T, and Taiga-Z. Warrior II does not specify the proportion of any inerts, indicating only that the inerts are a petroleum solvent and titanium dioxide. The MSDS for these formulations designate unspecified inerts as ranging from about 77 to 88% of the formulations. U.S. EPA/OPPTS (2003, p. 5-2) encourages but does not require expanded inert statements on product labels which specifically identify the inert ingredients in the product label. Relatively detailed inert statements are presented only on the product labels for the Lambda-Cy and Silencer formulations. Lambda-Cy specifies only one designated inert, Solvesso 200. Nonetheless, relatively detailed information on this inert is available. Solvesso 200 is a solution of naphtha, a heavy aromatic petroleum distillate that contains naphthalene (≤ 14%) as well as 1-methylnaphthalene (≤ 12.5%) and 2-methylnaphthalene (≤ 26.5%) (Exxon Mobil 2007). Only 10.6% of the inerts in Lambda-Cy are unspecified. The inerts in the Silencer formulation are more clearly specified—i.e., 74.8% of an aromatic solvent with a designated CAS number and 7.84% naphthalene. Only 1.06% of the inerts in Silencer are unspecified. While the liquid formulations of lambda-cyhalothrin differ in the way in which the inerts are specified, most of these liquid formulations appear to be generally similar to liquid formulations of other pyrethroids—i.e., emulsifiers and petroleum distillates (ATSDR 2003). The potential impact of these inerts on the consideration of lambda-cyhalothrin formulations is discussed further in Section 3.1.14 (Inerts and Adjuvants). Lambdastar 1 CS is somewhat unusual in that no inerts are specified on either the product label or the MSDS. The MSDS states that: Ingredients not precisely identified are proprietary or non-hazardous. U.S. EPA requires that products containing >10% petroleum distillates, xylene, or other xylene range aromatics contain a statement identifying these inerts at least qualitatively on the product label (U.S. EPA/OPPTS 2003, p. 5-6, 5-11) as well as a cautionary note to physicians concerning the potential for vomiting to cause aspiration pneumonia. Although the MSDS and product label contain cautionary language on vomiting, they do not specifically indicate that petroleum distillates are included in the formulation. The product label for this formulation was reviewed by U.S. EPA/OPP (unsigned letter dated April 9, 2009) and no comments addressing inerts are made in the EPA review. Thus, if Lambdastar 1 CS contains petroleum distillates, the concentration may be <10%. The one granular formulation of lambda-cyhalothrin, Kaiso 24WG, contains only one designated inert, N-methyl pyrrolidone. N-methyl pyrrolidone is used in many pesticide formulations as a solvent, and this agent is also discussed in Section 3.1.14 (Inerts and Adjuvants). As detailed further in Section 2.4 (Mixing and Application Rates), the
5
1 2 3 4 5 6 7 8 9
10 11 12 13 14 15 16
17 18 19 20 21 22 23 24 25 26 27 28 29 30 31 32 33 34 35 36 37 38 39 40
labeled mixing directions for Kaiso 24WG do not recommend the use of petroleum based solvents. Thus, applications of Kaiso 24WG differ from applications of other lambda-cyhalothrin formulations in that the potential effects of petroleum based solvents are not a consideration. All formulations of lambda-cyhalothrin are classified as restricted use pesticides—i.e., they may be applied only by certified applicators or individuals under the direct supervision of certified pesticide applicators. The rationale for the restricted use classification specified on the product labels involves the toxicity of lambda-cyhalothrin to fish and other aquatic organisms, as discussed further in Section 4.1.3. The literature on lambda-cyhalothrin contains many publications that refer to Karate formulations. Two Karate formulations are available from Syngenta, a 13.1% liquid (Karate) and a 22.8% liquid (Karate with Zeon Technology). These formulations are not included in Table 2 because they are not registered in California; however, their use in other Forest Service regions, are encompassed in this risk assessment.
2.3. APPLICATION METHODS The Forest Service is considering only two foliar application methods for lambda-cyhalothrin. At the Chico site, the application would be via an orchard air blast sprayer, towed behind a tractor with an enclosed cab. At the Foresthill Site, applications would be made to individual trees using high-pressure nozzles. In these applications, workers will wear waterproof Tyvek overalls with a built-in hood, full face shield, protective glasses, rubber boots, and chemical gloves taped into the coveralls. The impact of the use of personal protective equipment is considered further in the exposure assessment for workers. All applications would be made at wind speeds of less than 15 miles per hour. Typically, two workers would be involved in an application. One individual would prepare the tank mix and monitor safety procedures. The other individual would apply the pesticide. The applicator would wear coveralls, rubber boots, and a hard hat. The use of personal protective equipment is discussed further in Section 3.2.2 (Exposure Assessment for Workers). Typically, applications could be made from April through August, up to twice a month, depending on the tree species (sugar pine, ponderosa pine, Douglas-fir, white fir). Timing for Douglas-fir would be earlier, perhaps starting as early as April, and probably in May for white fir or sugar pine. Final treatments would be in July (for August collection of Douglas-fir seeds) or August (for September collection of at least sugar pine seed).
6

2.4. MIXING AND APPLICATION RATES 1
2 3 4 5 6 7 8 9
10 11 12 13 14 15 16 17 18 19 20 21 22 23 24 25 26 27 28 29 30
31 32 33 34 35 36 37 38 39 40 41 42 43 44
2.3.1. Foliar Air Blast Applications (Chico Site) All of the labels for the lambda-cyhalothrin formulations listed in Table 2 recommend application rates about 0.16 lb a.i./acre for the control of coneworms or seed bugs. As summarized in Table 3, most of the liquid formulations contain 1 lb a.i./gallon. For these formulations, label directions for low volume ground-based applications specify that 20 fl. oz should be added to each 100 gallons of water and that 100 gallons of the finished solution should be applied to each acre. Thus, the application rate is about 0.16 lb a.i./acre [20 oz ÷ (128 oz/gal) x (1 lb a.i./gal)/acre = 0.15625 lb a.i./acre]. The Warrior II formulation contains 2.08 lb a.i./gallon and specifies a low volume ground spray rate of 10 fl. oz/100 gallons with an application rate of 100 gallons of finished spray per acre. This also corresponds to an application rate of about 0.16 lb a.i./acre [10 oz ÷ (128 oz/gal) x (2.08 lb a.i./gal)/acre = 0.1625 lb a.i./acre], although the precise application rate is somewhat higher than that for the 1 lb a.i./gallon formulations. The product for the Kaiso 24WG granular formulation (24% a.i.) indicates that 10.4 oz (avoirdupois) should be added to 100 gallons of water and that 100 gallons of the finished solution should be applied per acre. This corresponds to an application rate of 0.156 lb a.i./acre [10.4 oz/acre x 0.24 x 1 lb/16 oz = 0.156 lb a.i./acre]. The product labels for all formulations of lambda-cyhalothrin indicate that the maximum annual application rate for the control of coneworm and seed bug species is 0.5 lb a.i./acre. Thus, at the recommended broadcast application rate of 0.16 lb a.i./acre, lambda-cyhalothrin could be applied up to three times per year. The product labels do not recommend a specific application interval for the control of coneworm and seed bug species. Applications at the Chico site are made between 5:00 and 10:00 PM and involve five operators, each using 500 gallon tanks towed by a tractor with an enclosed, air-conditioned cabin. To further reduce worker exposure, the door in the tractor cabin is covered with heavy plastic stripping, ceiling to floor (Bakke 2009c).
2.3.2. Applications to Individual Trees (Forest Hill Site) In applications to single trees, all of the formulations listed in Table 2 recommend application rates of about 0.002-0.004 lb a.i./tree. The liquid formulations containing 1 lb a.i./acre indicate that 5.12 fl. oz. of formulation should be used for each 100 gallons of finished solution and that 5-10 gallons should be applied per tree, which corresponds to application rates of precisely 0.002-0.004 lb a.i./tree [(1 lb/gallon formulation x 5.12 oz formulation x 1 gallon/128 oz ÷ 100 gallons) x 5-10 gallons/tree]. The product label for the Warrior II formulation (2.08 lb a.i./gallon) specifies that 2.56 fl oz should be used per 100 gallons of water and that 5-10 gallons should be applied per tree. Because the Warrior II formulation contains somewhat more than twice the amount of a.i., these directions lead to modestly and insignificantly higher application rates of 0.00208-0.00416 lb a.i./tree [(2.08 lb/gallon formulation x 2.56 oz formulation x 1 gallon/128 oz ÷ 100 gallons) x 5-10 gallons/tree]. The product for the Kaiso 24WG granular formulation (24% a.i.) indicates that 2.67 oz (avoirdupois) should be used per 100 gallons of water
7

1 2 3 4 5 6 7 8 9
10 11 12 13 14 15 16 17 18 19 20 21 22 23 24 25 26 27 28 29 30 31 32 33 34 35 36 37 38 39 40 41 42 43 44
and that 5-10 gallons should be applied per tree, which corresponds to an application rate of almost exactly 0.002-0.004 lb a.i./tree [(2.67 oz x 1 lb/16 oz x 0.24 a.i. / 100 gallons) x 5-10 gallons/tree = 0.0020025-0.004005 lb a.i./tree]. The maximum annual application rate of 0.5 lb a.i./acre applies to tree applications as well as airblast applications. Thus, at application rates of 0.002-0.004 lb a.i./tree, 125-250 tree applications per acre would be allowed. If tree applications were repeated as in broadcast applications—i.e., three applications per year at 2- to 4-week intervals—then 41-83 trees could be treated per acre over the course of 1 year.
2.3.3. Application Rates Used in Risk Assessment At the time this risk assessment was prepared, the Forest Service had not made a final determination on the application rates, number of applications, and application intervals. Initially, three applications at an application rate of 0.16 lb a.i./acre with a 3-week interval were considered. The application rate of 0.16 lb a.i./acre was selected because this is the recommended application rate for the control of coneworm and seed bug species. The application interval of 3 weeks was selected based on information from the Forest Service indicating that intervals of 2-4 weeks were under consideration (Bakke 2009a). Three applications were selected so that the cumulative application rate would not exceed the labeled cumulative application rate of 0.5 lb a.i./acre. Subsequent information from the Forest Service indicated that the application rate of 0.16 lb a.i./acre could exceed the application rate that the Forest Service might use and that past practice with esfenvalerate had involved 6 applications at 2-week intervals (Bakke 2009c). This assessment is consistent with other uses of lambda-cyhalothrin in Forest Service programs—i.e., an application rate of 0.025 lb a.i./acre in Region 8 (Mistretta 2007). Consequently, for the current Forest Service risk assessment, six applications at 0.08 lb a.i./acre at 2-week intervals are used for the exposure assessments at the Chico and Foresthill sites. As discussed further in Section 3.2.3.4.3 (GLEAMS Modeling), other application rates are considered (e.g., three applications at 0.16 lb a.i./acre with a 4-week application interval); however, these variations do not have a substantial impact on the estimated concentrations of lambda-cyhalothrin in water. Varying application rates for lambda-cyhalothrin are also discussed in the risk characterization for human health (Section 3.4) and ecological effects (Section 4.4). Applications associated with other potential uses of lambda-cyhalothrin in Forest Service programs may vary considerably. Lambda-cyhalothrin is incorporated into the Forest Service’s WorksheetMaker program, which allows for any number of applications at any interval. For WorksheetMaker, the WRC values are based on six applications at 2 week intervals. If a different application series is used in Forest Service programs, estimates of water contamination rates could be developed based on the application series and application site under consideration. As discussed further in Section 3.2.3.4.3.2 (Results of Site-Specific Modeling), differences in the characteristics of the application site appear to be more significant than differences in the application schedule or application rates over the range of 0.08-0.16 lb a.i./acre.
8

2.5. USE STATISTICS 1 2 Forest Service pesticide use reports do not include information on lambda-cyhalothrin
(http://www.fs.fed.us/ foresthealth/pesticide/reports.shtml), because it has not been used in Forest Service programs. Nonetheless, the proposed uses of lambda-cyhalothrin appear to be very minor compared with other uses of this insecticide in California and many parts of the United States.
3 4 5 6 7 8 9
10 11 12 13 14 15 16 17 18 19 20 21 22 23 24 25 26 27 28 29 30 31 32 33 34 35 36 37 38 39
40 41 42 43 44
As noted in Section 1, the USDA Forest Service is considering the use of lambda-cyhalothrin at only two sites in California—i.e., the Chico site (Chico Genetic Resources and Conservation Center located in the Mendocino National Forest) and the Foresthill site (Foresthill Genetics Center located in the Tahoe National Forest). The Foresthill site consists of 118 acres of seed production trees, and the Chico site consists of 83.7 acres of seed production trees. Thus, the Forest Service would treat a maximum of 201.7 acres in a given season. At the maximum annual application rate of 0.5 lb a.i./acre, the maximum amount of lambda-cyhalothrin that the Forest Service would use is about 100 lbs a.i. [201.7 acres x 0.5 lb a.i./acre = 100.85 lbs a.i.]. By comparison, a total of 59,505 acres were treated with lambda-cyhalothrin in California during 2007, the most recent year for which data are available from the California Department of Pesticide Regulation (CDPR 2008, p. 84). A total of 31,633 pounds were applied in agricultural applications in California (CDPR 2008, p. 219). In terms of the number of acres treated, lambda-cyhalothrin was the most widely used insecticide in California in 2007. The increased use of lambda-cyhalothrin may be associated with the upcoming patent expiration for this insecticide. The price of treatment with lambda-cyhalothrin is only about $3.00/acre (CDPR 2008, p. 84). The USGS use statistics for lambda-cyhalothrin are illustrated in Figure 1. In 2002, the most recent year for which USGS (2003) provides statistics, a total of about 235,000 lbs of lambda-cyhalothrin was used in the continental United States in agricultural applications. Lambda-cyhalothrin was most commonly applied to soybeans (≈19%), cotton (≈18%), corn (≈13%), sweet corn (≈12%), and rice (≈10%). The greatest concentrations of lambda-cyhalothrin agricultural applications occurred in the Southeast (Forest Service Region 8), Northeast (Forest Service Region 9), western South Dakota (in Forest Service Region 2), and central California (Forest Service Region 5). Based on the above use summary, the uses of lambda-cyhalothrin under consideration by the Forest Service at the two sites in California are very minor relative to agricultural uses in California (89.35 lbs ÷ 31,633 lbs ≈ 0.0028 = 0.28%) or total agricultural uses in the United States (89.35 lbs ÷ 235,000 lbs ≈ 0.00038 = 0.038%).
2.6. SITE DESCRIPTIONS The characteristics of the Chico and Foresthill sites are summarized in Table 4. Most of the data given in Table 4 are related to the Gleams-Driver modeling, as discussed further in Section 3.2.3.4.3. An aerial view of the Chico site is given in Figure 2, and the corresponding view for the Foresthill site is given in Figure 3. Outputs from AgDrift are
9

1 2 3 4
included beneath the site maps in Figures 2 and 3. These are discussed further in Section 3.2.3.4.3. The site maps in Figures 2 and 3 are taken from the USDA Soil Survey website (http://websoilsurvey.nrcs.usda.gov/app) based on latitude and longitude coordinates provided by the Forest Service. Most of the data given in Table 4 are also taken from the USDA Soil Survey website, except as otherwise noted in the footnotes to Table 4. Each site is briefly summarized in the following paragraphs.
5 6 7 8
9 10 11 12 13 14 15 16 17 18 19 20 21 22 23 24 25 26 27 28 29
30 31 32 33 34 35 36 37 38 39 40 41 42 43 44
2.6.1. Chico Site The Chico Genetic Resources and Conservation Center is located in the Mendocino National Forest near the outskirts of Chico, California. As summarized in Table 4, the site covers a 203-acre area within which 83.7 acres would be treated with pesticides. As illustrated in Figure 2, the Chico site is in a populated area with residences located about 0.3 miles to the east and west of the site. Based on images from Google Earth, the site appears to be open to and used by the general public. The soil at the Chico site consists primarily of fine sandy loam with a 0 to 1 % slope—i.e., the area designated as 447 in Figure 2. Comanche Creek runs through the center of the site, and Butte Creek/Diversion Channel runs along the eastern boarder of the site. A roadway open to the public appears to parallel Comanche Creek. Flow to Comanche Creek is controlled by the Oakee Dam in Butte Creek. During the winter months, water flow to Comanche Creek is turned off and water flow in Comanche Creek occurs only during storms due to runoff water from the Comanche Creek watershed. Nonetheless, standing water and near surface flows may be found in Comanche Creek year round. The maximum flow in Comanche Creek is estimated to be 150 cubic feet per second (USDA/FS 1998). The maximum flow rate of 150 cubic feet per second corresponds to approximately 367,000,000 liters/day [150 cubic feet per second x 28.32 L/cubic foot x 60 sec/min x 60 min/hr x 24 hr/day ≈ 3.67 x 10⁸ L/day].
2.6.2. Foresthill Site The Foresthill Genetics Center is located in the Tahoe National Forest. As summarized in Table 4, the Foresthill site covers a 342-acre area within which 45 acres would be treated with pesticides. Unlike the Chico site, the Foresthill Genetics Center is in a relatively remote location. The nearest inhabited area appears to be the city of Foresthill which is about 6 miles to the southwest of the Foresthill site. The soils in the Foresthill site consist largely of well-drained loam. The topography of the Foresthill site is much more variable than that of the Chico site, with slopes ranging from 2 to 50% with a representative slope of about 16% (http://websoilsurvey.nrcs. usda.gov/app). A portion of McBride Creek is within the Foresthill site. In terms of the current Forest Service risk assessment, the most important characteristic of McBride Creek is that it does not contain fish within the reach encompassed by the Foresthill site (Bakke 2010).
10
1 2 3 4 5 6 7 8 9
Based on elevations and imagery from both the USDA Soil Survey website and Google Earth it appears that McBride Creek may originate in the Foresthill site and flow to the southwest out of the Foresthill site. Unlike Comanche Creek, flows in the McBride Creek appear to be unregulated. No information is available on flow rates; however, according to the Forest Service, McBride Creek is ephemeral, with significant flows from December to May (USDA/FS 1998). It appears likely that flows might occur at any time as a result of atypical storm events; however, this speculation has not been confirmed by the Forest Service. As discussed in Section 3.2.3.4.3, there is a 200-foot, heavily vegetated buffer between the stream and areas likely to be treated with pesticides.
11

3.1. HAZARD IDENTIFICATION 1
2 3 4 5 6 7 8 9
10 11 12 13 14 15 16 17 18 19 20 21 22 23 24 25 26
27 28 29 30 31 32 33 34 35 36 37 38 39 40 41 42 43
3.1.1. Overview Lambda-cyhalothrin is a pyrethroid insecticide that interferes with the normal functioning of nerve cells. Most of the critical information on the hazard identification for lambda-cyhalothrin comes from reviews of studies submitted to U.S. EPA in support of the registration for lambda-cyhalothrin as well as a more general review by ATSDR on the toxicity of pyrethroid insecticides to mammals. U.S. EPA’s Office of Pesticide Programs (U.S. EPA/OPP) classifies potential acute hazards, based on several standard tests, ranging from the most hazardous (Category I) to the least hazardous (Category IV). U.S. EPA/OPP reviewed the acute toxicity data on lambda-cyhalothrin and classified it as Category II (moderately toxic), based on acute oral, dermal and inhalation toxicity; Category II based on eye irritation (i.e., a moderate eye irritant); and Category IV based on skin irritation (not a skin irritant). In addition, the EPA does not consider lambda-cyhalothrin a skin sensitizer; nonetheless, dermal exposure to lambda-cyhalothrin as well as many other pyrethroids may cause numbness or tingling of the skin, a condition commonly referred to as paresthesia. Lambda-cyhalothrin is neurotoxic; however, neurotoxicity is not always the most sensitive endpoint in longer-term exposures. Weight loss or decreased body weight gain are the effects commonly observed at doses below those associated with frank signs of neurotoxicity. Changes in body weight gain can be mediated by the endocrine system, and some studies suggest that lambda-cyhalothrin may affect normal endocrine function. Several other pyrethoids also affect the endocrine system; however, it is not clear whether these effects are direct or secondary to effects on the nervous system. Lambda-cyhalothrin is not classified as carcinogenic by the EPA.
3.1.2. Mechanism of Action Lambda-cyhalothrin is a pyrethroid, which is a class of man-made insecticides which are structurally similar to pyrethrins, a group of naturally occurring insecticides. The primary site of action for both pyrethrins and pyrethroids is the voltage-gated membrane sodium channel of nerve cells. The basic function of nerve cells involves repeated polarization and depolarization associated with neural activation or firing. These processes are controlled by channels which allow for the influx of ions into nerve cells. Both pyrethroids and pyrethrins inhibit the closing of sodium channels and thus disrupt normal nerve function. Only about 0.6% of the sodium channel gates need to be affected into order to elicit signs of neurotoxicity (ATSDR 2003). Some pyrethroids may also alter chlorine channels; however, this does not appear to be the case with lambda-cyhalothrin (Burr and Ray 2004). Based on chemical structure, pyrethroids are classified as Type I pyrethroids (compounds with no cyano group) or Type II pyrethroids (compounds with a cyano group). As illustrated in Section 2.2, lambda-cyhalothrin contains a cyano group (i.e., a carbon-nitrogen triple bond) and is classified as a Type II pyrethroid. Type I and Type II
12

1 2 3 4 5 6 7 8 9
10 11 12 13 14 15 16 17 18 19 20 21 22 23 24
25
26 27 28 29 30 31 32 33 34 35 36 37 38 39 40
41 42 43
pyrethroids differ in signs of neurotoxicity. Type I pyrethroids typically induce fine tremors, increased body temperatures, and coma. Type II pyrethoids induce involuntary movements, salivation, enhanced responses to stimuli, and coarse body tremors (ATSDR 2003). Signs of neurotoxicity after exposure to lambda-cyhalothrin are consistent with the signs of toxicity typically associated with Type II pyrethoids (Hossain et al. 2005); moreover, behavioral excitation has been observed in some humans following over-exposure to lambda-cyhalothrin (Martinez-Larrantildeaga et al. 2003). In severely poisoned animals, including humans, a broader range of effects may develop, the most characteristic of which appear to be diarrhea, nausea, and vomiting (ATSDR 2003; Hossain et al. 2005). As indicated in Section 1, the Forest Service is considering the use of lambda-cyhalothrin as an alternative to esfenvalerate, another Type II pyrethroid, for the control of coneworm and seed bug species in two seed orchards. In addition to lambda-cyhalothrin and esfenvalerate, commonly used Type II pyrethroids include gamma-cyhalothrin, cyfluthrin, cypermethrin, deltamethrin, fenvalerate, fenpropathrin, flucythrinate, flumethrin, fluvalinate, and tralomethrin (ATSDR 2003). Lambda-cyhalothrin causes a spectrum of other biochemical effects that are generally consistent with oxidative damage (El-Demerdash 2007; Fetoui et al. 2009). While lambda-cyhalothrin does not uncouple oxidative phosphorylation, it does affect mitochondrial respiration (Gassner et al. 1997). Generally, most biochemical effects of exposure to pyrethroids not directly associated with neurotoxicity and are considered secondary effects (ATSDR 2003).
3.1.3. Pharmacokinetics and Metabolism
3.1.3.1. General Considerations Very little information is available on the pharmacokinetics of lambda-cyhalothrin. The only human data come from the occupational exposure study by Leng et al. (1997) which reports an average plasma half-life of 6.4 hours for lambda-cyhalothrin as well as several other pyrethroids. Anadon et al. (2006) studied the pharmacokinetics of lambda-cyhalothrin in rats following both intravenous and oral exposures. By either route of exposure, lambda-cyhalothrin was widely distributed, with the highest concentrations detected in the hypothalamus and the myenteric plexus—i.e., an area of unmyelinated fibers enervating the gastrointestinal tract. The plasma half-lives in rats were 8.55 hours after intravenous administration and 14.43 hours after oral administration. Whole body elimination half-lives were 7.55 hours after intravenous exposure and 10.27 hours after oral exposure, which indicates that the excretion of lambda-cyhalothrin is as rapid in rats as in humans. Consistent with the mechanism of action of lambda-cyhalothrin and other pyrethroids, half-lives in nerve tissues were substantially greater (12-34 hours) than half-lives in plasma.
3.1.3.2. Absorption The available literature on lambda-cyhalothrin does not include information on dermal absorption. U.S. EPA/HED (1997c, p. 8; 2002, p. 12) summarizes the results of a dermal
13

1 2 3 4 5 6 7 8 9
10 11 12 13 14 15 16 17 18 19 20 21 22 23 24 25 26 27 28 29 30 31 32 33 34 35 36 37 38 39 40 41 42 43 44 45 46
exposure study in humans in which the average first-order dermal absorption rate was 0.0012 day-1 with a range from 0.0004 to 0.0019 day-1. These values correspond to hourly dermal absorption rates of about 0.00005 (0.000017- 0.000079) hour-1. In the most recent EPA hazard identification for lambda-cyhalothrin, U.S. EPA/HED (2002) uses a conservative estimate of 0.01 day-1 or about 0.00042 hour-1 for exposure assessments. In the absence of experimental data, Forest Service risk assessments generally adopt estimates of dermal absorption rates based on quantitative structure activity relationships (QSAR), as documented in SERA (2007a). Using these methods with the molecular weight (449.9 g/mole) and Kow (10,000,000) for lambda-cyhalothrin, the estimated first-order dermal absorption rates are approximately 0.0039 (0.00073– 0.021) hour-1. The calculation of these rates is detailed in Worksheet B06 in the EXCEL workbooks that accompany this risk assessment. Notably, the lower bound of the QSAR estimates—i.e., 0.00073 hour-1—is about 10 times greater than the upper bound of the dermal absorption rates from the human study—i.e., 0.000079 hour-1. Confidence in the QSAR estimates is limited also because the algorithm is based on an analysis of compounds with Kow values ranging up to only about 3,000,000 and molecular weights up to 400 g/mole. Although the QSAR estimates of the first-order dermal absorption rates are substantially higher than those from the human study, the measured rates from the human study are clearly preferable to the QSAR estimates for use in the risk assessment. For the current Forest Service risk assessment, the first-order dermal absorption rates are taken as 0.00005 (0.000017-0.00042) hour-1 or about 0.0012 (0.00041-0.01) day-1. Note that the central estimate and the lower bound are taken directly from the human study summarized by U.S. EPA. The upper bound, however, is adopted from the dermal absorption rate used by U.S. EPA/HED (2002), 0.01 day-1 or about 0.00042 hour-1. These dermal absorption rates are applied to exposure scenarios involving dermal contact with contaminated vegetation as well as spills of the pesticide onto the skin. In these types of exposure scenarios, the assumption of first-order dermal absorption is appropriate (SERA 2007a). Another set of exposure scenarios used in this risk assessment involves the assumption of zero-order absorption (i.e., the dermal absorption rate is constant over time). This type of assumption is reasonable when the skin is in constant contact with an amount or concentration of the pesticide and is fundamental to exposure scenarios in which workers wear contaminated gloves. This scenario assumes that the amount of pesticide saturating the inside of the gloves is greater than the degree of dermal absorption. When experimental data are not available to estimate a zero-order dermal absorption rate (i.e., typically referred to as a Kp in units of cm/hour), Forest Service risk assessments generally use a QSAR algorithm developed by the EPA (U.S. EPA/ORD 1992). This approach is discussed in further detail in SERA (2007a). As detailed in Worksheet B05 of the EXCEL workbooks that accompany this risk assessment, the QSAR algorithm developed by the EPA results in an estimated zero-order dermal absorption rate of 0.28 (0.073-1.1) cm/hour. As with the QSAR estimates of the first-order dermal absorption rates, confidence in the estimated zero-order rates is limited because the algorithm used
14
1 2 3 4 5 6 7 8 9
10 11 12 13
14 15 16 17 18 19 20 21
to estimate these rates is based on data from compounds with Kow values of up to only about 320,000, which is about 31 times less than the lambda-cyhalothrin Kow of 10,000,000. Given the discrepancies between the experimental and QSAR estimates of the first-order dermal absorption rates for lambda-cyhalothrin, confidence in the zero-order rates estimated from the EPA algorithm is extremely low. As discussed above, the lower bound of the QSAR estimates for the first-order rates appear to overestimate the rates by at least a factor of 10. For the current Forest Service risk assessment, the zero-order dermal absorption rate of 0.28 (0.073-1.1) cm/hour is adjusted downward by a factor of 10 and rounded to one significant place—i.e., rates of 0.03 (0.007-0.1) cm/hour. The uncertainties in the zero-order dermal absorption rates are substantial, as discussed further in the risk characterization (Section 3.4).
3.1.3.3. Excretion Although excretion rates are not used directly in either the dose-response assessment or risk characterization, excretion half-lives can be used to infer the effect of longer-term exposures on body burden, based on the plateau principle (e.g., Goldstein et al. 1974). The concentration of the chemical in the body after a series of doses (XInf) over an infinite period of time can be estimated based on the body burden immediately after a single dose, X0, by the relationship:
*0 1
1kt
Inf
eXX
−−= 22
23 24 25 26 27 28 29 30 31 32 33 34 35 36 37 38 39
40 41 42 43
where t* is the interval between dosing and k is the first-order excretion rate. As discussed in Section 3.1.3.1, the whole body half-life of lambda-cyhalothrin in rats after oral administration is 10.27 hours or about 0.42 days. Based on the assumption of first-order excretion, k may be estimated from the half-life (T½) as:
k = ln(2) ÷ T½. Based on this relationship, the half-life of 0.42 days corresponds to an elimination rate (k) of 1.65 day-1 [ln(2)÷0.42 days]. Substituting this value into the above equation for the plateau principle, the long-term body burden relative to the single dose body burden would be about 1.24. In other words, the available pharmacokinetic data on lambda-cyhalothrin do not suggest that prolonged exposure will result in substantial accumulation of the insecticide. This supposition is further supported by the ATSDR general review of the pharmacokinetics of pyrethroids (ATSDR 2003), which indicates that the excretion of most pyrethroids is relatively rapidly in mammals.
3.1.4. Acute Oral Toxicity U.S. EPA’s Office of Pesticide Programs (U.S. EPA/OPP) classifies potential acute hazards, based on several standard tests, ranging from the most hazardous (Category I) to the least hazardous (Category IV). As summarized in various EPA reviews (Hurley
15

1 2 3 4 5 6 7 8 9
10 11 12 13 14
15 16 17 18 19 20 21 22 23 24 25 26 27 28 29 30 31 32 33 34 35 36 37 38 39 40 41 42 43 44
1989a; U.S. EPA/HED 1997c; 2002), the oral LD50 for technical grade lambda-cyhalothrin is 79 mg/kg bw in male rats and 56 mg/kg bw in female rats. These values are used to classify lambda-cyhalothrin as Category II for acute oral toxicity. As discussed by ATSDR (2003, p. 34), the acute oral toxicity of pyrethrins and pyrethroids can be influenced by the dosing vehicle—i.e., the material in which the test substance is dissolved prior to dosing the animals. In the example cited by ATSDR, the LD50 value for permethrin in corn oil (i.e., 584 mg/kg bw) was substantially lower than the LD50 value for permethrin administered without a vehicle (i.e., 3801 mg/kg bw). The oral LD50 values for various formulations of lambda-cyhalothrin suggest a similar pattern. As summarized in Appendix 1, Table 1, the oral LD50 values for the liquid formulations, expressed in units of active ingredient, range from 7.2 to about 41 mg a.i./kg bw. The LD50 value for the one granular formulation is 74.4 mg a.i./kg bw, which falls within the range of oral LD50 values for technical grade lambda-cyhalothrin.
3.1.5. Subchronic or Chronic Systemic Toxic Effects The open literature does not include information on the subchronic or chronic toxicity of lambda-cyhalothrin. U.S. EPA/OPP summarizes information on two subchronic studies in rats and one subchronic study in mice (U.S. EPA/HED 1997c, p. 1 ff) as well as chronic toxicity studies in rats, mice, and dogs (U.S. EPA/HED 1997c, p. 3 ff). The summaries of these studies from U.S. EPA/HED (1997c) are the basis for the following discussion. The two subchronic studies in rats involved 90-day dietary exposures to Wistar derived rats in which the most sensitive endpoint was body weight loss which occurred at a dietary concentration of 250 ppm (≈12.4 mg/kg bw/day) with a NOEL of 50 ppm (≈2.5 mg/kg bw/day) in both studies. In one of these studies, a slight but statistically significant decrease in food conversion efficiency was noted in female rats. The subchronic study in mice was conducted over a 28-day period. The NOEC in mice was a dietary concentration 500 ppm, corresponding to a dose of 64.2 mg/kg bw/day in males and 77.9 mg/kg bw/day in females. At the next higher dietary concentration of 2000 ppm (≈309 mg/kg bw/day in males and ≈294 mg/kg bw/day in females), there were signs of neurotoxicity —i.e., abnormal gait and posture—and other effects of toxicity, including weight loss, slight changes in hematology and organ weights. Because the duration of the study in mice was substantially less than the duration of the studies in rats, it is not clear whether the substantially higher NOEL in mice, relative to rats, reflects species difference, the effect of duration, or a combination of these and other factors. The chronic studies in rats and mice both involved a 2-year period of exposure and suggest that mice may be somewhat more tolerant than rats to dietary administration of lambda-cyhalothrin. The rat study yielded a dietary NOEL of 50 ppm (corresponding to a dose of 2.5 mg/kg bw/day) with a corresponding LOAEL of 250 ppm (12.5 mg/kg bw/day) based on decreased body weight with no signs of neurotoxicity. The NOEL and LOAEL values are identical to those in the subchronic rat studies. In the chronic study in mice, the dietary NOEL was 100 ppm (15 mg/kg bw/day) with a LOAEL of 500 ppm (75
16
1 2 3 4 5 6 7 8 9
10 11 12 13
14 15 16 17 18 19 20 21 22 23 24 25 26 27 28 29 30 31 32 33 34 35 36 37 38 39 40 41 42
mg/kg bw/day). The LOAEL for mice is also based on decreased body weight, although piloerection and abnormal posture were observed in some test animals. The chronic study in dogs is based on the administration of lambda-cyhalothrin in gelatin capsules at doses of 0.1, 0.5, or 3.5 mg/kg bw/day for 1 year. No adverse effects were noted at the lowest dose. At 0.5 mg/kg bw/day, signs of neurotoxicity (abnormal gait) were noted in some animals over the period from Week 2 through Week 9 of the study. As discussed further in Section 3.3 (Dose-Response Assessment), the dose of 0.5 mg/kg bw is classified as a LOAEL for chronic exposure but a NOAEL for acute exposure. At 3.5 mg/kg bw/day, signs of neurotoxicity (ataxia, tremors, convulsions, and vomiting) were noted during the first 2 weeks of the study. As also discussed in Section 3.3.2, the dose of 3.5 mg/kg bw/day is classified as the LOAEL for acute exposure in the derivation of the acute RfD.
3.1.6. Effects on Nervous System As discussed in ATSDR (2003), lambda-cyhalothrin and many other pyrethroids as well as pyrethrins are clearly neurotoxic, and the mechanism of neurotoxicity is understood relatively well (Section 3.1.2). Wolansky et al. (2006) assayed the acute neurotoxicity of both lambda-cyhalothrin and esfenvalerate to rats. In this study, estimates were made of both the NOEC or threshold dose for neurotoxicity as well as the dose associated with a 30% decrease in motor activity in a maze (EC30) after gavage dosing. Lambda-cyhalothrin and esfenvalerate showed similar potencies with NOEC values of 0.52 and 0.48 mg/kg bw, respectively, and EC30 values of 1.32 and 1.2 mg/kg bw, respectively. The acute NOEC of 0.52 mg/kg bw in rats reported by Wolansky et al. (2006) is virtually identical to the estimated acute NOEC for neurotoxicity in dogs (Section 3.1.5). The NOEC of 0.5 mg/kg bw is also supported by the NOEC in rats of 1 mg/kg bw/day over a 7-day period of exposure (Righi and Palermo-Neto 2003). Consistent with the rapid excretion of lambda-cyhalothrin (Section 3.1.3), signs of neurotoxicity associated with sublethal doses of lambda-cyhalothrin as well as several other pyrethroids are reversible, with recovery times as short as 3-4 hours after dosing (Wright et al. 1988). While lambda-cyhalothrin is clearly neurotoxic, neurotoxicity is not always the most sensitive endpoint in standard toxicity studies. As summarized in Section 3.1.5, subchronic and chronic studies in rats and mice indicate that decreased body weight is a more sensitive endpoint than neurotoxicity in these species. The same pattern was observed in a delayed neurotoxicity study in which the most sensitive endpoint in hens was decreased body weight absent any signs of neurotoxicity (U.S. EPA/HED 2002). In a specialized test for acute neurotoxicity in rats, however, clear signs of neurotoxicity (i.e., piloerection, ataxia, salivation, lacrimation, and decreased motor activity) were noted at doses of 35 mg/kg bw/day and higher, with a NOAEL of 10 mg/kg bw (U.S. EPA/HED 2002, p.4). As discussed further in Section 3.1.9 (Reproductive and Developmental Effects), signs of neurotoxicity in rats were also noted in a developmental study.
17
3.1.7. Effects on Immune System 1 2 3 4 5 6 7 8 9
10 11 12 13 14 15 16 17 18 19 20 21 22 23 24 25 26 27 28 29 30
31 32 33 34 35 36 37 38 39 40 41 42 43 44 45
The most recent EPA review of lambda-cyhalothrin (U.S. EPA/HED 2002) does not address its potential to affect the immune system. Concern for the effects of pyrethroids on immune function is raised by ATSDR:
Results of a few recent animal studies suggest that neurodevelopmental, reproductive, and immunological effects may result following exposure to some pyrethroids at levels below those that induce overt signs of neurotoxicity.
ATSDR 2002, p. 16 Krishnappa et al. (1999) exposed two groups of rats to a very high dietary concentration (3000 ppm) of an unspecified 2.5% EC (emulsifiable concentrate) formulation of lambda-cyhalothrin for 90 days to assay its effects on immune function. One test group was treated with Brucella abortus antigen, while the other test group was not. No effects on immune function were noted in the antigen-free rats; however, in the antigen-treated group there were significant decreases in total immunoglobin concentration, total leukocyte count, and total lymphocyte count. Based on the subchronic toxicity studies summarized in Section 3.1.5, a dietary concentration of 3000 ppm would be expected to cause signs of toxicity in rats. Nevertheless, Krishnappa et al. (1999) do not report signs of toxicity other than changes in immune response. Righi and coworkers (Righi and Palermo-Neto 2005; Righi et al. 2009) assayed the immunotoxicity of cyhalothrin—i.e. a mixture of four cyhalothrin isomers rather than the two cyhalothrin isomers in lambda-cyhalothrin. Both studies report a decrease in macrophage activity which was statistically significant after in vivo 7-day exposures to doses of 1 and 3 mg/kg bw/day but not at 0.6 mg/kg bw/day. While these studies are not directly applicable to lambda-cyhalothrin, the NOAEL of 0.6 mg/kg bw/day is somewhat higher than the acute NOAEL of 0.5 mg/kg bw/day for neurotoxicity in dogs exposed to lambda-cyhalothrin (Section 3.1.5).
3.1.8. Effects on Endocrine System Impacts of pesticides on endocrine function are often assessed indirectly based on standard toxicity studies as well as reproduction studies (Section 3.1.9). Based on this type of information, the EPA concludes that:
There is no evidence that lambda-cyhalothrin induces any endocrine disruption.
U.S. EPA/HED 2002, p. 22 The ATSDR review (ATSDR 2003, pp. 107-108) indicates that several pyrethroids affect endocrine function. Furthermore, there is some indication in the open literature that lambda-cyhalothrin may affect endocrine function. In a 21-day gavage study in which rats were administered lambda-cyhalothrin at a dose of approximately 0.73 mg/kg bw/day, serum triiodothyronine (T3) and thyroxine (T4) as
18
1 2 3 4 5 6 7 8 9
10 11 12 13 14
15
16 17 18 19 20 21 22 23
well as T3/T4 ratios were significantly suppressed and serum thyroid stimulating hormone (TSH) levels were significantly increased. The dosing did not affect body weight gain, and no other signs of toxicity were noted (Akhtar et al. 1996). In an in vivo study, Ratnasooriya et al. (2003) exposed pregnant rats by gavage to Icon, a formulation of lambda-cyhalothrin used in Sri Lanka, at doses of 6.3, 8.3, or 12.5 mg a.i./kg bw/day for 7 days. The primary adverse reproductive effect was increased pre-implantation losses. This effect was blocked by co-administration of progesterone. No effects of lambda-cyhalothrin were noted on birth weight, fetal morphology, pre-natal development, and other standard reproductive parameters. Zhao et al. (2008) assayed the estrogenic effect of lambda-cyhalothrin in a breast carcinoma cell line. Concentrations as low as 10-7 M (about 45 µg/L) promoted cell proliferation—i.e., mimicked the effect of estrogen—and the cell proliferation was blocked by the addition of an estrogen receptor antagonist at a concentration of 10-9 M. Both of these observations suggest that lambda-cyhalothrin may have estrogenic activity.
3.1.9. Reproductive and Developmental Effects
3.1.9.1. Developmental Studies Developmental studies are used to assess whether a compound has the potential to cause birth defects—also referred to as teratogenic effects—as well as other effects during development or immediately after birth. These studies typically entail gavage administration to pregnant rats or rabbits on specific days of gestation. Teratology assays as well as studies on reproductive function (Section 3.1.9.2) are generally required for the registration of pesticides. Very specific protocols for developmental studies are established by U.S. EPA/OPPTS and are available at http://www.epa.gov/opptsfrs/publications/OPPTS_Harmonized. 24
25 26 27 28 29 30 31 32 33 34 35 36 37 38 39 40 41 42 43 44 45
The EPA requires developmental studies for pesticide registration; accordingly, several developmental studies are summarized in the most recent EPA/OPP review of lambda-cyhalothrin (U.S. EPA/HED 2002, p. 5 ff). In both rats and rabbits, no signs of toxicity were noted at doses of 10 mg/kg bw/day. In rats, signs of neurotoxicity were evident in dams at 15 mg/kg bw/day; there were no evident effects on the offspring—i.e., the developmental NOAEL was 15 mg/kg bw/day. In rabbits, decreases in body weight and food consumption were noted at 30 mg/kg bw/day. As with rats, however, no effects were noted on offspring, and 30 mg/kg bw/day was classified as a developmental NOAEL. As discussed in Section 3.1.8 (Effects on Endocrine System), the developmental study by Ratnasooriya et al. (2003) reports a significant increase in implantation losses at 8.3 and 12.5 mg/kg bw/day, with a NOAEL of 6.3 mg/kg bw/day. Unlike the rat developmental study summarized by U.S. EPA, dams in the study by Ratnasooriya et al. (2003) evidenced signs of neurotoxicity at all dose levels. As also noted in Section 3.1.8, the Ratnasooriya et al. (2003) study involved the use of a formulation of lambda-cyhalothrin—i.e., ICON, which is not being considered for use by the Forest Service. In an earlier study on the same formulation, Ratnasooriya et al. (2002) report that relatively low oral doses (i.e., about 6.3 and 10 mg/kg bw) of lambda-cyhalothrin were associated with a decrease in mating behavior in male rats.
19

1 2 3 4 5 6 7 8 9
10 11 12 13 14 15 16 17 18 19 20 21 22 23 24 25 26 27 28 29 30 31 32 33 34 35 36 37
38 39 40 41 42 43 44 45
In two studies conducted in Brazil, dermal doses of about 10 mg/kg bw cyhalothrin are associated with delayed development in rats (Da Silva Gomes et al. 1999a,b). It is not clear, however, that the isomeric composition of the cyhalothrin corresponds to lambda-cyhalothrin. In another study conducted in Brazil, Moniz et al. (1990) report that no adverse developmental effects were observed in rats exposed to 200 ppm concentrations of cyhalothrin in drinking water over a 21-day period of lactation. The rat pups were followed to adulthood, and the authors observed latent behavioral effects, reported as abnormal responses in avoidance tests, in 90-day-old rats. Again, however, it is not clear that the cyhalothrin used in this study corresponds to lambda-cyhalothrin. In a recent study conducted in Algeria, Lebaili et al. (2008) report evidence of testicular damage in rats exposed to very high concentrations of lambda-cyhalothrin in drinking water—i.e., about 15,000 or 23,000 ppm. In this study, the lambda-cyhalothrin was formulated as Karate 2.5 EC. As noted in Section 2, the use of Karate is not under consideration by the Forest Service in California. In addition, the exposures in this study appear to represent doses that are far higher than the NOEC values on which the RfD for lambda-cyhalothrin is based. Lebaili et al. (2008) do not provide water consumption data for the rats; they indicate that the body weights of the rats ranged from 225 to 250 g. The allometric relationship for water consumption in mammals developed by U.S. EPA/ORD (1993, Eq. 3-17, p. 3-10) is: W(L) = 0.099 B0.9
(kg) where W is the water consumption in liters and B is the body weight in kilograms. Thus, a 0.225 kg rat would consume about 0.02475 liters of water. If the water contained 15,000 ppm (mg/L) of lambda-cyhalothrin, the rat would consume about 371 mg for a total dose of about 1650 mg/kg bw. As discussed further in Section 3.3.2, the acute RfD is based on an NOEC of 0.5 mg/kg bw/day, a factor of over 8000 higher than the lowest dose used by Lebaili et al. (2008). The discrepancies between the EPA review of the registrant-submitted developmental studies (U.S. EPA/HED 2002) and the reports of developmental toxicity in the open literature cannot be fully resolved. According to ATSDR (2002, p. 62 ff), developmental toxicity is not characteristic of pyrethroids. At least some of the difference between the studies in the open literature and the EPA studies may reflect differences in the isomeric composition of the material tested or the inerts used in some of the formulations tested.
3.1.9.2. Reproduction Studies Reproduction studies involve exposing one or more generations of the test animal to a chemical compound. Generally, the experimental method involves dosing the parental (P1 or F0) generation (i.e., the male and female animals used at the start of the study) to the test substance prior to mating, during mating, after mating, and through weaning of the offspring (F1). In a 2-generation reproduction study, this procedure is repeated with male and female offspring from the F1 generation to produce another set of offspring (F2). During these types of studies, standard observations for gross signs of toxicity are made.
20
1 2 3 4 5 6 7 8 9
10 11 12 13 14 15 16 17 18 19 20 21 22 23 24 25 26 27 28 29 30 31 32 33 34 35 36 37 38 39 40 41 42 43 44 45
Additional observations often include the length of the estrous cycle, assays on sperm and other reproductive tissue, and the number, viability, and growth of offspring. As with developmental studies, the EPA requires at least one reproduction study for pesticide registration. U.S. EPA/HED (2002) summarizes the results of one 3-generation reproduction study in rats at doses of 0, 0.5, 1.5, or 5 mg/kg bw/day. This study is not explicitly identified by author/date citation or by MRID number. The only adverse effect observed was a decrease in adult and fetal body weight at 5 mg/kg bw/day. Thus, 1.5 mg/kg bw/day was classified as the NOAEL for both parents and offspring. Because no effects were observed in reproductive parameters, 5 mg/kg bw/day was classified as the developmental NOAEL. The U.S. EPA’s Office of Research and Development (U.S. EPA/ORD 1988) maintains a database of reference doses (RfDs). This database also summarizes the results of a reproduction study in rats using Karate. This study is identified as MRID 00154802 and is referenced to Coopers Animal Health, Inc and Imperial Chemical Industries with a study date of 1984. A discussed in Section 2.2, Karate is a commercial formulation of lambda-cyhalothrin. U.S. EPA/ORD (1988) indicates that the dietary concentrations of lambda-cyhalothrin used in this study were 0, 10, 30, and 100 ppm. The mg/kg bw dose conversions used by U.S. EPA/ORD (1988) correspond to the doses cited by U.S. EPA/HED (2002)—i.e., 0, 0.5, 1.5, or 5 mg/kg bw/day. The summary by U.S. EPA/ORD (1988) is consistent with that of U.S. EPA/HED (2002) in indicating that adverse effects were observed at the highest dose. The very brief summary of the study in U.S. EPA/ORD (1988), however, identifies 1.5 mg/kg bw/day as a LOAEL based on reduced body weight gain in offspring during weaning. This is not consistent with the summary by U.S. EPA/HED (2002, p.6) indicating that 1.5 mg/kg bw/day was a NOAEL. The available literature on lambda-cyhalothrin includes a cleared review of a reproduction study in rats (Milburn et al. 1984). The reference for the review does not specify an MRID number; however, it is clear that the study is associated with Imperial Chemical Industries. The review specifies dietary concentrations of 0, 10, 30, and 100 ppm, and identifies a parental NOAEL of 10 ppm (0.5 mg/kg bw/day). Full copies of the studies submitted to EPA are not available for review and could not be used to conduct the current Forest Service risk assessment. Based on the above summaries, it is not entirely clear whether the summaries refer to three different studies or reflect differing interpretations of the same study. A 3-generation reproduction study using technical grade cyhalothrin is published in the Indian literature (Deshmukh 1992). As with some of the developmental studies conducted in foreign countries, the isomeric composition of the cyhalothrin is not clearly specified in the publication. The results of the study are generally similar to those of the study summarized by the EPA. Mice were dosed at 2.5 or 5.0 mg/kg bw. While not clearly specified in the publication, the dosing appears to have involved gavage
21
1 2
3 4 5 6 7 8 9
10 11 12 13 14 15 16 17 18 19 20 21 22 23 24 25 26 27 28 29 30 31 32
33 34 35 36 37 38 39 40 41 42 43
administration. The only adverse effect was a decrease in body weight only in the P1 mice at both dose levels. No effects on reproductive parameters were observed.
3.1.10. Carcinogenicity and Mutagenicity As reviewed by U.S. EPA/HED (2002, p. 16 ff), a relatively standard set of carcinogenicity and mutagenicity studies were submitted to the EPA in support of the registration of lambda-cyhalothrin. In a chronic feeding study in rats at doses of up to 12.5 mg/kg bw/day, no evidence of carcinogenic activity was noted. In a chronic feeding study in mice at doses of up to 75 mg/kg bw/day, an increase in mammary tumors in female mice was noted. The significance of this effect was classified as equivocal because the incidence of mammary tumors in the matched control group was low, compared with historical control groups. Eight mutagenicity studies are reviewed by U.S. EPA/HED (2002, p. 18 ff). Five of the studies indicate no mutagenic activity and the other three studies are classified as inconclusive because of issues associated with the experimental designs of the studies. Based on this information, U.S. EPA/HED (2002) classifies cyhalothrin as a Group D chemical, indicating that its potential carcinogenicity is indeterminate. The open literature on lambda-cyhalothrin does not include carcinogenicity bioassays. Naravaneni and Jamil (2005) report that lambda-cyhalothrin was positive in a comet assay (for strand breaks in DNA) using human lymphocyte cultures. Similarly, Celik et al (2003, 2005a,b) report chromosome aberrations in rat bone marrow after intraperitoneal injections as well as oral administration. A micronucleus assay in fish also suggests that lambda-cyhalothrin concentrations as low as 0.001 µg/L may be genotoxic (Campana et al. 1999). In terms of a quantitative significance to the human health risk assessment, carcinogenicity is an issue only if the data are adequate to support the derivation of a cancer potency factor. Because of the equivocal nature of the carcinogenicity data on lambda-cyhalothrin, U.S. EPA/OPP has not proposed or derived a cancer potency factor of lambda-cyhalothrin. Thus, consistent with the EPA risk assessments, the current Forest Service risk assessment does not quantitatively consider cancer risk as an endpoint of concern.
3.1.11. Irritation and Sensitization (Effects on the Skin and Eyes) As reviewed by U.S. EPA/OPP (U.S. EPA/HED 2002), lambda-cyhalothrin is classified as an eye irritant (Category II) but not a skin irritant (Category IV). Moreover, lambda-cyhalothrin (i.e., the two isomer mixture) is not classified as a skin sensitizer, which means its toxicity differs from that of cyhalothrin (i.e., the four-isomer mixture) which is a skin sensitizer. Many pyrethroids induce paresthesia, a numbness or tingling of the skin which may also be characterized as a feeling of burning or itching skin (ATSDR 2003; Martinez-Larrantildeaga et al. 2003). Skin irritation consistent with paresthesia is documented in workers handling lambda-cyhalothrin (Spencer and O’Malley 2006; Moretto 1991).
22
3.1.12. Systemic Toxic Effects from Dermal Exposure 1 2 3 4 5 6 7 8 9
10 11 12 13 14
15 16 17 18 19 20 21 22 23 24 25 26 27 28 29
30
31 32 33 34 35 36 37 38 39 40 41 42 43
Technical grade lambda-cyhalothrin is classified as a Category II compound for acute dermal toxicity in rats with LD50 values of 623 mg/kg bw for male rats and 696 mg/kg bw for female rats (U.S. EPA/HED 2002). As discussed further in Section 3.1.14.1, these dermal LD50 values for technical grade lambda-cyhalothrin are consistent with the dermal LD50 values reported for the formulations of lambda-cyhalothrin explicitly considered in the current Forest Service risk assessment (Appendix 1, Table 2). U.S. EPA also summarizes a subchronic dermal toxicity study in which lambda-cyhalothrin was applied in rats at dermal doses of 1 or 10 mg/kg/day, 6 hours/day, for 21 days. Another group of rats was treated at 100 mg/kg bw/day for 2 days but the dose was then reduced to 50 mg/kg/day for the remainder of the 21-day study. Although no adverse effects were noted at the 10 mg/kg bw/day dose, the high dose group showed signs of neurotoxicity as well as decreased body weight.
3.1.13. Inhalation Exposure As reviewed by U.S. EPA/HED (2002), technical grade lambda-cyhalothrin is classified as a Category II compound for acute inhalation toxicity based on rat inhalation LC50 values of 0.065 mg/L. U.S. EPA/HED (2002) also summarizes the results of a subchronic inhalation study in rats in which the animals were exposed for 6 hours/day, 5 days/week for 3 weeks. No effects were noted at concentrations of 0.0003 mg/L. At 0.0033 mg/L adverse effects included signs of neurotoxicity and decreased body weight gain (U.S. EPA/HED 2002, p. 14). Moretto (1991) reports signs of respiratory irritation—i.e., irritation to the nose and throat as well as coughing and sneezing—in workers involved in the indoor application of lambda-cyhalothrin. Spencer and O’Malley (2006) report signs of respiratory irritation in workers exposed to lambda-cyhalothrin as well as propargite and sulfur. Because of the mixed exposure, it is not clear that lambda-cyhalothrin was the agent causing respiratory irritation in these workers.
3.1.14. Other Ingredients in Formulations and Adjuvants
3.1.14.1. Other Ingredients in Formulations The EPA is responsible for regulating other ingredients and adjuvants in pesticide formulations. As implemented, these regulations affect only pesticide labeling and testing requirements. The term inert was formerly used to designate compounds that do not have a direct toxic effect on the target species. Although the term inert is codified in FIFRA, some inerts may be toxic; therefore, the EPA now uses the term Other Ingredients instead of the term inerts. This approach is adopted in the current risk assessment. As discussed in Section 2.2 and detailed in Table 3, only limited information is available on the inerts in the lambda-cyhalothrin formulations explicitly considered in the current Forest Service risk assessment. Several of the liquid formulations of lambda-cyhalothrin contain naphthalene as well as other petroleum or aromatic solvents. All of these
23
compounds may be generally classified as petroleum distillates. Petroleum distillates are highly diverse mixtures of aromatic and aliphatic hydrocarbons, and the specific blend of aromatic and aliphatic hydrocarbons varies according to the distillation and refining methods used. As reviewed by ATSDR (1999), petroleum distillates can induce a wide range of toxic effects, particularly effects on the nervous system. U.S. EPA/OPP has not yet completed their RED for aromatic petroleum hydrocarbons (
1 2 3 4 5 6
http://www.epa.gov/pesticides/reregistration/status.htm). The RED for aliphatic petroleum hydrocarbons (U.S. EPA/OPP 2007c, p. 5 ff) notes little basis for concern for the use of the aliphatic components of petroleum products as other ingredients in pesticide formulations.
7 8 9
10 11 12 13 14 15 16 17 18 19 20 21 22 23 24 25 26 27 28 29 30 31 32 33 34 35 36 37 38 39 40 41
42 43 44 45
Given the complexity and variability of petroleum distillates as well as the limited information available on the identity of the petroleum components in formulations of lambda-cyhalothrin, it is difficult to assess the extent to which the other ingredients in lambda-cyhalothrin formulations contribute to the toxicity of these formulations. One approach to assessing this issue is to compare the toxicity of the formulations, expressed in units of active ingredient, to the toxicity of the active ingredient itself. For lambda-cyhalothrin, these comparisons yield differing results depending on the route of exposure. As summarized in Appendix 1, Table 2, the oral LD50 values for the lambda-cyhalothrin formulations explicitly considered in this risk assessment are all less than the oral LD50 value for technical grade lambda-cyhalothrin. The LD50 values for the liquid formulations range from about 7.2 mg a.i./kg bw (LambdaStar 1 CS) to 41 mg a.i./kg bw (Warrior II). The single granular formulation, Kaiso 24 WG, has an oral LD50 of 74.4 mg a.i./kg bw, within the range of oral LD50 values reported for technical grade lambda-cyhalothrin—i.e., 56 mg/kg for females and 79 mg/kg for males. Thus, the oral LD50 values for the liquid formulations of lambda-cyhalothrin suggest that other ingredients may contribute to the toxicity of these formulations. Inhalation LC50 values, however, display the opposite pattern. As summarized in Appendix 1, Table 3, the 4-hour inhalation LC50 values for lambda-cyhalothrin formulations range from 0.071 mg/L (Lambda-Cy EC) to 0.711 mg/L (Warrior II); whereas, the inhalation LC50 for technical grade lambda-cyhalothrin is reported as 0.065 mg/L. This pattern suggests that the other ingredients in these lambda-cyhalothrin formulations do not contribute to the toxicity of the formulations. All dermal LC50 values for lambda-cyhalothrin formulations are reported as ranging from >288 mg/L to >1,200 mg/L. The greater than designations indicate that the LC50 values for the formulations could not be determined because of low rates of mortality. All of these reported LC50 values are consistent with the dermal LC50 values of 632 mg/kg in female rats and 696 mg/kg in male rats.
3.1.14.2. Adjuvants Adjuvants may be used in applications of lambda-cyhalothrin formulations. The most commonly recommended adjuvants are nonionic surfactants, once refined vegetable oil concentrate, or methylated sunflower oils. The product labels for the formulations
24

1 2 3 4 5 6 7 8 9
10
11 12 13 14 15 16 17 18 19 20 21 22 23 24 25 26 27 28 29 30 31 32 33 34 35 36 37 38 39
40 41 42 43 44
specifically note that adjuvants should be used only if they contain ingredients specifically approved by the EPA. As with most Forest Service risk assessments as well as pesticide risk assessments conducted by the EPA, the current risk assessment does not specifically attempt to assess the risks of using adjuvants, unless specific information is available suggesting that the risks may be substantial. For example, some adjuvants used in glyphosate formulations may be as toxic as, and possibly more toxic than, glyphosate itself; accordingly, these risks are addressed in the Forest Service risk assessment on glyphosate, which is not the case with lambda-cyhalothrin.
3.1.15. Impurities and Metabolites Lambda-cyhalothrin is extensively and rapidly metabolized in humans as well as experimental mammals (U.S. EPA/HED 1997c). No information, however, has been encountered on the risks associated with impurities in technical grade lambda-cyhalothrin or metabolites of lambda-cyhalothrin. This situation is common in many pesticide risk assessments. In general, pyrethroids are metabolized by hydrolysis, and these reactions are catalyzed by mixed function oxidase. The hydrolysis of pyrethroids results in the formation of more water soluble compounds that are likely to be less toxic and more easily excreted than the parent compound (ATSDR 2003). U.S. EPA/OPP determined that lambda-cyhalothrin, rather than the metabolites of lambda-cyhalothrin, is the agent of toxicological concern (U.S. EPA/HED 1997c, p. 12). Although there may be some basis for concern about impurities and metabolites, the dose-response assessment for lambda-cyhalothrin is on based on in vivo studies with technical grade lambda-cyhalothrin. The underlying assumption in the current risk assessment (as well as many other pesticide risk assessments) is that the toxicity of both impurities and metabolites is encompassed by the use of in vivo studies that involve exposures to both the impurities in technical grade lambda-cyhalothrin as well as the metabolites of these compounds. The assumption that the toxicity of metabolites is encompassed by the use of in vivo studies in mammals is supported by the recent assessment of pyrethroids by ATSDR:
Since the metabolites that have been identified in humans have also been identified in other mammalian species, it is unlikely that there are significant qualitative differences between humans and other mammals in the major metabolic pathways for pyrethroids, although some species differences do undoubtedly exist.
ATSDR (2003, p. 91)
3.1.16. Toxicological Interactions No information on mammals regarding the interactions of lambda-cyhalothrin with other compounds was located in the available literature. As noted in the previous subsection, detoxification by mixed-function oxidase is a common metabolic process for many pyrethroids. Consequently, compounds that inhibit mixed-function oxidase may enhance
25

1 2 3 4 5 6
the toxicity of pyrethroids and compounds that induce mixed-function oxidase may reduce the toxicity of pyrethroids. As discussed further in Section 4.1.2.4 (hazard identification for terrestrial invertebrates), studies in honeybees demonstrate that piperonyl butoxide and other inhibitors of mixed-function oxidase enhance the toxicity of lambda-cyhalothrin by factors of up to about 100 (Johnson et al. 2006).
26
3.2. EXPOSURE ASSESSMENT 1
2 3 4 5 6 7 8 9
10 11 12 13 14 15 16 17 18 19 20 21 22 23 24 25 26 27 28 29 30 31 32 33
34
35
36 37 38 39 40 41 42
3.2.1. Overview All exposure assessments for lambda-cyhalothrin are summarized in Worksheet E01 for workers and in Worksheet E03 for the general public in the EXCEL workbook that accompanies this risk assessment. All exposure assessments are based on six applications separated at 2-week intervals at an application rate of 0.08 lb a.i./acre. For workers applying lambda-cyhalothrin, two types of application methods are modeled: airblast applications and high-pressure handwand applications. In non-accidental scenarios involving the normal application of lambda-cyhalothrin, estimates of exposure for workers are approximately 0.00003 (0.000002- 0.0001) mg/kg bw/day for airblast applications and 0.0001 (0.000009-0.0006) mg/kg bw/day for high-pressure handwand applications. All of the accidental exposure scenarios for workers involve dermal exposures. Accidental exposures based on the assumption of first-order absorption lead to very low estimates of absorbed doses and confidence in these estimates is high. Accidental exposures involving zero-order dermal absorption lead to much higher estimates of absorbed dose but confidence in these exposure assessments is very low. For the general public (Worksheet E03), acute levels of exposures range from minuscule (e.g., 1x10⁻⁷ mg/kg/day) to about 7 mg/kg bw. The upper bound of exposure of 7 mg/kg bw is associated with the consumption of contaminated fish by subsistence populations shortly after an accidental spill. This exposure scenario is highly arbitrary and does not appear to be plausible for the Chico or Foresthill sites. The upper bound of the dose associated with the consumption of contaminated vegetation—i.e., 0.17 mg/kg bw for the Chico site—is a more plausible but still extreme exposure scenario. The other acute exposure scenarios lead to much lower dose estimates. The lowest acute exposure levels are associated with swimming in contaminated water. The chronic or longer-term exposure levels are much lower than the estimates of corresponding acute exposures. The highest longer-term exposure levels are associated with the consumption of contaminated vegetation after a direct spray, and the upper bound for this scenario is about 0.03 mg/kg/day. The lowest longer-term exposures are associated with the consumption of contaminated surface water.
3.2.2. Workers
3.2.2.1. General Exposures
3.2.2.1.1. Airblast Sprayer Applications As discussed in Section 2.3.1, applications at the Chico site involve airblast sprayer applications within an enclosed cabin. These applications may be viewed as directed foliar applications in that the spray nozzles are directed at that trees being treated. In terms of worker exposure rates, however, these types of applications correspond most closely to ground broadcast foliar applications.
27

1 2 3 4 5 6 7 8 9
10 11 12 13 14 15 16 17 18 19 20 21 22 23 24 25 26 27 28 29 30 31 32 33 34 35 36 37 38 39 40 41 42 43 44 45 46
No worker exposure studies are available involving ground broadcast applications of lambda-cyhalothrin. Worker exposure rates for ground broadcast foliar applications using in Forest Service risk assessments are typically taken as 0.0002 (0.00001- 0.0009) mg a.i./kg bw per lb a.i. applied. These rates are based on the study by Nash et al. (1982) involving broadcast ground applications of 2,4-D, which is not directly applicable to lambda-cyhalothrin because some of the equipment used to apply the 2,4-D did not have cabs. Moreover, Nash et al. (1982) do not indicate whether the cabs were enclosed. Applications of 2,4-D conducted in early 1980s most likely did not involve the use of enclosed cabs. The Pesticide Handlers Exposure Database (PHED Task Force 1995), which is used by the U.S. EPA for deposition-based worker exposure assessments, provides some information on deposition and inhalation exposures in workers involved in airblast applications using both open and closed cabins. Based on the review of these data by Keigwin (1998), dermal deposition in workers wearing gloves and single layer clothing is 0.24 mg/lb handled in open cabs and 0.019 mg/lb handled in closed cabs. Thus, the worker protection factor for closed cabs, relative to open cabs, is about 0.92 [1-(0.019 mg/lb handled ÷ 0.24 mg/lb handled)]. Keigwin (1998) also notes that the inhalation exposure rate is 0.0045 mg/lb handled in open cabs and 0.00045 mg/lb handled in closed cabs., which leads to a protection factor for closed cabs, relative to open cabs of 0.9 [1-(0.00045 mg/lb handled ÷ 0.0.0045 mg/lb handled)]. For the current Forest Service risk assessment, either the PHED exposure estimates (modified to account for dermal exposure) or the standard Forest Service exposure rates (modified to account for enclosed cabs) could be used. Based on a worker protection factor of 0.9 and the standard worker exposure rates of 0.0002 (0.00001-0.0009) mg a.i./kg bw per lb a.i. applied used in Forest Service risk assessments, the functional worker exposure rates would be 0.00002 (0.0000001-0.00009) mg/kg bw per lb a.i. handled. Based on dermal absorption rates of 0.0012 (0.00041- 0.01) day-1 (Section 3.1.3.2), the dermal deposition rate of 0.19 mg/lb handled from Keigwin (1998) corresponds to absorbed dermal doses of about 0.00023 (0.000078- 0.0019) mg/lb handled. Adding the inhalation exposure rate of 0.00045 mg/lb handled and assuming 100% inhalation absorption (a standard approach used in EPA exposure assessments), the total absorbed dose would be 0.00068 (0.00053- 0.00024) mg/lb handled. The EPA uses body weights of 60 kg for female workers and 70 kg for male workers. Using the lower body weight of 60 kg, which results in higher estimates of mg/kg bw doses, the worker exposure rates would be 0.000011 (0.0000088-0.000039) mg/kg bw per lb a.i. handled. The estimates based on the standard Forest Service exposure rate are higher than those using the PHED approach by a factor of about 1.8, based on the central estimates, and a factor of about 2.3, based on the upper bound estimate. Thus, the two different methods of estimating worker exposures yield reasonably similar results. The lower bound of the PHED estimate is a factor of about 87 higher than the lower bound of the estimate based
28

1 2 3 4 5 6 7 8 9
10 11 12 13 14 15 16 17 18 19 20 21 22
23 24 25 26 27 28 29 30 31 32 33 34 35 36 37 38 39 40 41 42 43 44 45
on the Forest Service method; however, the lower bounds have little impact on the assessment of risk. The current Forest Service risk assessment uses the worker exposure rates normally used in Forest Service risk assessments with a worker protection factor of 0.9, as discussed above. This approach is a modestly more conservative than using the estimates derived from PHED. As discussed further in Section 3.4.2 (risk characterization for workers), the HQs for non-accidental exposures in workers are substantially below the level of concern. Thus, the use of the somewhat more conservative exposure assumptions does not have an impact on the qualitative interpretation of the risk characterization. In estimating the absorbed dose rate, the amount of pesticide handled must be estimated. This amount is estimated as the product of the application rate (lb a.i./acre) and the number of acres treated. Standard Forest Service risk assessments typically assume that ground spray workers may treat up to 21 acres/hour over a 6- to 8-hour period, which is not the case for the pesticide applications made at the Chico site. As discussed in Section 2, the treated area consists of only 84 acres, and applications are made by five workers—i.e., fives set of spray vehicles—over about a 5-hour period. Thus, each worker would treat about 17 acres. Consequently, Worksheet C01 in the EXCEL workbook for the Chico site (Attachment 1 to the current Forest Service risk assessment) is modified to specify an application period of 4 hours and a treatment rate of 4.25 acres/hour—i.e., a treatment area of 17 acres per worker.
3.2.2.1.2. High Pressure Foliar Applications Applications at the Foresthill site are made to individual trees using high-pressure nozzles (Section 2.3). These types of applications are similar to bark applications covered in the recent Forest Service risk assessment on carbaryl (SERA 2009b). As discussed in the carbaryl risk assessment, worker exposure rates were taken as 0.003 (0.0003-0.01) mg/kg bw per lb handled. These rates are based on numerous studies involving estimated absorption rates for backpack applications of various pesticides (SERA 2007a). No studies are available on high-pressure nozzle applications or standard backpack applications of lambda-cyhalothrin. Chester et al. (1992), however, estimated absorbed doses of lambda-cyhalothrin (based on urinary excretion of metabolites) after indoor applications using hand-held compression sprayers. Average absorbed doses in workers were estimated at 54µg/day with an approximate range of about 9 to 80 µg/day, using a typical worker body weight of 60 kg. Thus, the mg/kg bw absorbed doses would be about 0.0009 (0.00015-0.0013) mg/kg bw. The Chester et al. (1992) study further indicates that the average amount handled per worker was about 0.065 kg, which corresponds to about 0.14 lb [0.065 kg x 2.205 lb/kg = 0.143325 lb]. Thus, the worker exposure rates are estimated at 0.006 (0.001-0.009) mg/kg bw per lb handled [0.0009 (0.00015-0.0013) mg/kg bw ÷ 0.14 lb]. The central estimate of 0.006 mg/kg bw per lb handled is a factor of two higher than the standard backpack rate of 0.003 mg/kg bw per lb handled. Given the variability in both sets of values—i.e., a factor of about 33 in the standard Forest Service estimates and a factor of 9 in the Chester study—the differences in the central estimates are insubstantial.
29

1 2 3 4 5 6 7 8 9
10 11 12 13 14 15 16 17 18 19 20 21 22 23
24 25 26 27 28 29 30 31 32 33 34 35 36 37 38 39 40 41 42 43 44 45
For the current Forest Service risk assessment, the standard backpack exposure rates of 0.003 (0.0003-0.01) mg/kg bw per lb handled are used to estimate worker exposures at the Foresthill site. These exposure rates, however, do not consider or incorporate the use of worker protective equipment. As discussed in Section 2.3, applicators will wear waterproof Tyvek overalls with a built-in hood, full face shield, protective glasses, rubber boots, and chemical gloves taped into the coveralls. As noted in the analysis of PHED data by Keigwin (1998), a protection factor of 0.9 is typical for the use of chemical resistant gloves, which is identical to the protection factor noted by Nigg (1998) for the use of protective clothing in many pesticide applications. For lambda-cyhalothrin, Hughes et al. (2005) report single layer clothing penetration factors of 5.3-7.2%. Thus, it appears that the use of a general worker protection factor of 0.9 is appropriate and probably conservative—i.e., the use of a protection factor of 0.9 may overestimate exposures for workers wearing Tyvek coveralls. In addition to the worker exposure rate and clothing protection factor, worker exposure level depends on the amount of material handled. Information from the Foresthill site indicates that an individual worker treats about 150 trees per day at application rates of 0.002-0.004 lbs a.i./tree. Based on 0.003 lbs a.i./tree as a central estimate, the amount of lambda-cyhalothrin handled per day is 0.45 (0.3-0.6) lbs [0.003 (0.002-0.004) lbs a.i./tree x 150 trees]. A custom modification is made to Worksheet C01 of the EXCEL workbook for the Foresthill site (Attachment 2 to the current Forest Service risk assessment) to use these values in calculating the absorbed dose rates for workers.
3.2.2.2. Accidental Exposures Accidental exposures are most likely to involve splashing a solution of the pesticide into the eyes or contaminating the surface of the skin. Quantitative exposure scenarios for eye exposures are not developed in this or other Forest Service risk assessments. As discussed in Section 3.1.11 (Irritation and Sensitization), lambda-cyhalothrin is classified as a Category II eye irritant and splashing a solution of lambda-cyhalothrin into the eyes would presumably cause eye irritation. This effect is considered qualitatively in the risk characterization for workers (Section 3.4.2). Accidental dermal exposure to lambda-cyhalothrin is considered quantitatively in this risk assessment. The two types of dermal exposure that are modeled include direct contact with a pesticide solution and accidental spills of the pesticide onto the surface of the skin. Furthermore, two exposure scenarios are developed for each of the two types of dermal exposure, and the estimated absorbed dose for each scenario is expressed in units of mg chemical/kg body weight. Both sets of exposure scenarios are summarized in Worksheet E01, which references other worksheets in which the calculations are specified. Exposure scenarios involving direct contact with solutions of pesticides are characterized either by immersion of the hands in a field solution for 1 minute or wearing pesticide contaminated gloves for 1 hour. For these exposure scenarios, the key assumption is that wearing gloves grossly contaminated with a chemical solution is equivalent to immersing
30
1 2 3 4 5 6 7 8 9
10 11 12 13 14 15 16 17 18 19 20 21 22 23 24 25 26 27 28 29
30 31
32 33 34 35 36 37 38 39 40 41 42 43 44
the hands in the solution. In both cases, the chemical concentration in contact with the skin and the resulting dermal absorption rate are essentially constant. These are standard exposure scenarios used in all Forest Service risk assessments. For the current risk assessment of lambda-cyhalothrin, however, these exposure scenarios are improbable. As discussed in Section 2.3, applications at the Chico site involve workers in enclosed cabins. Applications at the Foresthill site involve the use of chemical resistant gloves that are taped to Tyvek overalls. Thus, it is not likely that either of these exposure scenarios would occur during applications of lambda-cyhalothrin. Another issue with exposure scenarios involving hand immersion and contaminated gloves involves the estimates of the dermal absorption rates. For both scenarios (hand immersion and contaminated gloves), the assumption of zero-order absorption kinetics is appropriate. For these types of exposures, the rate of absorption is estimated, based on a zero-order dermal absorption rate (Kp). As discussed in Section 3.1.3.2, the Kp for lambda-cyhalothrin is estimated using a QSAR algorithm developed by the EPA; however, confidence in these estimates for lambda-cyhalothrin is very low, as discussed further in the risk characterization for workers (Section 3.4.2). Exposure scenarios involving chemical spills onto the skin are characterized by a spill on to the lower legs as well as a spill on to the hands and are based on the assumption that a certain amount of the chemical adheres to the skin. These types of accidents would most probably occur during the mixing/loading process. The absorbed dose is calculated as the product of the amount of chemical on the surface of the skin (i.e., the amount of liquid per unit surface area multiplied by the surface area of the skin over which the spill occurs and the chemical concentration in the liquid), the first-order absorption rate, and the duration of exposure. As with the zero-order dermal absorption rate, the first-order absorption rate (ka) is derived in Section 3.1.3.2. This absorption rate is based on a human study reviewed and accepted by the U.S. EPA, and confidence in these first-order dermal absorption rates is much higher than confidence in the estimates of Kp.
3.2.3. General Public 3.2.3.1. General Considerations
3.2.3.1.1. Likelihood of Exposure The likelihood that members of the general public will be exposed to pesticides in Forest Service applications is highly variable. In some Forest Service applications, pesticides may be applied in recreational areas, including campgrounds, picnic areas, and trails. In other instances, pesticides may be applied in relatively remote areas and the probability that members of the general public will be exposed to the pesticides is remote. As discussed in Section 2.6, the current risk assessment on lambda-cyhalothrin is somewhat atypical in that two specific sites are considered, the Chico site and the Foresthill site. The Chico site is in a populated area, and the site is used by general public. Thus, the probability of exposure to pesticides applied at the site is high. The Foresthill site, on the other hand, is in a relatively remote area. While the general public is not excluded, the Foresthill site is not designed for recreational activities, and the probability of exposure is relatively low.
31

3.2.3.1.2. Summary of Assessments 1 2 3 4 5 6 7 8 9
10 11 12 13 14 15 16 17 18 19 20 21 22 23 24 25 26 27 28 29 30 31 32 33 34 35 36 37 38 39 40 41
42 43 44 45
The exposure scenarios developed for the general public are summarized in Worksheet E03 of the EXCEL workbooks that accompany this risk assessment. As with the worker exposure scenarios, details about the assumptions and calculations used in these assessments are given in the worksheets that accompany this risk assessment (Worksheets D01–D11). As summarized in Worksheet E03, the kinds of exposure scenarios developed for the general public include acute accidental, acute non-accidental, and longer-term or chronic exposures. The accidental exposure scenarios assume that an individual is exposed to the compound of concern either during or shortly after its application. What is more, the nature of the accidental exposures is intentionally extreme. Non-accidental exposures involve dermal contact with contaminated vegetation as well as the consumption of contaminated fruit, vegetation, water, and fish. The longer-term or chronic exposure scenarios parallel the acute exposure scenarios for the consumption of contaminated fruit, water, and fish. All of the non-accidental exposure scenarios are based on levels of exposure to be expected in the routine uses of lambda-cyhalothrin. Nonetheless, the upper bounds of the exposure estimates for the non-accidental scenarios involve conservative assumptions intended to reflect exposure for the MEI (Most Exposed Individual). While the current risk assessment is focused on two specific sites, the exposure assessments considered in this risk assessment are generally similar to those used in all Forest Service risk assessments. This approach is taken because the Forest Service uses lambda-cyhalothrin at locations other than Chico and Foresthill. For example, lambda-cyhalothrin has been considered in a risk assessment for Forest Service Region 8 (Mistretta 2007). Thus, including all of the standard exposure scenarios will enhance the usefulness of the current risk assessment in other Forest Service programs. Not all of the standard exposure scenarios, however, are applicable to the Chico and Foresthill sites. For example, all Forest Service risk assessments consider the direct spray of and pesticide drift to a generic pond and a generic stream and separately consider pesticide transport to generic ponds and streams using Gleams-Driver. For the current Forest Service risk assessment on lambda-cyhalothrin, however, there is sufficient information on the Chico and Foresthill sites to consider both drift and pesticide transport in Gleams-Driver simulations. Thus, while the direct spray scenarios are discussed in detail in the current Forest Service risk assessment, they are not considered in the risk characterization for the Chico and Foresthill sites. Other examples in which the exposure scenarios are either not relevant to the Chico or Foresthill sites or have been modified to reflect conditions at the Chico and Foresthill sites are noted in the following subsections and discussed further in the risk characterization.
3.2.3.2. Direct Spray Direct sprays involving ground applications are modeled similarly to accidental spills for workers (Section 3.2.2.2). In other words, the scenarios assume that an individual is sprayed with a chemical solution, some of which remains on the skin and is absorbed by
32
1 2 3 4 5 6 7 8 9
10 11 12 13 14 15 16 17 18 19 20 21 22 23 24 25 26 27 28 29 30 31 32 33 34
35 36 37 38 39 40 41 42 43 44 45
first-order kinetics. Two direct spray scenarios are included in this risk assessment: one for a young child (D01a) and the other for a young woman (D01b). The exposure scenario involving the young child assumes that a naked child is sprayed directly with a chemical during a ground broadcast application and is completely covered (i.e., 100% of the surface area of the body is exposed). This exposure scenario is intentionally extreme and is used to assess worst-case dermal exposure levels. The exposure scenario involving the young woman (Worksheet D01b) is somewhat less extreme and more plausible. In this scenario, it is assumed that the woman is accidentally sprayed over the feet and lower legs. The preference for using a young woman rather than an adult male in many of the exposure assessments relates to concerns for both the Most Exposed Individual (MEI) as well as the most sensitive individual. Based on general allometric considerations, the smaller the individual, the greater will be the chemical doses per unit body weight (e.g., Boxenbaum and D’Souza. 1990). According to standard reference values used in exposure assessments (e.g., U.S. EPA/ORD 1989), the female body size is smaller than that of males. Thus, in direct spray exposure scenarios, females are subject to somewhat higher doses than males. More significantly, reproductive effects are a major concern in all Forest Service risk assessments. Consequently, exposure levels for a young woman of reproductive age are used in order to better assess the potential for adverse effects in the population at risk from potential reproductive effects—i.e., the most exposed and the most sensitive individual. For this exposure scenario, assumptions are made regarding the surface area of the skin and the body weight of the individual, as detailed in Worksheet A03. The rationale for and sources of the specific values used in these and other exposure scenarios is provided in the documentation for the worksheets (SERA 2009a) as well as the documentation for the preparation of Forest Service risk assessments (SERA 2007a). No modifications to these exposure scenarios as well as other accidental exposure scenarios are made to reflect conditions at the Chico or Foresthill sites. By definition, accidental exposures are unanticipated; however, they must be considered in order to assess the consequences of improbable exposure levels due to mischance.
3.2.3.3. Dermal Exposure from Contaminated Vegetation The exposure scenario involving contaminated vegetation assumes that the herbicide is sprayed at a given application rate and that a young woman comes in contact with the sprayed vegetation or with other contaminated surfaces sometime after the spray operation (D02). This exposure scenario depends on estimates of dislodgeable residue (a measure of the amount of the chemical that could be released from the vegetation) and the availability of dermal transfer rates (i.e., the rate at which the chemical is transferred from the contaminated vegetation to the surface of the skin). Most Forest Service risk assessments use a default dislodgeable residue rate of 0.1 of the application rate, based on a field simulation study which measured dermal exposure
33
1 2 3 4 5 6 7 8 9
10 11 12 13 14 15 16 17 18 19 20
21
22 23 24 25 26 27 28 29 30 31 32 33 34 35 36 37 38 39 40 41 42 43 44 45
levels in humans after an application of 2,4-D (Harris and Solomon 1992). For lambda-cyhalothrin, Estesen and Buck (1990) assayed substantially higher initial dislodgeable residues in applications to cotton. In this study, lambda-cyhalothrin was applied at a rate of 0.028 kg/ha, equivalent to 0.28 µg/cm2 [28,000 mg/10,000 m2 = 2.8 mg/ m2 = 2800 µg/10,000 cm2 = 0. 28 µg/cm2], and initial dislodgeable residues were measured at 0.1 µg/cm2. Thus, the dislodgeable residue rate is about 0.36 of the nominal application rate [0.1 µg/cm2 / 0.28 µg/cm2 = 0.357]. In the absence of information on dislodgeable residues for lambda-cyhalothrin in turf, the dislodgeable residue rate of 0.36 from the study by Estesen and Buck (1990) is used in the current Forest Service risk assessment. This exposure scenario is plausible for the Chico site but less plausible for the Foresthill site. Even at the Chico site, this exposure scenario probably overestimates exposures to members of the general public because the scenario assumes that the individual is on the spray site very soon after the pesticide is applied. At the Chico site, however, members of the general public are not likely to be at the spray site during the application period (which occurs only in the evening or at night). Therefore, dermal contact with contaminated vegetation would more likely occur downwind from the application site several hours after the applications are made. As discussed further in the risk characterization, the HQs associated with this very conservative exposure scenario are far below the level of concern. Thus, no refinements to this exposure scenario are made.
3.2.3.4. Contaminated Water
3.2.3.4.1. Accidental Spill The accidental spill scenario assumes that a young child consumes contaminated water shortly after an accidental spill of a field solution into a small pond. The specifics of this scenario are given in Worksheet D05. Because this scenario is based on the assumption that exposure occurs shortly after the spill, no dissipation or degradation is considered. Since this exposure scenario is based on assumptions that are somewhat arbitrary and highly variable, it may overestimate exposure. The actual chemical concentrations in the water will vary according to the amount of compound spilled, the size of the water body into which it is spilled, the time at which water consumption occurs relative to the time of the spill, and the amount of contaminated water consumption. To reflect the variability inherent in this exposure scenario, a spill volume of 100 gallons (in the range of 20-200 gallons) is used to reflect plausible spill events. The lambda-cyhalothrin concentrations in the field solution are also varied to reflect the plausible range of concentrations in field solutions—i.e., the material that might be spilled—using the same values as in the accidental exposure scenarios for workers (Section 3.2.2.2). Based on these assumptions, the estimated concentration of lambda-cyhalothrin in a small pond ranges from about 0.007 to 0.14 mg/L, with a central estimate of about 0.04 mg/L (Worksheet D05). These exposure scenarios are not directly relevant to either the Chico or Foresthill sites. As discussed further in Section 3.2.3.4.3 (Gleams-Driver Modeling), these exposure scenarios are probably irrelevant for the Foresthill site. Consistent with observations from the Forest Service (USDA/FS 1997), the Gleams-Driver modeling suggests that McBride Creek will be dry during periods when lambda-cyhalothrin is applied. Similarly, runoff discharge to Comanche Creek is not likely during periods in which
34

1 2 3 4 5 6
7 8 9
10 11 12 13 14 15 16 17 18 19 20 21 22 23 24 25 26 27 28 29 30 31 32
33 34 35 36 37 38 39 40 41 42 43 44
lambda-cyhalothrin will be applied. Nonetheless, the Forest Service has indicated that pools of water will exist along Comanche Creek during periods when lambda-cyhalothrin is applied (USDA/FS 1998). In the event of a severe spill, contamination of surface water is plausible. Nonetheless, Comanche Creek is in an area where there is relatively easy access to drinking water. The consumption of water from stagnant sections of Comanche Creek seems implausible.
3.2.3.4.2. Accidental Direct Spray/drift for a Pond or Stream The exposure scenarios involving drift are less severe but more plausible than the accidental spill scenario described above. U.S. EPA typically uses a 2-meter-deep pond to develop exposure assessments (SERA 2007b). If such a pond is directly sprayed with lambda-cyhalothrin at an application rate of 0.08 lb a.i./acre, the peak concentration in the pond would be about 0.009 mg/L, equivalent to 9 µg/L or 9 ppb (Worksheet D10a). Worksheet D10a also models concentrations at distances of 25-900 feet down wind, based on standard values adapted from AgDrift (SERA 2009a). Based on these estimates, lambda-cyhalothrin concentrations in a small pond contaminated by drift would range from about 0.000003 mg/L (3 part per trillion) to 0.00007 mg/L (70 parts per billion). Similar calculations can be made for the direct spray of or drift into a stream. For this scenario, the resulting water concentrations depend on the surface area of the stream and the rate of water flow in the stream. The stream is assumed to be about 6 feet wide (1.82 meters) and it is assumed that the pesticide is applied along a 1038-foot (316.38 meters) length of the stream with a flow rate of 710,000 L/day. Based on these values, the concentration in stream water after a direct spray at an application rate of 0.08 lb a.i./acre is estimated at about 0.007 mg/L (7 parts per billion). Much lower concentrations, ranging from about 0.000002 mg/L (2 part per trillion) to 0.00006 mg/L (60 part per trillion) are estimated based on drift at distances of 25-900 feet (Worksheet D10b). As noted in the previous subsection, Comanche Creek (Foresthill) is not likely to have any flow during periods when lambda-cyhalothrin is applied. Thus, the drift scenarios do not appear to be relevant for the Foresthill site.
3.2.3.4.3. GLEAMS Modeling Forest Service risk assessments use Gleams-Driver to estimate expected peak and longer-term pesticide concentrations in surface water. Gleams-Driver serves as a preprocessor and postprocessor for GLEAMS, a field scale model developed by the USDA/ARS and a program used for many years in Forest Service and other USDA risk assessments (SERA 2007b). In typical Forest Service risk assessments, 27 different Gleams-Driver simulations are used to model nine generic sites representing combinations of temperature (cool, moderate, and warm) and rainfall (sparse, moderate, and heavy), and each site is modeled for three types of soil (clay, loam, and sand) to represent different runoff potentials (high, moderate, and low). The generic Gleams-Driver runs do not typically consider drift because drift is addressed in other worksheets as discussed in Section 3.2.3.4.2.
35
1 2 3 4 5 6 7
8 9
10 11 12 13 14 15 16 17 18 19 20 21 22 23 24 25 26 27 28
In order to make this risk assessment more generally useful across Forest Service regions, two sets of these standard Gleams-Driver simulations were conducted, and the results are detailed in Appendix 6 (a single application) and Appendix 7 (six applications at 2-week intervals). Because the current risk assessment is focused on two specific sites, Chico and Foresthill, these generic simulations are not used directly in the current risk assessment but are discussed briefly in Section 3.2.3.4.3.3.
3.2.3.4.3.1. Methods for Site-Specific Modeling Table 4 summarizes the site-specific input parameters used in the Gleams-Driver simulations. The sources for this information, as detailed in the footnotes to Table 4, are taken from standard sources such as the USDA Soil Survey and the USGS National Water Information System. Details in the use of these information sources are provided in the documentation for Gleams-Driver (SERA 2007b). In cases where some site-specific input values for soils were not available, default values were taken from Knisel and Davis (2000) based on the soil types specified in the USDA Soil Survey. Other information on the sites was provided by the Forest Service. Table 5 summarizes the chemical-specific values used in the Gleams-Driver simulations. For the most part, these values are taken from the GLEAMS documentation (Knissel and Davis 2000) and other standard sources (Tomlin 2005; USDA/ARS 1995). Climate files for the Chico and Foresthill sites were generated using Cligen Version 5.2 as detailed in the documentation for Gleams-Driver (SERA 2007b, Section 6.1.1). For the Chico site, the weather file was generated based on data from the Chico Experiment Station. Cligen does not include weather data from Foresthill, California, the town nearest to the Foresthill Genetics Center. Consequently, the linear interpolation algorithm in Cligen was used to generate the climate file for the Foresthill site. To assess the reliability of the interpolation algorithm for Foresthill, average monthly precipitation data for Foresthill, California over the period from 2007 to 2009 were obtained from www.foresthillweather.com and compared with the monthly average precipitation simulated by Cligen. As illustrated in Figure 4, the Cligen simulations reasonably approximate the rainfall patterns for Foresthill, California.
29 30 31 32 33 34 35 36 37 38 39 40 41 42 43 44
As is typical for Gleams-Driver runs, 100 simulations were conducted for each site. As necessary, the Gleams-Driver simulations were modified for the Chico and Foresthill sites. As noted above, typical Forest Service risk assessments do not consider drift in Gleams-Driver simulations and all simulations are conducted at an application rate of 1 lb a.i./acre. For the site-specific Gleams-Driver runs, the simulations did consider drift and all simulations were conducted at the anticipated application rate of 0.08 lb a.i./acre with six applications based at 2-week intervals beginning in May. Consequently, Worksheet B04 in each of the EXCEL workbooks that accompanies this risk assessment was modified to accept the modeling results and convert the results to water contamination rates (WCR) in units of mg/L per lb a.i. applied per acre. Note, however, that all risks are assessed at the application rates specified by the Forest Service.
36

1 2 3 4 5 6 7 8 9
10 11 12 13 14 15 16 17 18 19 20 21 22 23 24 25 26 27 28 29 30 31 32 33 34 35 36 37 38 39 40 41 42 43 44 45
As discussed in Section 2.3.3, lambda-cyhalothrin is not currently used at either the Chico or Foresthill sites and the application rate, number of applications, and application interval that might be used at these sites have not yet been determined. Consequently, a separate series of Gleams-Driver simulations were conducted for three applications with a four week application interval using an application rate of 0.16 lb a.i./acre. The application rate of 0.16 lb a.i./acre is selected because this is the recommended application rate for the control of coneworms or seed bugs. The application interval was set to four weeks so that the period over which applications would be made would correspond to the six application scenario discussed above that uses a two week application interval. Drift estimates were made using AgDrift Version 2.0.05 based on information provided by the Forest Service. For airblast applications at the Chico site, the Forest Service has indicated that applications may be made as close as 50 feet to the stream. AgDrift provides five options or sub-scenarios for airblast drift: normal, dense, sparse, vineyard, and orchard. In standard Forest Service risk assessments, drift estimates are based on the normal option for airblast applications for which the drift at 50 feet downwind is approximately 0.001 of the application rate. The orchard option in AgDrift, however, yields substantially higher estimates of drift—i.e., about 0.02. For the Gleams-Driver modeling, the higher drift estimate of 0.02 is used. As discussed in the following subsection, this does not have a substantial impact on the peak and longer-term estimates of lambda-cyhalothrin in water. The other factor that impacts the amount of pesticide reaching the stream involves the length of the stream that might be impacted as well as the stream width. The stream width is taken as 15 feet, based on information from the Forest Service (Bakke 2009c). The stream length that might be impacted by drift is very difficult to estimate with any precision and would likely depend on wind direction as well as the geometry of the stream and drift cloud in the impact area. For the Gleams-Driver simulations, the length of the stream impacted by drift is taken as 500 feet, approximately one quarter of the longest flow path in the field. For the Foresthill site, the approach taken to estimating drift is similar to that used for the Chico site. As discussed in the documentation for Gleams-Driver, AgDrift and other drift modeling programs do not provide drift estimates for handwand directed foliar applications. Thus, for the Foresthill site, drift was estimated using 50 percentile rates for course droplets in ground boom applications. This is the same approach used in Forest Service risk assessments for backpack applications (SERA 2009a). As noted in Table 4, the drift is estimated to range from 0.0002 to 0.002, using a uniform distribution. As indicated in Table 4, both Comanche Creek (Chico site) and McBride Creek (Foresthill site) are ephemeral. Typically, water will not be actively flowing in these creeks during the summer months (USDA/FS 1997,1998). The only additional information on stream flow comes from USDA/FS (1998), which indicates that the maximum flow rate for Comanche Creek is about 150 cubic feet per second. No
37

information on these two creeks is available at the USGS website for surface water statistics (
1 http://waterdata.usgs.gov/nwis). 2
3 4 5 6 7 8 9
10 11 12 13 14 15 16 17 18 19 20 21 22 23 24 25 26 27 28 29 30 31 32 33 34 35 36 37 38 39 40 41 42 43 44 45 46
Gleams-Driver Version 1.8 does not accommodate ephemeral streams. In generic Gleams-Driver simulations, minimal stream flow is set at 710,000 L/day or about 0.3 cubic feet per second. This minimum flow rate is used in the simulations for both the Chico and Foresthill sites; however, it has no impact on the estimated concentrations of lambda-cyhalothrin at the Foresthill site, because concentrations modeled during days in which no runoff occurs are essentially zero. At the Chico site, the minimum flow rate does have an impact on the estimated concentrations for days on which applications are made, because drift is significant at the Chico site. Both of these factors are discussed further in Section 3.2.3.4.3.2. It should also be noted that the use of a minimum flow rate is not a conservative assumption in the sense that pesticide concentrations in streams will be overestimated. The pesticide will be transported to surface water only on days in which rainfall causes runoff and/or percolation. The pesticide will enter the water at the concentration of the pesticide in runoff or percolate and will be diluted by the minimal flow rate. Minimum flow is intended to represent reasonable upstream contributions to stream flow on days in which significant rainfall occurs. Another modification made for the simulations at Chico and Foresthill involves sediment binding. In the development of Gleams-Driver, sediment binding was incorporated into the pond model but not into the stream model. The decision not to model sediment binding in streams was taken as a matter of convenience and because most pesticides assessed at the time that Gleams-Driver was developed have high water solubilities and low Koc values. Thus, sediment binding is not a major consideration for these pesticides. For lambda-cyhalothrin, sediment binding cannot be ignored. As indicated in Table 5, the water solubility of lambda-cyhalothrin is low (i.e., 0.005 mg/L) and the Koc for lambda-cyhalothrin is high (i.e., 180,000 mL/g). More specifically, Hadfeld et al. (1993) demonstrated that hydrosoil acts a significant reservoir for lambda-cyhalothrin, which will also be the case for other highly lipophilic compounds. To consider sediment binding, the source code for Gleams-Driver Version 1.8 was modified to consider sediment binding in streams using an algorithm analogous to that used in ponds (SERA 2007b, Section 7.4.1, p. 58). This change to Gleams-Driver will be incorporated into the next public release of Gleams-Driver. In addition to sediment binding, investigators have demonstrated that macrophytes can rapidly absorb and degrade lambda-cyhalothrin (Armitage et al. 2008; Hand et al. 2001; Leistra et al. 2004). Because the two streams under consideration at the Chico and Foresthill sites are ephemeral, it does not seem likely that macrophyte populations will be dense. In addition, quantitative methods for considering macrophyte uptake and degradation are not implemented in Gleams-Driver, and to implement them is beyond the scope of the current analysis. Thus, no attempt was made to consider the impact of
38

1 2 3 4 5 6 7 8 9
10 11 12 13 14 15 16 17 18 19 20 21 22 23 24 25 26 27 28
29 30 31 32 33 34 35 36 37 38 39 40 41 42 43 44 45
macrophytes quantitatively in the current modeling. A major factor in the significance of sediment binding to concentrations in streams or ponds involves the depth of the water column and the depth of the sediment that is functionally involved in sediment binding. In generic Gleams-Driver pond simulations, the assumption is made that the water depth is 2 meters and the sediment depth is 2 cm. Thus, the ratio of the sediment depth to the depth of the water column is 0.01 [0.02 m ÷ 2m]. The actual sediment depth that is important for binding in streams or ponds is likely to vary substantially among sites. Without conducting a site-specific calibration study to determine the sediment depth in a stream, which is important for binding, no objective method for setting the ratio of the sediment depth to water column is apparent. For the current modeling using Gleams-Driver, the ratio of 0.01 is used. According to Liu et al. (2004), copper may increase the rate of lambda-cyhalothrin photolysis in water by a factor of about 50%. No information is available on the levels of copper in the two streams under consideration; furthermore, it is not clear that this type of information could be effectively incorporated into the current modeling. A final consideration in the estimates of concentrations of lambda-cyhalothrin in surface water involves buffers. As summarized in Table 4, there is a 50-foot buffer between the stream and the application area at the Chico site and a 200-foot buffer at the Foresthill site. Neither GLEAMS nor PRZM (the field scale vadose zone model used by EPA) explicitly consider buffers. The quantitative consideration of buffers is very complex, and buffer efficiency at a specific site can be influenced by many factors other than distance —e.g., macropore flow and surface characteristics. Nonetheless, the Gleams-Driver modeling does use information on both the treated area and the total drainage area for the streams at the two sites. This consideration partially and conservatively reflects the potential impact of the buffer zones at the two sites.
3.2.3.4.3.2. Results of Site-Specific Modeling The Gleams-Driver simulations for the streams at the Chico and Foresthill sites are summarized in Table 6. The central estimates are given as the median values for the 100 simulations at each site, and the upper and lower bounds are taken as the empirical 0.025 and 0.975 percentiles—i.e., empirical 95% confidence limits. As summarized in Table 6, concentrations in the streams at the Foresthill and Chico sites are similar. Taking the results for the six applications at a rate of 0.08 lb a.i./acre, the central estimate of the peak concentrations are a factor of 1.4 higher at the Foresthill site, relative to the Chico site—i.e., 7.73 x 10⁻⁶ (Foresthill) ÷ 5.35 x 10⁻⁶ (Chico) ≈ 1.4449). Conversely, the central estimate of the longer concentrations are a factor of about 1.9 higher at the Chico site, relative to the Foresthill site—i.e., 1.56 x 10⁻⁷ (Chico) ÷ 8.02 x 10⁻⁸ (Foresthill) ≈ 1.9451). Given the broad range of modeled concentrations at each site, these differences are insubstantial. The general similarities in concentrations between the two sites appear to reflect offsetting differences between the sizes of the treated areas, the total drainage areas, the representative slopes, and soil characteristics.
39

1 2 3 4 5 6 7
8 9
10 11 12 13 14 15 16 17 18 19 20 21 22 23 24 25 26 27 28 29 30 31 32 33 34 35 36 37 38 39 40 41 42
In addition to the scenarios for six applications of 0.08 lb a.i./acre using a two week interval, Table 6 also summarizes the results of Gleams-Driver simulations at the Chico and Foresthill sites for three applications of 0.16 lb a.i./acre using a 4-week application interval. The differences in estimated concentrations in the streams compared to the six-application scenario are not remarkable. This is to be expected given that both the 0.16 lb a.i./acre and 0.08 lb a.i./acre simulations use the same weather and soil data and both simulations involve the same cumulative application over the same application period.
3.2.3.4.3.3. Results of Generic Modeling Results of the generic modeling from Gleams-Driver are presented in Appendix 6 (a single application) and Appendix 7 (six applications at 2-week intervals). Unlike the simulations for the Chico and Foresthill sites, discussed in the previous subsection, all of the generic runs were conducted at a unit application rate of 1 lb a.i./acre. As a convention, the workbooks created by WorksheetMaker are designed to accommodate a unit application rate of 1 lb/acre, referred to as a water contamination rate (WCR). Expected concentrations are derived from this rate based on the actual application rate that is used in the workbook. All of the concentrations from the generic modeling can be viewed as water contamination rates (WCRs)—i.e., the concentrations anticipated in water at an application rate of 1 lb a.i./acre per application. In other words, Appendix 7 models six applications, each at 1 lb a.i./acre, with a 2-week interval between each application. These generic runs are not used quantitatively in the current risk assessment. The results for the generic modeling of the stream, however, are used in the database for WorksheetMaker. The generic runs for the stream are the only values that are directly comparable to the site-specific runs discussed in the previous subsection. Notably, the upper bounds of the WCRs from the generic runs are higher than the upper bounds of the WCRs derived from the site-specific runs. For example, the upper bound WCR for the peak concentration at the Foresthill site is 7.36 x 10⁻⁴ mg/L per lb a.i./acre. For the generic runs of the stream, the upper bound is higher by a factor of about 11—i.e., 7.9 x 10⁻³ mg/L. This pattern is to be expected. The generic runs are intended to encompass a wide range of weather and site conditions, and the upper bounds from the generic runs are intended to be plausible worse-case estimates. Notably, each of the individual generic runs (i.e., for specific weather patterns and soil types) are not uniformly higher than the corresponding values from the site-specific runs at Chico and Foresthill. This again follows from the nature of the generic runs—i.e., nine locations representing a wide range of climates each run with clay, loam, and sand soil textures. Thus, several of the sites used in the generic modeling have conditions that result in less offsite transfer from the treated site than is apparent for conditions at the Chico and Foresthill sites. The conditions at several of the sites in the generic runs result in WCR values. As noted in the documentation for WorksheetMaker (SERA 2009a), the proper development of site-specific WCR values using Gleams-Driver is likely to provide more reliable estimates than the use of generic WCR values given in most Forest Service risk assessments.
40
3.2.3.4.5. Monitoring Data 1 2 3
Very few monitoring data are available for lambda-cyhalothrin. Lambda-cyhalothrin is not one of the pesticides included in the NAWQA monitoring program (http://water.usgs.gov/nawqa/pnsp/pubs/circ1291/appendix1/appendix1a.pdf). 4
5 6 7 8 9
10 11 12 13 14 15 16 17 18 19 20 21 22 23 24 25 26 27 28 29 30 31 32 33 34 35 36 37 38 39 40 41 42 43 44 45 46
Weston and coworkers (Weston et al. 2004; Weston et al. 2008) monitored numerous pesticides, including lambda-cyhalothrin, in streams and ponds in California. In the study by Weston et al. (2004), pesticide concentrations were assayed in areas of California with heavy agricultural uses of pesticides. The highest assayed concentration of lambda-cyhalothrin was 16.8 ng/g (16.8 µg/kg or 0.0168 mg/kg) in a tailwater pond. Lambda-cyhalothrin was detected in 12% of agricultural drainage canals, with a maximum concentration of 7.8 ng/g (7.8 µg/kg or 0.0078 mg/kg). In the study by Weston et al. (2008), pesticides were assayed in sediment from Del Puerto Creek, San Jose County, California. As in the earlier study, Del Puerto Creek is in an agricultural area in which numerous pesticides are used extensively. Lambda-cyhalothrin was assayed in sediments from this creek at concentrations of 13.1 ng/g (13.1 µg/kg or 0.0131 mg/kg) in December and 4.0 ng/g (4 µg/kg or 0.004 mg/kg) in January. Concentrations of lambda-cyhalothrin in water, however, are not reported in either of the Weston publications. The Kd values used in the Gleams-Driver modeling (Table 5) along with the sediment concentrations (CSed) can be used to estimate the concentration of lambda-cyhalothrin in water (Cw). By definition, Kd = CSed ÷ Cw. Based on concentrations in sediment and the Kd values, the estimated concentrations in water are estimated by rearrangement of the above equation: Cw = CSed ÷ Kd. These calculations are summarized in Table 7, and the estimated average concentration in water is 4.82 x 10⁻⁶ mg/L with a range from 1.03 x 10⁻⁶ to 1.34 x 10⁻⁵ mg/L. The estimated water concentrations from the Weston studies are not directly comparable to the water concentrations modeled using Gleams-Driver because the monitoring from Weston cannot be related to a specific application of lambda-cyhalothrin. Nonetheless, the Weston studies do reflect monitored concentrations of lambda-cyhalothrin as a result of normal agricultural use. The average water concentration calculated from the Weston studies (4.82 x 10⁻⁶ mg/L) is virtually identical to the central estimate for Comanche Creek—i.e., 5.35 x 10⁻⁶ mg/kg (Table 6). The upper bound of 1.34 x 10⁻⁵ mg/L from the Weston studies is about a factor of 4 below the central estimate of 5.89 x 10⁻⁵ for McBride creek (Table 6). These similarities may be coincidental; nevertheless, they do suggest that concentrations in the streams at the Chico and Foresthill sites, modeled using Gleams-Driver, are of the same
41

1 2
3 4 5 6 7 8 9
10 11 12 13 14 15 16 17 18 19 20 21 22 23 24 25 26 27 28 29 30 31 32 33 34 35 36 37 38 39 40 41 42 43 44 45
order of magnitude as water concentrations estimated from monitored concentrations of lambda-cyhalothrin in the sediment of California surface waters.
3.2.3.4.6. Downstream Contamination A final consideration in interpreting the modeling output involves the impact of downstream contamination. As discussed further in the risk characterization for aquatic species (Section 4.4.3), HQs for some groups of aquatic organisms are substantially above the level of concern, which suggests that downstream contamination by lambda-cyhalothrin could be a concern. Down-stream dilution is a common problem and some data are available for lambda-cyhalothrin (Bennett et al. 2005; Moore et al. 2001). Bennett et al. (2005) studied the downstream dilution of lambda-cyhalothrin in agricultural drainage ditches and noted that concentrations decreased from initial levels of 347 µg/L at the point of runoff to 5.23 µg/L at 200 meters downstream—i.e., a decrease in concentration by a factor of about 66. A somewhat greater decrease—i.e., a factor of about 90—was noted for bifenthrin, another pyrethroid. The decrease in concentration appeared to follow a log-linear (reduction-distance) relationship. At 1000 meters downstream, the concentration of lambda-cyhalothrin could be reduced by a factor of about 100,000 (Bennett et al 2005, Figure 3, p. 2125). As discussed by Bennett et al. (2005), the decreases in concentration were associated primarily with binding to and degradation by aquatic macrophytes. In the study by Moore et al. (2001), lambda-cyhalothrin was monitored in a heavily vegetated agricultural drainage ditch following the release of lambda-cyhalothrin as a simulated runoff event. Downstream concentrations of lambda-cyhalothrin were reduced by a factor of about 10 at 45 meters downstream and to below the limit of detection at 50 meters downstream of the simulated release (Moore et al. 2001, Table 2). As in the study by Bennett et al. (2005), however, the substantial reductions in lambda-cyhalothrin concentrations in water were associated with uptake and degradation of lambda-cyhalothrin by dense populations (i.e., 505.5 to 666.5 g/m2) of aquatic macrophytes. Because the Chico and Foresthill sites are ephemeral streams, dense macrophyte populations, such as those characterized by Bennett et al. (2005) and Moore et al. (2001), are not likely to occur; accordingly, these studies are not directly applicable to the two stream sites under consideration. Nonetheless, sediment binding will contribute to a reduction of lambda-cyhalothrin in the water column as contaminated water flows downstream. While the streams at the Chico and Foresthill sites may not have a robust macrophyte community, sediments at the sites and downstream from the sites are likely to bind lambda-cyhalothrin and contribute to a reduction in the concentration of this pesticide in the water column. As discussed in Section 3.2.3.4.3.1, Gleams-Driver was modified to account for sediment binding, and the assumption was made that the functional depth for sediment binding would be 0.01 of the water column depth. Based on the comparison of the modeled concentrations to the limited available monitoring data (Section 3.2.3.4.6), the factor of 0.01 seems plausible for the functional relative depth of sediment binding.
42
1 2 3 4 5 6 7 8 9
10 11 12 13 14 15 16 17 18 19 20 21 22 23 24 25 26 27 28 29 30 31 32 33 34 35 36 37 38 39 40 41 42 43
The only other factors that could be used to estimate a downstream reduction of lambda-cyhalothrin in stream water are the distance from the treatment site to a downstream area and the actual flow rate at or downstream of the treatment site. As summarized in Table 4, the actual maximum flow volume of Comanche Creek is about 150 cubic feet per second or 350,000,000 L/day. As illustrated in Figure 5, the maximum modeled flow rate for Comanche Creek is about 120,000,000 L/day. This discrepancy is due to the input of flow from a dam upstream of the treatment site on Comanche Creek. Because maximum concentrations of lambda-cyhalothrin are modeled to occur at periods of peak flow (Figure 5), it is reasonable to suggest that the actual concentrations of lambda-cyhalothrin in Comanche Creek may be overestimated by the Gleams-Driver modeling by a factor of about 3—i.e., 350,000,000 L/day ÷ 120,000,000 L/day ≈ 2.91. This minor discrepancy is not relevant to the human health risk assessment because the modeled concentrations in water are below the level of concern (Section 3.4). The discrepancy is relevant to the risk characterization for aquatic species, discussed further in Section 4.4.3. No information is available on flow volume or velocity in McBride Creek. In the absence of this information, an elaboration of risks at the Foresthill site is not developed. More generally, GLEAMS and consequently Gleams-Driver are field scale models that are not designed for modeling large watersheds (SERA 2007b). Nonetheless, relatively simple and conservative assumptions may be used to approximate downstream contamination. For example, Gleams-Driver uses a flow velocity of 6,900 meters/day as representative of a small stream (SERA 2007b). This is equivalent to about 4.2 miles [1 statue mile = 1609 meters]. Thus, over the course of a single day, a pesticide entering a stream could travel about 4 miles downstream. The concentration of the pesticide in the water, however, would diminish due to dilution by runoff water from untreated areas along the stream bank. Assuming that the field area modeled by Gleams-Driver is representative of downstream untreated areas, the impact of dilution can be approximated. For example, the length of the Foresthill site paralleling McBride Creek is about 1.3 miles. If the flow rate for McBride Creek were approximately 4.2 miles per day, the dilution factor at 4.2 miles downstream would be about 3 [4.2 miles per day ÷ 1.3 miles ≈ 3.23]. These types of calculations can be extended over longer periods of time and greater distances from the treated site by considering the degradation of the pesticide in both water and sediment. Again, however, these considerations cannot be applied to either the Chico or Foresthill sites because of the lack of information on flow volumes and flow rates. While downstream modeling of the watersheds at both sites could be made in a refined risk assessment, this is beyond the scope of the current abbreviated risk assessment. In addition, without at least some information or reasonably estimates of actual flow rates and flow velocities, any elaborated watershed modeling could not be validated.
43

3.2.3.4.7. Concentrations in Water Used for Risk Assessment 1 2 3 4 5 6 7 8 9
10 11 12 13
14 15 16 17 18 19 20 21 22 23 24 25 26 27 28 29 30
31 32 33 34 35 36 37 38 39 40 41 42 43
The concentrations used in this risk assessment are based on the modeling of the creeks at the Chico and Foresthill sites. The expected concentrations are summarized in the upper portion of Table 6. As specified in Table 6, the application rates and schedules on which the modeling estimates are based are those anticipated in the Forest Service programs at the two sites—i.e., 0.08 lb a.i./acre, six applications at 2-week intervals starting in May or 0.16 lb a.i./acre, three applications at 4-week intervals starting in May. For more general applications, the water contamination rates (WCRs) from the generic Gleams-Driver modeling are included in the database for the Forest Service’s Worksheet Maker program. These values are given in the last entry in the bottom section of Table 6. Differences between the generic estimates and the site-specific estimates are discussed in Section 3.2.3.4.3.3.
3.2.3.5. Oral Exposure from Contaminated Fish This risk assessment includes three sets of exposure scenarios for the consumption of contaminated fish, and each set includes separate estimates for the general population and subsistence populations. These exposure scenarios consist of one set for acute exposures following an accidental spill (Worksheets D08a and D08b), another set for acute exposures based on expected peak concentrations (Worksheets D08c and D08d), and the third set for chronic exposures based on estimates of longer-term concentrations in water (Worksheets D09a and D09b). The two worksheets in each of these three sets are intended to account for different rates of wild-caught fish consumption in both general and subsistence populations. Details of exposure scenarios involving the consumption of contaminated fish are provided in Section 3.2.3.5 of SERA (2007a). The consumption of contaminated fish is a standard exposure scenario used in most Forest Service risk assessments. The scenario is maintained in the current risk assessment in order to make the assessment more generically useful. For the two sites that are the focus of the current Forest Service risk assessment, the ephemeral streams are not likely to support populations of fish that humans would consume.
3.2.3.6. Dermal Exposure from Swimming in Contaminated Water Conceptually and computationally, the exposure scenario for swimming in contaminated water is virtually identical to the contaminated gloves scenario used for workers (Section 3.2.2.2)—i.e., a portion of the body is immersed in an aqueous solution of the compound at a fixed concentration for a fixed period of time. The major differences in the two scenarios involve the pesticide concentration in water and the exposed surface area of the body. For the worker wearing contaminated gloves, the assumption is made that both hands are exposed to the field solution—i.e., the concentration of the compound in the applied solution. For the swimmer, the assumption is made that the entire surface area of the body is exposed to the expected peak concentrations in ambient water (Table 6). Also, like the exposure scenario involving contaminated gloves, the swimming scenario is conservative in that it assumes zero-order absorption directly from the water to the systemic circulation. Although the swimmer will not be immersed for 1 hour, the entire
44
1 2 3 4 5 6 7 8 9
10 11 12 13 14 15 16 17 18 19
20 21 22 23 24 25 26 27 28 29 30 31 32 33 34 35 36 37 38 39 40 41 42 43 44 45
body surface is used both as a conservative approximation (i.e., the MEI) and to consider intermittent episodes during which the whole body might be immersed or at least wet. As in the corresponding worker exposure scenario, the 1-hour period of exposure is somewhat, but not completely, arbitrary, given that longer periods of exposure are plausible. Nonetheless, the 1-hour period is intended as a unit exposure estimate. In other words, the exposure and consequently the risk will increase linearly with the duration of exposure, as indicated in Worksheet D11. Thus, a 2-hour exposure would lead to a hazard quotient that is twice as high as that associated with an exposure period of 1 hour. In cases in which this or other similar exposures approach a level of concern, further consideration is given to the duration of exposure in the risk characterization (Section 3.4). For lambda-cyhalothrin, the levels of exposure are well below the level of concern. As with the exposure scenario for the consumption of fish, the swimming scenario is standard in most Forest Service risk assessments and is maintained in the current risk assessment only to increase the general utility of this document to the Forest Service. For the two specific sites that are the focus of this analysis, it does not seem plausible that the streams in question would be used for swimming.
3.2.3.6. Oral Exposure from Contaminated Vegetation Forest Service risk assessments typically include standard exposure scenarios for the acute and longer-term consumption of contaminated vegetation. Two sets of exposure scenarios are provided: one for the consumption of contaminated fruit and the other for the consumption of contaminated vegetation. These scenarios are detailed in Worksheets D03a and D03b for acute exposure and Worksheets D04a and D04b for chronic exposure. The computational details for this exposure scenario are discussed in SERA (2007a, Section 3.2.3.6). Typically, these exposure scenarios assume that the fruit and vegetation are directly sprayed at the nominal application rate, and this assumption is maintained in the EXCEL workbooks for lambda-cyhalothrin which are generated by WorksheetMaker. For the Foresthill site, the assumption is not reasonable, given that neither edible vegetation nor fruit exists in the treatment area. For the Chico site, blackberries grow along the banks of Comanche Creek. As discussed in Section 3.2.3.4.3.1, applications of lambda-cyhalothrin may occur within 50 feet of Comanche Creek. Thus, for these exposure scenarios at the Chico site, the upper bound estimate of drift used in the Gleams-Driver modeling—i.e., 0.02—is used rather than the assumption of direct spray in Worksheets D03a through D04b. For the Foresthill site, no information is available on the occurrence of edible fruit or vegetation in the vicinity of the treatment area. Consequently, no modifications are made to the EXCEL workbook for the Foresthill site, and the exposure scenario involving direct spray of fruit and edible vegetation is used. Nonetheless, because the Foresthill site is in a remote location, these exposure scenarios may be unlikely to occur, as discussed further in the risk characterization for human health (Section 3.4).
45
1 2 3 4 5 6 7 8 9
10 11 12 13
The concentration of the pesticide on contaminated fruit and vegetation is estimated using the empirical relationships between application rate and concentration on different types of vegetation (Fletcher et al. 1994). The rates given by Fletcher et al. (1994) are based on a reanalysis of data originally compiled by Hoerger and Kenaga (1972) and represent estimates of the concentration in different types of vegetation (mg chemical/kg vegetation) after a normalized application rate of 1 lb a.i./acre. The residue rates recommended by Fletcher et al. (1994) are given in Table 8 of the current Forest Service risk assessment. Note that Fletcher et al. (1994) as well as Hoerger and Kenaga (1972) give only central estimates and upper bound estimates of residue rates. In Table 8, lower bound estimates are given under the assumption that the ratio of the central estimate to the upper bound estimate will be identical to the ratio of the lower bound to the central estimate (i.e., the variability will be log-symmetrical).
46

3.3. DOSE-RESPONSE ASSESSMENT 1
2 3 4 5 6 7 8 9
10 11
12 13 14 15 16 17 18 19 20 21 22 23 24 25 26 27 28 29 30 31 32 33 34 35 36 37 38 39 40
3.3.1. Overview The toxicity values used to develop the dose-response assessments in the human health risk assessment of lambda-cyhalothrin are summarized in Table 9. The acute and chronic RfDs for lambda-cyhalothrin are adopted directly from the most recent risk assessment by U.S. EPA (U.S. EPA/OPP 2003b). Both the acute and chronic RfDs are based on a chronic study in dogs in which the acute NOAEL was 0.5 mg/kg bw/day and the chronic NOAEL was 0.1 mg/kg bw/day. Both NOAELs are based on signs of neurotoxicity, transient signs of the neurotoxicity observed on Day 2 at 3.5 mg/kg bw/day and longer-term signs of neurotoxicity from Week 2 to 9 observed at 0.5 mg/kg bw/day. Both RfDs are derived using an uncertainty factor of 100.
3.3.2. Acute RfD U.S. EPA/OPP sometimes derives an acute RfD for pesticide exposures that occur in a single day. Accordingly, acute RfDs are usually based on developmental studies in which an adverse effect is associated with a single dose of a pesticide. For lambda-cyhalothrin, however, the U.S. EPA/OPP uses a somewhat different and more conservative approach. As summarized in Section 3.1.9.1, the lowest developmental NOAEL is 15 mg/kg bw/day, from a standard teratology study in rats. In the chronic toxicity study in dogs, however, ataxia was noted in dogs from Day 2 onward at doses of 3.5 mg/kg bw/day. The NOAEL for ataxia was 0.5 mg/kg bw/day. Because this effect was noted so early in the chronic dogs study, the dose of 0.5 mg/kg bw/day was classified as an acute NOAEL, which the EPA uses as the basis for the acute RfD (U.S. EPA/OPP 2003b). While this approach is somewhat atypical, the dog study NOAEL of 0.5 mg/kg bw/day appears to reflect the most sensitive endpoint (neurotoxicity) as well as the most sensitive species (dogs). In some Forest Service risk assessments on weak acids, dogs are considered to be atypically sensitive because dogs have a very limited ability to excrete weak acids, relative to other mammals, including humans. Thus, NOAELs from studies in dogs are not used as the basis for RfDs. Lambda-cyhalothrin, however, is not a weak acid, and the EPA decision to use the dog study as the basis for the acute RfD (U.S. EPA/OPP (2003b) seems appropriate. The acute RfD of 0.005 mg/kg bw/day is derived by dividing the acute NOAEL of 0.5 mg/kg bw/day by a factor of 100, the product of an uncertainty factor of 10 for uncertainties in species-to-species extrapolation and an uncertainty factor of 10 for uncertainties in considering sensitive individuals. These are standard uncertainty factors used in most risk assessments (SERA 2007a). The acute RfD derived by U.S. EPA/OPP (2003b) is used in the current Forest Service risk assessment to characterize the potential risks associated with all acute exposures in workers and members of the general public.
47

3.3.3. Chronic RfD 1 2 3 4 5 6 7 8 9
10 11 12 13 14 15
16 17 18 19 20 21 22 23
24 25 26 27 28 29 30 31 32 33 34
As discussed in the previous subsection, dogs appear to be more sensitive than other groups of mammals to lambda-cyhalothrin; accordingly, U.S. EPA/OPP (2003b) bases both the acute and chronic RfD on the chronic dog study, in which, signs of neurotoxicity were noted at 0.5 mg/kg bw/day early during the chronic exposure (i.e., from Week 2 through Week 9 of the 1-year study). These effects did not persist through the 1-year period of exposure, and the EPA elected to classify the 0.5 mg/kg bw/day dose as a LOAEL for chronic toxicity. The chronic NOAEL was set at the lowest dose tested (i.e., 0.1 mg/kg bw/day). The RfD of 0.001 mg/kg bw/day was derived by dividing this chronic NOAEL by an uncertainty factor of 100. The rationale for this uncertainty factor is identical to that used for the acute RfD. Following normal practice, the current Forest Service risk assessment adopts the EPA chronic RfD of 0.001 mg/kg bw/day, and uses it to characterize risks for workers and members of the general public associated with all longer-term exposure scenarios.
3.3.4. Surrogate RfD for Occupational Exposures The U.S. EPA will sometimes derive RfDs for occupational exposures that differ from the chronic RfD. This is not the case for lambda-cyhalothrin. Consequently, the chronic RfD is used for general exposure scenarios in workers (i.e., non-accidental exposures associated with the routine application of lambda-cyhalothrin). As discussed further in Section 3.4.2 (risk characterization for workers), the use of the chronic RfD for general exposures in workers does not impact the risk assessment for lambda-cyhalothrin because all general exposures in workers are below the level of concern.
3.3.5. Dose-Severity Relationships Unless all hazard quotients are below the level of concern (HQ=1), Forest Service risk assessments attempt to define dose-severity relationships in order to more fully interpret the plausible consequences of exceeding the RfD. The current abbreviated risk assessment, however, does not involve the same level of review used in most Forest Service risk assessments. Consequently, no formal or detailed dose-severity assessment is considered. For the assessment of the Chico and Foresthill sites, this limitation is not significant due to the nature of the risk characterization and plausibility of exposures, as discussed further in the risk characterization (Section 3.4).
48
3.4. RISK CHARACTERIZATION 1
2 3 4 5 6 7 8 9
10 11 12 13 14 15 16 17 18 19 20 21 22 23 24 25 26 27 28 29 30 31 32
33 34 35 36 37 38 39 40 41 42 43
3.4.1. Overview Under the application conditions being considered by the Forest Service, there is no basis for asserting that workers are likely to be at risk in the normal application of lambda-cyhalothrin at the Chico or Foresthill sites. The risks associated with accidental exposures are more difficult to characterize because of uncertainties associated with estimates of some dermal exposure rates. Lambda-cyhalothrin may cause numbness or tingling of the skin. If this effect is noted in workers involved in the application of lambda-cyhalothrin, this would suggest that the workers are at risk of systemic toxic effects. If workers effectively implement prudent worker protection measures, however, the risks of systemic toxicity are probably low. For members of the general public, the quantitative risk characterizations differ between the Chico and Foresthill sites. These differences, however, may simply reflect the fact that the Chico site is much better characterized than is the Foresthill site, at least in terms of the plausible exposures for members of the general public. At the Chico site, the most plausible exposure scenario involves the consumption of contaminated blackberries from bushes that grow along the banks of Comanche Creek. The HQs for these exposure scenarios are below the level of concern by a factor of at least 10. The only other non-accidental exposure scenario that may be plausible involves the consumption of fish by subsistence populations. The upper bound HQ for this scenario is below the level of concern by a factor of 3. Much higher HQs are derived for the Foresthill site because very conservative default exposure assumptions are used in the absence of specific information that would justify the use of more realistic exposure assumptions. For the Foresthill hill site, the HQs for the consumption of contaminated vegetation, fruit, and fish exceed the level of concern by factors of 4-25. Because the Foresthill site is in a relatively remote location, the risk characterization for this site may reflect potential rather than plausible risk. Accidental exposure scenarios for both sites result in HQs that substantially exceed the level of concern. This is typical of risk characterizations for many pesticides covered by Forest Service risk assessments. In the event of major accidental spills or other accidental events, remedial actions to reduce and limit exposures to members of the general public would be appropriate.
3.4.2. Workers For applications at the Chico and Foresthill sites, none of the HQs for general exposures to workers exceeds the level of concern (HQ=1). As described in Section 3.2.2.1, the term general exposure refers to the range of exposure levels to be expected during the normal application of the pesticide. At the Chico site, the upper bound of the HQ is 0.1, below the level of concern by a factor of 10. As discussed in Section 3.2.2.1.1, the methods used to calculate worker exposure are based on standard methods used in Forest Service risk assessments to estimate absorbed dose with a modification to consider the use of closed cabins in airblast applications. Using a very different method—i.e., the Pesticide Handlers Exposure Database developed by the U.S. EPA—very similar estimates of worker exposures can be made. Thus, confidence in the risk characterization
49

1 2 3 4 5 6 7 8 9
10 11 12 13 14 15 16 17 18 19 20 21 22 23 24 25 26 27 28 29 30 31 32 33 34 35 36
37 38 39 40 41 42 43 44 45
is reasonably high. At the Foresthill site, the upper bound of the HQ is 0.6, below the level of concern by a factor of about 2. As with workers at the Chico site, the exposure assessment for workers at the Foresthill site is based on standard Forest Service estimates of absorbed dose modified to account for the use of personal protective equipment (Section 3.2.2.1.2). These exposure rates are supported by a study of absorbed doses in workers involved in ground applications of lambda-cyhalothrin. Consequently, confidence in the risk characterization of workers at the Foresthill site is also high. There is no basis for asserting that workers are likely to be at risk in the normal application of lambda-cyhalothrin under the exposure conditions at the Chico or Foresthill sites. Note, however, that this risk characterization is based on the assumptions that the worker protection measures described by the Forest Service are rigorously and effectively implemented. Confidence in the risk characterization for accidental exposure scenarios is mixed. As indicated in Worksheet E02 in the EXCEL workbooks that accompany this risk assessment (Attachments 1 and 2), the HQs for exposure scenarios associated with wearing contaminated gloves are much higher (a maximum HQ of 46) than those for exposure scenarios involving accidental spills onto the hands or lower legs (a maximum HQ of 0.004). The scenarios for spills are based on a human study of the dermal absorption rate of lambda-cyhalothrin. Confidence in these scenarios is high. As discussed in Section 3.1.3.2, however, the measured human dermal absorption rate is much lower than rates based on QSAR estimates of the first-order dermal absorption rate, which calls into question the estimates of Kp values used to estimate the absorbed doses associated with the contaminated glove scenarios. The scenarios for contaminated gloves are based on the assumption of zero-order absorption using the Kp derived from an algorithm developed by U.S. EPA/ORD (1992); nevertheless, confidence in this algorithm is low because the lipophilicity of lambda-cyhalothrin exceeds that of the compounds used to develop the algorithm. Thus, there is little confidence in the relatively high HQs associated with the contaminated glove scenarios. Regardless of the variability in confidence in the accidental exposure scenarios, the most plausible outcome of prolonged dermal exposure to lambda-cyhalothrin is numbness or tingling of the skin (paresthesia). If this effect is noted in workers involved in the handling or application of lambda-cyhalothrin, it is most certainly because the workers are not effectively implementing worker protection practices, thereby putting themselves at risk of systemic toxic effects.
3.4.3. General Public At the Chico site, the probability of exposure to lambda-cyhalothrin is high because the site is open to and used by members of the general public. The risks to members of the general public, however, appear to be low. For non-accidental exposures, the highest HQs are associated with the consumption of contaminated vegetation—i.e., an HQ of 0.7 for acute exposure and 0.6 for chronic exposure. These exposure scenarios are standard in all Forest Service risk assessments, but the associated HQs appear to be irrelevant for the Chico site, given the lack of edible vegetation at the site. Fruit, specifically blackberries, which might be consumed by members of the general public, do grow at
50

1 2 3 4 5 6 7 8 9
10 11 12 13 14 15 16 17 18 19 20 21 22 23 24 25 26 27 28 29 30 31 32 33 34 35 36 37 38 39 40 41 42 43 44 45 46
this site; however, the HQs for these scenarios are remarkably low—upper bound HQ values of 0.1 for acute exposure and 0.08 for longer-term exposures. The only other non-accidental HQ that approaches a level of concern involves the consumption of contaminated fish by subsistence populations—i.e., an upper bound value of 0.3. As noted in Section 3.2.3.5, it is not likely that these HQ values are of any practical concern because this ephemeral stream is not likely to be used as a source of fish. The Foresthill site is in a remote location. Although members of the general public are not specifically excluded from this site, the probability that they would access this site and be exposed to significant amounts of lambda-cyhalothrin appears to be much lower than the probability of such exposures at the Chico site. Nonetheless, the HQs for members of the general public are much higher at the Foresthill site than at the Chico site. The highest upper bound HQs are associated with the consumption of contaminated vegetation (acute HQ = 35, chronic HQ = 28), contaminated fruit (acute HQ = 5, chronic HQ = 4), and the acute scenarios for the consumption of contaminated fish by subsistence populations (acute HQ = 4). It is not clear that the Foresthill site has vegetation or fruit likely to be consumed by members of the general public. In addition, the scenarios for the consumption of vegetation and fruit at the Foresthill site all assume direct spray. This is a standard and conservative assumption in Forest Service risk assessments. For the Chico site, this assumption is not reasonable based on information for the Chico site. For the Foresthill site, the assumption of direct spray may or may not be reasonable. McBride Creek at the Foresthill site does not support populations of fish which might be consumed by humans (Bakke 2010). As discussed in Section 3.2.3.4.3.2, information from the Forest Service indicates that McBride Creek will be dry during the periods when lambda-cyhalothrin is applied, and this assertion is supported by Gleams-Driver modeling. Some of the accidental exposure scenarios lead to HQs that substantially exceed the level of concern—i.e., upper bound HQs of about 1500 for the consumption of fish by subsistence populations, 300 for fish consumption by the general population, and 3 for the consumption of contaminated water by a small child. For the Foresthill site, none of these HQs appears to be relevant. McBride Creek is likely to be dry when lambda-cyhalothrin applications are made. For the Chico site, however, information from the Forest Service indicates that pools of standing water may occur in the Comanche Creek bed during periods when lambda-cyhalothrin is applied. Nonetheless, the consumption of contaminated fish does not appear to be a relevant scenario for the Chico site. As discussed in Section 4.4.3.1 (risk characterization for fish), an accidental spill of a large amount of lambda-cyhalothrin into a small volume of water is likely to kill all fish in the water. The consumption of contaminated water by a small child after an accidental spill is a more plausible accidental exposure scenario. In the event of a spill of lambda-cyhalothrin into a small
51

1 2 3
4 5 6 7 8 9
10
11 12 13 14 15 16 17 18 19 20 21 22 23 24 25 26 27 28 29
30 31 32 33 34 35 36 37 38 39 40 41 42
body of water, measures should be taken to ensure that members of the general public do not consume the water. This recommendation, of course, is standard for any accidental spill of any pesticide into water.
3.4.4. Sensitive Subgroups For exposures to almost any chemical, there is particular concern for children, women who are pregnant or may become pregnant, the elderly, or individuals with any number of different diseases. As discussed in Section 3.1.3, lambda-cyhalothrin is detoxified in the liver and metabolites are excreted primarily by the kidney. It is possible that individuals with liver or kidney diseases could be more sensitive to lambda-cyhalothrin than other individuals. This statement is true for most pyrethroids (ATSDR 2003).
3.4.5. Connected Actions The Council on Environmental Quality (CEQ), which provides the framework for implementing NEPA, defines connected actions (40 CFR 1508.25) as actions which occur in close association with the action of concern; in this case, the use of a pesticide. Actions are considered to be connected if they: (i) Automatically trigger other actions which may require environmental impact statements; (ii) Cannot or will not proceed unless other actions are taken previously or simultaneously, and (iii) Are interdependent parts of a larger action and depend on the larger action for their justification. Within the context of this assessment of lambda-cyhalothrin, “connected actions” include actions or the use of other chemicals which are necessary and occur in close association with use of lambda-cyhalothrin. As discussed in detail in Sections 3.1.14, lambda-cyhalothrin formulations contain inert components. The inert ingredients in several lambda-cyhalothrin formulations are not well characterized. The inerts that are disclosed, such as petroleum hydrocarbons, may cause a wide spectrum of toxic effects. The limited data on the toxicity of the formulations do not yield a consistent pattern in terms of the potential impact of the inert ingredients on the toxicity of the formulations. Thus, the impact of the inerts on the potential risks in using different formulations cannot be well characterized.
3.4.6. Cumulative Effects Similar to the issues involved in assessing inerts, it is beyond the scope of the current risk assessment to identify and consider all agents that might interact with, or cause cumulative effects with lambda-cyhalothrin. To do so quantitatively would require a complete set of risk assessments on each of the other agents to be considered. U.S. EPA/OPP (2009c) groups lambda-cyhalothrin with three other pyrethroids: cyfluthrin, cypermethrin, and deltamethrin (all Type II pyrethroids). Exposures to mixtures of any combination of these four pyrethoids would be regarded as additive, in terms of risk. Esfenvalerate is classified as having mixed (Type I/II) activity. It would be prudent to regard risks associated with esfenvalerate and lambda-cyhalothrin as additive.
52

1 2 3 4 5 6
The current Forest Service risk assessment does consider the effect of repeated exposures to lambda-cyhalothrin for both workers and members of the general public. The chronic RfD is used as an index of acceptable longer-term exposures. Consequently, the risk characterizations presented in this risk assessment for longer-term exposures specifically address and encompass the potential impact of the cumulative effects of repeated human exposure to lambda-cyhalothrin.
53
4.1. HAZARD IDENTIFICATION 1
2 3 4 5 6 7 8 9
10 11 12 13 14 15 16 17 18 19 20 21 22 23 24 25 26 27
28
29 30 31 32 33 34 35 36 37 38 39 40 41 42 43
4.1.1. Overview As with most commercial insecticides, lambda-cyhalothrin is much more toxic to insects and other arthropods than it is to vertebrates. In terms of terrestrial organisms, lambda-cyhalothrin is highly toxic to insects with contact LD50 values as a low as 0.065 mg/kg bw. Non-arthropod invertebrates appear to be substantially less sensitive than terrestrial insects or groups of arthropods to lambda-cyhalothrin. Also, lambda-cyhalothrin is classified as only moderately toxic to mammals. The lowest reported oral LD50 for technical grade lambda-cyhalothrin is 56 mg/kg bw, a factor of over 800 below the lowest contact LD50 in insects. Birds are much less sensitive than either insects or mammals to lambda-cyhalothrin, which is classified as only slightly toxic to birds. Canids appear to be somewhat more sensitive than rodents to lambda-cyhalothrin. Similarly, mallards appear to be somewhat more sensitive than quail to lambda-cyhalothrin. Figure 6 illustrates an overview of the acute toxicity data for aquatic organisms, including fish, aquatic arthropods, and other aquatic invertebrates. The specific data used to develop this plot are discussed in the subsections on fish (Section 4.1.3.1) and aquatic invertebrates (Section 4.1.3.3). As illustrated in Figure 6, aquatic arthropods are more sensitive than fish. Based on the geometric mean of the 96-hour LC50 values in fish (0.5 µg/L) and 48-hour LC50 values in aquatic arthropods (0.08 µg/L), arthropods are more sensitive than fish by a factor of about 6. Relatively little data are available on the toxicity of lambda-cyhalothrin to non-arthropod aquatic invertebrates; however, the available data suggest that non-arthropod aquatic invertebrates (such as mollusks) are much less sensitive than either aquatic arthropods or fish to lambda-cyhalothrin. For amphibians, the only available LC50 value for cyhalothrin is 4 µg/L in a tadpole. Aquatic plants appear to be unaffected by to lambda-cyhalothrin. 4.1.2. Toxicity to Terrestrial Organisms
4.1.2.1. Mammals As discussed in the human health risk assessment (Section 3.1), there are several toxicity studies regarding the exposure of experimental mammals to lambda-cyhalothrin. These studies are also relevant to the assessment of potential hazards to mammalian wildlife. Based on acute oral LD50 values of 56-79 mg/kg bw (Section 3.1.4), U.S. EPA/EFED (1998) classifies lambda-cyhalothrin as Moderately Toxic to mammals. The ecological risk assessment attempts to identify subgroups of mammals that may display greater or lesser sensitivity to a particular pesticide. These differences may be based on allometric scaling (e.g., Boxenbaum and D'Souze 1990) or differences in physiology. As discussed in Section 3.3 (dose-response assessment for human health effects), dogs appear to be somewhat more sensitive to than rodents lambda-cyhalothrin. Data on mammals, however, are insufficient to determine if this difference in sensitivity is related to body size, physiological differences, or simply to random variability among different studies conducted at different times in different laboratories. For the current
54
1 2 3 4 5
6 7 8 9
10 11 12 13 14 15 16 17 18 19 20 21 22 23 24 25 26 27 28 29 30 31 32 33 34 35 36 37 38 39 40 41 42 43 44 45
Forest Service risk assessment, canids are assumed to be more sensitive than rodents or other mammals; accordingly, different toxicity values are derived for canids and non-canid species (Section 4.3.2.1). In the absence of a clear relationship between body weight and toxicity across a range of mammalian species, however, separate toxicity values are not derived for small and large non-canid mammals.
4.1.2.2. Birds The open literature on lambda-cyhalothrin does not include avian toxicity studies or field studies. Typically, the EPA requires three types of avian toxicity studies for pesticide registration: single gavage dose LD50 studies, 5-day dietary toxicity studies, and chronic (≈30 week) dietary reproduction studies. The required studies are usually conducted with mallard ducks and bobwhite quail. For lambda-cyhalothrin, there is only a gavage LD50 in which Roberts and Fairley (1984) assayed the toxicity of 739, 1040, 1620, 2580, or 3950 mg/kg technical grade lambda-cyhalothrin in mallards. There was no mortality at any dose, and the only potential sign of toxicity was a small liver lesion, which was not attributed to treatment, in one bird in the 2580 mg/kg bw dose group. Four 5-day dietary studies were submitted to the EPA (Roberts et al. 1981a,b; Roberts et al. 1985a,b). In the earlier studies by Roberts et al. (1981a,b), no clear dose-response relationships were observed, and these studies were repeated by Roberts et al. (1985a,b). Roberts et al. (1985a) assayed dietary concentrations of 577, 1020, 1980, 3040, 4090, or 5300 ppm lambda-cyhalothrin in quail. No significant mortality or other signs of toxicity were noted at any dose. Mortality was noted in 1/10 birds sporadically—i.e., 10% mortality at 577, 1020, 3040, and 5300 ppm, but 0% mortality was noted at 1980 and 4090 ppm. Mallards appear to be somewhat more sensitive than quail to lambda-cyhalothrin. In the study by Roberts et al. (1985b), mallards were exposed to lambda-cyhalothrin at dietary concentrations of 0, 505, 1030, 2030, 3020, 4020, or 5040 ppm for 5 days. The dietary LC50 was 3948 ppm. At a concentration of 2030 ppm, 2 of 10 birds died. While this incidence is not statistically significant from the control group (p=0.2368) using the Fisher Exact test, the small number of animals tested makes standard statistical tests relatively insensitive. At 505 ppm, no mortality was noted. At higher doses, signs of neurotoxicity were noted—i.e., subdued behavior and unsteady gait—as well as a decrease in body weight gain and food consumption. This study was classified as core by U.S. EPA/OPP. Based on these acute toxicity studies, lambda-cyhalothrin is classified as slightly toxic to birds (U.S. EPA/EFED 1988). Three reproduction studies were submitted to the U.S. EPA, two in mallards (Beavers et al. 1989; Roberts et al. 1982a) and one in quail (Roberts et al. 1982b). As in the acute dietary studies, mallards appear to be somewhat more sensitive than quail to lambda-cyhalothrin. The studies by Roberts et al. (1982a,b) involved only two dietary concentrations of lambda-cyhalothrin, 5 and 50 ppm. In the quail study, Roberts et al. (1982b) do not report adverse effects on adults or offspring. In the study on mallards,
55

1 2 3 4 5 6 7 8 9
10 11 12 13 14 15 16 17 18 19 20
21 22 23 24 25 26
27 28 29 30 31 32 33 34 35 36 37 38 39 40 41 42 43 44
however, Roberts et al. (1982a) report decreased egg production at 50 ppm. In the later study on mallards, Beavers et al. (1989) used dietary concentrations of 0.5, 5, 15, and 30 ppm as well as a control group. The only effects clearly associated with treatment were increases in food consumption in the 15 and 30 ppm groups. These increases were not accompanied by statistically significant increases in body weight. In the ecological risk assessment conducted by U.S. EPA/EFED (1988) the following comment is made on the reproduction study by Roberts et al. (1982a):
Technical PP321 is expected to be even more toxic since it is the "biologically active constituent" of cyhalothrin. Therefore, the NOEL is probably less than 5 ppm.
U.S. EPA/EFED (1988, p. 8) The above comment suggests that the compound tested by Roberts et al. (1982b) was cyhalothrin (i.e., the mixture of four enantiomers) rather than lambda-cyhalothrin (the mixture of two enantiomers). The genesis of this comment is not clear. The DER for Roberts et al. (1982b) identifies the test substance as PP321. This same designation is also used in the DER for the study by Beavers et al. (1989), which explicitly identifies the test compound as lambda-cyhalothrin.
4.1.2.3. Reptiles There are no data regarding the toxicity of lambda-cyhalothrin to reptiles or amphibians in the database maintained by Pauli et al. (2000), and there are no other sources of such data in the available literature.. Generally, in the absence of toxicity data concerning reptile exposure to pesticides, the EPA recommends the use of birds as suitable surrogates for reptiles.
4.1.2.4. Terrestrial Invertebrates Appendix 4 summarizes laboratory assays (Appendix 4, Table 1) and field studies (Appendix 4, Table 2) on the toxicity of lambda-cyhalothrin to terrestrial invertebrates. There is a range of laboratory studies concerning the toxicity of lambda-cyhalothrin to terrestrial invertebrates. In Appendix 4 (Table 1), these studies are classified as direct contact, residue contact (i.e., contact with lambda-cyhalothrin residues on surfaces), dietary, and soil bioassays. Although the EPA does not typically quantify risks to terrestrial invertebrates, it does require both direct contact and oral toxicity studies on honeybees, for pesticide registration. As summarized in Appendix 4, the studies submitted to the EPA yield a direct contact LD50 of 0.038 µg/bee and a dietary LD50 of 0.909 µg/bee. Based on these bioassays, direct contact is much more toxic than dietary exposure in honeybees. In accordance with these studies, U.S. EPA/EFED (1988) classifies lambda-cyhalothrin as highly toxic to honeybees. Several other direct contact bioassays on bees and other invertebrate species are available in the published literature on lambda-cyhalothrin. Because of large differences in body size among terrestrial invertebrates, these studies are best compared in terms of doses
56
1 2 3 4 5 6 7 8 9
10 11 12 13 14 15 16 17 18 19 20 21 22 23 24 25 26 27 28 29 30 31 32 33 34 35 36 37 38 39 40 41 42 43 44 45 46
expressed as mg/kg bw. Neither U.S EPA/EFED (1988) nor the two published honeybee studies (Johnson et al. 2006 ; Pilling and Jepson 1993) specify the weight of honeybees. For these studies, doses in units of mg/kg bw are presented in Appendix 2 and are calculated assuming a body weight of 93 mg (i.e., 0.000093 kg) from USDA/APHIS (1993). In the contact bioassays summarized in Appendix 2, LD50 values for honeybees range from 0.4 mg/kg bw (U.S. EPA/OPP 1988) to 1.7 mg/kg bw (Mayer et al. 1998)—i.e., the values vary by a factor of 4.25. The most sensitive species is the alfalfa leafcutter bee, with an LD50 of 0.065 mg/kg bw, about a factor of 6 below the LD50 in honeybees cited in U.S. EPA/OPP (1988). Based on the study by Dinter and Poehling (1995), spiders appear to be about as sensitive as honeybees to lambda-cyhalothrin. Direct contact bioassays are used in Forest Service risk assessments, to quantify risks associated with direct spray and spray drift. Differences in sensitivity among invertebrates after direct contact are discussed further in the dose-response assessment (Section 4.3.2.3.2). Dietary assays are also used quantitatively in Forest Service risk assessments to evaluate risks to invertebrates from the consumption of lambda-cyhalothrin. Only two studies are available, the oral study in honeybees by Gough et al. (1984) and the published study by Abro et al. (1997) on the tobacco cutworm, a target species. These two studies are not directly comparable. Gough et al. (1984) report an oral LD50 of about 0.909 µg/bee in bees fed sucrose contaminated with lambda-cyhalothrin. Based on a body weight assumption of 93 mg for the honeybee (USDA/APHIS 1993), the oral LD50 is equivalent to about 9.7 mg/kg bw [0.000909 mg/bee ÷ 0.000093 kg/bee ≈ 9.774 mg/kg bw]. The study by Abro et al. (1997) involved exposures of cutworms to cauliflower dipped in solutions of lambda-cyhalothrin; however, since the study does not indicate the concentration of lambda-cyhalothrin on the cauliflower, it is not possible to estimate the doses to the cutworms in units of mg/kg bw. Soil assays may also be used quantitatively in Forest Service risk assessments. Most soil bioassays are conducted in earthworms. As summarized in Appendix 2, earthworms appear to be relatively tolerant, with acute LC50 values ranging from about 24 to greater than 100 ppm, chronic LC50 values ranging from about 3 to10 ppm, and EC50 values for avoidance ranging from about 0.2 to 3 ppm (Garcia et al. 2008). As discussed by Framptom et al. (2006), arthropods appear to be much more sensitive than annelids to lambda-cyhalothrin. The lowest LC50 reported by Frampton et al. (2006) is 0.5 ppm for an isopod, Porcellionides pruinosus. More recently, Ruan et al. (2009) reported adverse effects—i.e., a decrease in locomotion—in soil nematodes at concentrations as low as 0.002 ppm and a decrease in body size at concentrations of 2 ppm. Ruan et al. (2009) do not provide a dose-response assessment or a tabular summary of the data that would permit the calculation of EC50 values for either the decreases in locomotion or body size. While not directly comparable to the other soil bioassays, the results from Ruan et al. (2009) suggest that soil nematodes may be more sensitive than other groups of soil invertebrates to lambda-cyhalothrin. Several residue contact assays are also available. These studies involve application of the pesticide to a surface, such as glass, filter paper, or vegetation. The exposure can be expressed in units of concentration (e.g., mg/L applied to a surface) or units of mass per
57

1 2 3 4 5 6 7 8 9
10 11 12 13 14 15 16 17 18 19 20 21 22 23 24 25 26 27 28 29 30 31 32 33 34 35 36 37 38 39 40 41 42 43 44 45 46
unit area. The studies expressed in units of concentration are not used directly in Forest Service risk assessments. These studies are typically focused on differences among pesticides and/or differences among species or age groups. For example, the study by Booth et al. (2007) demonstrates that aphids (a target species) are very sensitive to lambda-cyhalothrin, while lacewings (a beneficial species that preys on aphids) are relatively tolerant to lambda-cyhalothrin. The exposures that are expressed in units of mass per surface area can be converted to units of application rate—i.e., lb a.i./acre. These studies indicate that exposures equivalent to application rates as low as 0.0044 lb a.i./acre can cause adverse effects in some species of terrestrial invertebrates (Desneux et al. 2004b). As summarized in Appendix 2 (Table 2), the literature on lambda-cyhalothrin includes five field studies: Gough et al. (1986), Hearn (1985), Li and Harmsen (1993), Mayer et al. (1998), and Niehoff et al. (1994). In the Mayer et al. (1998) study involving residue exposure, cages of leafcutter bees were placed in fields after applications of 0.001, 0.15, and 0.25 lb a.i./acre lambda-cyhalothrin. Adverse effects were not apparent at the two lower application rates; however, a decrease in bee populations was noted at the highest application rate. In the study by Hearn (1985), honeybees were subject to direct spray at application rates of 0.0075 and 0.015 lb a.i./acre with resulting mortality rates of about 50 and 90%, respectively. In post-spray observations, Hearn (1985) noted a decrease in the number of foraging bees on the treated alfalfa over a 2-day period, suggesting that bees will avoid treated vegetation. Similar observations were made with honeybees in the avoidance study by Gough et al. (1986). Li and Harmsen (1993) noted a significant increase in mite populations after applications of lambda-cyhalothrin at very low rates—i.e., 0.001 to 0.005 lb a.i./acre. While this effect would not typically be regarded as adverse, Li and Harmsen (1993) conjecture that the reason for the increase in mite population could be attributable to the repellent effect of lambda-cyhalothrin. The study by Nieheff et al. (1994) noted adverse effects in rove beetles and mixed effects in different species of spiders, also at very low application rates—0.0022 to 0089 lb a.i./acre. This study is discussed further in the risk characterization. Resistance is an important issue in the use of many pesticides, including pyrethroids. As discussed in Section 2, the Forest Service is considering the use of lambda-cyhalothrin as a replacement for or auxiliary treatment along with esfenvalerate. In terms of assessing the potential for insect resistance to insecticides, all pyrethrins and pyrethroids are classified as Type 3A insecticides (IRAC 2009). Insect resistance to lambda-cyhalothrin and esfenvalerate in field populations of insects is quantified in three studies: Ahmad and Arif (2009), Atkinson et al. (1991), and Yu and Nguyen (1992). In the study by Yu and Nguyen (1992) on resistance in field populations of the diamondback moth, resistance factors of almost 11,000 were noted for lambda-cyhalothrin, which is substantially greater than the resistance factor of about 2300 for esfenvalerate. Ahmad and Arif (2009) report a more modest difference in the maximum resistance factor in field populations of the spotted bollworm in Pakistan—i.e., a factor of 286 for lambda-cyhalothrin and 108 for esfenvalerate. Atkinson et al. (1991) also report similar resistance factors for cyhalothrin (not lambda-cyhalothrin) and esfenvalerate—i.e., 40.6 for cyhalothrin and 29.4 for esfenvalerate—in field populations of the German cockroach in Florida. While
58

1 2 3 4 5
6 7 8 9
10 11 12 13
14 15 16 17 18 19 20 21 22 23 24
25
26
27 28 29 30 31 32 33 34 35 36 37 38 39 40 41
only the study by Atkinson et al. (1991) was conducted in the United States, all three studies suggest greater resistance to cyhalothrin or lambda-cyhalothrin than to esfenvalerate. Hansen (2003) report that pollen beetles in Denmark appear to be resistant to both lambda-cyhalothrin and esfenvalerate; however, differences in the magnitude of resistance to the two pesticides cannot be determined.
4.1.2.5. Terrestrial Plants (Macrophytes) Apparently, there are no studies concerning the toxicity of lambda-cyhalothrin to terrestrial plants, and terrestrial plants are not addressed in the ecological risk assessments conducted by U.S. EPA/OPP on lambda-cyhalothrin (U.S. EPA/EFED 1987c,d; 1988, 1994a,b). While the lack of information does not lead to a presumption of safety, lambda-cyhalothrin has been used for many years to control insect pests on vegetation. It seems reasonable to assume that adverse effects on plants would have been recognized and reported if lambda-cyhalothrin were highly phytotoxic.
4.1.2.6. Terrestrial Microorganisms There are two studies concerning the toxicity of lambda-cyhalothrin to terrestrial microorganisms: Cycon et al. (2006) and Latif et al. (2008). Cycon et al. (2006) assayed microbial activity in loam soils at lambda-cyhalothrin concentrations of 0.2, 1, or 20 ppm over a 28-day period. Lambda-cyhalothrin increased the numbers of soil bacteria up to Day 28 and fungi up to Day 14. At 20 ppm, lambda-cyhalothrin increased soil respiration and decreased the number of denitrifiers up to Day 14. The effect on denitrifiers was not significant by Day 28. Latif et al. (2008) also report an increase the in the population of soil microorganisms after exposure to lambda-cyhalothrin in soil over a 32-day period. The concentrations of lambda-cyhalothrin used in this study, however, are not clear.
4.1.3. Aquatic Organisms
4.1.3.1. Fish
4.1.3.1.1. Acute Toxicity Studies on the toxicity of lambda-cyhalothrin to fish are summarized in Appendix 3. Based on 96-hour LC50 values of 0.21 µg/L in bluegill sunfish and 0.24 µg/L in rainbow trout, U.S. EPA/EFED (1988) classifies lambda-cyhalothrin as very highly toxic to fish. This is the highest toxicity category used by the EPA for aquatic organisms, and it is used in designating chemicals with acute LC50 values of less than 0.1 mg/L or 100 µg/L (U.S. EPA/EFED 2001). Table 10 summarizes the acute toxicity values (LC50 values) in fish cited by U.S. EPA/EFED (1988) along with additional LC50 values from the open literature. These values are ranked in order of 96-hour LC50 values from Appendix 3 (Table 1). Based on the available data, the most sensitive species is the golden orfe, with an LC50 of 0.078 µg/L; the most tolerant species is channel catfish with an LC50 of 7.92 µg/L. Thus, the range of reported LC50 values varies by a factor of about 100 [7.92 µg/L ÷ 0.078 µg/L ≈ 102]
59

1 2 3 4 5 6 7 8 9
10 11 12 13 14 15 16 17 18 19 20 21 22 23 24 25 26 27 28 29 30 31 32 33 34 35 36 37 38 39 40 41 42 43 44 45 46
A plot of all of the 96-hour LC50 values in Table 10 is illustrated in Figure 6, along with toxicity data on aquatic invertebrates. In Figure 6, the x-axis is the LC50 value and the y-axis is the cumulative frequency of the LC50 value for each group of organisms. For example, there are a total of 14 LC50 values for fish. As noted above, the lowest value is an LC50 of 0.078 µg/L. The frequency is taken as 1-0.5/14 or 0.037. The second lowest LC50 value is 0.106 µg/L and this is assigned a frequency of 2-0.5/14 or 0.107. More generally, the ith toxicity value has a frequency of i-0.5/N, where N is the number of values in the set. Note that the x-axis is given on a logarithmic scale under the assumption that generally LC50 values in different groups of organisms will be log-normally distributed. A plot such as Figure 6 is sometimes referred to as a species sensitivity distribution (SSD). Species sensitivity distributions can be used quantitatively in risk assessments (e.g., Posthuma et al. 2002) as tools in probabilistic risk assessment. This technique is not currently used quantitatively in Forest Service risk assessments. Nonetheless, species sensitivity plots such as those presented in Figure 6 are useful for illustrating differences in sensitivity among different groups of organisms. In terms of practical significance to the current risk assessment, the study by Maund et al. (1998) is particularly important. Most acute toxicity studies in aquatic organisms are conducted using either pure natural water or reconstituted water. These test systems will have little if any organic carbon in the water. For many water soluble pesticides (e.g., most salts of weak-acid herbicides), this distinction makes very little difference in the toxicity of a compound. For highly lipophilic compounds such as lambda-cyhalothrin, however, binding to organic carbon either in water or sediment can have a substantial influence on the toxicity of the pesticide. Maund et al. (1998) conducted a separate bioassay in carp in which lambda-cyhalothrin was applied to either the water phase (i.e., a standard bioassay) or to sediment prior to the addition of water. The 96-hour LC50 value for carp was 4 µg/L in standard bioassay and 74 µg/L in the sediment assay. Thus, in terms of the nominal exposure concentration, sediment reduced the toxicity of lambda-cyhalothrin by a factor of about 20 [74 µg/L ÷ 4 µg/L ≈ 18.5]. As discussed further in Section 4.1.3.3, the importance of the binding of lambda-cyhalothrin to sediment or dissolved organic carbon is demonstrated in greater detail in studies on aquatic invertebrates. As noted in Section 2, lambda-cyhalothrin is a combination of two enantiomers (i.e., mirror image isomers). Xu et al. (2008) recently demonstrated that the -enantiomer is much more toxic than the +enantiomer to zerbrafish (Danio rerio). While not clearly stated by Xu et al. (2008), the more toxic -enantiomer appears to correspond to gamma-cyhalothrin. On the other hand, Wang et al. (2007) report very little difference in the toxicity of gamma-cyhalothrin and lambda-cyhalothrin to the zerbrafish. The reason for these discrepancies is not apparent. Nonetheless, the toxicity values assayed in the studies by Xu et al. (2008) and Wang et al. (2007) are above the most sensitive LC50 available for lambda-cyhalothrin—i.e., 0.078 µg/L for the golden orfe, as discussed above. Other studies specifically on lambda-cyhalothrin are focused on in vitro
60

1 2 3
4 5 6 7 8 9
10 11 12 13 14 15 16 17 18 19 20 21 22 23 24 25 26 27
28 29 30 31 32 33 34 35 36 37 38 39 40 41 42 43 44
biochemical changes in fish (e.g., Babiacuten and Tarazona 2005; Dogan 2006). These studies were also conducted at concentrations substantially higher than the lowest reported LC50 values (i.e., >2 mg/L).
4.1.3.1.2. Chronic Toxicity The two longer-term toxicity studies in fish include an early life-stage study in sheepshead minnow (Hill et al. 1985d) and a full life-cycle study in fathead minnows (Tapp et al. 1990). Both studies were submitted to U.S. EPA/OPP in support of the registration of lambda-cyhalothrin, and data evaluation records (DERs) are available for both studies. As summarized in Appendix 3 (Table 2), the early life-stage study in sheepshead minnow is relatively straightforward. The study is classified as Core by U.S. EPA/OPP (1988) with an NOEC of 0.25 µg/L and a LOEC of 0.38 µg/L, based on a decrease in body weight of the fry. The full life-cycle study by Tapp et al. (1990) indicates much lower toxicity values. The DER for this study reports an NOEC of 0.031 µg/L and an LOEC of 0.062 µg/L. The LOEC is based on an increase in body weight in male fish. While increased body weight is not typically viewed as an adverse effect, comments from U.S. EPA/EFED in the DER indicate that the increase in body weight at 0.062 µg/L was considered a hormetic response—i.e., an interference with normal growth. No decrease in weight, however, was noted at higher concentrations. Notwithstanding the arguable nature of 0.062 µg/L as a LOEC based on growth, a decrease in the total number of eggs produced (about 60% relative to the untreated control group) was also noted at the 0.062 µg/L concentration. While this effect was not considered statistically significant, it was viewed by the U.S. EPA/EFED as biologically significant. Based on the data presented in the DER (Tapp et al. 1990, p. 18), the classification of 0.062 µg/L as an LOEC appears reasonable. Subsequent summaries from EFED repeat the classifications of 0.031 µg/L as the chronic NOEC and 0.062 µg/L as the chronic LOEC (U.S. EPA/EFED 1994b).
4.1.3.1.3. Field and Mesocosm Studies In addition to the acute and chronic studies on fish, Appendix 3 (Table 3) also summarizes three field/microcosm studies. Two studies (Hamer et al. 1994; Lawler et al. 2003) involved applications of lambda-cyhalothrin to rice paddies. Hamer et al. (1994) summarizes the results of a field study conducted in the Philippines in which no adverse effects were noted in fish at lambda-cyhalothrin concentrations of about 12.5 µg/L. In a study conducted in California, Lawler et al. (2003) do not provide monitoring data on concentrations of lambda-cyhalothrin in water. They do, however, report an application rate of 5.8 g/ha, equivalent to 0.58 mg/m2. While the average depth of the water in the rice paddies is not specified, Lawler et al. (1994) make the following comment on another study: water depth was as low as 10 cm, about half the depth of our study. Assuming a water depth of about 20 cm (0.2 meters), the nominal concentration in the rice paddy immediately after treatment would be about 2.9 µg/L. Unlike the study by Hamer et al. (1994), Lawler et al. (2003) note substantial fish mortality and cite their results as … the 1st to document fish kills from lambda-cyhalothrin applied at label rates under field conditions (Lawler et al. 2003, p. 431). The reason for the discrepancies between these two studies is not apparent. As summarized in Table 10 and discussed
61
1 2 3 4 5 6 7 8 9
10 11 12
13 14 15 16 17 18 19 20 21 22 23 24 25 26 27 28 29 30 31 32 33 34 35 36
37
38 39 40 41 42 43
above, acute LC50 values for lambda-cyhalothrin in fish range from 0.078 to 7.92 µg/L. These LC50 values are consistent with the report of fish mortality in the study by Lawler et al. (2003). The study by Hill et al. (1994) involved mesocosms with peak concentrations of lambda-cyhalothrin in water ranging from about 0.09 to 0.1 µg/L. The treated mesocosms contained greater numbers of fish (bluegills and some minnows), relative to untreated mesocosms; however, the biomass of the fish was less (28-38%) than in control mesocosms. The authors suggest that the larger number of fish in the treated ponds may have resulted in increased competition for food. As noted below in Section 4.1.3.2 (amphibians), however, Hill et al. (1994) also noted increases in both the number and biomass of tadpoles.
4.1.3.2. Amphibians Compared with the information on fish, relatively little information is available on the toxicity of lambda-cyhalothrin to amphibians. Pan and Liang (1996) report a 48-hour LC50 of 4 µg/L in tadpoles. This publication is in Chinese and was not translated for the current Forest Service risk assessment. Based on English text used in Table 1 of this paper, tadpoles of the marsh frog Rana ridibunda were tested. Pauli et al. (2000), however, indicate that the species tested by Pan and Liang (1996) was the Indian rice frog (Rana limnocharis). In either case, a 48-hour LC50 of 4 µg/L is in the range of 96-hour LC50 values for tolerant species of fish (Table 10). Hill et al. (1994) report an increase in tadpole populations in mesocosms treated with lambda-cyhalothrin, relative to untreated mesocosms. As discussed in the previous subsection, a similar observation was made on the number of fish in the mesocosms. Unlike the case with fish, however, Hill et al. (1994) note an increase in both the number and biomass of tadpoles. While the information from Pan and Liang (1996) and Hill et al. (1994) does not include substantial detail, neither study suggests that amphibians are more sensitive than fish to lambda-cyhalothrin. Other studies on amphibians (Cassano et al. 2003; Chio and Soderlund 2006) are focused on mechanisms of action and do not provide information that has a substantial impact on the risk characterization. These studies are not otherwise detailed in this abbreviated risk assessment.
4.1.3.3. Aquatic Invertebrates
4.1.3.3.1. Acute Toxicity Studies on the toxicity of lambda-cyhalothrin to aquatic invertebrates are summarized in Appendix 4. Based on 48-hour LC50 values of 0.36 µg/L in Daphnia magna and 0.006-0.0093 µg/L in Gammarus pulex, U.S. EPA/EFED (1988) classifies lambda-cyhalothrin as very highly toxic to aquatic invertebrates.
62
1 2 3 4 5 6 7 8 9
10 11 12 13 14 15 16 17 18 19 20 21 22 23 24 25 26 27 28 29 30 31 32 33 34 35 36 37 38 39 40 41 42 43 44 45 46
The LC50 values in aquatic invertebrates cited by U.S. EPA/EFED (1988) along with additional LC50 values from the open literature are summarized in Table 11, which is a ranked order of 48-hour LC50 values from Appendix 4 (Table 1). Based on the available data, the most sensitive species is Hyalella azteca (a species of freshwater shrimp) with an LC50 of 0.0023 µg/L, and the most tolerant species is Crassostrea gigas (the Pacific oyster) with an LC50 of >590 µg/L. While the LC50 values for aquatic invertebrates summarized in Table 11 may be viewed as a continuum, it does appear that arthropods are more sensitive than other aquatic invertebrates such as mollusks and flatworms. The higher tolerance of mollusks, at least in acute toxicity studies, may be related to the ability of these organisms to retract into shells and thus decrease functional exposure to living tissue (Schroer et al. 2004). The basis for the apparent high tolerance of flatworms to lambda-cyhalothrin is not clear. Although Schroer et al. (2004) do not provide a detailed description of the bioassays in flatworms, it does not appear that these organisms were tested in a sediment-water system, which would be expected to reduce the apparent toxicity of lambda-cyhalothrin, based on nominal concentrations. The data from Table 11 are illustrated in Figure 6 by segregating the toxicity data by aquatic arthropods and non-arthropods. The average (geometric mean) LC50 value for arthropods is about 0.08 µg/L, below the corresponding mean LC50 value for fish (about 0.5 µg/L) by a factor of 6. As noted in Table 11, two of the toxicity values for non-arthropods are specified as greater than (>) values. In other words, the specified concentration caused less than 50% mortality. Thus, the mean value of 64 µg/L is an underestimate of the LC50 of lambda-cyhalothrin to non-arthropod species. Using 64 µg/L for comparison, the tolerance of non-arthropod aquatic invertebrates to lambda-cyhalothrin is greater than that in fish by a factor of about 130 [64 µg/L ÷ 0.5 µg/L ≈ 128.8] and greater than that in aquatic arthropods by a factor of about 800 [64 µg/L ÷ 0.08 µg/L ≈ 799.2]. As also illustrated in Figure 6, the slope of the distribution for aquatic arthropods is somewhat shallower than that for fish, suggesting a somewhat greater variability in sensitivities in aquatic arthropods, relative to fish. The differences are most pronounced at the low proportions—i.e., the most sensitive species. Empirically, the most sensitive species of aquatic arthropod—i.e., Hyalella azteca with an LC50 of 0.0023 µ/L—is more sensitive than the most sensitive species of fish—i.e., the golden orfe with an LC50 of 0.078 µ/L—by a factor of about 34. As noted in Section 4.1.3.1, some studies in fish suggest that the binding of lambda-cyhalothrin to sediment may reduce the toxicity of lambda-cyhalothrin, based on nominal concentrations. This effect is demonstrated in much greater detail in aquatic invertebrates. Smith and Lizotte (2007) assayed the apparent toxicity of lambda-cyhalothrin to Hyalella azteca and noted a relatively strong inverse relationship between nominal LC50 values and dissolved organic carbon. The data from Smith and Lizotte (2007) are summarized in Table 12 and illustrated in Figure 7. Smith and Lizotte (2007) report an r2 of 0.847 but do not give the p-value for the correlation. In the current Forest
63

Service risk assessment, the data are reanalyzed in EXCEL. The resulting r2 is about the same (r2=0.840) as that reported in Smith and Lizotte (2007) and the correlation is highly significant (p=0.000028). While some scatter is apparent, particularly in the range of about 11 mg DOC/L, the variability in the LC50 values is modest—i.e., about a factor of 4 [0.0111 µg/L ÷ 0.0028 µg/L]. Over the full range DOC values, the LC50 values span a factor of about 11 [0.0157 µg/L ÷ 0.0014 µg/L ≈ 11.21]. As summarized in Appendix 4 (Table 1), a similar dependence of the toxicity of lambda-cyhalothrin on DOC is demonstrated by Day (1991) using Daphnia magna. As also summarized in Appendix 4, Maund et al. (1998) demonstrate a greater than 100-fold decrease in lambda-cyhalothrin toxicity to Daphnia magna in sediment/water systems, as opposed to water only systems.
1 2 3 4 5 6 7 8 9
10 11 12 13 14 15 16 17 18 19 20 21 22 23 24 25 26
27 28 29 30 31 32 33 34 35 36 37 38 39 40 41 42 43 44 45
Other types of acute toxicity information on lambda-cyhalothrin are available but do not substantially impact the risk assessment. Heckmann et al. (2005) report behavioral changes (pre-copulatory) in Gammarus pulex; however, the concentrations associated with this effect are higher than the EC50 values in sensitive species of aquatic invertebrates. As with fish, some information is available on the relative toxicities of lambda-cyhalothrin (two enantiomers) and gamma-cyhalothrin (one enantiomer) to aquatic invertebrates. As would be expected, these studies indicate that gamma-cyhalothrin is about twice as toxic as lambda-cyhalothrin (Van Wijngaarden et al. 2009; Wang et al. 2007). Resistance to lambda-cyhalothrin was observed in one aquatic insect, Culex pipiens (Lawler et al. 2007); however, the magnitude of the resistance (i.e., a factor of 30) was much less than that observed in terrestrial insects (factors of up to 11,000 as discussed in Section 4.1.2.4.). Maund et al. (2001) conducted an analysis of concentration-time relationships in Hyalella azteca, noting that a log-log plot of LC50 values and exposure time is linear—i.e., the concentration-duration relationship follows Haber’s Law (SERA 2007a, Section 3.3.2).
4.1.3.3.2. Chronic Toxicity Information on the longer-term toxicity studies on lambda-cyhalothrin is summarized in Appendix 4 (Table 2). The reproduction studies involving the exposure of Daphnia magna to lambda-cyhalothrin include Barata et al. (2006), Hamer et al. (1985b), and U.S. EPA/EFED (1994a,b). Most standard reproduction studies in Daphnia magna are conducted over a 21-day period of exposure. The study by Barata et al. (2006), which is also summarized in Barata et al. (2007), is an abbreviated study conducted over a 10-day period of exposure. The NOEC from this study is 0.045µg/L. Apparently, at least two standard 21-day reproduction studies were submitted to the EPA in support of the registration of lambda-cyhalothrin. A DER is available for the early reproduction study by Hamer et al. (1985b). The DER for this study, however, does not provide a detailed discussion or tabular summaries of the data. Based on the discussion of this study in U.S. EPA/EFED (1988), the NOEC for reproduction, 0.0085 µg/L, is the most sensitive endpoint. The DER for this study cites numerous deficiencies and classifies the study as Invalid and scientifically unsound. Hand-written notes in the DER as well as the discussion of the study in U.S. EPA/EFED (1988) indicate that the study was upgraded to Supplemental. Apparently, a later study was submitted to the EPA, which is discussed very briefly in two summary risk assessments conducted by the EPA (U.S. EPA/EFED 1994a,b). The study reports a reproductive NOEC of 0.00198 µg/L with a corresponding
64
1 2 3 4 5 6 7 8 9
10 11 12 13 14
15 16 17 18 19 20 21 22 23 24 25 26 27 28 29 30 31 32 33 34 35 36 37 38 39 40 41 42 43 44 45
LOEC of 0.0035 µg/L. In a publication on a probabilistic risk assessment of lambda-cyhalothrin, Maund et al. (1998) report a 21-day reproduction NOEC of 0.002 µg/L but do not provide a reference for the reported NOEC. While somewhat speculative, it appears that Maund et al. (1998) are referring to and rounding the NOEC of 0.00198 µg/L reported in U.S. EPA/EFED (1994a,b). There is one chronic reproduction study involving the exposure of mysid shrimp to lambda-cyhalothrin. This study is summarized in U.S. EPA/EFED (1988); in addition, there is a cleared review for this study (Thompson 1987). While some concerns with this study are discussed in the cleared review, the study is well-described in the cleared review and is classified as Supplemental. The NOEC for reproduction is estimated at 0.00022 µg/L, lower than the reproduction NOEC in Daphnia (0.002 µg/L) by a factor of 10. The NOEC for survival was 0.0017 µg/L, which is very similar to the reproductive NOEC in Daphnia.
4.1.3.3.3. Mesocosm Studies Several mesocosm studies address the effects of lambda-cyhalothrin on aquatic invertebrates (Appendix 4, Table 3). Mesocosm studies basically involve exposures to relatively small systems of organisms and focus primarily on detecting functional changes in the system rather than impacts on the most sensitive species. The design and interpretation of mesocosm studies is complex (e.g., Graney et al. 1994). In the context of risk assessment, mesocosm studies are intended to provide a more refined or realistic understanding of the environmental impact of exposure, particularly in terms of recovery. While it is beyond the scope of the current abbreviated risk assessment of lambda-cyhalothrin to review and critique each of the available mesocosm studies in detail, the interpretation of the studies is reasonably consistent. Most studies that assay impacts based on concentrations of lambda-cyhalothrin in water indicate transient LOEC values ranging from 0.001 to 0.1 µg/L (Hill et al. 1994; Heckmann and Friberg 2005; Lauridsen and Friberg 2005; Roessink et al. 2005; Schroer et al. 2004; Van Wijngaarden et al. 2006). This range of LOEC values spans a factor of 100, less than the variability in acute EC50 values for aquatic arthropods—i.e., a factor of over 1400 (Table 11). In addition, the range of LOEC values is consistent with the magnitude of the 48-hour LC50 values for aquatic arthropods—i.e., 0.0023 µg/L for the most sensitive species and a mean LC50 in aquatic arthropods of 0.08 µg/L, as discussed in Section 4.1.3.3.1. Remarkably, most of the mesocosm studies report substantial decreases in the concentration of lambda-cyhalothrin in the water column over time. This decrease in lambda-cyhalothrin concentrations is to be expected based on the relatively short half-life of lambda-cyhalothrin in water (Section 3.2.3.4.3) as well as the impact of aquatic macrophytes on the persistence of lambda-cyhalothrin in water (Section 3.2.3.4.6). The decrease in lambda-cyhalothrin in water is also likely to be a factor in the reports of recovery of mesocosms over time. While the basic conclusions from the mesocosm studies are reasonably concordant with laboratory bioassays, the study results are subject to interpretation. For example,
65

1 2 3 4 5 6 7 8 9
10 11 12 13 14 15
16 17 18 19 20 21 22 23 24 25 26 27 28 29 30 31
Heckmann and Friberg (2005) suggest that 0.5-1.0 µg/L could be regarded as a community NOEC, because changes in community structure were noted only at concentrations of 5 and 10 µg/L. This argument has merit in that the ecological role of some sensitive species may be filled by more tolerant species. Thus, the overall structure or integrity of the ecosystem is not impaired. On the other hand, it may be argued that any impact of a pesticide, transient or otherwise, on any nontarget species is an unintended and adverse effect. These two positions are not contradictory; they simply reflect different views of the same set of observations. As with all Forest Service risk assessments, the quantitative risk characterization for aquatic invertebrates is based on ranges of toxicity values for both sensitive and tolerant species (Section 4.3.3.3). Nonetheless, observations from mesocosm studies provide useful information on the plausible consequence of the contamination of water with lambda-cyhalothrin, and the mesocosm studies are considered further in the risk characterization for aquatic invertebrates (Section 4.4.3.3).
4.1.3.4. Aquatic Plants The available information suggests that aquatic plants, macrophytes and algae, are unaffected by lambda-cyhalothrin at concentrations that exceed those expected after normal uses of lambda-cyhalothrin. As discussed in Section 3.2.3.4.6, several studies are available indicating that aquatic macrophytes play a role in rapidly absorbing and metabolizing lambda-cyhalothrin. None of these studies reports adverse effects on aquatic macrophytes associated with exposure to lambda-cyhalothrin. In addition, several of the mesocosm studies on aquatic invertebrates (Appendix 4, Table 3) specifically note the lack of adverse effects on aquatic plants at concentrations of up to 0.25 µg/L (e.g., Van Wijngaarden et al. 2006). Finally, Maund et al. (1998) summarize a bioassay in Selenastrum capricornutum indicating an EC50 for growth inhibition of >1,000 µg/L. This toxicity value appears to be the maximum nominal concentration from the study by Thompson and Williams (1985a) submitted to the U.S. EPA in support of the registration of lambda-cyhalothrin in which an EC50 of >310 µg/L (based on measured concentrations) is reported for growth inhibition.
66
4.2. EXPOSURE ASSESSMENT 1
2 3 4 5 6 7 8 9
10 11
12
13 14 15 16 17 18 19 20 21 22 23 24 25 26 27 28 29 30 31
32 33 34 35 36 37 38 39 40 41
4.2.1. Overview As in the human health risk assessment, all exposure scenarios for nontarget species are detailed in the EXCEL workbooks that accompany this risk assessment—i.e., Attachment 1 (Chico site) and Attachment 2 (Foresthill Site)—and all exposures are based on the assumption of six applications conducted at 2-week intervals with an application rate of 0.08 lb a.i./acre. The exposure estimates for the various groups of organisms considered in the risk assessments are summarized in the EXCEL workbooks: terrestrial vertebrates (G01), honeybees (G02b), aquatic organisms (G03), herbivorous or predatory insects (G08a), and soil invertebrates (G09a-c). Details of the exposure assessments are discussed in the following subsections.
4.2.2. Mammals and Birds
4.2.2.1. Direct Spray The unintentional direct spray of wildlife during broadcast applications of a pesticide is a plausible exposure scenario. This scenario is similar to the accidental (and less plausible) exposure scenarios for the general public discussed in Section 3.2.3.2. In a scenario involving exposure to direct spray, the amount of pesticide absorbed depends on the application rate, the surface area of the organism, and the rate of absorption. For this risk assessment, two direct spray or broadcast exposure assessments are conducted (Worksheets F01, F02). The first spray scenario (detailed in Worksheet F01) assumes that a mammal weighing 20 g is sprayed directly over one half of the body surface as the chemical is being applied. This exposure assessment further assumes first-order dermal absorption. In an effort to encompass the increased exposure due to grooming, the second exposure assessment (detailed in Worksheet F02) assumes complete absorption over day 1 of exposure. There are no exposure assessments for the direct spray of large mammals, principally because allometric relationships dictate that the amount of a compound to which large mammals will be exposed, based on body weight, as a result of direct spray is less than the amount to which smaller mammals will be exposed, based on body weight.
4.2.2.2. Dermal Contact with Contaminated Vegetation As discussed in the human health risk assessment (Section 3.2.3.3), one approach for estimating the potential significance of dermal contact with contaminated vegetation is to assume a relationship between the application rate and dislodgeable foliar residue. Unlike the human health risk assessment, in which transfer rates for humans are available, there are no transfer rates available for wildlife species. Wildlife species are more likely than humans to spend long periods of time in contact with contaminated vegetation. It is reasonable to assume that for prolonged exposures, equilibrium may be reached between pesticide levels on the skin, rates of dermal absorption, and pesticide levels on contaminated vegetation. Since, data regarding the kinetics of this process in
67

1 2
3 4 5 6 7 8 9
10 11 12 13 14 15 16 17 18 19 20 21 22 23 24 25 26 27 28 29
30 31 32 33 34 35 36 37 38 39 40 41 42 43 44
birds and mammals are not available, a quantitative assessment for this exposure scenario cannot be made in the ecological risk assessment.
4.2.2.3. Ingestion of Contaminated Vegetation or Prey Separate exposure assessments are developed for acute and chronic exposure scenarios involving a small mammal (Worksheets F03a, F03b, F04a and F04b), a large mammal (Worksheets F10, F11a, and F11b), and large birds (Worksheets F12, F13a, and F13b). Similarly, the consumption of contaminated insects is modeled for a small bird (Worksheet 14a) and a small mammal (Worksheet 14b). As detailed in the exposure assessment for human health (Section 3.2.3.3), the empirical relationships based on those recommended by Fletcher et al. (1994) are used to estimate residues in contaminated insects (Worksheets F14a and F14b). A similar set of scenarios is provided for the consumption of small mammals by either a predatory mammal (Worksheet 16a) or a predatory bird (Worksheet 16a). In addition to the consumption of contaminated vegetation, insects, and other terrestrial prey, exposure pathways for lambda-cyhalothrin may be associated with ambient water and fish. Thus, a separate scenario is developed for the consumption of contaminated fish by a predatory bird, involving acute exposure (Worksheet F08) and chronic exposure (Worksheet F09). As discussed in Section 3.2.3.6, the exposure assessment for the general public at the Chico site is assumed to involve the consumption of blackberries that grow along the banks of Comanche Creek. The blackberry bushes are 50 feet from the nearest location where applications of lambda-cyhalothrin will be made; accordingly, pesticide drift rather than direct spray is considered. Since the consumption of blackberries may also be a plausible scenario for wildlife, the possibility that some species of wildlife might consume contaminated vegetation at or very close to the application site cannot be excluded. Consequently, in the ecological risk assessment, the direct spray of vegetation is considered for both the Chico and Foresthill sites. This is the standard and conservative assumption used in most Forest Service risk assessments.
4.2.2.4. Ingestion of Contaminated Water The methods for estimating lambda-cyhalothrin concentrations in water are identical to those used in the human health risk assessment (Section 3.2.3.4.6). The only major differences in the estimates of exposure involve the weight of the animal and the amount of water consumption. These differences are documented in the worksheets for the consumption of contaminated water (F05, F06, and F07). Estimates of the ranges of water consumption by nontarget mammals and birds are not available, as they are for humans. Thus, for the acute exposure scenario, the only factors affecting the estimation of the ingested dose are the field dilution rates (i.e., the chemical concentration in the spilled solution) and the amount of solution spilled. In the exposure scenario involving ponds or streams contaminated by runoff or percolation, the factors affecting the variability of exposure levels are the water contamination rates (Section 3.2.3.4.2) and the application rate.
68

1 2 3 4 5
6
7 8 9
10 11 12 13 14 15 16 17 18 19 20 21 22 23 24 25 26 27 28 29 30 31 32 33 34 35 36 37 38 39 40 41 42 43 44 45
As with the human health risk assessment, the estimated water concentrations of lambda-cyhalothrin are different for the Chico and Foresthill sites (Table 6). The site-specific considerations regarding the plausibility of exposure during application periods—i.e., when neither creek at the Chico and Foresthill sites will be flowing—are identical to those discussed in the human health risk assessment (Section 3.2.3.4.3.2).
4.2.3. Terrestrial Invertebrates
4.2.3.1. Direct Spray and Drift Risks to terrestrial invertebrates following the broadcast application of a pesticide are typically characterized in Forest Service risk assessments as direct deposition on the insect at the nominal application rate. This scenario is not applicable to the Foresthill site. As discussed in Section 2.3.2, applications at the Foresthill site involve high-volume, high-pressure directed sprays of individual-trees. While it is possible that individual insects might be directly sprayed, the amount deposited on the insect would not correspond directly to the nominal application rate in units of lb a.i./acre. Thus, this scenario is not included in the workbook for the Foresthill site (Attachment 2), and risks to insects following direct spray are discussed qualitatively in the risk characterization (Section 4.4.2.3). This exposure scenario may also have limited applicability at the Chico site. As noted in Section 2.3.1, applications at the Chico site involve airblast applications. During application, the most likely scenario involves an insect flying through the cloud of lambda-cyhalothrin as it is being applied. While this scenario does not involve the same type of exposure as a typical broadcast application, downwind exposures associated with drift may approximate exposures that might occur during broadcast applications. Consequently, this exposure scenario is included in the workbook for the Chico site (Attachment 1), and the limitations regarding this exposure assessment for the Chico site are discussed the risk characterization (Section 4.4.2.3). The target species for this exposure scenario is the honeybee, and the exposure is modeled as a simple physical process based on the application rate and surface area of the bee. The surface area of the honeybee (1.42 cm2) is based on the algorithms suggested by Humphrey and Dykes (2008) for a bee with a body length of 1.44 cm. Because this scenario involves acute exposure, which can only occur during or immediately after application, the level of exposure will be the same, regardless of single or multiple applications. Accordingly, only a single application is considered in Worksheet G02b. The amount of lambda-cyhalothrin deposited on a bee during or shortly after application depends on how close the bee is to the application site as well as foliar interception of the spray prior to deposition on the bee. In addition to drift, foliar interception of applied lambda-cyhalothrin is a factor in the exposure assessment for honeybees. The impact of foliar interception will vary depending on the nature of the canopy above the bee. For example, in studies investigating the deposition rate of diflubenzuron in various forest canopies, Wimmer et al. (1992) noted that deposition in the lower canopy, relative to the upper canopy, generally ranged from about 10% (90% foliar interception in the upper
69

1 2
3 4 5 6 7 8 9
10 11 12 13 14 15 16 17 18 19 20 21 22 23 24 25 26 27 28 29 30 31 32 33 34 35 36 37 38 39 40 41 42 43 44
canopy) to 90% (10% foliar inception by the upper canopy). In Worksheet G02b, foliar interception rates of 0% (no interception), 50%, and 90% are used.
4.2.3.2. Ingestion of Contaminated Vegetation or Prey Like terrestrial mammals and birds, terrestrial invertebrates may be exposed to lambda-cyhalothrin through the consumption of contaminated vegetation or contaminated prey. For foliar applications, estimates of residues on contaminated vegetation or prey are based on estimated residue rates (i.e., mg/kg residues per lb a.i. applied) from Fletcher et al. (1994), as discussed in Section 3.2.3.6 of the human health risk assessment. As specified in Table 8, the residue rates are estimated for four groups of food items. An estimate of food consumption is necessary to estimate a dose level for a foraging herbivorous insect. Insect food consumption varies greatly, depending on the caloric requirements in a given life stage or activity of the insect and the caloric value of the food to be consumed. The derivation of consumption values for specific species, life stages, activities, and food items is beyond the scope of the current analysis. Nevertheless, general food consumption values, based on estimated food consumption per unit body weight, are available. Reichle et al. (1973) studied the food consumption patterns of insect herbivores in a forest canopy and estimated that insect herbivores may consume vegetation at a rate of about 0.6 of their body weight per day (Reichle et al. 1973, pp. 1082 to 1083). Higher values (i.e., 1.28-2.22 in terms of fresh weight) are provided by Waldbauer (1968) for the consumption of various types of vegetation by the tobacco hornworm (Waldbauer 1968, Table II, p. 247). The current risk assessment uses food consumption factors of 1.3 (0.6 to 2.2) kg food /kg bw. The lower bound of 0.6 is taken from Reichle et al. (1973), and the central estimate and upper bound are taken from the range of values provided by Waldbauer (1968). Details concerning estimated exposure levels for the consumption of contaminated vegetation by herbivorous insects are provided in Worksheets G07a, G07b, G07c, and G07d. Some of the estimated doses in Worksheets G07a-d may overestimate the actual amount of lambda-cyhalothrin that an insect might ingest, based on the toxicity of lambda-cyhalothrin. As discussed further in Section 4.4.2.3, some of the dose estimates in these worksheets lead to high hazard quotients (i.e., the ratio of the estimated dose to the acute NOEC). As the insect consumes contaminated vegetation, it may become intoxicated (sicken), resulting in a decreased rate of food consumption. A decrease in food consumption during a dietary bioassay is an extremely common occurrence in mammalian toxicity studies. Unlike the direct spray and drift scenarios discussed in the previous subsection, the exposure scenarios for the consumption of contaminated vegetation are included for both the Chico site (Attachment 1) and the Foresthill site (Attachment 2). While the types of applications differ at the two sites, both can be meaningfully described in terms of lb a.i./acre. For both sites, however, the applications are directed foliar rather than
70

1 2 3
4 5 6 7 8 9
10 11 12 13 14 15 16 17 18 19 20 21 22 23 24 25
26 27 28 29 30 31 32 33 34 35
36 37 38 39 40 41 42 43
broadcast foliar. Thus, insects consuming the treated vegetation are likely to be subject to higher exposures, relative to insects consuming adjacent but untreated vegetation.
4.2.3.3. Contact with Contaminated Soil The Gleams-Driver simulations discussed in Section 3.2.3.4.3 provide estimated soil concentrations of pesticides. These estimates are given in Table 13 for the Chico and Foresthill sites. The estimated peak soil concentrations are essentially identical at both sites, ranging from about 0.05 to 0.6 mg/kg soil, which is to be expected because both sites reflect the same application rate to similar soils. The Gleams-Driver simulations are set up to give average soil concentrations in the top 12 inches of soil as well as average concentrations in the entire root zone. While this can be modified, these soil depths are the default method used in Gleams-Driver simulations and were not modified prior to simulations. As indicated in Table 13, however, the simulations at both sites indicated that the maximum penetration of lambda-cyhalothrin into the soil column is only 4 inches. This shallow penetration reflects the high Kow for lambda-cyhalothrin, 180,000 g/ml. Consequently, the soil concentrations given by Gleams-Driver for the top 12 inches of the soil column were adjusted upward by a factor of 3 to reflect the concentrations in the top 4 inches of the soil column. The workbooks for both the Chico and Foresthill sites include three custom worksheets that summarize the soil exposures for earthworms (G09a), other soil invertebrates (G09b), and soil microorganisms (G09c). This approach is taken because the available toxicity studies provide information on both earthworms (relatively tolerant species), other more sensitive species of soil invertebrates (Section 4.1.2.4), and soil microorganisms (Section 4.1.2.6).
4.2.4. Terrestrial Plants A relatively standard set of exposure assessments for terrestrial plants is developed in Forest Service risk assessments on herbicides, including scenarios for direct spray and spray drift, off-site transport of the pesticide by runoff, and pesticide loss from the treated site by wind erosion of soil. As discussed in Section 4.1.2.5, no information is available on the toxicity of lambda-cyhalothrin to terrestrial plants. Given the use of lambda-cyhalothrin—i.e., an insecticide designed to protect plants from insect damage—there is no basis for asserting that lambda-cyhalothrin is likely to be phytotoxic. Hence, the standard exposure scenarios for terrestrial plants are not considered in this risk assessment.
4.2.5. Aquatic Organisms An assessment of the effects of lambda-cyhalothrin on aquatic organisms is based on estimated water concentrations identical to those used in the human health risk assessment. These values are summarized in Table 6 and discussed in Section 3.2.3.4.6. As discussed in Section 4.1.3 (hazard identification for aquatic organisms), lambda-cyhalothrin will bind to both sediment and dissolved organic carbon, which will reduce the apparent toxicity of lambda-cyhalothrin when expressed in units of nominal
71

1 2 3 4 5 6 7 8 9
10 11 12 13 14 15 16 17 18 19
concentration. While some of the toxicity data for fish and aquatic invertebrates can be used to quantify the effects of sediment binding and binding to dissolved organic carbon on the toxicity lambda-cyhalothrin to aquatic organisms, these effects are applicable to the specific conditions of each experiment. In addition, most of the available toxicity data on lambda-cyhalothrin do not specify the levels of dissolved organic carbon; however, the levels are presumed to be low. Consequently, as discussed in Section 3.2.3.4.3, Gleams-Driver was modified to consider sediment binding in simulations of streams. Thus, the water concentrations given in Table 6 reflect estimates of lambda-cyhalothrin in the water column. Similarly, the toxicity values for lambda-cyhalothrin discussed in Section 4.3.3 (dose-response assessment for aquatic organisms) are presumed to reflect concentrations of lambda-cyhalothrin in the water column. For the most part, this presumption is likely to be correct. All toxicity values taken from studies used by U.S. EPA/OPP are based on concentrations of lambda-cyhalothrin measured in the water column. The studies from the open literature used in the dose-response assessment are selected because they provide lower or more conservative estimates of toxicity values. Thus, the exposure assessment and dose-response assessment are presumably based on comparable values—i.e., concentrations of lambda-cyhalothrin in the water column.
72
4.3. DOSE-RESPONSE ASSESSMENT 1
2 3 4 5 6 7 8 9
10 11 12 13 14 15 16 17 18 19 20 21 22 23 24 25 26 27 28 29 30 31 32 33 34 35 36 37 38 39 40 41 42 43 44
4.3.1. Overview Table 14 summarizes the toxicity values used in this risk assessment. The derivation of each of these values is discussed in the following subsections. Available toxicity data support separate dose-response assessments in six groups of organisms: canids, other terrestrial mammals, birds, terrestrial invertebrates, fish, and aquatic invertebrates. The dose-response assessment for terrestrial invertebrates is elaborated to include separate toxicity values for oral and contact toxicity as well as separate toxicity values for different soil invertebrates. Different units of exposure may be used for different groups of organisms, depending on the nature of exposure and the way in which the toxicity data are expressed. When possible, a range of toxicity values, based on the most sensitive and most tolerant species within a given group of organisms, is provided. Lambda-cyhalothrin is highly toxic to insects, particularly in terms of acute contact toxicity for which the estimated NOEC is 0.0065 mg/kg bw. Lambda-cyhalothrin, however, appears to be much less toxic to insects by the oral route of exposure, and the estimated acute oral NOEC for lambda-cyhalothrin in terrestrial insects (0.4 mg/kg bw) is only modestly lower than the NOEC in canids (0.5 mg/kg bw). The acute NOECs for non-canid mammals and birds are much higher—i.e., 10 and 150 mg/kg bw, respectively. Toxicity values for soil invertebrates are expressed in units of ppm of lambda-cyhalothrin in soil and are not comparable to those for other groups of terrestrial organisms. Earthworms appear to be relatively tolerant to lambda-cyhalothrin, with acute NOEC values ranging from 10 to about 60 ppm. Other soil invertebrates, however, appear to be much more sensitive to lambda-cyhalothrin. Longer-term NOECs for earthworms range from 3.2 to 10 ppm, and longer-term NOECs for soil microorganisms range from 1 to 20 ppm. Longer-term toxicity values for vertebrates can be derived for canids, other terrestrial mammals, and birds. As with acute exposures, canids appear to be the most sensitive terrestrial vertebrate with a chronic NOEL of 0.1 mg/kg bw/day. Unlike acute exposures, the toxicity value for birds (0.85 mg/kg bw/day) is somewhat lower than the toxicity value for non-canid mammals (1.5 mg/kg bw/day). Aquatic toxicity values are derived for sensitive and tolerant fish and aquatic invertebrates. For fish, separate acute toxicity values (0.000004-0.0004 mg/L) and longer-term toxicity values (0.0000031-0.00031 mg/L) are derived, although the differences between the acute and chronic toxicity values are small. For aquatic invertebrates, the available acute toxicity data do not support the explicit derivation of acute toxicity values, and chronic toxicity values (0.0000002-0.00017 mg/L) are used to characterize risks associated with both acute and longer-term exposures. These values encompass sensitivities in aquatic arthropods. Other aquatic invertebrates appear to be less sensitive than fish or aquatic arthropods to lambda-cyhalothrin.
73

4.3.2. Toxicity to Terrestrial Organisms 1
2 3 4 5 6 7 8 9
10 11 12 13 14 15 16 17 18 19 20 21 22 23 24 25 26 27 28 29 30
31 32 33 34 35 36 37 38 39 40 41 42 43 44
4.3.2.1. Mammals Forest Service risk assessments typically base the dose-response assessment for mammalian wildlife on the same studies used in the dose-response assessment for human health effects. As discussed in Section 3.3, the EPA bases the acute and chronic RfDs on a chronic study in dogs in which the short-term NOAEL was 0.5 mg/kg bw and the longer-term NOAEL was 0.1 mg/kg bw/day. Both NOAELs are based on signs of neurotoxicity observed at higher doses—i.e., 3.5 mg/kg bw for short-term exposures and 0.5 mg/kg bw/day for longer-term exposures. For the ecological risk assessment, these acute and chronic NOAELs are used to characterize risks in canids. As noted in Section 4.1.2.1, the basis for the increased sensitivity of canids is not clear. The only available toxicity study involving dogs exposed to lambda-cyhalothrin is the chronic study used to the derived the RfDs. Data on other mammals are limited to standard toxicity studies in smaller mammals—i.e., mice, rats, and rabbits. These studies suggest that non-canid mammals are more tolerant than dogs to lambda-cyhalothrin. Developmental studies are often used to derive acute RfDs. These studies are conducted over relatively brief periods of exposure and can be used to define a NOAEL for acute exposure. The lowest developmental NOAEL is 10 mg/kg bw/day from a developmental study in rats (Section 3.1.9.1) and is used to characterize risks associated with short-term exposures in non-canid mammals. The lowest chronic NOAEL for a non-canid species is 12.5 mg/kg bw/day from the cancer bioassay in rats (Section 3.1.10). This NOEAL, however, is above the LOAEL of 5 mg/kg bw/day from the multi-generation reproduction study in rats—i.e., decreased body weights in adults and offspring. As discussed in Section 3.1.9.2, conflicting summaries of the multigeneration reproduction studies are given in various EPA documents. The current Forest Service risk assessment relies on the most recent summary from the Health Effects Division (U.S. EPA/HED 2002, p. 6) of the Office of Pesticide Programs, and the NOAEL of 1.5 mg/kg bw/day is used as the longer-term NOAEL for non-canid mammals.
4.3.2.2. Birds There are eight studies concerning the toxicity of lambda-cyhalothrin to birds: one gavage LD50 study, four acute dietary studies and three reproduction studies. All studies were conducted on either mallards or quail and both the acute and chronic studies suggest that mallards are more sensitive than quail to lambda-cyhalothrin (Section 4.1.2.2). Typically, gavage LD50 values in birds are lower than LD50 values derived from acute dietary studies; however, that is not the case for lambda-cyhalothrin. As noted in Section 4.1.2.2, the acute gavage NOEL for lambda-cyhalothrin is 3950 mg/kg bw (Roberts and Fairley 1984). As also discussed in Section 4.1.2.2, the LC50 form the 5-day dietary study in mallards is 3948 ppm (Roberts et al. 1985b); however, food consumption data is not provided in the DER for the study. Based on typical food consumption values, mallards consume food in acute dietary studies at a proportion of approximately 0.3 of their body weight (SERA 2007c). Thus, the dietary LC50 of 3948 ppm corresponds to a
74

1 2 3 4 5 6 7 8 9
10 11 12 13 14 15 16 17 18 19 20 21 22 23 24 25 26 27 28 29 30 31
32
33 34 35 36 37 38 39 40 41 42 43 44 45
dose of about 1200 mg/kg bw/day, which is lower than the gavage NOEC of 3950 mg/kg bw by a factor of about 3. While somewhat unusual, this pattern is consistent with observations in mammals, suggesting that some vehicles may enhance the toxicity of pyrethroids (Section 3.1.4). For acute exposures, the acute dietary study in mallards is used for the dose-response assessment. The acute dietary NOEC in mallards from the study by Roberts et al. (1985b) is 505 ppm, corresponding to an estimated dose of about 151.5 mg/kg bw [505 ppm x 0.3 mg/kg bw per ppm]. This value is rounded to 150 mg/kg bw and used to characterize risks to birds associated with acute exposures. For chronic exposures, U.S. EPA/EFED (1988) uses the reproduction study in mallards by Roberts et al. (1982a). As discussed in Section 4.1.2.2, the NOEC for this study is 5 ppm with a corresponding LOEC of 50 ppm, based on decreased egg production. The DER for the later study by Beavers et al. (1989) classifies 30 ppm as an NOEC, noting that in both the 15 and 30 ppm dose levels there was an increase in food consumption that was not accompanied by an increase in body weight. Moreover, increased food consumption was not observed at a dietary concentration of 5 ppm. In the absence of any explanation for the increased food consumption without a corresponding increase in body weight, an argument might be made that the effect is associated with endocrine function. As discussed in Section 3.1.8, there is some basis for concern that lambda-cyhalothrin may affect normal endocrine function. While somewhat conservative, the current Forest Service risk assessment follows the same approach used by U.S. EPA/EFED (1988) and uses the dietary concentration of 5 ppm from Roberts et al. (1982a) to assess risks to birds associated with longer-term exposures. The DER for this study does provide information on both terminal body weight (an average of about 1.15 kg) and terminal food consumption (about 0.19 kg/day). Based on these data, a food consumption factor of 0.17 kg food/kg body weight/day is used, and the 5 ppm NOEC is converted to a daily dose of 0.85 mg/kg bw/day [5 mg/kg food x 0.17 kg food/kg bw].
4.3.2.3. Terrestrial Invertebrates
4.3.2.3.1. Contact Toxicity Value (for Direct Spray) The effects of direct spray or spray drift to terrestrial insects are typically assessed using the results of contact toxicity studies—i.e., studies in which the pesticide is applied by pipette to the insect. As summarized in Appendix 2 (Table 1), there are several contact bioassays on terrestrial invertebrates. In addition, a field study by Hearn (1985) concerning the effects of aerial sprays of lambda-cyhalothrin on honeybees is useful for assessing the applicability of the contact toxicity studies to the dose-response assessment. The four contact bioassays on honeybees yield LD50 estimates of 0.409 mg/kg bw (Gough et al. 1984), 0.731 mg/kg bw (Pilling and Jepson 1993), 1.1 mg/kg bw (Johnson et al. 2006), and 1.74 mg/kg bw (Mayer et al. 1998), for an average value of 0.995 mg/kg bw. In the field study by Hearn (1985), an application rate of 0.0075 lb a.i./acre is associated with mortality in about 50% of the honeybees. An application rate of 0.0075
75

lb a.i./acre is equivalent to about 0.0834 µg a.i./cm2. The surface area of the honeybee (1.42 cm2) is based on the algorithms suggested by Humphrey and Dykes (2008) for a bee with a body length of 1.44 cm. Typical body weights for worker bees range from 81 to 151 mg (Winston 1987, p. 54). Taking 116 mg as an average body weight, the average dose to the honeys in the field study by Hearn (1985) is about 0.00103 µg/mg bw [0.0834 µg a.i./cm2 x 1.44 cm ÷ 116 mg] or 1.03 mg/kg bw, which is very close to the 0.995 mg/kg bw average from the contact bioassays with lambda-cyhalothrin.
1 2 3 4 5 6 7 8 9
10 11 12 13 14 15 16 17 18
19 20 21 22 23 24 25 26 27 28 29 30 31 32 33 34 35 36 37 38 39 40 41 42 43
Honeybees, however, are not the most sensitive species of bees. In both laboratory and field studies, Mayer et al. (1998) noted that leafcutter bees appear to be the most sensitive species with a contact LD50 of 0.065 mg/kg bw, a factor of about 6 lower than the lowest reported LD50 in honeybees—i.e., 0.409 mg/kg bw from the study be Gough et al. (1984). Consequently, the dose-response assessment for contact toxicity is based on the LD50 of 0.065 mg/kg bw for leafcutter bees. Mayer et al. (1998) do not provide information on the NOEC or the slope of the dose-response curve. In the absence of this information, the LD50 of 0.065 mg/kg bw is divided by a factor of 10 to approximate an NOEC of 0.0065 mg/kg bw. This is analogous to the approach used by U.S. EPA/OPP for risk characterizations for terrestrial organisms based on LD50 (SERA 2007a, Table 4-2).
4.3.2.3.2. Oral Toxicity Value Gough et al. (1984), the only one oral toxicity honeybee study, reports an oral LD50 of 0.909 µg/bee and a contact LD50 of 0.038 µg/bee. Based on these data, the oral toxicity is less than the contact toxicity by a factor of about 24 [0.909 µg/bee ÷ 0.038 µg/bee ≈23.92]. An oral toxicity study is available concerning the exposure of the tobacco cutworm, a target species, to lambda-cyhalothrin (Abro et al. 1997). As discussed in Section 4.1.2.4, however, this study cannot be used to calculate a dose in units of either mg/kg food or mg/kg bw. Thus, Gough et al. (1984) is the only oral toxicity study that can be used directly in the dose-response assessment for the consumption of lambda-cyhalothrin by terrestrial invertebrates. As discussed in Section 4.1.2.4, the oral LD50 of 0.909 µg/bee is equivalent to about 9.7 mg/kg bw. The DER for the Gough et al. (1984) study includes dose-response data for the direct contact assay but not for the oral assay. As with the approach in the dose-response assessment for contact toxicity, an NOEC is estimated from the acute LD50. As indicated in Appendix 2 (Table 1), the NOEC based on mortality in the contact assay is about 0.01 µg/bee, a factor of about 4 below the LD50 of 0.038 µg/bee. Thus, a case can be made for dividing the oral 9.7 mg/kg bw by 4 to estimate the NOEC. Conversely, concern may be expressed that the honeybee may not be the most sensitive species. As discussed in the previous section, the leafcutter bee appears to be more sensitive than the honeybee by about a factor of 6. Thus, for the dose-response assessment for oral exposures of terrestrial insects, the oral LD50 of 9.7 mg/kg bw is divided by 4 to approximate an NOEC for the honeybee, and is also divided by a factor of 6 to reflect plausible concerns for other more sensitive species. Thus, the estimated NOEC is taken as 0.4 mg/kg bw [9.7 mg/kg bw ÷ 24].
76

4.3.2.3.3. Soil Toxicity Values 1 2 3 4 5 6 7 8 9
10 11 12 13 14 15 16 17 18 19 20 21 22 23 24 25 26 27 28 29 30 31
32 33 34 35
36 37 38 39 40 41 42 43 44
As discussed in Section 4.1.2.4 and summarized in Appendix 2 (Table 1), several toxicity studies are available on soil invertebrates. For the current Forest Service risk assessment, separate toxicity values are derived for earthworm as well as other soil invertebrates. This approach is taken because the available information suggests that earthworms are relatively tolerant to lambda-cyhalothrin, relative to other soil invertebrates. Information on the toxicity of lambda-cyhalothrin to earthworms is available from the open literature publications by Frampton et al. (2006) and Garcia et al. (2008). Both of studies involve a single species of earthworm, Eisenia fetida. The study by Garcia et al. (2008) is more detailed, providing information on acute and chronic toxicity as well as avoidance. The study by Frampton et al. (2006) provides only an acute LC50, which is somewhat higher than the highest LC50 reported by Garcia et al. (2008). Consequently, all toxicity values for earthworms are taken from Garcia et al. (2008). Because Garcia et al. (2008) used only a single species of earthworms, sensitivities among different species of earthworms cannot be assessed. Nonetheless, substantially different toxicity values are reported for different soils. Unlike the case with aquatic organism (Section 4.1.3), toxicity values for earthworms are not correlated strongly with the percent organic matter in the soil. While the reasons for variability in toxicity among the different soils is not clear, the range of acute and chronic NOECs reported by Garcia et al. (2008) are used—i.e., acute NOECs of 10 and 63.2 ppm and chronic NOECs of 3.2 and 10 ppm. For other soil invertebrates, the Ruan et al. (2009) study yields the lowest toxicity value of 0.002 ppm, based on a decrease in locomotion in soil nematodes. While the concentration of 0.002 ppm may be classified as a LOAEL, the effect on locomotion at this concentration appears to be slight. Thus, 0.002 ppm is used as the toxicity value for the most sensitive species of soil invertebrates. In the probabilistic assessment on the effects of lambda-cyhalothrin on soil invertebrates, Frampton et al. (2006) cite the isopod, Porcellionides pruinosus, as the most sensitive species with an LC50 of 0.5 ppm; however, Frampton et al. (2006) do not provide an NOEC value. Thus, the reported LC50 of 0.5 ppm is divided by 10 to approximate an NOEC of 0.05 ppm.
4.3.2.4. Terrestrial Plants (Macrophytes) No dose-response assessment is proposed for terrestrial plants. As discussed in Section 4.1.2.5, no toxicity studies were conducted on terrestrial plants, and there is no basis for asserting that lambda-cyhalothrin is likely to damage terrestrial plants.
4.3.2.5. Terrestrial Microorganisms Relatively little information is available on the effects of lambda-cyhalothrin on soil microorganisms but the available information suggests that adverse effects are not likely (Section 4.1.2.6). Both of the available studies (Cycon et al. 2006; Latif et al. 2008) involve incubation periods of at least 28 days, and the only effect that might be considered adverse is a transient decrease in the populations of denitrifiers observed at 20 ppm by Day 14 but not at Day 28 in the Cycon et al. (2006) study. Concentrations of 0.2 and 1 ppm were not associated with adverse effects in any soil microorganisms. Thus, as summarized in Table 14, 1 ppm is taken as the NOEC for potentially sensitive groups of
77

1 2
3
4
5 6 7 8 9
10 11 12 13 14 15 16 17 18 19 20 21 22 23 24 25 26 27 28 29 30 31
32 33 34 35 36 37 38 39 40 41 42 43
soil microorganisms (denitrifiers), and 20 ppm is taken as the NOEC for other soil microorganisms.
4.3.3. Aquatic Organisms
4.3.3.1. Fish
4.3.3.1.1. Acute Toxicity Values As summarized in Table 10, the acute LC50 values for fish range from 0.078 µg/L for golden orfe (Maund et al. 1998) to 7.92 µg/L for channel catfish (Kumar et al. 2007). The Forest Service, however, elects to use NOEC values rather than LC50 values as the basis for the dose-response assessment in aquatic organisms. In the absence of information on NOECs, LC50 values in fish are typically divided by factors of from 10 to 20 to approximate an NOEC. This approach is based on the EPA use of a level of concern of 0.05 for endangered aquatic species (SERA 2007a, Tables 4-2 and 4-3). The LC50 values cited above for the most sensitive and most tolerant species of fish are both taken from the open literature, and the publications do not provide NOECs. As detailed in Appendix 3, two sets of LC50 and corresponding NOEC values are available. The cleared review of Hill (1985d) in the sheepshead minnow provides a 96-hour LC50 of 0.81 µg/L with a corresponding NOEC of 0.29 µg/L for mortality and signs of toxicity, which is a factor of 2.7 below the LC50. The published study involving the exposure of channel catfish (Kumar et al. 2007) reports a 96-hour LC50 of 7.92 µg/L; moreover, mortality was not significantly different from controls at 2.5 µg/L, a factor of about 3.1 below the LC50. In a separate assay for sublethal effects, Kumar et al. (2007) report sublethal signs of toxicity, including hyperactivity and increased opercular activity at 0.8 µg/L, a factor of about 10 below the LC50. Because of the 10-fold difference between the LC50 and the LOEC of 0.8 µg/L in the Kumar et al. (2007) study, the LC50 values for tolerant and sensitive species of fish are divided by a factor of 20 to estimate NOECs of 0.004 µg/L [0.078 µg/L ÷ 20 = 0.0039 µg/L] and 0.4 µg/L [7.92 µg/L ÷ 20 = 0.396 µg/L]. As discussed in the following subsection, these estimated acute NOECs are modestly higher than the estimated chronic NOECs for sensitive and tolerant species of fish.
4.3.3.1.1. Chronic Toxicity Values As discussed in Section 4.1.3.1.2, only two longer-term studies are available, the early life-stage study in sheepshead minnow (Hill et al. 1985d) and a full life-cycle study in fathead minnows (Tapp et al. 1990). The 96-hour LC50 values for these two species are virtually identical: 0.81 µg/L for sheepshead minnow (Hill 1985d) and 0.70 µg/L for fathead minnow (Maund et al. 1998). Based on the most sensitive endpoints in chronic studies, however, these two species appear to differ substantially: an NOEC of 0.25 µg/L based on decreased embryo weight for sheepshead minnow and an NOEC of 0.031 µg/L based on F0 egg production as well as F1 embryo/larval survival for fathead minnows. As detailed in Appendix 3 (Table 2), the sheepshead minnow study involved only a 32-day exposure to egg and fry. The
78

1 2 3 4 5 6 7 8 9
10 11 12 13 14 15 16 17 18 19 20 21 22 23 24 25 26 27 28 29 30 31 32 33 34 35 36 37 38 39 40 41 42 43 44 45 46
fathead minnow life-cycle study, however, is analogous to a multigeneration reproduction study. For effects on the F0 hatching, the NOEC is 0.27 µg/L (very close to the NOEC for sheepshead), but the 28- and 56-day survival for F0 larvae is 0.062 µg/L, which is substantially below the 32-day NOEC of 0.25 µg/L in sheepshead minnow. Thus, the fathead minnow does appear to be more sensitive than the sheepshead minnow, based on reasonably comparable endpoints. When differing chronic toxicity values are available, Forest Service risk assessments often use the lowest NOEC for sensitive species and the higher NOEC for tolerant species. Thus, the chronic toxicity values could be based on the reported chronic NOEC for the sheepshead minnow (tolerant species) and the fathead minnow (sensitive species); however, this approach does not consider the broad range of acute LC50 values for other species of fish. As discussed in Section 4.3.3.1.1 and summarized in Table 10, the 96-hour LC50 values for fish range from 0.078 to 7.92 µg/L. Both the fathead minnow and sheepshead minnow appear to be near the midpoint of this range, assuming a log-normal distribution of tolerances. An alternative and more conservative approach to estimating chronic toxicity values could be based on differences in the acute toxicity of lambda-cyhalothrin to fish. The chronic toxicity values for sensitive species of fish are based on the ratio of the lowest LC50 to the LC50 for fathead minnows—i.e., a factor of about 0.1 [0.078 µg/L ÷ 0.7 µg/L ≈ 0.1114]. Thus, the chronic value for sensitive species of fish is taken as 0.0031 µg/L [0.031 µg/L x 0.1] or 0.0000031 mg/L. Similarly, chronic toxicity values for tolerant species of fish are based on the ratio of the highest LC50 to the LC50 for fathead minnows—i.e., a factor of about 10 [7.92 µg/L ÷ 0.7 µg/L ≈ 11.31]. This approach results in a chronic value of 0.31 µg/L [0.031 µg/L x 10] or 0.00031 mg/L for tolerant species of fish. The mesocosm studies (Appendix 3, Table 3) are not particularly useful for assessing the two alternative approaches discussed above. As discussed in Section 4.1.3.1.3, the field study by Lawler et al. (2003) was conducted over a relatively brief period of time and reports adverse effects on the survival of mosquito fish at an estimated concentration of about 8 µg/L. The mesocosm study by Hill et al. (1994) was conducted over a longer period of time with bluegills and minnows at concentrations ranging from less than 0.001 to 0.1 µg/L. While Hill et al. (1994) report a decrease in fish biomass relative to untreated control mesocosms, this effect was not concentration-related and might reflect a secondary effect on aquatic invertebrates rather than a direct effect on fish. Nonetheless, if 0.001 µg/L were taken as a LOEC based on reduced biomass in fish, this would support the chronic values based on the LC50 values for sensitive species of fish—i.e., the LC50 of 0.078 µg/L with the derived chronic toxicity value of 0.0031 µg/L. The chronic toxicity values derived from the acute LC50 ratios do more fully consider all of the available information. Consequently, the estimated chronic NOECs based on the LC50 approach are rounded to one significant figure: 0.003 µg/L for sensitive species of fish and 0.3 µg/L for tolerant species of fish. These values are included in Table 14 in units of mg/L and are used for assessing longer-term risks in fish.
79
4.3.3.2. Amphibians 1 2 3 4 5 6 7
8 9
10 11 12 13 14 15 16 17 18 19
20 21 22 23 24 25 26 27 28 29 30 31 32 33 34 35 36 37 38 39 40 41 42 43 44
Relatively little information is available on the toxicity of lambda-cyhalothrin to amphibians (Section 4.1.3.2). The available information suggests that the sensitivity of amphibians to lambda-cyhalothrin may be similar to that of relatively tolerant species of fish. Because of the very limited nature of the data supporting this observation, however, a formal dose-response assessment for amphibians is not developed. Risks to amphibians are assumed to be comparable to those for fish (Section 4.4.3.2).
4.3.3.3. Aquatic Invertebrates As discussed in Section 4.1.3.3.1 and illustrated in Figure 6, aquatic arthropods are much more sensitive to lambda-cyhalothrin than are other non-arthropod aquatic invertebrates. While the acute toxicity data on non-arthropod invertebrates are relatively scant, relative to the toxicity data on aquatic arthropods and fish, it appears that non-arthropod aquatic invertebrates are not only less sensitive than aquatic arthropods to lambda-cyhalothrin, but they are also substantially less sensitive than fish to lambda-cyhalothrin. Because of the substantial differences in sensitivity between arthropods and non-arthropod invertebrates as well as the variability in sensitivity within aquatic arthropods, the current risk assessment of lambda-cyhalothrin derives separate sets of toxicity values only for sensitive and tolerant aquatic arthropods as well as sensitive and tolerant aquatic non-arthropod invertebrates.
4.3.3.3.1. Aquatic Arthropods Most of the toxicity data on aquatic invertebrates involve 48-hour LC50 values. Similar to the situation with fish, most of the studies reporting LC50 values in aquatic invertebrates do not provide information on NOECs. As summarized in Table 11, the LC50 values for aquatic arthropods range from 0.0023 µg/L for Hyalella azteca) to 3.3 µg/L for an Ostracod, not otherwise identified, (Maund et al. 1998). Acute LC50 values are typically divided by a factor of from 10 to 20 to estimate acute NOECs. The rationale for this approach is discussed in the dose-response assessment for acute toxicity values for fish (Section 4.3.3.1.1). For lambda-cyhalothrin, the selection of the factor used to estimate the NOEC from the LC50 must consider the chronic toxicity values for aquatic arthropods. This consideration is necessary because the acute LC50 values divided by 20 yields estimated acute NOECs that are somewhat lower than the experimental chronic NOECs. For examples, the lowest chronic NOEC is 0.00022 µg/L for mysid shrimp (Thompson 1987). As indicated in Table 11, mysid shrimp are among the more sensitive species of aquatic arthropods with a 48-hour LC50 of 0.0041 µg/L. The ratio of this acute LC50 to the chronic NOEC is about 18.6 [0.0041 µg/L ÷ 0.00022 µg/L ≈ 18.6]. The only other chronic NOEC values for aquatic invertebrates are for Daphnia magna. Both the acute and chronic data on Daphnia magna are variable. As summarized in Table 11, the reported acute LC50 values range from 0.025 to 1.04 µg/L, spanning a factor of about 40. As summarized in Appendix 4 (Table 2), the chronic NOECs for reproduction range from 0.00198 µg/L (U.S. EPA/EFED 1994a,b) to 0.045 µg/L (Barata et al. 2006), spanning a factor of about 23. Considering all of the available acute and
80

chronic toxicity data on Daphnia magna, the average LC50 is about 0.33 µg/L, and the average reproductive NOEC is 0.0185 µg/L. The ratio of the average acute LC50 to the average chronic NOEC is about 17.8 [0.33 µg/L ÷ 0.0185 µg/L ≈ 17.84].
1 2 3 4 5 6 7 8 9
10 11 12 13 14 15 16 17 18 19 20 21 22 23 24 25 26 27 28 29 30 31 32 33
34 35 36 37 38 39 40 41 42 43 44
The relationship of acute LC50 values to chronic NOECs in both mysid shrimp and Daphnia magna supports a factor of about 20 for estimating an NOEC from an acute LC50. In both cases, however, the NOEC is a chronic NOEC for reproduction rather than an acute NOEC. It may be argued that the acute NOEC should be higher than the chronic NOEC. While this argument has intuitive merit, the acute toxicity data on lambda-cyhalothrin do not support the derivation of separate acute NOEC values. To the contrary, Heckmann et al. (2005) reports an EC10 for changes in pre-copulatory behavior at 0.04 µg/L but an LC50 of 5.96 µg/L—i.e., a difference of a factor of nearly 150—after very short-term exposures in Gammarus pulex. Because of the relationship of the acute LC50 values to the chronic NOECs for reproduction, the current Forest Service risk assessment derives only chronic NOECs, which are applied to both acute and chronic exposures. The chronic NOEC for sensitive species of aquatic arthropods is straightforward. Mysid shrimp are the most sensitive species, based on chronic toxicity and almost the most sensitive species based on acute toxicity. Thus, the mysid NOEC of 0.00022 µg/L (Thompson 1987) is rounded to 0.0002 µg/L (0.0000002 mg/L) and used to characterize risks to sensitive species of aquatic arthropods. The chronic NOEC for tolerant species of aquatic arthropods is somewhat more complex. As discussed above, the chronic NOECs for reproduction in Daphnia magna range from 0.00198 to 0.045 µg/L. Daphnia magna, however, is not the most tolerant species of aquatic arthropod. The relationship of the acute LC50 to the reproductive NOEC in both mysids and daphnids is consistent—i.e., about a factor of 20 below the acute LC50. Thus, for tolerant species, the highest acute LC50 of 3.3 µg/L for seed shrimp (Ostracoda) (Maund et al. 1998) is divided by a factor of 20, and the estimated chronic reproductive NOEC is 0.165 µg/L. This value is rounded to 0.00017 mg/L in Table 14 and used to characterize risks associated with longer-term exposures in tolerant species of aquatic arthropods.
4.3.3.3.2. Other Aquatic Invertebrates Very little information is available on the toxicity of lambda-cyhalothrin to non-arthropod aquatic invertebrates. As summarized in Appendix 4 (Table 1), Schroer et al. (2004) conducted bioassays on two species of snails and one species of flatworm. LC50 values could not be determined in any of these species over the range of test concentrations. The lowest reported effect level is 8.9 µg/L. At this concentration, operculum closing was noted in one species of snail (Bithynia tentaculata). Over concentrations ranging from 0.226 to about 31 µg/L, no concentration-response relationships were noted in flatworms. In a bioassay on the Pacific oyster, the LC50 is reported as >590 µg/L (Giddings et al. 2009).
81

1 2 3 4 5 6 7 8 9
10 11 12 13 14 15 16 17 18 19 20 21 22 23
24 25 26 27 28
While these toxicity data are not detailed and are limited to far fewer species than the data on aquatic arthropods, it is clear that non-arthropod aquatic invertebrates (at least those in the mature stage) are much less sensitive than aquatic arthropods to lambda-cyhalothrin. For sensitive species, the lowest effect level of 8.9 µg/L in snails (Schroer et al. 2004) is used to characterize risks. Schroer et al. (2004) classify this concentration as a LOEL. Nonetheless, the response appears to be an avoidance reaction, and it is not clear that toxic effects were induced. Consequently, the 8.9 µg/L LOEC is divided by 10, rather than 20, to estimate an NOEC of 0.89 µg/L, rounded to 0.0009 mg/L, as indicated in Table 14 (the summary table for the dose-response assessment). For tolerant species, the toxicity value of 590 µg/L for the Pacific oyster is not well defined. The only information available is that the LC50 is greater than 590 µg/L; however, it is not clear that adverse effects were observed. Consequently, this toxicity value is treated as an LOEC and divided by 10 to estimate an NOEC of 59 µg/L, which is also rounded to one significant place and entered into Table 14 as 0.06 mg/L. No chronic toxicity studies are available on non-arthropod aquatic invertebrates. While adult mollusks may be very tolerant of lambda-cyhalothrin because of their ability to retract into their shell, larval stages of developing mollusks do not have this capability. Consequently, no attempt is made to derive longer-term toxicity values for non-arthropod aquatic invertebrates, based on relationships discussed in the previous subsection on aquatic arthropods. The potential risks to larval stages of aquatic mollusks are considered further in the risk characterization.
4.3.3.4. Aquatic Plants As discussed in Section 4.1.3.4, there is no basis for asserting that lambda-cyhalothrin is likely to cause direct damage to aquatic plants. Consequently, no formal dose-response assessment is proposed for this group of organisms, and risks to aquatic plants are characterized qualitatively (Section 4.4.3.5).
82
4.4. RISK CHARACTERIZATION 1
2 3 4 5 6 7 8 9
10 11 12 13 14 15 16 17 18 19 20 21 22 23 24 25 26 27 28 29 30 31 32 33 34 35 36 37 38 39 40 41 42 43 44 45
4.4.1. Overview In the ecological risk assessment, as in the human health risk assessment, the quantitative expression of the risk characterization is the hazard quotient (HQ), the ratio of the anticipated dose or exposure to a no-observed-effect level or concentration (NOEL/NOEC) using 1 as the level of concern—i.e., an HQ of ≤ 1 is below the level of concern. The specific HQs discussed in this risk characterization are based on six single applications of 0.08 lb a.i./acre with a 2-week interval between applications. Since lambda-cyhalothrin is not used currently at the two sites in California for which this risk assessment is developed, the Forest Service might consider using somewhat lower or higher application rates (up to 0.16 lb a.i./acre) resulting in a cumulative annual application rate of 0.5 lb a.i./acre. Although the different rates would have an impact on the specific HQs, the qualitative risk characterization would not change substantially. Lambda-cyhalothrin is an effective insecticide and is highly toxic to insects as well as other terrestrial arthropods. Within the treated area, terrestrial insects will be adversely affected (and probably killed) in any effective application of lambda-cyhalothrin. Insects not present at the application site will be at much lower risk, although adverse effects within about 100 feet downwind of the application area are plausible. Adverse effects on some soil arthropods as well as some nematodes are also plausible. Adverse effects on earthworms are implausible. Acute exposures of lambda-cyhalothrin in surface water are likely to have an adverse effect on some aquatic arthropods; however, there are apparently large differences in sensitivity among aquatic arthropods. Although peak concentrations of lambda-cyhalothrin are likely to cause substantial mortality in sensitive species of aquatic arthropods, they are not likely to cause mortality or even sublethal adverse effects in tolerant species of aquatic arthropods. Fish are less sensitive than are aquatic arthropods to lambda-cyhalothrin. Nonetheless, the risk characterization for fish is very similar to that for aquatic arthropods—i.e., adverse effects are anticipated, based on plausible peak concentrations in sensitive but not tolerant species of fish. For the Foresthill site, however, this risk characterization has no practical impact because fish are not found in the stream at this site. Longer-term exposure levels are not likely to have an impact on fish or tolerant species of aquatic arthropods. The possibility of adverse reproductive effects in sensitive species of aquatic arthropods cannot be excluded at the Chico site and are plausible at the Foresthill site. While the relatively high HQs for sensitive species of fish and aquatic arthropods raise concern for downstream contamination, this concern cannot be considered quantitatively in this risk characterization. As discussed at some length in Section 3.2.3.4.6 (Downstream Contamination), the available information on the flow velocities and flow volumes of the creeks at the Chico and Foresthill sites are not sufficiently detailed to permit a quantitative discussion of downstream contamination. Nonetheless, the high
83

1 2 3 4 5 6 7 8 9
10 11 12 13
14
15 16 17 18 19 20 21 22 23 24 25 26 27 28 29 30 31 32 33 34
35 36 37 38 39 40 41 42 43
HQs for sensitive species of fish and aquatic arthropods at the application site suggest that downstream contamination has the potential to cause adverse effects in some aquatic organisms. No plausible risks to mammals, soil microorganisms, terrestrial plants, or aquatic plants can be identified. Risks to birds and non-arthropod aquatic invertebrates are not likely to be substantial. The only concern for non-arthropod aquatic invertebrates involves larval stage mollusks or adult mollusks without shells. No data are available on these groups. It is not clear that larval stage mollusks and adult mollusks without shells would be as tolerant of lambda-cyhalothrin exposures as are adult stage mollusks that have shells. Risks to amphibians cannot be characterized directly. A plausible speculation would be that amphibians may display a range of sensitivities similar to those of fish.
4.4.2. Terrestrial Organisms
4.4.2.1. Mammals The risk characterization for mammals does not suggest that mammals are at risk from exposure to lambda-cyhalothrin in any, including the accidental, exposure scenarios. This conclusion is identical to that in the EPA risk assessments for lambda-cyhalothrin (U.S. EPA/EFED 1987a,b, 1988, 1994a,b). The highest HQ for mammals is 0.7, which is the upper bound HQ for the longer-term consumption of contaminated vegetation at the application site. The highest acute HQ for mammals is 0.6, which is the upper bound HQ associated with the consumption of contaminated grasses or contaminated insects by mammals. While canids are considered the most sensitive subgroup of terrestrial mammals, the highest HQ for canids is only 0.3. Risks to canids are relatively low because canids are carnivorous and they will not consume substantial amounts of contaminated vegetation. As discussed in Section 2, all of the exposure scenarios are based on six single applications of 0.08 lb a.i./acre lambda-cyhalothrin with a 2-week interval between applications. If the Forest Service were to elect to use an application rate of 0.16 lb a.i./acre with fewer applications and a longer interval between applications, some of the acute HQs would probably exceed the level of concern, but only modestly, with no substantial impact on the risk characterization.
4.4.2.2. Birds The risk characterization for birds is quite similar to the risk characterization for mammals and suggests that birds are not likely to be at substantial risk after applications of lambda-cyhalothrin. Again, this risk characterization for birds is concordant with risk characterization for birds given in risk assessments conducted by the EPA (U.S. EPA/EFED 1987a,b, 1988, 1994a,b). The only HQ that exceeds the level of concern is the upper bound HQ of 1.8 associated with the longer-term consumption of vegetation at the application site. This is a worst-
84
1 2 3 4 5 6 7 8 9
10 11 12
13 14 15 16 17 18 19 20 21 22 23 24 25 26 27 28 29 30 31 32 33 34 35 36 37 38 39 40 41 42 43 44 45
case estimate based on the upper bound of exposure and the assumption that birds will feed exclusively at the application site. Note that the central estimate for this exposure scenario is 0.03, below the level of concern by a factor of over 30. Similarly, the scenario for the off-site consumption of contaminated vegetation—i.e., vegetation contaminated by drift—yields an upper bound HQ of only 0.02, below the level of concern by a factor of 50. Finally, the study by Roberts et al. (1982a) suggests that an HQ of 10 could be associated with decreased egg production but not with signs of frank toxicity. The acute toxicity data on birds suggest that birds are very tolerant to acute exposures. The acute exposure scenarios for birds lead to much lower HQs. The highest upper bound acute HQ for birds is 0.07, below the level of concern by a factor of over 14.
4.4.2.3. Terrestrial Invertebrates Risks to terrestrial invertebrates vary with the nature of the exposure and the group of terrestrial organisms exposed. Lambda-cyhalothrin is an effective insecticide and is very toxic to insects when applied as a direct spray (Section 4.3.2.3.1). As summarized in Worksheet G02b in Attachment 1 (Chico site), the HQ for the direct spray of an insect with no foliar interception is over 1000 and the estimated dose to the insect is about 6.8 mg/kg bw. As discussed in Section 4.3.2.3.1, the contact LD50 values for terrestrial insects range from about 0.065 to about 1 mg/kg bw. Thus, if an insect is directly sprayed with lambda-cyhalothrin, the insect will probably die. While the HQ is based on an application rate of 0.08 lb a.i./acre, the magnitude of the HQ makes the application rate inconsequential. When used at an effective application rate or anything close to an effective application rate, direct spray applications of lambda-cyhalothrin will kill insects. While a direct spray scenario is not included in the EXCEL workbook for the Foresthill site because of the nature of the application, an incidental direct spray of an insect during tree spray applications will kill the insect. As also indicated in Worksheet G02b, risks associated with airblast applications of lambda-cyhalothrin will diminish substantially downwind of the application site. While the extent of drift during a specific application of lambda-cyhalothrin will vary according to numerous conditions at the time of application, it does not appear that risks to nontarget insects will be substantial at downwind distances of greater than 100 feet from the application site. Risks to herbivorous or predatory insects are summarized in Worksheet G08b of both EXCEL workbooks that accompany the current risk assessment. While the HQs are not as high as those for direct spray, the upper bound HQs range from 11 to 170, depending on the type of vegetation which is treated and consumed. The doses associated with these HQs range from about 4 to nearly 70 mg/kg bw (Worksheet G08a). As noted in Section 4.3.2.3.2, the oral LD50 for lambda-cyhalothrin is about 0.9 mg/kg bw. Thus, all of the upper bound HQs would be associated with insect mortality. This risk characterization is intuitive: Lambda-cyhalothrin is used to kill insects on treated vegetation. This risk characterization for terrestrial insects is also consistent with field studies indicating that lambda-cyhalothrin will have adverse effects on terrestrial insects at very low application rates—i.e., 0.0022-0.0089 lb a.i./acre (Nieheff et al. 1994).
85

1 2 3 4 5
6 7 8
9 10 11 12 13 14 15
16
17
18 19 20 21 22 23 24 25 26 27 28 29 30 31 32 33 34 35
36 37 38 39 40
Risks to soil invertebrates are variable. As summarized in Worksheet G09a, the HQs for earthworms are below the level of concern by factors of at least 140 for acute exposures and 30 for longer-term exposures. The acute HQs for other species of soil invertebrates, however, do exceed the level of concern with HQs of 3 for the Porcellionides pruinosus (an isopod) and up to 85 for soil nematodes.
4.4.2.4. Terrestrial Plants As discussed in Section 4.3.2.4, no dose-response assessment for terrestrial plants is developed because hazards to terrestrial plants cannot be identified.
4.4.2.5. Terrestrial Microorganisms As with earthworms, terrestrial microorganisms do not appear to be at risk from applications of lambda-cyhalothrin. As summarized in Worksheet G09c, the upper bound HQ for sensitive species is 0.1, below the level of concern by a factor of 10. While the data on soil microorganisms is not as extensive as that for some other groups of organisms, there is no basis for asserting that applications of lambda-cyhalothrin are likely to harm terrestrial microorganisms.
4.4.3. Aquatic Organisms
4.4.3.1. Fish
4.4.3.1.1. Accidental Exposures As with terrestrial organisms, risks may be characterized for accidental exposures, expected peak exposures, and expected longer-term exposures. The accidental exposures modeled in this risk assessment are based on standard scenarios used in all Forest Service risk assessments and the accidental HQs for fish are identical for both the Chico and Foresthill sites. In the event of an accidental spill, the HQs substantially exceed the level of concern (HQ=1) for both sensitive species of fish [HQ = 9084 (1817 to 35,958] and tolerant species of fish [HQ = 91 (18 to 360]. As noted in Section 3.2.3.4.1, however, these accidental exposure scenarios are not directly applicable to either the Chico site or the Foresthill site. At both sites, the streams are not likely to be flowing during the application period. At the Foresthill site, the stream beds are likely to be dry during periods of application, and there are no fish in the creek at the Foresthill site (Bakke 2010). At the Chico site, pools of water may be present during the application periods, but the size and composition of possible fish populations are not well characterized. Nonetheless, in unusual periods in which stream flow does occur, an accidental spill of a large amount of lambda-cyhalothrin at either site would likely have an adverse effect on fish present in water near the site of the spill.
4.4.3.1.2. Peak Expected Exposures For the Foresthill site, risks to fish are not relevant because there are no fish within this reach of McBride Creek at any time (Bakke 2010). Worksheet G02 of the EXCEL workbook for the Foresthill site (Attachment 2) does indicate that the acute HQs for sensitive species of fish exceed the level of concern—i.e., HQs = 1.9 (0.03 to 15). These
86

1 2 3 4 5 6 7 8 9
10 11 12 13 14 15 16 17 18 19 20 21 22 23 24 25 26 27 28 29 30 31 32 33 34 35 36 37 38 39 40 41 42 43 44 45
values are shown for the sake of transparency but, as noted above, they do not apply specifically to the Foresthill site. Risks to fish at the Chico site are evident; however, the severity of potential effects may not be substantial. As discussed in Section 4.3.3.1.1, the toxicity value for sensitive species of fish is 0.004 µg/L, which is derived from a 96-hour LC50 of 0.078 µg/L. As summarized in Table 6, the upper bound of the peak water concentration at the Chico site is 2.50 x 10⁻⁵ mg/L, which is equivalent to 0.025 µg/L, below the LC50 by a factor of about 3 [0.078 µg/L ÷ 0.025 µg/L ≈ 3.12]. It is not clear that this peak exposure would be associated with mortality in fish. Using the general approach adopted by U.S. EPA/OPP (SERA 2007a, Table 4-2), the ratio of the exposure to the LC50, termed the RQ by U.S. EPA/OPP, is 0.32. Although this RQ would not trigger concern for acute risk (RQ ≥0.5), it would trigger concern for threatened and endangered species (RQ ≥0.05). Note that the more conservative value of 0.05 for threatened and endangered species is essentially equivalent to the standard approach used in Forest Service risk assessments for all species. A similar interpretation of risk can be based on the relatively scant data on acute NOECs for mortality in fish. As discussed in Section 4.3.3.1.1, the acute NOECs for fish are factors of 2.7-3.1 below the corresponding LC50 values—i.e., the acute NOECs are about a factor of 3 below the LC50. The simple verbal interpretation of acute risks to fish at the Chico site can be stated as follows: Peak concentrations at the Chico site are likely to exceed concentrations that should be regarded as acceptable; however, it is not clear that fish mortality would be observed at the Chico site. The risk characterization for acute risks to fish given in the current Forest Service risk assessment is not consistent with the EPA risk characterization in the risk assessment for the use of cyhalothrin on turf, trees, nurseries, and ornamental gardens (U.S. EPA/EFED 1994b). Specifically, the U.S. EPA risk assessment states: Based on available information, this proposed use pattern is not likely to cause fish kills (U.S. EPA/EFED 1994b, p. 4). The difference in conclusions between the EPA risk assessment and the current Forest Service risk assessment reflects the lower application rates considered in the EPA risk assessment (i.e., 0.015-0.030 lb a.i./acre) as well as the EPA’s use of only registrant-submitted studies, rather than those studies as well as the information in the published literature (Appendix 3). The above risk characterization is based on the Gleams-Driver modeling of the Chico and Foresthill site. As discussed in Section 3.2.3.4.6, Information on flow rates for Comanche Creek (Chico site) suggests that maximum flow rates for Comanche Creek may be underestimated by a factor of about 3. This underestimate is associated with a dam upstream of the treatment site on Comanche Creek. If the flow volume of Comanche Creek is greater by a factor of 3 than that modeled with Gleams-Driver, then the concentrations of lambda-cyhalothrin in Comanche Creek will be less than the modeled concentrations by about a factor of 3. As discussed above, the acute HQs for the Chico site are 1.3 (1.1-6). If adjusted downward by a factor of 3, these HQs would be 0.4 (0.4-2), modestly reducing the risk characterization for sensitive species of fish at the Chico site. This impact is noted but not explicitly incorporated into the worksheets,
87

1 2
3 4 5 6 7 8 9
10 11 12 13 14 15 16 17 18 19 20 21 22 23
24 25 26 27 28 29 30 31 32 33 34 35 36
37
38 39 40 41 42
because the timing and the regularity of additional flow into Comanche Creek from the upstream dam is not well characterized.
4.4.3.1.3. Longer-term Expected Exposures The risk characterization for fish associated with longer-term exposures to lambda-cyhalothrin at the Chico and Foresthill sites is straightforward. None of the HQs for longer-term exposures in sensitive species of fish exceed the level of concern at either the Chico site [HQs = 0.05 (0.003-0.1)] or the Foresthill site [HQs = 0.2 (0.003-0.9]. The upper bounds of the HQs for tolerant species of fish are below the level of concern by a factor of over 100 at the Foresthill site and a factor of 1000 at the Chico site. As with the acute HQs, the chronic HQs for the Foresthill site are included only for the sake of transparency. These HQs are not directly applicable to the Foresthill site because there are no fish within this reach of McBride Creek at any time (Bakke 2010). As detailed in Section 4.3.3.1.1, the current Forest Service risk assessment uses an atypical and very conservative approach in the dose-response assessment for longer-term effects in fish. Rather than taking the lowest available experimental chronic NOEC, the lowest experimental NOEC—i.e., the NOEC of 0.031 µg/L from the full life-cycle study in fathead minnows by Tapp et al. (1990)—is adjusted downwards by a factor of 10 to account for concerns that the fathead minnow may not be the most sensitive species. Given this conservative approach to the dose-response assessment, there is no apparent basis for asserting that longer-term exposures of fish to lambda-cyhalothrin are likely to result in adverse effects.
4.4.3.2. Amphibians No formal dose-response assessment is developed for amphibians (Section 4.3.3.2). An LC50 4 µg/L in tadpoles is the only available toxicity value for amphibian exposure, (Pan and Liang 1996) and is close to the highest LC50 in fish (7.92 µg/L). Although this information as well as scant observations on amphibians from mesocosm studies (Section 4.1.3.2) might suggest that the sensitivity of amphibians to lambda-cyhalothrin is comparable to that of tolerant species of fish, the generalization is tenuous at best. Given the well-documented variability in sensitivity among fish (e.g., Figure 6), it is plausible that a similar variability exists in amphibians and that the one available LC50 simply reflects a response in a tolerant species of amphibians. Consequently, no quantitative risk characterization for amphibians is developed. In the absence of more detailed data on amphibians, it seems reasonable to assume that the risk characterization for amphibians will be similar to that for tolerant and sensitive species of fish (Section 4.4.3.1).
4.4.3.3. Aquatic Invertebrates
4.4.3.3.1 Aquatic Arthropods As illustrated in Figure 6, aquatic arthropods are more sensitive than fish to lambda-cyhalothrin. Consequently, risks to aquatic arthropods are similar to, albeit somewhat more severe than, the risks to fish. The accidental exposure scenarios require no interpretation. If a relatively large amount of lambda-cyhalothrin is spilled into a
88

1 2 3 4 5 6 7 8 9
10 11 12 13 14 15 16 17 18 19 20 21 22 23 24 25 26 27 28 29 30 31 32 33 34 35 36 37 38 39 40 41 42 43 44 45 46
relatively small body of surface water, aquatic arthropods will be killed. This is similar to the risk characterization for the direct spray of a terrestrial insect. Risks associated with expected peak concentrations of lambda-cyhalothrin in streams at the Chico and Foresthill sites suggest that adverse effects are likely in sensitive but not tolerant species of aquatic arthropods. For tolerant species of aquatic arthropods, the highest HQ is 0.3, the upper bound of the HQs at the Foresthill site. As discussed in the dose-response assessment (Section 4.3.3.3.1), the toxicity values for both sensitive and tolerant species are based on the chronic NOEC. In the absence of acute NOECs, the acute LC50 would typically be divided by 20 to approximate an acute NOEC. This approach is not taken for lambda-cyhalothrin because the acute LC50 values are less than a factor of 20 above the chronic NOECs and it make no sense to use an acute NOEC that is lower than a chronic NOEC. This matter only modestly complicates the risk characterization. The HQ of 0.3 is associated with a concentration of about 0.06 µg/L, and the highest acute LC50 is 3.3 µg/L. In other words, the peak exposure is about a factor of 55 below the LC50 for the most tolerant species [3.3 µg/L ÷ 0.06 µg/L =55]. Thus, even at the highest HQ for tolerant species, substantial mortality is an unlikely effect of exposure. For sensitive species of aquatic arthropods, however, the HQs are much higher—i.e., 27 (22-125) at the Chico site and 39 (0.6-295) at the Foresthill site. Except for the lower bound at the Foresthill site, all of the other HQs are above 20. An HQ of 20 is associated with a concentration of about 0.004 µg/L. This concentration exceeds the LC50 for the most sensitive aquatic arthropod—i.e., 0.0023 µg/L for freshwater shrimp reported by Maund et al. (1998). Thus, expected peak concentrations of lambda-cyhalothrin are likely to cause mortality in sensitive species of aquatic arthropods. This conclusion applies at the Chico site and in most years at the Foresthill site. The risk characterization for longer-term exposures at the Chico and Foresthill sites are similar for tolerant species of aquatic arthropods. The highest HQ is 0.003, the upper bound of the HQ at the Foresthill site, which is below the level of concern by a factor of over 300. The upper bound HQ at the Chico site is 0.002, below the level of concern by a factor of 500. Thus, there is no plausible basis for asserting that longer-term exposures to lambda-cyhalothrin are likely to pose a risk to tolerant species of aquatic arthropods at either the Chico or Foresthill sites. The longer-term HQs for sensitive species of aquatic arthropods are also similar at both sites—i.e., 0.8 (0.5-1.5) at the Chico site and 0.4 (0.02-2) at the Foresthill site. As discussed in Section 4.3.3.3.1, the chronic NOEC for lambda-cyhalothrin is 0.00022 µg/L in mysid shrimp (Thompson 1987). The LOEC in this study is 0.00046 µg/L, based on a decrease in the number of young, and is equivalent to an HQ of about 2 [0.00046 µg/L ÷ 0.00022 µg/L ≈ 2.091]. Thus, although risks associated with the upper bound HQ of 1.5 at Chico site cannot be clearly interpreted, the possibility of adverse reproductive effects in sensitive species of aquatic arthropods cannot be excluded at the Chico site and are plausible at the Foresthill site.
89

1 2 3 4 5 6 7 8 9
10 11 12 13 14 15 16
17 18 19 20 21 22 23 24 25 26 27 28 29 30 31 32 33 34 35 36 37 38 39 40 41 42 43 44 45
While the risk characterization for aquatic arthropods is somewhat complex, this risk characterization is similar to the risk characterization that could be derived from mesocosm studies. As discussed in Section 4.1.3.3.3, most mesocosm studies suggest that adverse effects in sensitive species of aquatic invertebrates are plausible and that species composition may be affected. Nonetheless, the overall structure and functioning of the ecosystem may not be substantially impaired, and recovery is likely to be observed as concentrations of lambda-cyhalothrin decline. While the current Forest Service risk assessment focuses on effects in sensitive species, the overall risk characterization for aquatic arthropods is consistent with effects reported in mesocosm studies. As discussed in Section 4.4.3.1.2, the concentrations of lambda-cyhalothrin in Comanche Creek (Chico site) may be overestimated by a factor of about 3, due to the impact of a dam upstream of the Chico site. The only HQs of concern for the Chico site are the acute HQs for sensitive species of aquatic arthropods—i.e., 27 (22-125). Reducing these HQs by a factor of 3 would have no impact on the risk characterization.
4.4.3.3.2. Other Aquatic Invertebrates The risk characterization for non-arthropod invertebrates is somewhat circumscribed by the limited data on this group of organisms (Section 4.3.3.3.2). As with amphibians, the data on non-arthropod aquatic invertebrates are much less extensive and detailed than the data on fish and aquatic arthropods. Nonetheless, information is available on several species and it seems clear that at least some groups of non-arthropod aquatic invertebrates are much less sensitive than fish or aquatic arthropods to lambda-cyhalothrin (Figure 6). In addition, there is a biological basis for this tolerance in mature mollusks—i.e., the ability to reduce soft tissue exposure by closing or withdrawing into shells. The risk characterization for this group, however, is poorly defined because the likelihood and nature of adverse effects cannot be clearly articulated. At least for mollusks, the following relatively benign risk characterization is limited to adult stage organisms that have shells. This is the only subgroup of mollusks on which data are available. No information is available on adult mollusks without shells as well as larval stage aquatic mollusks. While somewhat speculative, small larval stage mollusks might be as susceptible as small aquatic arthropods to lambda-cyhalothrin. Conversely, one species of flatworm—i.e., Polycelis nigra/tenuis from the study by Schroer et al. (2004)—is also tolerant to lambda-cyhalothrin. The basis of this tolerance is unclear but might reflect a more general tolerance in non-arthropod aquatic invertebrates. As with other groups of aquatic organisms, accidental exposures lead to HQs that substantially exceed the level of concern for sensitive but not tolerant species of non-arthropod aquatic invertebrates—i.e., 40 (8-160) for sensitive species and 0.6 (0.1-2) for tolerant species. It does not seem plausible that lethality or even sublethal toxicity would be observed in some tolerant species. Even in sensitive species, the nature of possible adverse effects is unclear. In the event of an accidental spill, the most likely response of mollusks will be to retract into or close their shells. Avoidance might be noted in more
90

91
1 2 3 4 5 6 7 8 9
10 11 12
13 14 15 16 17 18 19 20 21 22
mobile benthic organisms. While more serious effects cannot be ruled out, the probability of observing widespread mortality is not clear. For expected peak concentrations, the risk characterization is reasonably clear. The highest HQ is 0.07, the upper bound HQ at the Foresthill site. This HQ is below the level of concern by a factor of about 14. Given the nature of the acute toxicity information, it does not seem likely that this HQ would be associated with adverse effects in adult mollusks. At the Chico site, the highest HQ is 0.03, below the level of concern by a factor of over 30. No data are available on the chronic toxicity of lambda-cyhalothrin to non-arthropod invertebrates, and no risk characterization for chronic exposures can be developed.
4.4.3.4. Aquatic Plants While no dose-response assessment for aquatic plants is developed in the current Forest Service risk assessment, there is relatively little uncertainty in the risk characterization for aquatic plants. There are ample studies relating to the metabolism of lambda-cyhalothrin by aquatic plants (Section 3.2.3.4.6) as well as mesocosm studies involving aquatic plants (Appendix 4, Table 3) to support the assertion that lambda-cyhalothrin will not damage aquatic plants at concentrations greater than or equal to those anticipated in the normal use of this insecticide. However, losses in aquatic invertebrate populations could result in changes in biomass and species composition of aquatic plants.
5. REFERENCES NOTE: The initial entry for each reference in braces {} simply specifies how the reference is cited in the text. The final entry for each reference in brackets [] indicates the source for identifying the reference. SET00 Papers from preliminary scoping. SET01-Toxline01 Standard initial TOXLINE literature search. SET01-Toxline02 Supplemental TOXLINE search on resistance –
lambda-cyhalothrin and esfenvalerate only. Set01-ATSDR Tree search of ATSDR 2003. SET02 Additional papers after initial screen. SET03 Papers relating to pesticide dilution in streams. Sec Studies cited from secondary sources. EPA Reviews Cleared reviews available from
http://www.epa.gov/pesticides/foia/reviews/128897/index.htm. E-Docket01 255 files at www.regulations.gov – e.g., EPA-HQ-OPP-
2007-1024-0507, EPA-HQ-OPP-2007-1024. Reviewed and selectively downloads. Several MRIDs/DERs were extracted from some of the files. These are listed separately in this bibliography.
Internet Various publications located on the Internet. Std Standard references used in most Forest Service risk
assessments. {Abro et al. 1997} Abro GH; Memon AJ; Syed TS. 1997. Sub-Lethal Effects of Cyhalothrin and Fluvalinate on Biology of Spodoptera litura F. Pakistan Journal of Zoology. 29 (2): 181-184. [Set 01 - ToxLine01]
{Ahmad and Arif 2009} Ahmad M; Arif MI. 2009. Resistance of Pakistani field populations of spotted bollworm Earias vittella (Lepidoptera: Noctuidae) to pyrethroid, organophosphorus and new chemical insecticides. Pest Manag Sci. 65(4):433-9. [SET01 – Toxline02]
{Akhtar et al. 1996} Akhtar N; Kayani SA; Ahmad MM; et al. 1996. Insecticide-induced changes in secretory activity of the thyroid gland in rats. J Appl Toxicol. 16(5):397-400. [Set 01 - ATSDR]
{Al-Deeb et al. 2001} Al-Deeb MA; Wilde GE; Zhu KY. 2001. Effect of Insecticides Used in Corn, Sorghum, and Alfalfa on the Predator Orius insidiosus (Hemiptera: Anthocoridae). J Econ Entomol. 94(6):1353-60. [Set 01 - ToxLine01]
{Amweg et al. 2005} Amweg EL; Weston DP; Ureda NM. 2005. Use and Toxicity of Pyrethroid Pesticides in the Central Valley, California, USA. Environ Toxicol Chem. 24(4):966-72. [Set 01 - ToxLine01]
{Amweg et al. 2006} Amweg EL; Weston DP; You J; Lydy MJ. 2006. Pyrethroid Insecticides and Sediment Toxicity in Urban Creeks from California and Tennessee. Environ Sci Technol. 40(5):1700-6. [Set 01 - ToxLine01]
{Anadon et al. 2006} Anadon A; Martinez M; Martinez MA; Diacuteaz MJ; Martinez-Larrantildeaga MR. 2006. Toxicokinetics of Lambda-Cyhalothrin in Rats. Toxicol Lett. 165(1):47-56. [Set 01 - ToxLine01]
{Armitage et al. 2008} Armitage JM; Franco A; Gomez S; Cousins IT. 2008. Modeling the Potential Influence of Particle Deposition on the Accumulation of Organic Contaminants by Submerged Aquatic Vegetation. Environ Sci Technol. 42(11):4052-9. [Set 01 - ToxLine01]
92

{Arts et al. 2006} Arts GH; Buijse-Bogdan LL; Belgers JD; Van Rhenen-Kersten CH; Van Wijngaarden RP; Roessink I; Maund SJ; Van Den Brink PJ; Brockt TC. 2006. Ecological Impact in Ditch Mesocosms of Simulated Spray Drift from a Crop Protection Program for Potatoes. Integr Environ Assess Manag. 2(2):105-25. [Set 01 - ToxLine01]
{Atkinson et al. 1991} Atkinson TH; Wadleigh RW; Koehler PG; Patterson RS. 1991. Pyrethroid resistance and synergism in a field strain of the German cockroach (Dictyoptera: Blattellidae). J Econ Entomol. 84(4):1247-50. [Set 01 - ToxLine02]
{ATSDR 2003} ATSDR (Agency for Toxic Substances and Disease Registry). 2003. Toxicological Profile for Pyrethrins and Pyrethroids. Report dated September 2003. Available at: http://www.atsdr.cdc.gov/toxprofiles/tp155.html. [Set 00]
{Babiacuten and Tarazona 2005} Babiacuten MM; Tarazona JV. 2005. In Vitro Toxicity of Selected Pesticides on RTG-2 and RTL-W1 Fish Cell Lines. Environ Pollut. 135(2):267-74. [Set 01 - ToxLine01]
{Bakke 2009a} Bakke D. Initial Program Description for lambda-Cyhalothrin in R5 Seed Orchards, prepared by David Bakke, R5 Pesticide-Use Specialist. Document dated March 13, 2009. [Set 00]
{Bakke 2009b} Bakke D. Comments on Lambda-Cyhalothrin Human Health and Ecological Risk Assessment (Introduction, Program Description, and References), SERA TR-052-21-01a dated August 30, 2009. Received via email on September 21, 2009. [Set 00]
{Bakke 2009c} Bakke D. Response to Queries for Risk Assessment of Lambda-cyhalothrin. Received via email on November 25, 2009. [Set 00]
{Bakke 2010} Bakke D. Comments on Peer-Review Draft of the Lambda-Cyhalothrin RA, including inputs from Paul Stover and Bill Cozad. Received via email on February 1, 2010. [Set 00]
{Banerjee et al. 2006} Banerjee K; Upadhyay AK; Adsule PG; Patil SH; Oulkar DP; Jadhav DR. 2006. Rate of Degradation of Lambda-Cyhalothrin and Methomyl in Grapes (Vitis Vinifera L.). Food Addit Contam. 23(10):994-9. [Set 01 - ToxLine01]
{Barata et al. 2002} Barata C; Baird DJ; Soares AM. 2002. Determining Genetic Variability in the Distribution of Sensitivities to Toxic Stress Among and Within Field Populations of Daphnia magna. Environ Sci Technol. 36(14):3045-9. [Set 01 - ToxLine01]
{Barata et al. 2006} Barata C; Baird DJ; Nogueira AJ; Soares AM; Riva MC. 2006. Toxicity of Binary Mixtures of Metals and Pyrethroid Insecticides to Daphnia magna Straus. Implications for Multi-Substance Risks Assessment. Aquat Toxicol. 78(1):1-14. [Set 01 - ToxLine01]
{Barata et al. 2007} Barata C; Baird DJ; Nogueira AJ; Agra AR; Soares AM. 2007. Life-History Responses of Daphnia magna Straus to Binary Mixtures of Toxic Substances: Pharmacological Versus Ecotoxicological Modes of Action. Aquat Toxicol. 84(4):439-49. [Set 01 - ToxLine01]
{Bascietto 1986} Bascietto J. 1986. Review. 39 Page(s). John Bascietto. Ecological Effects Branch. Karate, 10182-OA. Protocol Amendments. Karate, 10182-EUP-UR. Protocol Review. Report dated June 06, 1986. http://www.epa.gov/pesticides/foia/reviews/128897/index.htm. [Cleared Reviews]
{Beavers et al. 1989} Beavers JB; Hoxter KA; Jaber MJ. 1989. PP321: A One-Generation Reproduction Study with the Mallard (Anas platyrhynchos). Prepared by Wildlife International Ltd., Easton,. Maryland. :Laboratory Project No. 123-143. Submitted by ICI Americas, Inc. MRID Number: 415121-01. http://www.epa.gov/pesticides/foia/reviews/128897/index.htm [Cleared Reviews 128897-069.pdf]
93
{Bennett et al. 2005} Bennett ER; Moore MT; Cooper CM; Smith S Jr; Shields FD Jr; Drouillard KG; Schulz R. 2005. Vegetated Agricultural Drainage Ditches for the Mitigation of Pyrethroid-Associated Runoff. Environ Toxicol Chem. 24(9):2121-7. [Set 01 - ToxLine01]
{Bharti et al. 1987} Bharti H: Bewick DW; White RD. 1985. PP563 and PP321: Degradation in soil. RJ 0382B. ICI Americas Inc., Wilmington, DE. Reference dated October 30, 1987. http://www.epa.gov/pesticides/foia/reviews/128897/index.htm [Cleared Reviews 128897-047.pdf]
{Biever et al. 2003} Biever RC; Hoberg JR; Jacobson B; Dionne E; Sulaiman M; Mccahon P. 2003. Icon Rice Seed Treatment Toxicity to Crayfish (Procambarus clarkii) in Experimental Rice Paddies. Environ Toxicol Chem. 22(1):167-74. [Set 01 - ToxLine01]
{Booth et al. 2007} Booth LH; Wratten SD; Kehrli P. 2007. Effects of Reduced Rates of Two Insecticides on Enzyme Activity and Mortality of an Aphid and its Lacewing Predator. J Econ Entomol. 100(1):11-9. [Set 01 - ToxLine01]
{Bostanian et al. 1993} Bostanian NJ; Belanger A; Boudreau F; Mailloux G. 1993. Dissipation of Cyhalothrin Residues on Apple Foliage and Apple Foliage and Apples at Harvest. J Agric Food Chem. 41 (2): 292-295. [Set 01 - ToxLine01]
{Bostanian et al. 2001} Bostanian NJ; Larocque N; Chouinard G; Coderre D. 2001. Baseline Toxicity of Several Pesticides to Hyaliodes vitripennis (Say) (Hemiptera: Miridae). Pest Manag Sci. 57(11):1007-10. [Set 01 - ToxLine01]
{Bouldin et al. 2005} Bouldin JL; Farris JL; Moore MT; Smith S Jr; Stephens WW; Cooper CM. 2005. Evaluated Fate and Effects of Atrazine and Lambda-Cyhalothrin in Vegetated and Unvegetated Microcosms. Environ Toxicol. 20(5):487-98. [Set 01 - ToxLine01]
{Bouldin et al. 2006} Bouldin JL; Farris JL; Moore MT; Smith S Jr; Cooper CM. 2006. Hydroponic Uptake of Atrazine and Lambda-Cyhalothrin in Juncus effusus and Ludwigia peploides. Chemosphere. 65(6):1049-57. [Set 01 - ToxLine01]
{Boxenbaum and D’Souza. 1990} Boxenbaum J; D'Souza R. 1990. Interspecies pharmacokinetic scaling, biological design and neoteny. Adv. Drug Res. 19: 139-195.[Std]
{Brassard 1988} Brassard C. 1988. Memorandum from Candy Brassard. Ecological Effects Branch. Karate Data Requirements for EXAMS [Cleared Reviews Exposure Analysis Modeling System]. February 04, 1988. http://www.epa.gov/pesticides/foia/reviews/128897/index.htm [Cleared Reviews 128897-040.pdf]
{Brooks 1987} Brooks SH. 1987. PP#7F3488 - Karate® Insecticide (PP32l) on Soybeans -Evaluation of Residue Data and Analytical Methods- RCB No. 1880- MRID Nos. 400279-02 through -15 and 400547-01 http://www.epa.gov/pesticides/foia/reviews/128897/index.htm [Cleared Reviews 128897-020.pdf]
{Budavari 1989} Budavari S. (Ed). 1989. The Merck Index: An Encyclopedia of Chemicals, Drugs, and Biologicals, 11th ed. Merck & Co., Inc., Rahway, New Jersey. [Std]
{Burr and Ray 2004} Burr SA; Ray DE. 2004. Structure-Activity and Interaction Effects of 14 Different Pyrethroids on Voltage-Gated Chloride Ion Channels. Toxicol Sci. 77(2):341-6. [Set 01 - ToxLine01]
{CalEPA 2005} CalEPA (California Environmental Protection Agency). 2005. Department of Pesticide Regulation, Medical Toxicology Branch. Cyhalothrin: Summary of Toxicology Data. Copy courtesy of Dr. Jay Schreider, Primary State Toxicologist, CalEPA, via David Bakke, USDA/Forest Service via email on September 23, 2009. [Set00]
94

{Campana et al. 1999} Campana MA; Panzeri AM; Moreno VJ; Dulout FN. 1999. Genotoxic Evaluation of the Pyrethroid Lambda-Cyhalothrin Using the Micronucleus Test in Erythrocytes of the Fish Cheirodon interruptus interruptus. Mutation Research. 438 (2): 155-161. [Set 01 - ToxLine01]
{Cassano et al. 2003} Cassano G; Bellantuono V; Ardizzone C; Lippe C. 2003. Pyrethroid Stimulation of Ion Transport Across Frog Skin. Environ Toxicol Chem. 22(6):1330-4. [Set 01 - ToxLine01]
{CDPR 2008} CDPR (California Department of Pesticide Regulation). 2008. Summary of Pesticide Use Report Data 2007, Indexed by Chemical. Available at: http://www.cdpr.ca.gov/docs/pur/pur07rep/chmrpt07.pdf. [Std]
{Celik et al. 2003} Celik A; Mazmanci B; Camlica Y; A#351kin A; Coumlmelekoglu U. 2003. Cytogenetic Effects of Lambda-Cyhalothrin on Wistar Rat Bone Marrow. Mutat Res. 539(1-2):91-7. [Set 01 - ToxLine01]
{Celik et al. 2005a} Celik A; Mazmanci B; Camlica Y; Coumlmelekoglu U; Askin A. 2005a. Evaluation of Cytogenetic Effects of Lambda-Cyhalothrin on Wistar Rat Bone Marrow by Gavage Administration. Ecotoxicol Environ Saf. 61(1):128-33. [Set 01 - ToxLine01]
{Celik et al. 2005b} Celik A; Mazmanci B; Camlica Y; Askin A; Coumlmelekoglu U. 2005b. Induction of Micronuclei by Lambda-Cyhalothrin in Wistar Rat Bone Marrow and Gut Epithelial Cells. Mutagenesis. 20(2):125-9. [Set 01 - ToxLine01]
{Chester et al. 1992} Chester G; Sabapathy NN; Woollen BH. 1992. Exposure and Health Assessment During Application of Lambda-Cyhalothrin for Malaria Vector Control in Pakistan. Bull WHO. 70 (5): 615-619. [Set 01 - ToxLine01]
{Chesterman et al. 1981} Chesterman H; Heywood R; Allen TR; Street AE; Kelly DF; Gopinath C; Prentice DE. 1981. Chronic Toxicity (Dog). U.S. EPA Accession Number 073205. DER available at: http://www.epa.gov/pesticides/foia/reviews/128897/index.htm. [Cleared Reviews]
{Choi and Soderlund 2006} Choi JS; Soderlund DM. 2006. Structure-Activity Relationships for the Action of 11 Pyrethroid Insecticides on Rat Na V 1.8 Sodium Channels Expressed in Xenopus Oocytes. Toxicol Appl Pharmacol. 211(3):233-44. [Set 01 - ToxLine01]
{Colley et al. 1984} Colley J; Dawe S; Heywood R; et al. 1984. Cyhalothrin: Potential tumorigenic and toxic effects in prolonged dietary administration to mice. U.S. EPA Accession No. 073214-073216. DER available at: http://www.epa.gov/pesticides/foia/reviews/128897/index.htm. [Cleared Reviews]
{Cyco et al. 2006} Cyco M; Piotrowska-Seget Z; Kaczyska A; Kozdroacutej J. 2006. Microbiological Characteristics of a Sandy Loam Soil Exposed to Tebuconazole and Lambda-Cyhalothrin Under Laboratory Conditions. Ecotoxicology. 15(8):639-46. [Set 01 - ToxLine01]
{da Silva Gomes et al. 1991a} Gomes MS; Bernardi MM; Spinosa HDS. 1991a. Effects of Prenatal Pyrethroid Insecticide Exposure on the Sexual Development of Rats. Vet Hum Toxicol. 33 (5): 427-428. [Set 01 - ToxLine01]
{da Silva Gomes et al. 1991b} da Silva Gomes MS; Bernardi MM; Spinosa HDS. 1991b. Pyrethroid Insecticides and Pregnancy: Effect on Physical and Behavioral Development of Rats. Vet Hum Toxicol. 33(4):315-7. [Set 01 - ToxLine01]
{Day 1991} Day KE. 1991. Effects of Dissolved Organic Carbon on Accumulation and Acute Toxicity of Fenvalerate, Deltamethrin and Cyhalothrin to Daphnia magna (Straus). Environ Toxicol Chem. 10 (1): 91-102. [Set 01 - ToxLine01]
95
{Deshmukh 1992} Deshmukh PB. 1992. Three-Generation Reproductive Studies of a Synthetic Pyrethroid - Cyhalothrin. Toxicol Lett. 64-65 Spec No:779-81. [Set 01 - ToxLine01]
{Desneux et al. 2004a} Desneux N; Pham-Delegravegue MH; Kaiser L. 2004a. Effects of Sub-Lethal and Lethal Doses of Lambda-Cyhalothrin on Oviposition Experience and Host-Searching Behaviour of a Parasitic Wasp, Aphidius ervi. Pest Manag Sci. 60(4):381-9. [Set 01 - ToxLine01]
{Desneux et al. 2004b} Desneux N; Rafalimanana H; Kaiser L. 2004b. Dose-Response Relationship in Lethal and Behavioural Effects of Different Insecticides on the Parasitic Wasp Aphidius ervi. Chemosphere. 54(5):619-27. [Set 01 - ToxLine01]
{Dinter and Poehling 1995} Dinter A; Poehling H-M. 1995. Side-Effects of Insecticides on Two Erigonid Spider Species. Entomologia Experimentalis Et Applicata. 74 (2): 151-163. [Set 01 - ToxLine01]
{Doan 2006} Doan S. 2006. The in vitro Effects of Some Pesticides on Carbonic Anhydrase Activity of Oncorhynchus mykiss and Cyprinus carpio carpio Fish. J Hazard Mater. 132(2-3):171-6. [Set 01 - ToxLine01]
{Dow Chemical Company 2008} Dow Chemical Company. 2008. Product Safety Assessment Gamma-cyhalothrin. Form No. 233-00378-1108. Document dated November 20, 2008. [Set00]
{Driver et al. 2007} Driver J; Ross J; Mihlan G; Lunchick C; Landerberget B. 2007. Derivation of single layer clothing penetration factors from the pesticide handlers exposure database. Regulatory Toxicology and Pharmacology. 49: 125-137. [Set00]
{Dynamac Corporation 1986a} Dynamac Corporation. 1986a. PP 321 (KARATE). Task 1: Review and Evaluation of Individual Studies and Task 2: Environmental Fate and Exposure Assessment. Contract No. 68.Q1-6619. Report dated April 11,1986. http://www.epa.gov/pesticides/foia/reviews/128897/index.htm. [Cleared Reviews]
{Dynamac Corporation 1986a2} Dynamac Corporation. 1986a. PP 321 (KARATE) Final Report Task 1: Review and Evaluation of Individual Studies Task 2: Environmental Fate Assessment Contract No. 68-02-4250. http://www.epa.gov/pesticides/foia/reviews/128897/index.htm [Cleared Reviews 128897-019.pdf]
{Dynamac Corporation 1986a3} Dynamac Corporation. 1986a. PP 321 (KARATE) Final Report Task 1: Review and Evaluation of Individual Studies Task 2: Environmental Fate Assessment Contract No. 68-02-4250. http://www.epa.gov/pesticides/foia/reviews/128897/index.htm [Cleared Reviews 128897-027.pdf]
{Durkin et al. 1995} Durkin PR; Rubin L; Withey J; Meylan W. 1995. Methods of assessing dermal absorption with emphasis on uptake from contaminated vegetation. Toxicol Indust Health. 11(1): 63-79.[Std]
{Ecobichon 1998} Ecobichon DJ. 1998. Occupational Hazards of Pesticide Exposure – Sampling, Monitoring, Measuring. Taylor & Francis, Philadelphia, PA. 251 pp. [Std]
{El-Demerdash 2007} El-Demerdash FM. 2007. Lambda-Cyhalothrin Induced Changes in Oxidative Stress Biomarkers in Rabbit Erythrocytes and Alleviation Effect of Some Antioxidants. Toxicol In Vitro. 21(3):392-7. [Set 01 - ToxLine01]
{Estesen and Buck 1990} Estesen BJ; Buck NA. 1990. Comparison of Dislodgable and Total Residues of Three Pyrethroids Applied to Cotton in Arizona USA. Bull Environ Contam Toxicol. 44 (2): 240-245. [Set 01 - ToxLine01]
{Exxon Mobil 2007} Exxon Mobil. 2007. Material Safety Data Sheet for Solvesso 200 Fluid. Document dated 15 May 2007. [Set00]
96
{FAO and WHO Working Groups 1984} FAO and WHO Working Groups. 1984. Cyhalothrin. FAO Plant Production and Protection Paper. 67: 57-??? [Set 01 - ToxLine01]
{Farmer et al. 1995} Farmer D; Hill IR; Maund SJ. 1995. A Comparison of the Fate and Effects of Two Pyrethroid Insecticides (Lambda-Cyhalothrin and Cypermethrin) in Pond Mesocosms. Ecotoxicology. 4(4): 219-244. [Set 01 - ToxLine01]
{Farrelly et al. 1985} Farrelly E; Hamer MJ Hill IR. 2985. PP 321: Toxicity of formulations JF9509 and GFU383C to first instar Daphnia magna. Report dated May 1, 1985. EPA Accession No. 259807. http://www.epa.gov/pesticides/foia/reviews/128897/index.htm [Cleared Reviews 128897-009.pdf]
{Farrelly et al. 1984} Farrelly E; Hamer MJ Hill IR. 1984. PP 321: Toxicity to first instar Daphnia magna, ICI, August 6, 1984, EPA Accession No. 259807. http://www.epa.gov/pesticides/foia/reviews/128897/index.htm [Cleared Reviews 128897-008.pdf]
{Fetoui et al. 2009} Fetoui H; Garoui El M; Zeghal N. 2009. Lambda-Cyhalothrin-Induced Biochemical and Histopathological Changes in the Liver of Rats: Ameliorative Effect of Ascorbic Acid. Exp Toxicol Pathol. 61(3):189-96. [Set 01 - ToxLine01]
{Flood 1992a} Flood MT. 1992a. Lambda-cyhalothrin. Residue Transfer Study on Dairy Cattle with Analysis for Metabolite OH-CPA. HED Memorandum dated August 31, 1992. http://www.epa.gov/pesticides/foia/reviews/128897/index.htm [Cleared Reviews 128897-082.pdf]
{Flood 1992b} Flood MT. 1992b. Lambda-Cyhalothrin. ICI Americas, Inco's Anticipated Residue Calculations. Proposed Strategy for Analysis of Metabolites in Future Residue Studies. CBTS # 9882. MRID # 422884-01. http://www.epa.gov/pesticides/foia/reviews/128897/index.htm [Cleared Reviews 128897-087.pdf]
{Fluoride Action Network 2009} Fluoride Action Network. 2009. Lambda-cyhalothrin. Available at: http://www.fluoridealert.org/pesticides/lambda-cyhalothrin.-page.htm.
{Fowkes et al. 1984} Fowkes AG; Harrison MP; Marten TR. 1984. Cyhalothrin: The Disposition and Metabolism in the Dog. U.S. EPA Accession Number 073217. DER available at: http://www.epa.gov/pesticides/foia/reviews/128897/index.htm. [Cleared Reviews]
{Frampton et al. 2006} Frampton GK; Jansch S; Scott-Fordsmand JJ; Roumlmbke J; Van Den Brink PJ. 2006. Effects of Pesticides on Soil Invertebrates in Laboratory Studies: A Review and Analysis Using Species Sensitivity Distributions. Environ Toxicol Chem. 25(9):2480-9. [Set 01 - ToxLine01]
{Garcia et al. 2008} Garcia M; Roumlmbke J; De Brito MT; Scheffczyk A. 2008. Effects of Three Pesticides on the Avoidance Behavior of Earthworms in Laboratory Tests Performed Under Temperate and Tropical Conditions. Environ Pollut. 153(2):450-6. [Set 01 - ToxLine01]
{Gassner et al. 1997} Gassner B; Wuumlthrich A; Scholtysik G; Solioz M. 1997. The Pyrethroids Permethrin and Cyhalothrin Are Potent Inhibitors of the Mitochondrial Complex I. J Pharmacol Exp Ther. 281(2):855-60. [Set 01 - ToxLine01]
{Ghali 1993} Ghali G. 1993. RfD/Peer Review Report of Cyhalothrin / Karate. U.S. EPA/HED Memorandum dated August 25, 1993. http://www.epa.gov/pesticides/foia/reviews/128897/index.htm [Cleared Reviews 128867-016.pdf]
{Ghali 1994a} Ghali G. 1994a. 128897. Lambda Cyhalothrin (Karate)/Cyhalothrin. Request to Raise NOEL for Chronic Dog Study and Response to RfD committee Questions on Mouse Oncogenicity Study. http://www.epa.gov/pesticides/foia/reviews/128897/index.htm [Cleared Reviews 128867-017.pdf]
97
{Ghali 1994b} Ghali G. 1994b. Second RfD/Peer Review Report of Cyhalothrin/Karate. http://www.epa.gov/pesticides/foia/reviews/128897/index.htm [Cleared Reviews 128867-018.pdf]
{Giddings et al. 2001} Giddings JM; Solomon KR; Maund SJ. 2001. Probabilistic risk assessment of cotton pyrethroids: II. Aquatic mesocosm and field studies. Environ Toxicol Chem. 20(3):660-8. [Set01-ToxLine01]
{Giddings et al. 2009} Giddings JM; Barber I; Warren-Hicks W. 2009. Comparative Aquatic Toxicity of the Pyrethroid Insecticide Lambda-Cyhalothrin and its Resolved Isomer Gamma-Cyhalothrin. Ecotoxicology. 18(2):239-49. [Set 01 - ToxLine01]
{Goldstein et al. 1974} Goldstein A; Aronow L; Kaman SM. 1974. Principles of Drug Action: The Basis of Pharmacology. 2nd ed. John Wiley and Sons, New York, NY. 854 p.[Std]
{Gough and Brown 1987} Gough HJ; Brown A. 1987. PP32l: Toxicity of residues on foliage to honey bees (Apis mellifera). Submitted by ICI Americas Inc., Wilmington, DE. Reg. No. lOlB2-0A. http://www.epa.gov/pesticides/foia/reviews/128897/index.htm [Cleared Reviews 128897-052.pdf]
{Gough et al. 1984} Gough HJ; Collins LG; Everett CJ; Wilkinson W. 1984. PP32l: Acute contact and oral toxicity to honey bees (Apis mellifera). Submitted by ICI Americas Inc., Wilmington, DE. Reg. No. 10182-0A. Ace. No. 400524-09. http://www.epa.gov/pesticides/foia/reviews/128897/index.htm [Cleared Reviews 128897-017.pdf]
{Gough et al. 1986} Gough HJ: Collins IG; Wilkinson W. 1986. PP321: Effects on honey bees (Apis mellifera) foraging on simulated honeydew on winter wheat, 1985. Submitted by CII Americas Inc., Wilmington, DE. Reg. No. 10182-0A. http://www.epa.gov/pesticides/foia/reviews/128897/index.htm [Cleared Reviews 128897-051.pdf]
{Graney et al. 1994} Graney RL; Kennedy JH; Rodgers JH. 1994. Aquatic Mesocosm Studies in Ecological Risk Assessment. SETAC Special Publications Series. Lewis Publishers, Boca Raton. 723 pp. [Std]
{Gu et al. 2007} Gu BG; Wang HM; Chen WL; Cai DJ; Shan ZJ. 2007. Risk Assessment of Lambda-Cyhalothrin on Aquatic Organisms in Paddy Field in China. Regul Toxicol Pharmacol. 48(1):69-74. [Set 01 - ToxLine01]
{Guo et al. 1996} Guo YL; Wang B-J; Lee C-C; Wang J-D. 1996. Prevalence of Dermatoses and Skin Sensitization Associated with Use of Pesticides in Fruit Farmers of Southern Taiwan. Occupational and Environmental Medicine. 53 (6): 427-431. [Set 01 - ToxLine01]
{Hadfield et al. 1993} Hadfield ST; Sadler JK; Bolygo E; Hill S; Hill IR. 1993. Pyrethroid Residues in Sediment and Water Samples from Mesocosm and Farm Pond Studies of Simulated Accidental Aquatic Exposure. Pesticide Science. 38 (4): 283-294. [Set 01 - ToxLine01]
{Hamer and Hill 1985a} Hamer MJ; Hill IR. 1985. The accumulation of cyhalothrin and its degradation products by channel catfish and Daphnia magna in a soil/water system. RJ 0427B. Prepared and submitted by ICI Americas, Inc., Wilmington, DE. Acc. No. 470082-034. http://www.epa.gov/pesticides/foia/reviews/128897/index.htm [Cleared Reviews 128897-024.pdf]
{Hamer et al. 1985a} Hamer MJ; Farrelly E;. Hill IR. 1985a. PP321-Toxicity to Gammarus pulex. Submitted by ICI Americas, Inc., prepared by ICI Plant Protection Division, Jealotts Hill Research Station, Bracknell, Berkshire. EPA Accession No. 073989. http://www.epa.gov/pesticides/foia/reviews/128897/index.htm [Cleared Reviews 128897-026.pdf]
98

{Hamer et al. 1985b} Hamer MJ; Farrelly E;. Hill IR. 1985b. PP32l: 21-Day. Daphnia magna Life Cycle Study. Submitted by ICI Americas, Inc.; prepared .by ICI, Plant Protection Division, Jealotts Hill Research Station, Bracknell, Berkshire; EPA Accession No. 0739809 http://www.epa.gov/pesticides/foia/reviews/128897/index.htm [Cleared Reviews 128897-033.pdf]
{Hamer et al. 1994} Hamer MJ; Hill IR; Rondon L; Caguan A. 1994. The effects of lambda-cyhalothrin in aquatic field studies. In Freshwater Field Tests for Hazard Assessment of Chemicals, ed. I. R. Hill, F. Heimbach, P. Leeuwangh & P. Matthiessen. Lewis Publishers, London, 1994, pp. 331-337. [Set02]
{Hand et al. 2001} Hand LH; Kuet SF; Lane MC; Maund SJ; Warinton JS; Hill IR. 2001. Influences of Aquatic Plants on the Fate of the Pyrethroid Insecticide Lambda-Cyhalothrin in Aquatic Environments. Environ Toxicol Chem. 20(8):1740-5. [Set 01 - ToxLine01]
{Hansen 2003} Hansen LM. 2003. Insecticide-resistant pollen beetles (Meligethes aeneus F) found in Danish oilseed rape (Brassica napus L) fields. Pest Manag Sci. 59(9):1057-9. [Set 01 - ToxLine02]
{Hardt and Angerer 2003} Hardt J; Angerer J. 2003. Biological Monitoring of Workers After the Application of Insecticidal Pyrethroids. Int Arch Occup Environ Health. 76(7):492-8. [Set 01 - ToxLine01]
{Harris and Solomon 1992} Harris SA; Solomon KR. 1992. Human exposure to 2,4-D following controlled activities on recently sprayed turf. J. Environ. Sci. Health. B27(1): 9-22. [Std]
{Hart et al. 1985} Hart D; Banham PB; Chart IS; Evans DP; Gore CW; Stonard MD; Moreland S; Godley MJ; Robinson M. 1985. PP321: 90 Day Feeding Study in Rats. [Cleared Reviews 128867-013.pdf] http://www.epa.gov/pesticides/foia/reviews/128897/index.htm.
{He et al. 2008 [KEY PAPER]} He LM; Troiano J; Wang A; Goh K. 2008. Environmental Chemistry, Ecotoxicity, and Fate of Lambda-Cyhalothrin. Rev Environ Contam Toxicol. 195:71-91. [Set 01 - ToxLine01]
{Hearn 1985} Hearn LC. 1985. KARATE IE and AMBUSH 25WP: Honey bee field repellency and toxicity study (California). Study performed by E.L. Atkins Univ. of California; Riverside. Submitted by ICI Americas Inc., Wilmington, DE. Reg. No. lOI82-0A. http://www.epa.gov/pesticides/foia/reviews/128897/index.htm [Cleared Reviews 128897-050.pdf]
{Heckmann and Friberg 2005} Heckmann LH; Friberg N. 2005. Macroinvertebrate Community Response to Pulse Exposure with the Insecticide Lambda-Cyhalothrin Using In-Stream Mesocosms. Environ Toxicol Chem. 24(3):582-90. [Set 01 - ToxLine01]
{Heckmann et al. 2005} Heckmann LH; Friberg N; Ravn HW. 2005. Relationship Between Biochemical Biomarkers and Pre-Copulatory Behaviour and Mortality in Gammarus pulex Following Pulse-Exposure to Lambda-Cyhalothrin. Pest Manag Sci. 61(7):627-35. [Set 01 - ToxLine01]
{Hext 1990a} Hext P. 1990a. Lambda-Cyhalothrin Production Material: 21-day Sub-acute Inhalation Toxicity Study in the Rat: Lab Project Number: CTLlP/2772: MR0135. Unpublished study prepared by ICI Central Toxicology Laboratory. 102 p. MRID 41387702. http://www.epa.gov/pesticides/foia/reviews/128897/index.htm [Cleared Reviews 128867-2001-04-18a.pdf]
{Hext 1990b} Hext P. 1990b. Lambda-Cyhalothrin Production Material: 21-day Sub-acute Inhalation Toxicity Study in the Rat: Lab Project Number: CTLlP/2772: MR0135. Unpublished study prepared by ICI Central Toxicology Laboratory. 102 p. MRID 41387702. http://www.epa.gov/pesticides/foia/reviews/128897/index.htm [Cleared Reviews 128867-2004-03-26a.pdf]
99

{Hill 1984a} Hill RW. 1984a. PP 321: Determination of acute toxicity to rainbow trout (Salmo gairdneri), ICI, August 1984, EPA Accession No. 259807. http://www.epa.gov/pesticides/foia/reviews/128897/index.htm [Cleared Reviews 128897-011.pdf]
{Hill 1984b} Hill RW. 1984b. PP 321: Determination of acute toxicity to bluegill sunfish (Lepomis macrochirus), ICI. EPA Accession No. 259807. http://www.epa.gov/pesticides/foia/reviews/128897/index.htm [Cleared Reviews 128897-012.pdf]
{Hill 1985a} Hill RW. 1985a. PP 321: Determination of acute toxicity of a 1 lb/US gallon EC formulation to rainbow trout (Salmo gairdneri). ICI, March 1985. EPA Accession No. 259807. http://www.epa.gov/pesticides/foia/reviews/128897/index.htm [Cleared Reviews 128897-010.pdf]
{Hill 1985b} Hill RW. 1985b. PP 321: Determination of acute toxicity of a 1 lb/US gallon EC formulation to bluegill sunfish (Lepomis macrochirus). ICI, March 1985. EPA Accession No. 259807. http://www.epa.gov/pesticides/foia/reviews/128897/index.htm [Cleared Reviews 128897-013.pdf]
{Hill 1985c} Hill RW. 1985c. PP321: Determination of the Acute Toxicity to Larvae of the Pacific Oyster (Crassostrea gigas), Submitted by ICI Americas, Prepared by Brixham Laboratory, Devon. Accession No. 073989. http://www.epa.gov/pesticides/foia/reviews/128897/index.htm [Cleared Reviews 128897-022.pdf]
{Hill 1985d} Hill RW. 1985d. PP32l: Determination of Acute Toxicity to Sheepshead Minnow (Cyprinodon variegatus), submitted by ICI Americas, Inc. Prepared by Imperial Chemical Industries, PLC, Brixham Laboratory, Brixham, Devon. EPA Accession No. 073989. http://www.epa.gov/pesticides/foia/reviews/128897/index.htm [Cleared Reviews 128897-023.pdf]
{Hill and Inaba 1991} Hill BD; Inaba DJ. 1991. Dissipation of Lambda-Cyhalothrin on Fallow vs Cropped Soil. J Agric Food Chem. 39 (12): 2282-2284. [Set 01 - ToxLine01]
{Hill et al. 1985} Hill RW; Caunter JE; Cumming RI. 1985. PP321: Determination of the Chronic Toxicity to Sheepshead Minnow (Cyprinodon variegatus) Embryos and Larvae. Submitted by ICI Americas, Inc., Prepared by Imperial Chemical Industries, PLC, Brixham Laboratory, Brixham, Devon. EPA Accession No. 073989. http://www.epa.gov/pesticides/foia/reviews/128897/index.htm [Cleared Reviews 128897-035.pdf]
{Hill et al. 1994} Hill IR; Runnalls JK; Kennedy JH; Ekoniak P. 1994. Effects of lambda-cyhalothrin on aquatic organisms in large-scale mesocosms. In Freshwater Field Tests for Hazard Assessment of Chemicals, ed. I. R. Hill, F. Heimbach, P. Leeuwangh & P. Matthiessen, Lewis Publishers, London, pp. 345-360. [Set02]
{Hof et al. 1995} Hof A; Heimann D; Roumlmbke J. 1995. Further Development for Testing the Effects of Pesticides on Wolf Spiders. Ecotoxicol Environ Saf. 31(3):264-70. [Set 01 - ToxLine01]
{Hossain et al. 2005} Hossain MM; Suzuki T; Sato I; Takewaki T; Suzuki K; Kobayashi H. 2005. Neuromechanical Effects of Pyrethroids, Allethrin, Cyhalothrin and Deltamethrin on the Cholinergic Processes in Rat Brain. Life Sci. 77(7):795-807. [Set 01 - ToxLine01]
{Hossain et al. 2008} Hossain MM; Suzuki T; Unno T; Komori S; Kobayashi H. 2008. Differential Presynaptic Actions of Pyrethroid Insecticides on Glutamatergic and Gabaergic Neurons in the Hippocampus. Toxicology. 243(1-2):155-63. [Set 01 - ToxLine01]
{Humphrey and Dykes 2008} Humphrey JAC; Dykes ES. 2008. Thermal energy conduction in a honey bee comb due to cell-heating bees. J Theoretical Biology. 250 (1): 194-208. [Bees]
{Hughes et al. 2005} Hughes B; Olsen L; Hite P; Bills P. 2005. Occupational Pesticide Exposure During Seed Corn Production in Michigan. Toxicol Sci. 84(1-S):83-4 [Set 01 - ToxLine01]
100
{Hurley 1986a} Hurley P. 1986a. Cyhalothrin (Grenade). Application for Experimental Use Permit and Temporary Tolerance to Support Use on Cattle. Prepared by Pamela M. Hurley, Toxicologist, Section II, Toxicology Branch, Hazard Evaluation Division, U.S. EPA/OPP. No. 53218-EUP-1,2. Tox review 005100. Pages 5, 22-23, 33-44, 71-79, 88-96, 111-125, 142-157, 453- 454 removed, unregistered product. Pages 164-208, 219-224, 239-248, 271-283, 299-308, 326-345, 361-379, 405-416 removed registrant data. http://www.epa.gov/pesticides/foia/reviews/128897/index.htm. [Cleared Reviews]
{Hurley 1986b} Hurley P. 1986b. Memorandum. 33 Page(s). Pamela Hurley. Toxicology Branch. U.S. EPA/OPP. 10182-EUP-UR. Karate. Application for Experimental Use Permit. No. 10182-EUP-UR Tox review 005104. Pages 4-9 deleted-draft label. Report dated May 7, 1986. http://www.epa.gov/pesticides/foia/reviews/128897/index.htm.
{Hurley 1986c} Hurley P. 1986c. Pamela Hurley. Toxicology Branch. 53218-EUP-1, -2. 5G3204. Cyhalothrin (Grenade). Application for Experimental Use Permit and Temporary Tolerance to Support Use on Cattle. Tox review 005161. Report dated May 22, 1986. http://www.epa.gov/pesticides/foia/reviews/128897/index.htm. [Cleared Reviews]
{Hurley 1986d} Hurley P. 1986d. Pamela Hurley. Toxicology Branch. 6F3318. Karate 1E. Petition for Tolerance of PP321 on Cotton Pages 11-14 removed-draft label. DERs attached: Mutagenicity and Subchronic feeding (Rat); Acc. 073981, 073980 Tox review 005316. Report dated July 20, 1986. http://www.epa.gov/pesticides/foia/reviews/128897/index.htm [Cleared Reviews 128897-004.pdf]
{Hurley 1986e} Hurley P. 1986e. Pamela Hurley. Toxicology Branch. 10182-EUP-UR. Karate. Application for Experimental Use Permit. No. 10182-EUP-UR. Tox review 005355. August 18, 1986. Memorandum. 1 Page(s). http://www.epa.gov/pesticides/foia/reviews/128897/index.htm [Cleared Reviews 128897-005.pdf]
{Hurley 1987a} Hurley P. 1987a. July 20, 1987. Memorandum. 27 Page(s). Pamela Hurley. Toxicology Branch. 7F3488. Karate. Petition for Tolerance of PP321 on Soybeans. Pages 10-14 removed, draft label. Tox review 006004. http://www.epa.gov/pesticides/foia/reviews/128897/index.htm [Cleared Reviews 128897-018.pdf]
{Hurley 1988} Hurley P. 1988. 10182-REQ, Karate IE Insecticide. Evaluation of Histopathology Slides from Rabbit 21-Day Dermal Study on Cyhalothrin. Memo dated April 27, 1988. http://www.epa.gov/pesticides/foia/reviews/128897/index.htm [Cleared Reviews 128897-048.pdf]
{Hurley 1989a} Hurley P. 1989a. 9H5577/10182-EIE. Commodore 10WP (Lambdacyha1thrin). Petition for Food Additive Tolerance and App1ication for Registration for use in Food Handling Establishments (New use). http://www.epa.gov/pesticides/foia/reviews/128897/index.htm [Cleared Reviews 128897-060.pdf]
{Hurley 1989b} Hurley P. 1989b. 10182-REQ. Cyhalothrin Addendum to 21-Day Dermal Study. Document dated August 25, 1989. http://www.epa.gov/pesticides/foia/reviews/128897/index.htm [Cleared Reviews 128897-061.pdf]
{Hurley 1992a} Hurley P. 1992a. 510 SEC18-OC. Lambda-Cyhalothrin (Karate Insecticide). Emergency Exemption for Use on Dry Bulb Onions to control Thrips. Memorandum dated May 28, 1992. http://www.epa.gov/pesticides/foia/reviews/128897/index.htm [Cleared Reviews 128897-079.pdf]
{Hurley 1992b} Hurley P. 1992b. Lambda-Cyhalothrin (Karate). Re-evaluation of 3Generation Reproduction Study and Necessity for Change of study on Which RfD is Based. HED Memorandum dated Dec. 30, 1992. http://www.epa.gov/pesticides/foia/reviews/128897/index.htm [Cleared Reviews 128897-088.pdf]
101

{Hurley 1993a} Hurley P. 1993a. RfD/Peer Review Meeting on Cyhalothrin/Lambdacyhalthrin; Chenages in RfD and NOEL’s for Several Studies. HED Memorandum dated April 8, 1993. http://www.epa.gov/pesticides/foia/reviews/128897/index.htm [Cleared Reviews 128867-015.pdf]
{Hurley 2001} Hurley P. 2001. Compendia of DERs on Lambda-Cyhalothrin. http://www.epa.gov/pesticides/foia/reviews/128897/index.htm [Cleared Reviews 128867-2001-05-04a.pdf]
{IRAC 2009} IRAC (Insecticide Resistance Action Committee). 2009. IRAC Mode of Action Classification, Version 6.3. Report dated July 2009. Available at: http://www.irac-online.org/Crop_Protection/MoA.asp#area223. [Std]
{Jansen 1996} Jansen J-P. 1996. Side Effects of Insecticides on Aphidius rhopalosiphi (Hym.: Aphidiidae) in Laboratory. Entomophaga. 41 (1): 37-43. [Set 01 - ToxLine01]
{Jaumlnsch et al. 2006} Jaumlnsch S; Frampton GK; Roumlmbke J; Van Den Brink PJ; Scott-Fordsmand JJ. 2006. Effects of Pesticides on Soil Invertebrates in Model Ecosystem and Field Studies: A Review and Comparison with Laboratory Toxicity Data. Environ Toxicol Chem. 25(9):2490-501. [Set 01 - ToxLine01]
{Jayakrishnan et al. 2005} Jayakrishnan S; Dikshit AK; Singh JP; Pachauri DC. 2005. Dissipation of Lambda-Cyhalothrin on Tomato (Lycopersicon esculentum Mill.) and Removal of its Residues by Different Washing Processes and Steaming. Bull Environ Contam Toxicol. 75(2):324-8. [Set 01 - ToxLine01]
{Johnson and Finley 1980} Johnson WW; Finley MT. 1980. Handbook of Acute Toxicity of Chemicals to Fish and Aquatic Invertebrates. Fish and Wildlife Service Resource Publication No. 137. U.S. Department of the Interior, Washington, DC.[Std – Compendia]
{Johnson et al. 2006} Johnson RM; Wen Z; Schuler MA; Berenbaum MR. 2006. Mediation of Pyrethroid Insecticide Toxicity to Honey Bees (Hymenoptera: Apidae) by Cytochrome P450 Monooxygenases. J Econ Entomol. 99(4):1046-50. [Set 01 - ToxLine01]
{Keigwin 1998} Keigwin T. 1998. PHED (Pesticide Handlers Exposure Database) Surrogate Exposure Guide. Dated April 1997 with revisions in August 1998. Copy courtesy of Hank Appleton/USDA/Forest Service. 82 pp. [Std]
{Kennedy et al. 1988} Kennedy JH; Cole JFH; Ekoniak P Hadfield ST Sadler JK; Francis PD; Moore M; Hill IR. 1988. PP321: Evaluation of the impact of runoff and spray-drift on aquatic ecosystems, using USA experimental ponds (mesocosms). Unpublished study prepared by ICI plant Protection Division for ICI Americas, Inc. EPA Accession No. 405159-01. http://www.epa.gov/pesticides/foia/reviews/128897/index.htm [Cleared Reviews 128897-056.pdf]
{Kent et al. 1995a} Kent SJ; Sankey SA; Caunter JE; Johnson PA. 1995a. Lambda-Cyhalothrin: Acute Toxicity to Rainbow Trout (Oncorhynchus mykiss) of a 25CS Formulation. Brixham Environmental Laboratory, Brixham, Devon, UK. MRID No. 4308813. http://www.epa.gov/pesticides/foia/reviews/128897/index.htm [Cleared Reviews 128897-106.pdf]
{Kent et al. 1995b} Kent SJ; Sankey SA; Caunter JE; Magor SE. 1995b. Lambda-Cyhalothrin: Acute Toxicity to Bluegill Sunfish (Lepomis macrochirus) of a 25CS Formulation. Brixham Environmental Laboratory, Brixham, Devon, UK. MRID 4308812. http://www.epa.gov/pesticides/foia/reviews/128897/index.htm [Cleared Reviews 128897-105.pdf]
{Kent et al. 1995c} Kent SJ; Sankey SA; Caunter JE; Johnson PA. 1995c. Lambda-Cyhalothrin: Acute Toxicity to Daphnia magna of a 25 CS Formulation. Brixham Environmental Laboratory, Brixham, Devon, UK. MRID 43908811. http://www.epa.gov/pesticides/foia/reviews/128897/index.htm [Cleared Reviews 128897-104.pdf]
102

{Kent et al. 1995d} Kent SJ; Sankey SA; Caunter JE; Magor SE. 1995d. Lambda-Cyhalothrin: Acute Toxicity to Bluegill Sunfish (Lepomis macrochirus) of a 25CS Formulation. Brixham Environmental Laboratory, Brixham, Devon, UK. MRID 4308812. http://www.epa.gov/pesticides/foia/reviews/128897/index.htm [Cleared Reviews 128867-020.pdf]
{Killick 1981a} Killick ME. 1981. Cyha1othrin: Oral (gavage) teratology study in the New Zealand white rabbit. U.S. EPA Accession No. 073206. DER available at: http://www.epa.gov/pesticides/foia/reviews/128897/index.htm. [Cleared Reviews]
{Killick 1981b} Killick ME. 1981. Cyha1othrin: Oral (gavage) teratology study in the New Zealand white rabbit. U.S. EPA Accession No. 073206. DER available at: http://www.epa.gov/pesticides/foia/reviews/128897/index.htm.
{Kitchens 2006} Kitchens BF. 2006. Product Chemistry Review TC 253. U.S. EPA/OPP. http://www.epa.gov/pesticides/foia/reviews/128897/index.htm [Cleared Reviews 128897-2006-10-31a.pdf]
{Knisel and Davis 2000} Knisel WG; Davis FM. 2000. GLEAMS (Groundwater Loading Effects of Agricultural Management Systems), Version 3.0, User Manual. U.S. Department of Agriculture, Agricultural Research Service, Southeast Watershed Research Laboratory, Tifton, GA. Pub. No.: SEWRL-WGK/FMD-050199. Report Dated May 1, 1999 and revised August 15, 2000. 194pp.[Std]
{Krespi et al. 1991} Krespi L; Rabasse JM; Dedryver CA; Nenon JP. 1991. Effect of Three Insecticides on the Life Cycle of Aphidius uzbekistanicus Luz. (Hymenoptera, Aphidiidae). J Appl Entomol. 111 (2): 113-119. [Set 01 - ToxLine01]
{Krishnappa et al. 1999} Krishnappa H; Honnegowda; Suresh TP; Jayakumar K; Narayana K. 1999. Effect of Lambda Cyhalothrin, a Synthetic Pyrethroid Insecticide on Certain Defense Mechanisms and Immune Response in Male Rats. Indian Veterinary Journal. 76 (6): 506-510. [Set 01 - ToxLine01]
{Kumar et al. 2007} Kumar A; Sharma B; Pandey RS. 2007. Preliminary Evaluation of the Acute Toxicity of Cypermethrin and Lambda-Cyhalothrin to Channa punctatus. Bull Environ Contam Toxicol. 79(6):613-6. [Set 01 - ToxLine01]
{Kumar et al. 2008} Kumar A; Sharma B; Pandey RS. 2008. Cypermethrin and Lambda-Cyhalothrin Induced Alterations in Nucleic Acids and Protein Contents in a Freshwater Fish, Channa punctatus. Fish Physiol Biochem. 34(4):331-8. [Set 01 - ToxLine01]
{Langhof et al. 2005} Langhof M; Gathmann A; Poehling HM. 2005. Insecticide Drift Deposition on Noncrop Plant Surfaces and its Impact on Two Beneficial Nontarget Arthropods, Aphidius colemani Viereck (Hymenoptera, Braconidae) and Coccinella septempunctata L. (Coleoptera, Coccinellidae). Environ Toxicol Chem. 24(8):2045-54. [Set 01 - ToxLine01]
{Laskowski 2002} Laskowski DA. 2002. Physical and Chemical Properties of Pyrethroids. Rev Environ Contam Toxicol. 174:49-170. [Set 01 - ToxLine01]
{Latif et al. 2008} Latif MA; Razzaque MA; Rahman MM. 2008. Impact of Some Selected Insecticides Application on Soil Microbial Respiration. Pak J Biol Sci. 11(16):2018-22. [Set 01 - ToxLine01]
{Lauridsen and Friberg 2005} Lauridsen RB; Friberg N. 2005. Stream Macroinvertebrate Drift Response to Pulsed Exposure of the Synthetic Pyrethroid Lambda-Cyhalothrin. Environ Toxicol. 20(5):513-21. [Set 01 - ToxLine01]
{Laurin and Bostanian 2007} Laurin MC; Bostanian NJ. 2007. Laboratory Studies to Elucidate the Residual Toxicity of Eight Insecticides to Anystis baccarum (Acari: Anystidae). J Econ Entomol. 100(4):1210-4. [Set 01 - ToxLine01]
103
{Lawler et al. 2003} Lawler SP; Dritz DA; Godfrey LD. 2003. Effects of the Agricultural Insecticide Lambda-Cyhalothrin (Warrior) on Mosquitofish (Gambusia affinis). J Am Mosq Control Assoc. 19(4):430-2. [Set 01 - ToxLine01]
{Lawler et al. 2007} Lawler SP; Dritz DA; Christiansen JA; Cornel AJ. 2007. Effects of Lambda-Cyhalothrin on Mosquito Larvae and Predatory Aquatic Insects. Pest Manag Sci. 63(3):234-40. [Set 01 - ToxLine01]
{Lebaili et al. 2008} Lebaili N; Saadi L; Mosbah R; Mechri N. 2008. Exploration of the Cytotoxic Effects of An Insecticide, Lambda Cyhalothrine, on Sexual Exocrine Function in the White Rat. Commun Agric Appl Biol Sci. 73(4):883-9. [Set 01 - ToxLine01]
{Leistra et al. 2004} Leistra M; Zweers AJ; Warinton JS; Crum SJ; Hand LH; Beltman WH; Maund SJ. 2004. Fate of the Insecticide Lambda-Cyhalothrin in Ditch Enclosures Differing in Vegetation Density. Pest Manag Sci. 60(1):75-84. [Set 01 - ToxLine01]
{Leng et al. 1997} Leng G; Kuehn K-H; Idel H. 1997. Biological Monitoring of Pyrethroids in Blood and Pyrethroid Metabolites in Urine: Applications and Limitations. Science of the Total Environment. 199 (1-2): 173-181. [Set 01 - ToxLine01]
{Li and Harmsen 1993} Li SY; Harmsen R. 1993. Pyrethroid Lambda-Cyhalothrin-Induced Population Increase of Tetranychus urticae Koch (Acari: Tetranychidae) in An Apple Orchard. J Agric Entomol. 10 (3): 197-203. [Set 01 - ToxLine01]
{Lindsay et al. 1981} Lindsay S; Chart IS; Godley NJ. et al. 1981. 90-Day Feeding Study in Rats. U.S. EPA Accession No. 073204. DER available at: http://www.epa.gov/pesticides/foia/reviews/128897/index.htm. [Cleared Reviews]
{Liu et al. 2007} Liu TF; Sun C; Ta N; Hong J; Yang SG; Chen CX. 2007. Effect of Copper on the Degradation of Pesticides Cypermethrin and Cyhalothrin. J Environ Sci (China). 19(10):1235-8. [Set 01 - ToxLine01]
{Macedo et al. 2007} Macedo PA; Peterson RK; Davis RS. 2007. Risk Assessments for Exposure of Deployed Military Personnel to Insecticides and Personal Protective Measures Used for Disease-Vector Management. J Toxicol Environ Health A. 70(20):1758-71. [Set 01 - ToxLine01]
{Machado 2001a} Machado MW. 2001a. XDE-225 and lambda-cyhalothrin: comparative toxicity to rainbow trout (Oncorhynchus mykiss) under flow through conditions. Study No. 011056 Dow Chemical Company, Midland. As summarized in Giddings et al. 2009. [Sec]
{Machado 2001b} Machado MW. 2001b. XDE-225 and lambda-cyhalothrin: comparative toxicity to daphnids (Daphnia magna) under static-renewal conditions. Study No. 011050. Dow Chemical Company, Midland. As summarized in Giddings et al. 2009. [Sec]
{Marino and Rick 2000a} Marino TA; Rick DL. 2000a. XR-225: An acute toxicity study with the rainbow trout, Oncorhynchus mykiss Walbaum, Study No. 001073. Dow Chemical Company, Midland. As summarized in Giddings et al. 2009. [Sec]
{Marino and Rick 2000b} Marino TA; Rick DL. 2000b. XR-225: An acute toxicity study with the daphnia, Daphnia magna Strauss. Study No. 001075. Dow Chemical Company, Midland. As summarized in Giddings et al. 2009. [Sec]
{Marino and Rick 2001a} Marino TA; Rick DL. 2001a. XR-225: An acute toxicity study with the bluegill sunfish, Lepomis macrochirus Rafinesque. Study No. 001074(A). Dow Chemical Company, Midland. As summarized in Giddings et al. 2009. [Sec]
104
{Marino and Rick 2001b} Marino TA; Rick DL. 2001b. XR-225 and lambda-cyhalothrin: An acute toxicity comparison study with the bluegill sunfish, Lepomis macrochirus Rafinesque. Study No. 001074. Dow Chemical Company, Midland. As summarized in Giddings et al. 2009. [Sec]
{Martinez-Larranaga et al. 2003} Martinez-Larranaga MR; Anadoacuten A; Martiacutenez MA; Martiacutenez M; Castellano VJ; Diacuteaz MJ. 2003. 5-HT Loss in Rat Brain by Type II Pyrethroid Insecticides. Toxicol Ind Health. 19(7-10):147-55. [Set 01 - ToxLine01]
{Martinez-Larranaga et al. 2004} Martinez-Larranaga MR; Martinez M; Martinez MA; Diaz MJ; Frejo MT; Anadon A. 2004. Oral Bioavailability and Nervous Tissue Distribution of Cyhalothrin in Rats. Toxicologist 2004 Mar;78(1-S):227-8 [Set 01 - ToxLine01]
{Mathur 2002} Mathur SB. 2002. Product Chemistry Review of PP 321 Technical (Cyhalothrin). Report dated July 21, 2002. U.S. EPA/OPP, Product Chemistry Team. http://www.epa.gov/pesticides/foia/reviews/128897/index.htm [Cleared Reviews 128897-2002-07-25a.pdf]
{Maund et al. 1998} Maund SJ; Hamer MJ; Warinton JS; Kedwards TJ. 1998. Aquatic Ecotoxicology of the Pyrethroid Insecticide Lambda-Cyhalothrin: Considerations for Higher-Tier Aquatic Risk Assessment. Pesticide Science. 54 (4): 408-417. [Set 01 - ToxLine01]
{Maund et al. 2001} Maund SJ; Travis KZ; Hendley P; Giddings JM; Solomon KR. 2001. Probabilistic risk assessment of cotton pyrethroids: V. Combining landscape-level exposures and ecotoxicological effects data to characterize risks. Environ Toxicol Chem. 20(3):687-92. [Set01 – ToxLine01]
{Mayer and Ellersieck 1986} Mayer FL; Ellersieck MR. 1986. Manual of Acute Toxicity: Interpretation and Data Base for 410 Chemicals and 66 Species of Freshwater Animals. Resource Publ No. 160, U.S. Dep Interior, Fish Wildl Serv. Washington, DC: 505 p. [Std-Compendia]
{Mayer et al. 1998} Mayer DF; Kovacs G; Lunden JD. 1998. Field and Laboratory Tests on the Effects of Cyhalothrin on Adults of Apis mellifera, Megachile rotundata and Nomia melanderi. Journal of Apicultural Research. 37 (1): 33-37. [Set 01 - ToxLine01]
{Milburn et al. 1984} Milburn GM; Banham P; Godlely MJ; et al. 1984. Cyhalothrin: Three generation reproduction study in the rat. U.S. EPA Accession No. 073207-073209. DER available at: http://www.epa.gov/pesticides/foia/reviews/128897/index.htm. [Cleared Reviews]
{Mineau et al. 1994} Mineau P; Boersma DC; Collins B. 1994. An Analysis of Avian Reproduction Studies Submitted for Pesticide Registration. Ecotoxicology and Environmental Safety. 29 (3): 304-329. [Set 01 - ToxLine01]
{Mineau et al. 1996} Mineau P; Collins B; Baril A. 1996. On the Use of Scaling Factors to Improve interspecies Extrapolation of Acute Toxicity in Birds. Regul Tox Pharmacol. 24: 24-29. [Std]
{Mistretta 2007} Mistretta PA. Risk Assessment of Pesticides Proposed for Use in the Land Between the Lakes Openlands Program. Reported dated March 5, 2007. Copy courtesy of Paul A. Mistretta, USDA/Forest Service Region 8.
{Mokry and Hoagland 1990} Mokry LE; Hoagland KD. 1990. Acute Toxicities of Five Synthetic Pyrethroid Insecticides to Daphnia magna and Ceriodaphnia dubia. Environ Toxicol Chem. 9 (8): 1045-1052. [Set 01 - ToxLine01]
{Moniz et al. 1990} Moniz AC; Bernardi MM; Souza-Spinosa HS; Palermo-Neto J. 1990. Effects of Exposure to a Pyrethroid Insecticide During Lactation on the Behavior of Infant and Adult Rats. Braz J Med Biol Res. 23(1):45-8. [Set 01 - ToxLine01]
105
{Moore et al. 2001} Moore MT; Bennett ER; Cooper CM; Smith S; Shields FD; Milam CD; Farris JL. 2001. Transport and fate of atrazine and lambda-cyhalothrin in an agricultural drainage ditch in the Mississippi Delta, USA. Agric Ecosyst Environ. 87:309-314. Cited in Bennett et al. 2005. [Set03]
{Moore et al. 2002} Moore MT; Schulz R; Cooper CM; Smith S; Rodgers JH. 2002. Mitigation of chlorpyrifos runoff using constructed wetlands. Chemosphere. 46:827-835. Cited in Bennett et al. 2005. [Set03]
{Moretto 1991} Moretto A. 1991. Indoor Spraying with the Pyrethroid Insecticide Lambda-Cyhalothrin: Effects on Spraymen and Inhabitants of Sprayed Houses. Bull World Health Organ. 69(5):591-4. [Set 01 - ToxLine01]
{Moyes et al. 1984} Moyes A; Godley MJ; Hall M; et al. 1984. 28-Day feeding study in the rat. U.S. EPA Accession No. 073204. DER available at: http://www.epa.gov/pesticides/foia/reviews/128897/index.htm. [Cleared Reviews]
{Mukherjee and Gopal 1992} Mukherjee I; Gopal M. 1992. Residue Behaviour of Fenvalerate, Tau-Fluvalinate, Lambda-Cyhalothrin and Monocrotophos in Eggplant (Solanum melongena L.) Fruits. Pestic Sci. 36 (3): (1993)175-179. [Set 01 - ToxLine01]
{Naravaneni and Jamil 2005} Naravaneni R; Jamil K. 2005. Evaluation of Cytogenetic Effects of Lambda-Cyhalothrin on Human Lymphocytes. J Biochem Mol Toxicol. 19(5):304-10. [Set 01 - ToxLine01]
{Nash et al. 1982} Nash RG; Kearney PC; Maitlen JC; Sell; CR; Fertig SN. 1982. Agricultural applicators exposure to 2,4-dichlorophenoxyacetic acid. In: Pesticide Residues and Exposures. ACS. 238: 119-132. [Std]
{Nedved and Kindlmann 1991} Nedved O; Kindlmann P. 1991. Poisoning of Ladybirds by Pyrethroids. Polgar, L., Et Al. (Ed.). Behaviour and Impact of Aphidophaga. 4th Meeting of the IOBC WG Ecology of Aphidophaga, Godollo, Hungary, September 1990 350p SPB Academic Publishing BV: The Hague, Netherlands Illus ISBN 90-5103-064-9; 0 (0): 319-322. BIOSIS/92/11419. [Set 01 - ToxLine01]
{Niehoff et al. 1994} Niehoff B; Kueneke U; Klein J; Poehling HM. 1994. Impact of Different Rates of Lambda-Cyhalothrin on Spiders and Staphylinids in Winter Wheat. Mededelingen Faculteit Landbouwkundige En Toegepaste Biologische Wetenschappen Universiteit Gent. 59 (2a): 335-345. BIOSIS/95/34407. [Set 01 - ToxLine01]
{Nigg 1998} Nigg HN. 1998. Occupational Monitoring. Chapter 5 in: Occupational Hazards of Pesticide Exposure – Sampling, Monitoring, Measuring. Taylor & Francis, Philadelphia, PA. D.J. Ecobichon (Ed.), pp. 107-134. [Std-Have book]
{NIOSH 2009} NIOSH (National Institute of Occupational Safety and Health). 2009. Registry of Toxic Effects of Chemical Substances. Cyclopropanecarboxylic acid, 3 - (2 - chloro - 3,3,3 - trifluoro - 1 - propenyl) - 2,2 - dimethyl - ,cyano (3 - phenoxyphenyl) methyl ester, (1 - alpha (S*) ,3 - alpha (Z) ) - (+ - ). Summary update, February 2009. Available at: http://www.cdc.gov/niosh/rtecs/gz12bc04.html#TOLED5. [Set 00]
{NPTN 2001a} National Pesticide Telecommunications Network. 2001a. Lambda-cyhalothrin: General Fact Sheet. Date reviewed: January 2001. Available at: http://nptn.orst.edu. [Set 00]
{NPTN 2001b} National Pesticide Telecommunications Network. 2001b. Lambda-cyhalothrin: Technical Fact Sheet. Date reviewed: January 2001. Available at: http://nptn.orst.edu. [Set 00]
{NRC 1983} NRC (National Research Council). 1983. Risk assessment in the Federal government: Managing the Process. Washington, DC: National Academy Press; 176 p. + app. [Std]
106

{ORNL 2008} ORNL (Oak Ridge National Laboratory). 2008. Data Evaluation Record Lambda-Cyhalothrin Study Type: Acute Oral Toxicity - Rat [OPPTS 870.1100; OECD 423], Acute Dermal Toxicity - Rat [OPPTS 870.1200; OECD 402], Acute Inhalation Toxicity - Rat [OPPTS 870.1300; OECD 403], Acute Eye Irritation - Rabbit [OPPTS 870.2400; OECD 405], Acute Dermal Irritation - Rabbit [OPPTS 870.2500; OECD 404], Dermal Sensitization - Guinea Pig [OPPTS 870.2600; OECD 406], MRID: 47170110,47170111,47170112,47170113,47170114, and 47170115. Toxicology and Hazard Assessment Group, Environmental Sciences Division, Oak Ridge National Laboratory, Oak Ridge, TN 37831, Task Order No. 1-15. Taken from U.S. EPA/OPP 2007b. [E-Docket01]
{Oudou and Hansen 2002} Oudou HC; Hansen HC. 2002. Sorption of Lambda-Cyhalothrin, Cypermethrin, Deltamethrin and Fenvalerate to Quartz, Corundum, Kaolinite and Montmorillonite. Chemosphere. 49(10):1285-94. [Set 01 - ToxLine01]
{PAN 2009} Pesticide Action Network. 2009. Pesticide Database – Endothal. Available at: http://www.pesticideinfo. org/Index.html. [Std]
{Pan and Liang 1996} Pan Dao-Yi; Liang Xue-Ming. 1996. The Susceptibility of Marsh Frog (Tadpole) and Spiders to Pesticides and Classification of Acute Toxicity. Acta Zoologica Sinica. 42 (2): 154-160. [Set 01 - ToxLine01]
{Pauli et al. 2000} Pauli BD; Perrault JA; Money SL. 2000. RATL: A Database of Reptile and Amphibian Toxicology Literature. National Wildlife Research Centre 2000, Canadian Wildlife Service, Environmental Conservation Branch, Technical Report Series Number 357. Available at: http://dsp-psd.communication .gc.ca/Collection/CW69-5-357E.pdf. [Std-Compendia]
{PHED Task Force 1995} PHED Task Force. 1995. PHED: The Pesticide Handlers Exposure Database. Version 1.1. Health Canada, U.S. Environmental Protection Agency, and American Crop Protection Association. [Std]
{Pigott et al. 1984} Pigott GH; Chart IS; Godley MJ; et al. 1984. Cyhalothrin: Two-year feeding study in rats. U.S. EPA Accession No. 073210-073213. DER available at: http://www.epa.gov/pesticides/foia/reviews/128897/index.htm. [Cleared Reviews]
{Pilling and Jepson 1993} Pilling ED; Jepson PC. 1993. Synergism Between EBI Fungicides and a Pyrethroid Insecticide in the Honeybee (Apis mellifera). Pesticide Science. 39 (4): 293-297. [Set 01 - ToxLine01]
{Pilling and Kedwards 1996} Pilling ED; Kedwards TJ. 1996. Effects of Lambda-Cyhalothrin on Natural Enemies of Rice Insect Pests. Pests and Diseases. Vols 1-3:361-366. [Set 01 - ToxLine01]
{Pilling et al. 1995} Pilling ED; Bromley-Challenor K AC; Walker CH; Jepson PC. 1995. Mechanism of Synergism Between the Pyrethroid Insecticide Lambda-Cyhalothrin and the Imidazole Fungicide Prochloraz, in the Honeybee (Apis mellifera L.). Pesticide Biochemistry and Physiology. 51 (1): 1-11. [Set 01 - ToxLine01]
{Posthuma et al. 2002} Posthuma L; Suter GW; Trass TP. 2002. Species Sensitivity Distributions. Lewis Publishers, Boca Raton, Florida, 587 pp.[Std]
{Potter and Simmons 1998} Potter T; Simmons K. 1998. Total Petroleum Hydrocarbon Criteria Working Group Series, Volume 2: Composition of Petroleum Mixtures. Report dated May 1999. Available at: http://www.aehs.com/publications/catalog/contents/tph.htm. [Internet]
{Prasifka et al. 2008} Prasifka JR; Lopez MD; Hellmich RL; Prasifka PL. 2008. Effects of Insecticide Exposure on Movement and Population Size Estimates of Predatory Ground Beetles (Coleoptera: Carabidae). Pest Manag Sci. 64(1):30-6. [Set 01 - ToxLine01]
107
{Provost et al. 2005} Provost C; Coderre D; Lucas E; Chouinard G; Bostanian NJ. 2005. Impact of Intraguild Predation and Lambda-Cyhalothrin on Predation Efficacy of Three Acarophagous Predators. Pest Manag Sci. 61(6):532-8. [Set 01 - ToxLine01]
{Rasmussen et al. 2008} Rasmussen JJ; Friberg N; Larsen SE. 2008. Impact of Lambda-Cyhalothrin on a Macroinvertebrate Assemblage in Outdoor Experimental Channels: Implications for Ecosystem Functioning. Aquat Toxicol. 90(3):228-34. [Set 01 - ToxLine01]
{Ratnasooriya et al. 2002} Ratnasooriya WD; Ratnayake SS; Jayatunga YN. 2002. Effects of Pyrethroid Insecticide Icon (Lambda Cyhalothrin) on Reproductive Competence of Male Rats. Asian J Androl. 4(1):35-41. [Set 01 - ToxLine01]
{Ratnasooriya et al. 2003} Ratnasooriya WD; Ratnayake SS; Jayatunga YN. 2003. Effects of Icon, a Pyrethroid Insecticide on Early Pregnancy of Rats. Hum Exp Toxicol. 22(10):523-33. [Set 01 - ToxLine01]
{Regelman 1986} Emil Regelman. Exposure Assessment Branch. Review of Environmental Fate Studies. Reg. /File # 10182-OA. Request for registration on cotton. August 28, 1986. Review. 7 Page(s). http://www.epa.gov/pesticides/foia/reviews/128897/index.htm [Cleared Reviews 128897-006.pdf]
{Regelman 1987a} Regelman E. 1987a. Exposure Assessment Branch. Reg. /File # 10182-RRT. Res~nse to comments made on request for registration for use on cotton and review of additional data. September 17, 1987. Review. 3 Page(s). http://www.epa.gov/pesticides/foia/reviews/128897/index.htm [Cleared Reviews 128897-028.pdf]
{Regelman 1987b} Regelman E. 1987a. Exposure Assessment Branch. Reg. /File # 10182-RRT. Request /File # 10182-RRT. Request for review of status of data base to support use on soybeans. http://www.epa.gov/pesticides/foia/reviews/128897/index.htm. [Cleared Reviews 128897-029.pdf]
{Reichle et al. 1973} Reichle DE, Goldstein RA; Van Hook RI; Dodson DJ. 1973. Analysis of Insect Consumption in a Forest Canopy. Ecology. 54: 1076-1084. [Bees]
{Reynolds 1984a} Reynolds LF. 1984a. Cyhalothrin: Determination of Acute Toxicity to Bluegill Sunfish, Prepared by ICI, Ltd., August 1984. Submitted by Coopers Animal Health Inc., Kansas City, MO. EPA ACC No. 073221. http://www.epa.gov/pesticides/foia/reviews/128897/index.htm [Cleared Reviews 128897-032.pdf]
{Righi and Palermo-Neto 2003} Righi DA; Palermo-Neto J. 2003. Behavioral Effects of Type II Pyrethroid Cyhalothrin in Rats. Toxicol Appl Pharmacol. 191(2):167-76. [Set 01 - ToxLine01]
{Righi and Palermo-Neto 2005} Righi DA; Palermo-Neto J. 2005. Effects of Type II Pyrethroid Cyhalothrin on Peritoneal Macrophage Activity in Rats. Toxicology. 212(2-3):98-106. [Set 01 - ToxLine01]
{Righi et al. 2009} Righi DA; Xavier FG; Palermo-Neto J. 2009. Effects of Type II Pyrethroid Cyhalothrin on Rat Innate Immunity: A Flow Cytometric Study. Int Immunopharmacol. 9(1):148-52. [Set 01 - ToxLine01]
{Roberts and Fairley 1984} Roberts NL; Fairley C. 1984. PP 321: The acute oral toxicity of PP 321. to the mallard duck. EPA Accession No. 259807. http://www.epa.gov/pesticides/foia/reviews/128897/index.htm [Cleared Reviews 128897-015.pdf]
108
{Roberts et al. 1981b} Roberts NL; Fairley C; Woodhouse RN. 1981b. The Subacute Dietary Toxicity of Cyhalothrin to the Bobwhite Quail, Prepared by ICI, Ltd., July 1981. Submitted by Coopers Animal Health Inc., Kansas City, Mo. EPA Ace. No. 073221. http://www.epa.gov/pesticides/foia/reviews/128897/index.htm [Cleared Reviews 128897-031.pdf]
{Roberts et al. 1981a} Roberts NL; Fairley C; Woodhouse RN. 1981a. The Subacute Dietary Toxicity of Cyhalothrin to the Mallard Duck, by Prepared by ICI, Ltd., June 1981. Submitted by Coppers Animal Health Inc., Kansas City, Mo. EPA Acc. No. 073221. http://www.epa.gov/pesticides/foia/reviews/128897/index.htm [Cleared Reviews 128897-030.pdf]
{Roberts et al. 1982a} Roberts NL; Fairley C; Chanter DO; McAllister A; Almond RH. 1982a. The Effect of the Dietary Inclusion of Cyhalothrin on Reproduction in the Mallard Duck. Prepared by Huntingdon Research Centre, Huntingdon, Cambridgeshire, submitted by ICI Americas, Inc., RPA Accession No. 073989. http://www.epa.gov/pesticides/foia/reviews/128897/index.htm [Cleared Reviews 128897-043.pdf]
{Roberts et al. 1982b} Roberts NL; Fairley C; Chanter DO; McAllister A; Almond RH. 1982b. The Effect of the Dietary Inclusion of Cyhalothrin on Reproduction in the Bobwhite Quail. Prepared by Huntingdon Research Centre, Huntingdon, Cambridgeshire, submitted by ICI Americas, Inc., RPA Accession No. 073989. http://www.epa.gov/pesticides/foia/reviews/128897/index.htm [Cleared Reviews 128897-044.pdf]
{Roberts et al. 1982c} Roberts NL; Fairley C; Chanter DO; McAllister A; Woodhouse RN. 1982. The Effect of the Dietary Inclusion of Cyhalothrin on Reproduction in the Bobwhite Quail. Prepared by ICI, Ltd., July 1981. Submitted by Coopers Animal Health Inc., Kansas City, Mo. EPA Ace. No. 073989. http://www.epa.gov/pesticides/foia/reviews/128897/index.htm [Cleared Reviews 128897-058.pdf]
{Roberts et al. 1985a} Roberts N; Fairley C; Anderson A; Dawe I. 1985a. PP 321: The subacute dietary toxicity of PP 321 to the bobwhite quail, ICI, March 28, 1985. EPA Accession No. 259807. http://www.epa.gov/pesticides/foia/reviews/128897/index.htm [Cleared Reviews 128897-014.pdf]
{Roberts et al. 1985b} Roberts N; Fairley C; Anderson A; Dawe I. 1985b. PP 321: The subacute dietary toxicity of PP 321 to the mallard duck. ICI, March 29, 1985, EPA Accession No. 259807. http://www.epa.gov/pesticides/foia/reviews/128897/index.htm [Cleared Reviews 128897-007.pdf]
{Roberts et al. 1985c} Roberts N; Fairley C; Anderson A; Dawe I. 1985c. Amendment to DER Bobwhite Reproduction Study on Cyhalothrin. http://www.epa.gov/pesticides/foia/reviews/128897/index.htm [Cleared Reviews]
{Roessink et al. 2005} Roessink I; Arts GH; Belgers JD; Bransen F; Maund SJ; Brock TC. 2005. Effects of Lambda-Cyhalothrin in Two Ditch Microcosm Systems of Different Trophic Status. Environ Toxicol Chem. 24(7):1684-96. [Set 01 - ToxLine01]
{Roessink et al. 2008} Roessink I; Koelmans AA; Brock TC. 2008. Interactions Between Nutrients and Organic Micro-Pollutants in Shallow Freshwater Model Ecosystems. Sci Total Environ. 406(3):436-42. [Set 01 - ToxLine01]
{Ruan et al. 2009} Ruan QL; Ju JJ; Li YH; Liu R; Pu YP; Yin LH; Wang DY. 2009. Evaluation of Pesticide Toxicities with Differing Mechanisms Using Caenorhabditis elegans. J Toxicol Environ Health A. 72(11):746-51. [Set 01 - ToxLine01]
{Sanders 1969} Sanders HO. 1969. Toxicity of Pesticides to the Crustacean Gammarus lacustris. Tech. Pap. No. 25, U.S.D.I., Bur. Sports Fish. Wildl., Fish Wildl. Serv., Washington, DC :18 p. [Std-Compendia]
{Sanders 1970b} Sanders HO. 1970b. Toxicities of Some Herbicides to Six Species of Freshwater Crustaceans. J Water Pollut Control Fed. 24(8): 1544-1550 [Std-Compendia]
109
{Schramm et al. 1998} Schramm M; Mueller E; Triebskorn R. 1998. Brown Trout (Salmo trutta F. Fario) Liver Ultrastructure as a Biomarker for Assessment of Small Stream Pollution. Biomarkers. 3 (2): 93-108. [Set 01 - ToxLine01]
{Schroer et al. 2004} Schroer AF; Belgers JD; Brock TC; Matser AM; Maund SJ; Van Den Brink PJ. 2004. Comparison of Laboratory Single Species and Field Population-Level Effects of the Pyrethroid Insecticide Lambda-Cyhalothrin on Freshwater Invertebrates. Arch Environ Contam Toxicol. 46(3):324-35. [Set 01 - ToxLine01]
{Seenivasan and Muraleedharan 2009} Seenivasan S; Muraleedharan NN. 2009. Residues of Lambda-Cyhalothrin in Tea. Food Chem Toxicol. 47(2):502-5. [Set 01 - ToxLine01]
{SERA 2007a} SERA (Syracuse Environmental Research Associates, Inc.). 2007a. Preparation of Environmental Documentation and Risk Assessments, SERA MD 2007-01a, draft dated January 21, 2007. Syracuse Environmental Research Associates, Inc., Fayetteville, NY. Available at www.sera-inc.com. [Std]
{SERA 2007b} SERA (Syracuse Environmental Research Associates, Inc.). 2007b. Gleams-Driver User Guide (Version 1.8). SERA TR 07-52-05-08a. Report dated December 31, 2007. Available at: www.sera-inc.com. [Std]
{SERA 2007c} SERA (Syracuse Environmental Research Associates, Inc.). 2007c. Aminopyralid - Human Health and Ecological Risk Assessment - Final Report. SERA TR-052-04-04a. Report dated June 28, 2007. Available at: http://www.fs.fed.us/foresthealth/pesticide/risk.shtml. [Std]
{SERA 2009a} SERA (Syracuse Environmental Research Associates, Inc.). 2009a. WorksheetMaker Version 5.00, User Guide. SERA TR-052-12-01h. Report dated September 12, 2009. Available at: www.sera-inc.com. [Std]
{SERA 2009b} SERA (Syracuse Environmental Research Associates, Inc.). 2009b. Carbaryl Human Health and Ecological Risk Assessment. SERA TR-052-01-05c dated July 27, 2009. Available at: http://www.fs.fed.us/foresthealth/pesticide/risk.shtml. [Std]
{Sheets et al. 2006} Sheets LP; Sargent DE; Nemec M; Breckenridge C; Creek MR; Mullin LS; Sharp J; Weiner ML. 2006. A Functional Observational Battery (FOB) Comparison Study of 12 Pyrethroids in Rats. Toxicol Sci. 90(1-S):10 [Set 01 - ToxLine01]
{Smith S and Lizotte Re 2007} Smith S Jr; Lizotte Re Jr. 2007. Influence of Selected Water Quality Characteristics on the Toxicity of Lambda-Cyhalothrin and Gamma-Cyhalothrin to Hyalella azteca. Bull Environ Contam Toxicol. 79(5):548-51. [Set 01 - ToxLine01]
{Solomon et al. 2001} Solomon KR; Giddings JM; Maund SJ. 2001. Probabilistic Risk Assessment of Cotton Pyrethroids: I. Distributional Analyses of Laboratory Aquatic Toxicity Data. Environ Toxicol Chem. 20(3):652-9. [Set 01 - ToxLine01]
{Spencer and O'Malley 2006} Spencer J; O'Malley M. 2006. Pyrethroid Illnesses in California, 1996-2002. Rev Environ Contam Toxicol. 186:57-72. [Set 01 - ToxLine01]
{Suarez 2006} Suarez MS. 2006. Product Performance/Efficacy Review, TC 253. U.S. EPA/OPP. http://www.epa.gov/pesticides/foia/reviews/128897/index.htm [Cleared Reviews 128897-2006-11-02a.pdf]
{Suarez 2007} Suarez MS. Product Performance/Efficacy Review, TC 253. U.S. EPA/OPP. http://www.epa.gov/pesticides/foia/reviews/128897/index.htm [Cleared Reviews 128897-2007-04-30a.pdf]
110
{Sucahyo et al. 2008} Sucahyo D; Van Straalen NM; Krave A; Van Gestel CA. 2008. Acute Toxicity of Pesticides to the Tropical Freshwater Shrimp Caridina laevis. Ecotoxicol Environ Saf. 69(3):421-7. [Set 01 - ToxLine01]
{Sweeney 2001} Sweeney K. 2001. Insecticides Branch. Efficacy Study Review. EPA File Symbol: 100-RREL & 100-EUP-111. Product Name: IMPASSE barrier. MRID: 45229501, 45241701, 45241702. Report dated April 30, 2001. http://www.epa.gov/pesticides/foia/reviews/128897/index.htm [Cleared Reviews 128897-2001-04-30a.pdf]
{Tapp and Smith 1990a} Tapp JF; Smith CA. 1990a. ICI. Response to the July 26, 1990 EEB Review of the PP321 Fish Life Cycle Study. ICI Group Environmental Laboratory, Brixham, Devon, United Kingdom. ICI Volume 62, ICI Report No. BL/B/3476, MRID 415.19001. http://www.epa.gov/pesticides/foia/reviews/128897/index.htm [Cleared Reviews 128897-092.pdf]
{Tapp and Smith 1990b} Tapp JF; Smith CA. 1990b. ICI Response to the July 26, 1990 EEB Review of the PP321 Fish Life Cycle Study. ICI Group Environmental Laboratory, Brixham, Devon, united Kingdom. ICI Volume 62, ICI Report No. BL/B/3476, MRID 41519001. http://www.epa.gov/pesticides/foia/reviews/128897/index.htm [Cleared Reviews 128897-091.pdf]
{Tapp et al. 1990} Tapp JF; Maddock BG; Gillings BJ. 1990. Lambda-cyhalothrin (Karate PP 321): Determination of chronic toxicity to fathead minnow {Pimephales promelas full life cycle 1989, performed by Imperial Chemical Industries PLC, Brixham Lab, UK. Submitted by ICI Americas,. Inc. June 1990. MRID No. 415190-01. http://www.epa.gov/pesticides/foia/reviews/128897/index.htm [Cleared Reviews 128897-067.pdf]
{Thompson 1985a} Thompson RS. 1985a. PP321: Determination of Acute Toxicity to Mysid Shrimp (Mysidopsis bahia). Submitted by lCI Americas, Inc. Prepared by Brixham Laboratories. EPA Accession No. 073989. http://www.epa.gov/pesticides/foia/reviews/128897/index.htm [Cleared Reviews 128897-021.pdf]
{Thompson 1987} Thompson RS. 1987. PP 321 (Lambda Cyhalothrin) Determination of Chronic Toxicity to mysid shrimps (Mysidopsis bahia). prepared by: ICI PLC Brixham Laboratory. Submitted by ICI America, Inc. http://www.epa.gov/pesticides/foia/reviews/128897/index.htm [Cleared Reviews 128897-046.pdf]
{Thompson and Williams 1985a} Thompson RS; Williams TD. 1985a. PP321 Toxicity to the Green Algae Selenastrum capricornutum. Submitted by Imperial Chemical Industries PLC, Brixham, Devon. EPA Accession No. 073989. http://www.epa.gov/pesticides/foia/reviews/128897/index.htm [Cleared Reviews 128897-034.pdf]
{Tinston et al. 1984} Tinston OJ; Banham PB, Chart IS Core CW; Pratt I, Scales MDC; Weight TM. 1984. PP563: 2B-Day Feeding Study in Rats - Summary Report. ICI PLC Plant Protection Division, UK. http://www.epa.gov/pesticides/foia/reviews/128897/index.htm [Cleared Reviews 128897-097.pdf]
{Tomlin 2004a} Tomlin C. 2004a. The e-Pesticide Manual, Thirteenth Edition, Crop Protection Publications; British Crop Protection Council. Lambda-cyhalothrin, Available at: http://www.bcpcbookshop.co.uk.[Std]
{Tomlin 2004b} Tomlin C. 2004a. The e-Pesticide Manual, Thirteenth Edition, Crop Protection Publications; British Crop Protection Council. Gamma-cyhalothrin, Available at: http://www.bcpcbookshop.co.uk.[Std]
{Travis and Hendley 2001} Travis KZ; Hendley P. 2001. Probabilistic risk assessment of cotton pyrethroids: IV. Landscape-level exposure characterization. Environ Toxicol Chem. 20(3): 679-86. [Set 01 - ToxLine01]
111
{U.S. EPA/EFED 1987a} U.S. EPA/EFED (Environmental Fate and Effects Division of U.S. Environmental Protection Agency, Office of Pesticide Programs). 1987a. Ecological Effects Branch Review. Document dated November 3, 1987. http://www.epa.gov/pesticides/foia/reviews/128897/index.htm [Cleared Reviews 128897-036.pdf]
{U.S. EPA/EFED 1987b } U.S. EPA/EFED (Environmental Fate and Effects Division of U.S. Environmental Protection Agency, Office of Pesticide Programs). 1987b. Summary of Ecological Effects Branch Review. Document dated November 16, 1987. http://www.epa.gov/pesticides/foia/reviews/128897/index.htm [Cleared Reviews 128897-037.pdf]
{U.S. EPA/EFED 1987c } U.S. EPA/EFED (Environmental Fate and Effects Division of U.S. Environmental Protection Agency, Office of Pesticide Programs) 1987c. Ecological Effects Branch Review Karate (PP321). http://www.epa.gov/pesticides/foia/reviews/128897/index.htm [Cleared Reviews 128897-1987-11-16a.pdf]
{U.S. EPA/EFED 1987d } U.S. EPA/EFED (Environmental Fate and Effects Division of U.S. Environmental Protection Agency, Office of Pesticide Programs). 1987d. Registration for Karate for Domestic Uses In /Around Buildings and Other Structures. Document dated November 16, 1987 http://www.epa.gov/pesticides/foia/reviews/128897/index.htm [Cleared Reviews 128897-038.pdf]
{U.S. EPA/EFED 1987e} U.S. EPA/EFED (Environmental Fate and Effects Division of U.S. Environmental Protection Agency, Office of Pesticide Programs). 1987e. Comments on summary of meeting with ICI to discuss previous data review. Document dated November 2, 1987. http://www.epa.gov/pesticides/foia/reviews/128897/index.htm [Cleared Reviews 128897-039.pdf]
{U.S. EPA/EFED 1988} U.S. EPA/EFED (Environmental Fate and Effects Division of U.S. Environmental Protection Agency, Office of Pesticide Programs) 1988. Revised Ecological Effects Branch Review Karate (PP321). http://www.epa.gov/pesticides/foia/reviews/128897/index.htm [Cleared Reviews 128897-1988-03-17a.pdf]
{U.S. EPA/EFED 1989a} U.S. EPA/EFED (Environmental Fate and Effects Division of U.S. Environmental Protection Agency, Office of Pesticide Programs) 1989a. Amendment to DER Bioaccumulation of cyhalothrin in carp. http://www.epa.gov/pesticides/foia/reviews/128897/index.htm [Cleared Reviews 128897-059.pdf]
{U.S. EPA/EFED 1990a} U.S. EPA/EFED (Environmental Fate and Effects Division of U.S. Environmental Protection Agency, Office of Pesticide Programs) 1990a. Evaluation of Mesocosm Study (see Roberts et al. 1982). http://www.epa.gov/pesticides/foia/reviews/128897/index.htm [Cleared Reviews 28897-065.pdf]
{U.S. EPA/EFED 1990b} U.S. EPA/EFED (Environmental Fate and Effects Division of U.S. Environmental Protection Agency, Office of Pesticide Programs) 1990b. Memorandum Discuss Results of Karate Mesocosm Data (see Roberts et al. 1982). http://www.epa.gov/pesticides/foia/reviews/128897/index.htm [Cleared Reviews 28897-066.pdf]
{U.S. EPA/EFED 1990c} U.S. EPA/EFED (Environmental Fate and Effects Division of U.S. Environmental Protection Agency, Office of Pesticide Programs) 1990c. EFED Review of Fathead Minnow and Mallard Reproduction Studies. Memorandum dated August 20, 1990. http://www.epa.gov/pesticides/foia/reviews/128897/index.htm [Cleared Reviews 128897-070.pdf]
{U.S. EPA/EFED 1991a} U.S. EPA/EFED (Environmental Fate and Effects Division of U.S. Environmental Protection Agency, Office of Pesticide Programs) 1991a. EFED Review of Daphnia Life-Cycle and Mallard Reproduction Studies. Memorandum dated March 19, 1990. http://www.epa.gov/pesticides/foia/reviews/128897/index.htm [Cleared Reviews 128897-071.pdf]
112
{U.S. EPA/EFED 1992a} U.S. EPA/EFED (Environmental Fate and Effects Division of U.S. Environmental Protection Agency, Office of Pesticide Programs) 1992a. FAP#OH5599. Lambda-cyhalothrin in/on Imported Dried Hops. Amendment dated 1/31/92. http://www.epa.gov/pesticides/foia/reviews/128897/index.htm [Cleared Reviews 128897-077.pdf]
{U.S. EPA/EFED 1994a} U.S. EPA/EFED (Environmental Fate and Effects Division of U.S. Environmental Protection Agency, Office of Pesticide Programs) 1994a. EFED Position on Risk from Cyhalothrin on Ornamental and Turf Use Sites. Memorandum dated July 20, 1994. http://www.epa.gov/pesticides/foia/reviews/128897/index.htm [Cleared Reviews 128897-098.pdf]
{U.S. EPA/EFED 1994b} U.S. EPA/EFED (Environmental Fate and Effects Division of U.S. Environmental Protection Agency, Office of Pesticide Programs) 1994b. EFED Position on Risk from Cyhalothrin on Ornamental and Turf Use Sites. http://www.epa.gov/pesticides/foia/reviews/128897/index.htm [Cleared Reviews 128897-099.pdf]
{U.S. EPA/EFED 1994c} U.S. EPA/EFED (Environmental Fate and Effects Division of U.S. Environmental Protection Agency, Office of Pesticide Programs) 1994c. PP#'s 7F356017H5543 (Lambda-cyhalothrin onion Wheat, Sweet Corn, Sunflowers). http://www.epa.gov/pesticides/foia/reviews/128897/index.htm [Cleared Reviews 128897-102.pdf]
{U.S. EPA/EFED 1994d} U.S. EPA/EFED (Environmental Fate and Effects Division of U.S. Environmental Protection Agency, Office of Pesticide Programs) 1994d. PP#'s 9F3770 and 7F3560. Cyhalothrin. Anticipated Residues for Dietary Risk Assessment. CBTS#'s 14,274, 14,415, and 14,558. MRID#'s 433308-00, 433308-01, 434034-00, and 434034-01. http://www.epa.gov/pesticides/foia/reviews/128897/index.htm [Cleared Reviews 28897-103.pdf]
{U.S. EPA/EFED 1996a} U.S. EPA/EFED (Environmental Fate and Effects Division of U.S. Environmental Protection Agency, Office of Pesticide Programs) 1996a. Zeneca Request for New Microencapsulated Formulation of Lambda Cyhalothrin: KARATE CS Insecticide (D223935). EFED memorandum dated July 1, 1996. http://www.epa.gov/pesticides/foia/reviews/128897/index.htm [Cleared Reviews 128897-1996-07-01a.pdf]
{U.S. EPA/EFED 1997} U.S. EPA/EFED (Environmental Fate and Effects Division of U.S. Environmental Protection Agency, Office of Pesticide Programs) 1997. Review Data On Release Rate Of AI From Capsules Compares Effects of CS and EC Formulations Of Lambda-Cyhalothrin on Arthropods. Analysis dated April 23, 1997. http://www.epa.gov/pesticides/foia/reviews/128897/index.htm [Cleared Reviews 128867-023.pdf]
{U.S. EPA/EFED 1998} U.S. EPA/EFED (U.S. Environmental Protection Agency/Environmental Fate and Effects Division). 1998. Guidelines for Ecological Risk Assessment. Final EPA/630/R-95/002F. Dated April 1998. [Std]
{U.S. EPA/EFED 2001} U.S. EPA/EFED (U.S. Environmental Protection Agency/Environmental Fate and Effects Division) Ecological Risk Assessor Orientation Package. Draft Version August 2001. Prepared by Brian Montague, Ecological Fate and Effects Division (EFED), Office of Pesticide Programs, U.S. Environmental Protection Agency.[Std]
{U.S. EPA/HED U.S. EPA/1997a} HED (U.S. Environmental Protection Agency/Health Effects Division) 1997a. Synthetic Pyrethroids - Revised Report of the Hazard Identification Assessment Review Committee. Report dated November 14, 1997. http://www.epa.gov/pesticides/foia/reviews/128897/index.htm [Cleared Reviews 128867-024.pdf]
{U.S. EPA
113
/HED 1997b} U.S. EPA/HED (U.S. Environmental Protection Agency/Health Effects Division) 1997b. Risk Assessment for Extension of Tolerances for Synthetic Pyrethoids. Report dated November 14, 1997. http://www.epa.gov/pesticides/foia/reviews/128897/index.htm. [Cleared Reviews 128897-109.pdf]
{U.S. EPA/HED 1997c} U.S. EPA/HED (U.S. Environmental Protection Agency/Health Effects Division) 1997c. Attachment 8 in HED 1997b. Cyhalothrin Toxicology and Residue Chemistry Details. Report dated November 14, 1997. http://www.epa.gov/pesticides/foia/reviews/128897/index.htm. [Cleared Reviews 128897-109.pdf]
{U.S. EPA/HED 2001a} U.S. EPA/HED (U.S. Environmental Protection Agency/Health Effects Division). 2001a. Lambda Cyhalothrin 21-Day Dermal Toxicity Study in the Rat. Not otherwise identified by study authors and organization. MRID 44333802. http://www.epa.gov/pesticides/foia/reviews/128897/index.htm [Cleared Reviews 128897-2001-04-09a.pdf]
{U.S. EPA/HED 2002} U.S. EPA/HED (U.S. Environmental Protection Agency/Health Effects Division). 2002. Cyhalothrin and Lambda- 4th Report of the Hazard Identification Assessment Review Committee. Report dated September 12, 2002. http://www.epa.gov/pesticides/foia/reviews/128897/index.htm [Cleared Reviews 128897-2002-09-12a.pdf]
{U.S. EPA/OPP 1988a} U.S. EPA/OPP (U.S. Environmental Protection Agency/Office of Pesticide Programs). 1988a. Revised Ecological Effects Branch Review: Karate (PP32l). [Set00]
{U.S. EPA/OPP 1992a} U.S. EPA/OPP (U.S. Environmental Protection Agency/Office of Pesticide Programs). 1992a. Current RfD for Cyhalothrin/lambda-cyhalothrin. Document dated 8/21/1992. Document available at: http://www.epa.gov/pesticides/foia/reviews/128897/index.htm [Cleared Reviews]
{U.S. EPA/OPP 2002a} U.S. EPA/OPP (U.S. Environmental Protection Agency/Office of Pesticide Programs). 2002a. Lambda-cyhalothrin; Pesticide Tolerance, U.S. Environmental Protection Agency, Federal Register Docket ID No. DOCID:fr27se02-18, Federal Register: September 27, 2002, (Volume 67, Number 188), Rules and Regulations, pages 60902–60915, Federal Register Online (http://www.epa.gov/EPA-PEST/2002/September/Day-27/p24486.htm) [Set 00]
{U.S. EPA/OPP 2003a} U.S. EPA/OPP (U.S. Environmental Protection Agency/Office of Pesticide Programs). 2003a. User’s Manual for Swimmer Exposure Assessment Model (SWIMODEL) Version 3.0. U.S. EPA/OPP Antimicrobials Division. Available at: http://www.epa.gov/oppad001/swimodel.htm. [Std]
{U.S. EPA/OPP 2003b} U.S. EPA/OPP (U.S. Environmental Protection Agency/Office of Pesticide Programs). 2003b. Lambda-cyhalothrin; Pesticide Tolerances for Emergency Exemptions. Federal Register: January 3, 2003. Volume 68, Number 2, pages 283-291. Available at: http://www.epa.gov/EPA-PEST/2003/January/Day-03/p006.htm. [Set 00]
{U.S. EPA/OPP 2004a} U.S. EPA/OPP (U.S. Environmental Protection Agency/Office of Pesticide Programs). 2004a. Lambda-cyhalothrin and an Isomer Gamma-cyhalothrin; Tolerances for Residues, U.S. Environmental Protection Agency, Federal Register Docket ID No. DOCID:fr08ap04-9, Federal Register: April 8, 2004 (Volume 69, Number 68), Rules and Regulations, pages 18480–18489, Federal Register Online (http://www.epa.gov/EPA-PEST/2004/April/Day-08/p7979.htm) [Set 00]
{U.S. EPA/OPP 2004b} U.S. EPA/OPP (U.S. Environmental Protection Agency/Office of Pesticide Programs). 2004a. Manufacturing Use Label for Lambda-cyhalothrin for Syngenta Crop Protection, Inc. [Set 00]
{U.S. EPA/OPP 2005a} U.S. EPA/OPP (U.S. Environmental Protection Agency/Office of Pesticide Programs). 2005a. Manufacturing Use Label for Lambda-cyhalothrin for United Phosphorus Inc. [Set 00]
114
{U.S. EPA/OPP 2006a} U.S. EPA/OPP (U.S. Environmental Protection Agency/Office of Pesticide Programs). 2006a. Manufacturing Use Label for Lambda-cyhalothrin for LG Life Sciences, Ltd. [Set 00]
{U.S. EPA/OPP 2007a} U.S. EPA/OPP (U.S. Environmental Protection Agency/Office of Pesticide Programs). 2007a. Lambda-Cyhalothrin; Pesticide Tolerance. Federal Register. 72(157): 45656-45663. [Set 00]
{U.S. EPA/OPP 2007b} U.S. EPA/OPP (U.S. Environmental Protection Agency/Office of Pesticide Programs). 2007b. Registration jacket for Lambda-Cyhalothrin TC, EPA Reg. No. 74530-23. EPA-HQ-OPP-2007-1024-0507. Available at: http://www.regulations.gov/search/Regs/home.html#documentDetail?R=0900006480a04ab2. [E-Docket01]
{U.S. EPA/OPP 2007c} U.S. EPA/OPP (U.S. Environmental Protection Agency/Office of Pesticide Programs). 2007c. Revised Reregistration Eligibility Decision for Aliphatic Solvents. Document dated November 29, 2007. Available at: http://www.epa.gov/pesticides/reregistration/status.htm. [Internet]
{U.S. EPA/OPP 2008a} U.S. EPA/OPP (U.S. Environmental Protection Agency/Office of Pesticide Programs). 2008a. Sodium Lauryl Sulfate. Human Health Risk Assessment to Support Proposed Exemption from the Requirement of a Tolerance When Used as an Inert Ingredient in Pesticide Formulations. EPA-HQ-OPP-2008-0041-0004.pdf. Available at: http://www.regulations.gov/search/Regs/home.html#documentDetail?R=0900006480a01bbd. [E-Docket01]
{U.S. EPA/OPP 2009a} U.S. EPA/OPP (U.S. Environmental Protection Agency/Office of Pesticide Programs). 2000a. Manufacturing Use Label for Lambda-cyhalothrin for Syngenta Crop Protection, Inc. [Set00]
{U.S. EPA/OPP 2009b} U.S. EPA (U.S. Environmental Protection Agency/Office of Pesticide Programs). 2009. Inert Ingredients Permitted for Use in Nonfood Use Pesticide Products Last Updated January 27, 2009. Available at: http://www.epa.gov/opprd001/inerts/inert_nonfooduse.pdf. [Std]
{U.S. EPA/OPP 2009c} U.S. EPA/OPP (U.S. Environmental Protection Agency/Office of Pesticide Programs). 2009c. Draft Science Policy Paper, Proposed Common Mechanism Grouping for the Pyrethrins and Synthetic Pyrethroids, May 19, 2009. Available at: http://www.regulations.gov/search/Regs/home.html#documentDetail?R=09000064809a62df. [E-Docket01]
{U.S. EPA/OPPTS 2003} U.S. EPA/OPPT (U.S. Environmental Protection Agency/Office of Pollution Prevention and Toxic Substances). 2003. Label Review Manual. EPA 735-B-03-001. August 2003. [Std]
{U.S. EPA/ORD 1988} U.S. EPA/ORD (United States Environmental Protection Agency, Office of Research and Development). 1988. Integrated Risk Information System (IRIS): Cyhalothrin/Karate (CASRN 68085-85-8). Available on line at: http://www.epa.gov/ncea/iris/subst/0279.htm. [Set 00]
{U.S. EPA/ORD. 1989} U.S. EPA (U.S. Environmental Protection Agency). 1989. Exposure Factors Handbook. U.S. EPA, Office of Health and Environmental Assessment, Office of Research and Development, Washington, DC. EPA/600/8-89/043. [pagination not continuous]. [Std]
{U.S. EPA/ORD 1992} U.S. EPA/ORD (U.S. Environmental Protection Agency/Office of Research and Development). 1992. Dermal Exposure Assessment: Principles and Applications. EPA/600/8-91/011B. Interim Report. Exposure Assessment Group, Office of Health and Environmental Assessment, Washington, DC. Available at: http://cfpub.epa.gov/ncea/cfm/recordisplay.cfm?deid=12188. [Std]
115
{U.S. EPA/ORD 1993} U.S. EPA/ORD (U.S. Environmental Protection Agency/Office of Research and Development). 1993. Wildlife Exposure Factors Handbook. Volumes 1 and 2. EPA/600/R-93/187a,b. Pagination not continuous. NTIS PB94-174778 and PB94-174779. Available at: http://rais.ornl.gov/homepage. [Std]
{U.S. EPA/ORD 2009} U.S. EPA/ORD (United States Environmental Protection Agency, Office of Research and Development). 2009. ECOTOX Database. Available on line at: http://cfpub.epa.gov/ecotox/[Std]
{USDA/APHIS. 1993} USDA/APHIS (U.S. Department of Agriculture Animal and Plant Health Inspection Service). 1993. Nontarget Risk Assessment for the MEDFLY Cooperative Eradication Program. USDA Animal and Plant Health Inspection Service. February 1993.[Std]
{USDA/ARS 1999} USDA/ARS (U.S. Department of Agriculture/Agricultural Research Station). 1995. ARS Pesticide Properties Database. Available at: http://www.ars.usda.gov/Services/docs.htm?docid=14147. Listing for endothall last updated May, 1995 [Std]
{USDA/FS 1997} USDA/FS (U.S. Department of Agriculture/ Forest Service). 1997. Pest Management for Foresthill Forest Genetics Center - Environmental Assessment. USDA Forest Service, Pacific Southwest Region, Tahoe National Forest. Decision Notice signed August 28, 1997. Copy courtesy of Dave Bakke, USDA/Forest Service. [SET00]
{USDA/FS 1998} USDA/FS (U.S. Department of Agriculture/ Forest Service). 1998. Final Environmental Impact Statement - Pest Management for Chico Genetic Resource Center. USDA Forest Service, Pacific Southwest Region, Mendocino National Forest. Record of Decision signed April 9, 1998. Copy courtesy of Dave Bakke, USDA/Forest Service. [SET00]
{USGS. 2003} USGS (U.S. Geological Survey). 2003. Pesticide Use Maps for 2002. Available at: http://water.usgs.gov/nawqa/pnsp/usage/maps/. [Std]
{van Hemmen 1992} van Hemmen JJ. 1992. Agricultural pesticide exposure data bases for risk assessment. Rev. Environ. Contam. Toxicol. 126: 1-85. [Std]
{van Wijngaarden et al. 2004} van Wijngaarden RP; Cuppen JG; Arts GH; Crum SJ; van den Hoorn MW; van den Brink PJ; Brock T. 2004. Aquatic Risk Assessment of a Realistic Exposure to Pesticides Used in Bulb Crops: A Microcosm Study. Environ Toxicol Chem. 23(6):1479-98. [Set 01 - ToxLine01]
{van Wijngaarden et al. 2006} van Wijngaarden RP; Brock TC; Van Den Brink PJ; Gylstra R; Maund SJ. 2006. Ecological Effects of Spring and Late Summer Applications of Lambda-Cyhalothrin on Freshwater Microcosms. Arch Environ Contam Toxicol. 50(2):220-39. [Set 01 - ToxLine01]
{van Wijngaarden et al. 2009} van Wijngaarden RP; Barber I; Brock T. 2009. Effects of the Pyrethroid Insecticide Gamma-Cyhalothrin on Aquatic Invertebrates in Laboratory and Outdoor Microcosm Tests. Ecotoxicology. 18(2):211-24. [Set 01 - ToxLine01]
{Vickers and Bewick 1986} Vickers JA; Bewick DW. 1986. PP321: Adsorption and desorption in soil. Submitted by ICI Americas Inc. Wilmington, DL. Acc. No. 400524-06. http://www.epa.gov/pesticides/foia/reviews/128897/index.htm [Cleared Reviews 128897-025.pdf]
{Waldbauer 1968} Waldbauer GP. 1968. The consumption and utilization of food by insects. Advan Insect Physiol. 5: 229-288. [Bees]
116
{Wang et al. 2007} Wang W; Cai DJ; Shan ZJ; Chen WL; Poletika N; Gao XW. 2007. Comparison of the Acute Toxicity for Gamma-Cyhalothrin and Lambda-Cyhalothrin to Zebra Fish and Shrimp. Regul Toxicol Pharmacol. 47(2):184-8. [Set 01 - ToxLine01]
Wauchope RB. 1978. The pesticide content of surface water draining from agricultural fields: A review. J Environ Qual. 7:459-472. Cited in Bennett et al. 2005. [Set03]
{Wendt-Rasch et al. 2004} Wendt-Rasch L; Van Den Brink PJ; Crum SJ; Woin P. 2004. The Effects of a Pesticide Mixture on Aquatic Ecosystems Differing in Trophic Status: Responses of the Macrophyte Myriophyllum Spicatum and the Periphytic Algal Community. Ecotoxicol Environ Saf. 57(3):383-98. [Set 01 - ToxLine01]
{Weston et al. 2004} Weston DP; You J; Lydy MJ. 2004. Distribution and Toxicity of Sediment-Associated Pesticides in Agriculture-Dominated Water Bodies of California's Central Valley. Environ Sci Technol. 38(10):2752-9. [Set 01 - ToxLine01]
{Weston et al. 2008} Weston DP; Zhang M; Lydy MJ. 2008. Identifying the Cause and Source of Sediment Toxicity in An Agriculture-Influenced Creek. Environ Toxicol Chem. 27(4):953-62. [Set 01 - ToxLine01]
{WHO 1990a} WHO (World Health Organization). 1990a. Cyhalothrin. Environmental Health Criteria , 99. Available at: http://www.fluoridealert.org/pesticides/cyhalothrin.ipcsreview.1999.htm [HAVE - ToxLine01]
{WHO 1990b} WHO (World Health Organization). 1990b. Environmental Health Criteria for Tetramethrin Cyhalothrin and Deltamethrin. Environ Health Criter. 97 (0): 10-133. Available at: http://www.inchem.org/documents/ehc/ehc/ehc97.htm [HAVE - ToxLine01]
{Wimmer et al. 1993} Wimmer MJ; Smith RK; Wallinga DI; Toney SR; Faber DC; Miracle JE; Carnes JT; Rutherford AB. 1993. Persistence of Diflubenzuron on Appalachian Forest Leaves after Aerial Application of Dimilin. J Agric Food Chem. 41: 2184-2190. [Std]
{Winston 1987} Winston ML. 1987. The Biology of the Honey Bee. Harvard University Press, Cambridge, MA. ISBN 0-674-07409-2 280 pp. [Std]
{Wolansky et al. 2006} Wolansky MJ; Gennings C; Crofton KM. 2006. Relative Potencies for Acute Effects of Pyrethroids on Motor Function in Rats. Toxicol Sci. 89(1):271-7. [Set 01 - ToxLine01]
{Wood 2009a} Wood A. 2009a. Lambda-cyhalothrin entry at Compendium of Pesticide Common Names. Available at: http://www.alanwood.net/pesticides/index.html. [Set00]
{Wood 2009b} Wood A. 2009b. Gamma-cyhalothrin entry at Compendium of Pesticide Common Names. Available at: http://www.alanwood.net/pesticides/index.html. [Set00]
{Wright C et al. 1988} Wright C DP; Forshaw PJ; Ray DE. 1988. Classification of the Actions of Ten Pyrethroid Insecticides in the Rat Using the Trigeminal Reflex and Skeletal Muscle as Test Systems. Pestic Biochem Physiol. 30 (1): 79-86. [Set 01 - ToxLine01]
{Xu et al. 2008} Xu C; Wang J; Liu W; Daniel Sheng G; Tu Y; Ma Y. 2008. Separation and Aquatic Toxicity of Enantiomers of the Pyrethroid Insecticide Lambda-Cyhalothrin. Environ Toxicol Chem. 27(1):174-81. [Set 01 - ToxLine01]
{Yu and Nguyen 1992} Yu SJ; Nguyen SN. 1992. Detection and biochemical characterization of insecticide resistance in diamondback moth. Pestic Biochem Physiol. 44 (1): 74-81. [Set 01 - ToxLine02]
117

{Zhang et al. 2006} Zhang ZY; Zhang CZ; Liu XJ; Hong XY. 2006. Dynamics of Pesticide Residues in the Autumn Chinese Cabbage (Brassica Chinensis L.) Grown in Open Fields. Pest Manag Sci. 62(4):350-5. [Set 01 - ToxLine01]
{Zhao et al. 2008} Zhao M; Zhang Y; Liu W; Xu C; Wang L; Gan J. 2008. Estrogenic Activity of Lambda-Cyhalothrin in the MCF-7 Human Breast Carcinoma Cell Line. Environ Toxicol Chem. 27(5):1194-200. [Set 01 - ToxLine01]
{Zongmao and Haibin 1997} Zongmao C; Haibin W. 1997. Degradation of Pesticides on Plant Surfaces and its Prediction: A Case Study on Tea Plant. Environmental Monitoring and Assessment. 44 (1-3): 303-313. [Set 01 - ToxLine01]
{Zufan et al. 1989} Zufan L; Kubat J; Formanek J; Fuchs A; Tobiskova G; Zajicek P; Vodickova J; Rehak P; Dvorak J. 1989. Behavioral and EEG Changes Induced by the Pyrethroid Insecticide Cyhalothrin. Int J Psychophysiol. 7 (2-4): 447-448. [Set 01 - ToxLine01]
118

Figure 1: USGS Use Map for Lambda-Cyhalothrin During 2002
Source: USGS (2003)
119

120
Comanche Creek
Figure 2: Chico Site Aerial View Note: The color shaded regions in the above figure represent different soil types from the
USGS soil survey in the area of interest used for the Gleams-Driver simulations. See Section 3.2.3.4.3 for discussion. Region 447 is the large area encompassing Comanche Creek.
The output to the left is from AgDrift, Version 2.0.05 using drift for orchard airblast based on “Orchard”, which gives higher drift rates than the “Normal” Orchard in AgDrift.

McBride Creek
Figure 3: Foresthill Site Aerial View Note: The color shaded regions in the above figure represent different soil types from the
USGS soil survey in the area of interest used for the Gleams-Driver simulations. See Section 3.2.3.4.3 for discussion.
Above is based on 50 percentile deposition high boom ground broadcast with ASAE fine
to medium coarse droplets.
121

0
1
2
3
4
5
6
7
8
Jan Feb Mar Apr May Jun Jul Aug Sep Oct Nov Dec
Month
Prec
ipita
tion
(inch
es)
Cligen Foresthill Average
Figure 4: Foresthill Precipitation, Comparison of Cligen Simulation to Historical Data
Historical data from 2007 to 2009 taken from www.foresthillweather.com. See Section 3.2.3.4.3.1 for discussion.
122

Chico, Comanche Creek (Maximum Flows)
0
20,000,000
40,000,000
60,000,000
80,000,000
100,000,000
120,000,000
140,000,000May
-09
Jun-0
9
Aug-09
Sep-09
Nov-09
Jan-1
0
Feb-1
0
Apr-10
Date
Flow
(L/D
ay)
Figure 5: Daily Peak Stream Flows at Chico Site
123
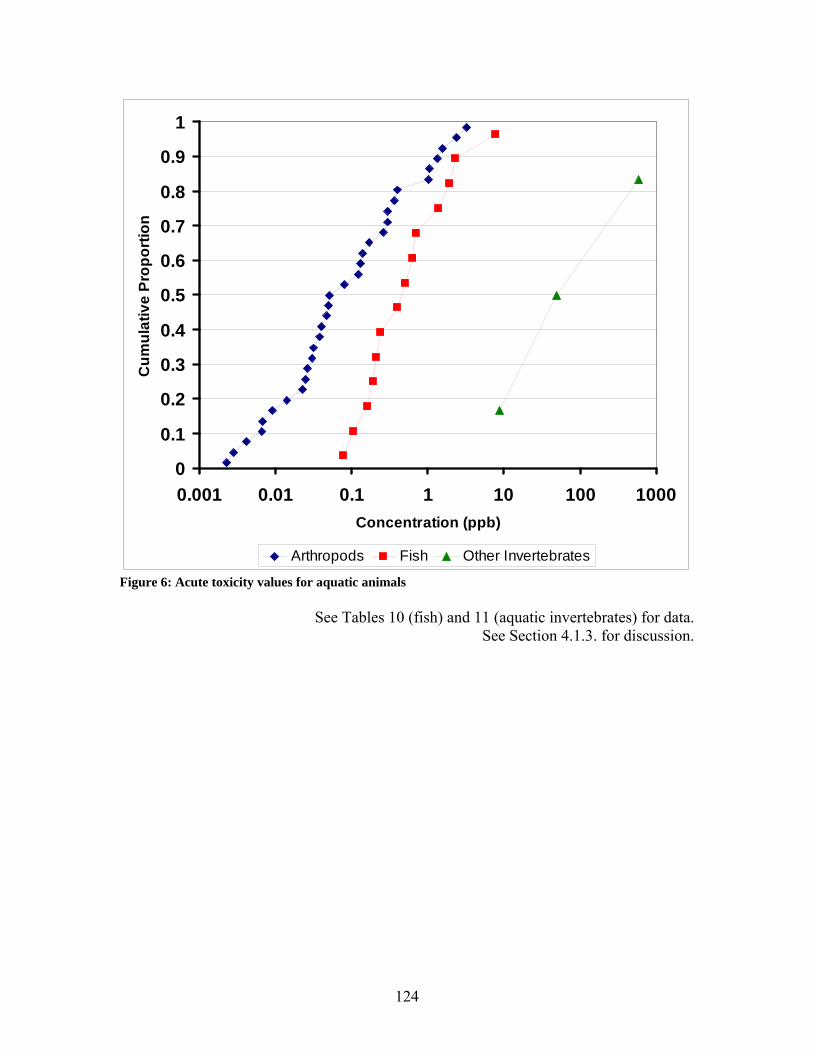
0
0.1
0.2
0.3
0.4
0.5
0.6
0.7
0.8
0.9
1
0.001 0.01 0.1 1 10 100 1000Concentration (ppb)
Cum
ulat
ive
Prop
ortio
n
Arthropods Fish Other Invertebrates
Figure 6: Acute toxicity values for aquatic animals
See Tables 10 (fish) and 11 (aquatic invertebrates) for data. See Section 4.1.3. for discussion.
124
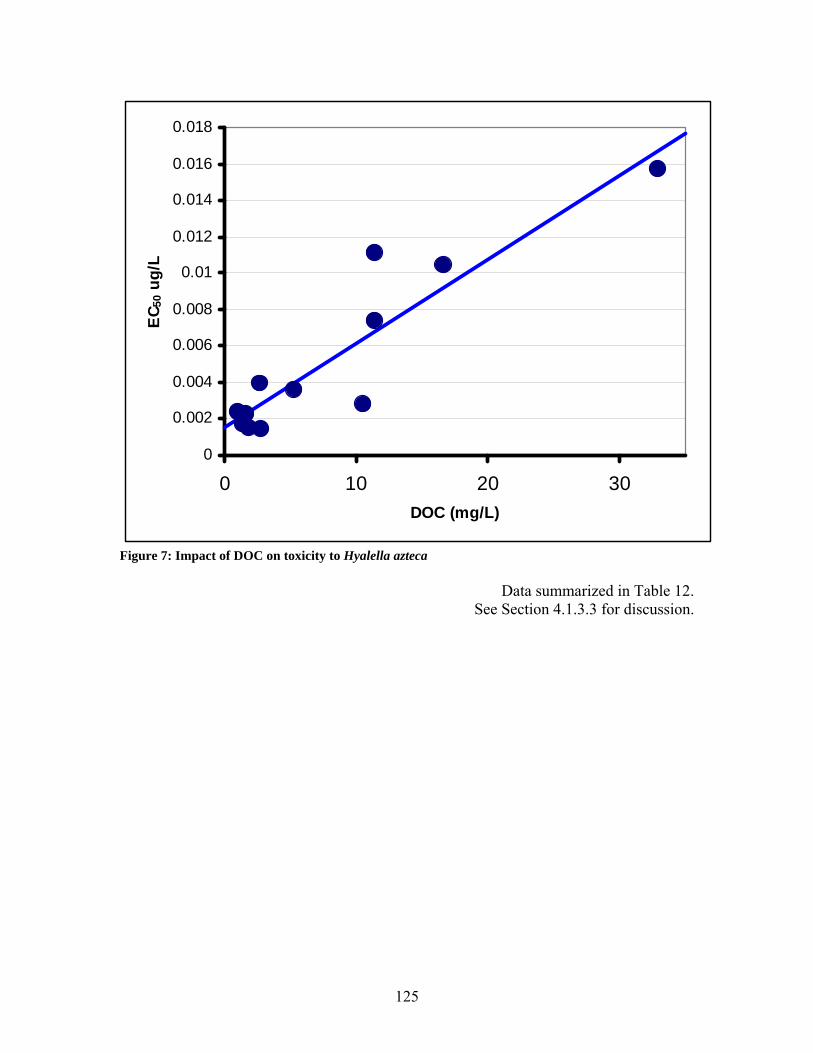
0
0.002
0.004
0.006
0.008
0.01
0.012
0.014
0.016
0.018
0 10 20 30DOC (mg/L)
EC50
ug/
L
Figure 7: Impact of DOC on toxicity to Hyalella azteca
Data summarized in Table 12. See Section 4.1.3.3 for discussion.
125

Table 1: Properties of lambda-cyhalothrin
Property Value Reference Nomenclature
Common Name Lambda-cyhalothrin
Tomlin 2004
CAS Name 1a(S*),3a(Z)]-(±)-cyano(3-phenoxyphenyl)methyl 3-(2-chloro-3,3,3-trifluoro-1-propenyl)-2,2-dimethylcyclopropanecarboxylate
Tomlin 2004
Appearance/state, ambient
Colorless solid; (tech. is a dark brown/green solidified melt).
Tomlin 2004
Bioconcentration 4600 to 5000 U.S. EPA/OPP 1988a U.S. EPA/EFED 1989a
CAS number 91465-08-6 Tomlin 2004 Density 1.33 g/ml (25 °C) Tomlin 2004 Foliar half-life 5 days Knissel and Davis 2000 Foliar washoff fraction
0.4 Knissel and Davis 2000
Fruit and vegetation halftimes
4.9 – 7 days (grapes) Banerjee et al. 2006
10 days (apples) Bostanian et al. 1993 3.6 – 4.5 days (tomatoes) Jayakrishnan et al. 2005 3 days (egg plant) Mukherjee and Gopal 1992 2.9-4.0 days (tea) Seenivasan and Muraleedharan
2009 2.9 days (cabbage) Zhang et al. 2006 3.4 days (tea) Zongmao and Haibin 1997 Henry’s law constant
2 x 10⁻² Pa m3 mol-1 Tomlin 2004
Kd 1,970 to 7,610 U.S. EPA/OPP 2002a Koc (g/ml) 180,000 USDA/ARS 1995; Knissel and
Davis 2000 330,000 Tomlin 2004 326,000 Amweg et al. 2005 log Kow 7 (20 °C) [Kow = 10,000,000] Tomlin 2004
USDA/ARS 1995 Bennett et al. 2005
Melting point 49.2 °C; (tech., 47.5-48.5 °C) Tomlin 2004 USDA/ARS 1995
Molecular formula C23H19ClF3NO3 USDA/ARS 1995 Molecular weight (g/mole)
449.9 Tomlin 2004
Sediment-Water half life
5-11 hours Tomlin 2004
Soil half life, field dissipation
43(30-84) days 14 to 60 days 1.3 weeks
USDA/ARS 1995 U.S. EPA/OPP 1988a Hill and Inaba 1991
Soil metabolism half life (aerobic)
23-82 days <30 days
Tomlin 2004 U.S. EPA/OPP 1988a
126

Property Value Reference 30 days Knissel and Davis 2000 42.6 Bennett et al. 2005 U.S. EPA Docket Number
EPA-HQ-OPP-2007-1024-0507, EPA-HQ-OPP-2007-1024, and several more
www.regulations.gov
Vapor pressure 2 x 10⁻⁴ mPa (20 °C, est.) Tomlin 2004; USDA/ARS 1995 Water, aquatic metabolism half life
7-15 days Tomlin 2004
Water, dissipation half lives
0.5 – 2.7 days (water column in ditches) Arts et al. 2006
1 day (pond mesocosms) Farmer et al. 1995 0.3 – 1 day Gu et al. 2007 1 day Hand et al. 2001 1 day Hill et al. 1994 1 (0.7-1.2) days (freshwater mesocosm) Van Wijngaarden et al. 2004 Water solubility (mg/L)
0.005 mg/l (20 °C) Tomlin 2004 USDA/ARS 1995
127

Table 2: Selected formulations of lambda-cyhalothrin
Trade Name a Supplier
EPA Reg. No. (Date of most recent EPA
label)
Type of Formulat
ion
Active Ingredient
(% by weight)
Lbs a.i. per
Gallon
Grizzly Z Winfield Solutions LLC
1381-211 (3/10/08)
Liquid 11.4% 1.
Kaiso 24WG Nufarm Americas, Inc.
228-526 (4/28/09)
Granular 24% N/A
Lambdastar 1 CS April 9, 2004
LG Life Sciences 71532-25 (4/9/04) [Note 2]
Liquid 12% 1.
Lambda-CY EC Insecticide-RUP
United Phosphorus, Inc
70506-121 (11/10/08)
Liquid 11.4% 1.
Lambda-T Helena Chemical Co.
100-1112-5905, 2/10/09 [Note 3]
Liquid 11.4% 1.
Silencer Makhteshim Agan of North America
66222-104 (11/20/08)
Liquid 12.7% 1.
Taiga Z Agriliance, LLC 1381-211 or 100-1112-1381 (3/5/07) [Note 1]
Liquid 11.4% 1.
Warrior Insecticide with Zeon Technology
Syngenta 100-1112 (2/26/09)
Liquid 11.4% 1.
Warrior II with Zeon Technology
Syngenta 100-1295 (9/23/08)
Liquid 22.8% 2.08
a Label information from the U.S. EPA/OPP label system (http://oaspub.epa.gov/pestlabl/ppls.home) unless otherwise specified.
Note 1: The U.S. EPA/OPP label gives the EPA Reg. No. 1381-211 for Taiga Z, which is identical to the Reg. No. for Grizzly Z. The Agrisolutions label give the Reg. No. as 100-1112-1381. Note that 100-1112 is the EPA Reg. No. for Warrior.
Note 2: EPA Est. Nos. 5905-GA-01, 66196-CA-01. Note 3: The U.S. EPA label system does not currently accept 100-1112-5905 designation for a label search.
A specimen label for Lambda-T was obtained from http://www.cdms.net.
128

129
Table 3: Inerts Contained in End-use Formulations Based on MSDSs
Formulation (% a.i.) a Inerts: Name, CAS No. from MSDS Inert % by Weight
Grizzly X (11.4%) Naphthalene ≤1.4% Same as Taiga and Lambda-T Propylene Glycol N.S.
Petroleum Solvent (NOS) N.S. Total inerts not quantified ≥87.2% Kaiso 24WG (24%) N-methyl pyrrolidone (CAS 91465-08-6) 2% Total inerts not quantified 74% Lambda-Cy EC (11.4%) Solvesso 200 78% Total inerts not quantified 10.6% Lambdastar 1 CS (12%) Total inerts not quantified 88% Lambda-T (11.4%) Naphthalene ≤1.4 %
Same as Grizzly and Taiga Propylene Glycol N.S. Petroleum Solvent (NOS) N.S. Total inerts not quantified ≥87.2% Silencer (12.7%) Aromatic solvent (CAS 64742-94-5) 78.4% Naphthalene (91-20-3) 7.84% Total inerts not quantified 1.06% Taiga Z Insecticide (11.4%) Naphthalene ≤1.4%
Same as Grizzly X and Lambda-T Propylene Glycol N.S. Petroleum Solvent (NOS) N.S. Total inerts not quantified ≥87.2% Warrior (11.4%) Naphthalene <1.5%
Propylene Glycol N.S. Petroleum Solvent (NOS) N.S.
Similar to Grizzly X, Lambda-T, and Taiga Z
Total inerts not quantified >87.1% Warrior II (22.8%) Petroleum solvent N.S. Titanium dioxide N.S. Total inerts not quantified 77.2%
a Information from Material Safety Data Sheets.

Table 4: Chico and Foresthill Site Characteristics
Parameter Chico Foresthill Latitude 39°42’41.32” N [39.711478] 39°05’05.34” N [39.084817] Longitude 121°46’54.59”W [121.781831] 120°44’00.34”W [121.733428] Elevation 323 feet 4200 feet Weather Data Chico Exp Station, CA Linear interpolation Average Annual Temperature 60.6 °F 52.0 °F Average Annual Precipitation (inches) 25.3 inches 38.0 inches Applications 0.08 lb a.i./acre, 6 applications every 2 weeks starting in May
0.16 lb a.i./acre, 3 applications every 4 weeks starting in May Soil Inputs b
Soil Depth (to water table) 40 inches 80 inches [actual value >78 inches]
Soil Classification Fine Sandy Loam Loam Drainage Class Moderately well drained Well drained
Hydrologic Soil Group B B [B,B,B,C] Soil Erodibility Factor (KSOIL) d 0.18 0.2
Clay (%) 15.1 31.3 Silt (%) 18.0 34.7
Organic Matter (%) 1.78 2.54 Bulk Density (g/cm3) 1.55 1.21
Porosity (cc/cc) 0.4 d 0.4 d Field capacity(cc/cc) 0.37 d 0.26 d
Wilting Point(BR15, cc/cc) 0.12 0.155 SCS curve number (CN2) 55 f 59 f
Soil evaporation parameter (CONA) 3.5 d 4.5 d Saturated Conductivity Below Root
Zone (RC,) h 25 µm/sec
3.5 inches/hr 2.9 µm/sec 0.41 inches/hour
Saturated Conductivity within Root Zone (SATK)
21.82 µm/sec 3.12 inches/hr
7.94 µm/sec 1.13 inches/hr
Manning’s “n” 0.01 0.01 Field Characteristics c
Treated area 83.7 acres 45 acres j Total Field area (for drainage) 203 acres 342 acres j
Longest flow path (feet) 2000 feet 1150 feet Representative slope 1% 5 % j
Depth to Restrictive Layer >40 inches 53 inches Stream Characteristics c
Name Comanche Creek McBride Creek Shortest distance from application site
to stream 50 feet 200 feet
Water Flow Rate Ephemeral due to diversion operations in winter. Maximum flow of 150 cfs. i
Ephemeral: Dry in summer to early winter
Proportional drift to stream 0.002 to 0.02 0.0002 to 0.002 Functional stream section length for
drift (feet) 500 250
Average width (feet) 15 feet (≈4.6 meters) N/A (assume 2 meters or ≈ 6 feet) a Data obtained at USGS National Water Information System: Web Interface, http://waterdata.usgs.gov/nwis/ nwisman. b Soil inputs are based on data from the USDA Soil Survey at http://websoilsurvey.nrcs.usda.gov/app/ where available. For Chico site, values are based on Map Unit 447 (77.1% of AOI). For Foresthill site, the values are based primarily on Map Units AIE5 (23.8% of AOI), COE5 (42.3% of AOI), and CSE5 (25.2% of AOI) using weights of 1, 2, and 1, respectively. c Treatment area specified by the USDA Forest Service. The field size is taken aerial imagining from http://websoilsurvey.nrcs.usda.gov/app/. Stream details from Bakke 2009c except as otherwise noted. d Default values from Knisel and Davis (2000). e For Chico, this is the mean of the range, 0.15 to 0.3, given by Knisel and Davis for Soil Group B. For Foresthill, this is the 3:1 weighted mean for Group B (0.15 to 0.3) and Group C (0.05 to 0.15). f For Chico, this is the central value for Group B for woods in good condition. For Foresthill site, this is the 3:1 weighted mean of the central values for Groups B and C for woods in good condition. g For Chico site, the stream is Comanche Creek. For the Foresthill site, the stream is McBride Creek. h Calculated from SATK in units of µM/sec from USDA Soil Survey at http://websoilsurvey.nrcs.usda.gov/app/. And converted to units of inches/hr for input into Gleams-Driver – 1 µMeter/sec = 0.141732 inches/hour. i From Chico FEIS (USDA/FS 1998). Corresponds to about 350,000,000 L/day. j Post-peer review inputs from Region 5 indicated the following changes: treated area is 45 acres not 118 acres, total area of site is 342 acres and not 507
acres, the characteristic slope is 5% not 16%.
130

Table 5: Chemical parameters used in GLEAMS modeling.
Parameter
Clay
Loam
Sand
Note/ Reference
Halftimes (days)
Aquatic Sediment 0.5 Note 1
Foliar 5 Knissel and Davis 2000
Soil 30 Note 2
Water 15 Note 3
Soil Ko/c, mL/g 180,000 Knissel and Davis 2000
Sediment Kd, mL/g 3870 3030 1250 Note 4
Water Solubility, mg/L 0.005 Tomlin 2005
Foliar wash-off fraction 0.4 Knissel and Davis 2000
Fraction applied to foliage 0.5 Note 5
Note 1 Based on upper bound of 11 hours from Tomlin (2004) rounded upward to 0.5 days.
Note 2 Variable. The 30 day values is taken from Knissel and Davis 2000. Half-times of 23-82 days reported in Tomlin (2004). U.S. EPA/OPP (1988a) reports a half-time of <30 days.
Note 3 Upper bound of 7-15 day values from Tomlin (2004) and USDA/ARS (1995)
Note 4 Based on equation Kd = Koc x POC where POC is the proportion of organic matter in the soil. Estimate POC as POM x 0.58 based on POM values of 0.012 for sand, 0.029 for loam, and 0.037 for clay. All values rounded to 3 significant places
Note 5 The Forest Service estimates that 0.75 may be more appropriate for tree applications but this estimate is not well-documented and 0.5 is used as a more conservative value that is typically used for directed foliar applications.
131

Table 6: Summary of Gleams-Driver Modeling
Concentrations (mg/L) a Scenario Peak c Long-Term Average c
EXPECTED CONCENTRATIONS
CHICO (COMANCHE CREEK, AIRBLAST) b
0.08 lb a.i./acre, six applications at 2 week intervals, starting in May, including drift
5.35 x 10⁻⁶ (4.38 x 10⁻⁶ to 2.50 x 10⁻⁵)
Max: 3.09 x 10⁻⁵
1.56 x 10⁻⁷ (1.06 x 10⁻⁷ to 2.97 x 10⁻⁷)
Max: 3.40 x 10⁻⁷ 0.16 lb a.i./acre, three applications at 4 week intervals, starting in May, including drift
1.02 x 10⁻⁵ (6.45 x 10⁻⁶ to 2.25 x 10⁻⁵)
1.60 x 10⁻⁷ (9.92 x 10⁻⁸ to 2.88 x 10⁻⁷)
FORESTHILL (MCBRIDE CREEK, HIGH-PRESSURE SPRAY) b 0.08 lb a.i./acre, six Applications at 2 week intervals, starting in May, including drift
7.73 x 10⁻⁶ (1.29 x 10⁻⁷ to 5.89 x 10⁻⁵)
Max: 1.01 x 10⁻⁴
8.02 x 10⁻⁸ (3.76 x 10⁻⁹ to 4.80 x 10⁻⁷)
Max: 8.00 x 10⁻⁷ 0.16 lb a.i./acre, three applications at 4 week intervals, starting in May, including drift
6.88 x 10⁻⁶ (2.14 x 10⁻⁷ to 5.32 x 10⁻⁵)
7.28 x 10⁻⁸ (3.73 x 10⁻⁹ to 4.31 x 10⁻⁷)
WATER CONTAMINATION RATES SIX APPLICATIONS OF 1 LB A.I./ACRE AT TWO WEEK INTERVALS
Chico Site (Comanche Creek), 6 applications at 0.08 lb a.i./acre with 2 week interval
6.69 x 10⁻⁵ (5.48 x 10⁻⁵ to 3.13 x 10⁻⁴)
1.95 x 10⁻⁶ (1.34 x 10⁻⁶ to 3.71 x 10⁻⁶)
Chico Site (Comanche Creek), 3 applications at 0.16 lb a.i./acre with 4 week interval
6.40 x 10⁻⁵ (4.03 x 10⁻⁵ to 1.41 x 10⁻⁴)
1.00 x 10⁻⁶ (6.20 x 10⁻⁷ to 1.80 x 10⁻⁶)
Foresthill Site (McBride Creek) 6 applications at 0.08 lb a.i./acre with 2 week interval
9.66 x 10⁻⁵ (1.61 x 10⁻⁶ to 7.36 x 10⁻⁴)
1.00 x 10⁻⁶ (4.70 x 10⁻⁸ to 6.00 x 10⁻⁶)
Foresthill Site (McBride Creek) 3 applications at 0.16 lb a.i./acre with 4 week interval
4.30 x 10⁻⁵ (1.34 x 10⁻⁶ to 3.33 x 10⁻⁴)
4.55 x 10⁻⁷ (2.33 x 10⁻⁸ to 2.69 x 10⁻⁶)
Generic Modeling, Stream (used in WorksheetMaker) c 1.75 x 10⁻⁴ (1x10⁻⁷. to 7.9 x 10⁻³)
4.52 x 10⁻⁶ (9.0 x 10⁻⁹ to 7.0 x 10⁻⁴)
Generic Modeling, Pond c 7.0 x 10⁻⁴ (1.1x10⁻⁷. to 7.9 x 10⁻⁴)
7.0 x 10⁻⁷ (1.0x10⁻⁹. to 6.0 x 10⁻⁶)
a Values are given as the median with lower and upper empirical 95% interval followed by the maximum modeled concentrations from 100 simulations. b See Section 3.2.3.4.3.2 for discussion. c Minimum concentrations are modeled at zero. For this summary table, the lowest non-zero concentration is used.
132

Table 7: Monitored concentrations of lambda-cyhalothrin in sediment Koc Values (kg/L) Clay Loam Sand 3870 3030 1250
Sediment Source Sediment Concentration (mg/kg)
Estimated concentrations in water (mg/L)
Pond a 0.0168 4.34E-06 5.54E-06 1.34E-05Irrigation Canals a 0.0078 2.02E-06 2.57E-06 6.24E-06
Stream Sediments (Jan) b 0.0040 1.03E-06 1.32E-06 3.20E-06Stream Sediments (Dec) b 0.0131 3.39E-06 4.32E-06 1.05E-05
Average Water Concentration: 4.82E-06 Mg/L
Lower Bound Water
Concentration: 1.03E-06 Mg/L
Upper Bound Water
Concentration: 1.34E-05 Mg/L Source of Sediment Concentrations: a Weston et al. 2004; b Weston et al. 2008
See Section 3.2.3.4.5 for discussion.
133

Table 8: Estimated residues in food items per lb a.i. applied
Concentration in Food Item (ppm per lb a.i./acre) Food Item Central a Lower b Upper a Broadcast Foliar Applications
Short grass 85 30 240 Tall grass 36 12 110 Broadleaf/forage plants and small insects
45 15 135
Fruits, pods, seeds, and large insects 7 3.2 15 a From Fletcher et al. (1997) and U.S. EPA/EFED 2001, p. 44. b Calculated as the Central value × (Central Value ÷ Upper Value).
134

Table 9: Summary of toxicity values used in human health risk assessment
Duration Derivation of RfD Reference Comment Acute – single exposure
NOAEL Dose 0.5 mg/kg bw/day LOAEL Dose 3.5 mg/kg bw/day
LOAEL Endpoint(s) Ataxia Species, sex Dogs
Uncertainty Factor 100 RfD 0.005 mg/kg bw/day
U.S. EPA/OPP 2003b
This is based on a chronic study in dogs in which ataxia was observed from Day 2 onward at 3 to 7 hours after dosing. The dose of 0.5 mg/kg bw/day is considered a NOAEL for short-term exposures.
Chronic – lifetime exposure NOAEL Dose 0.1 mg/kg bw/day LOAEL Dose 0.5 mg/kg bw/day
Species, sex Dogs LOAEL Endpoint(s) Abnormal gait
Uncertainty Factor 100 RfD 0.001 mg/kg bw/day
U.S. EPA/OPP 2003b
Some signs of neurotoxicity seen at 0.5 mg/kg bw/day in some animals and this dose is classified as a LOAEL in U.S EPA/HED (1997c) but was subsequently reclassified as a NOEL.
135
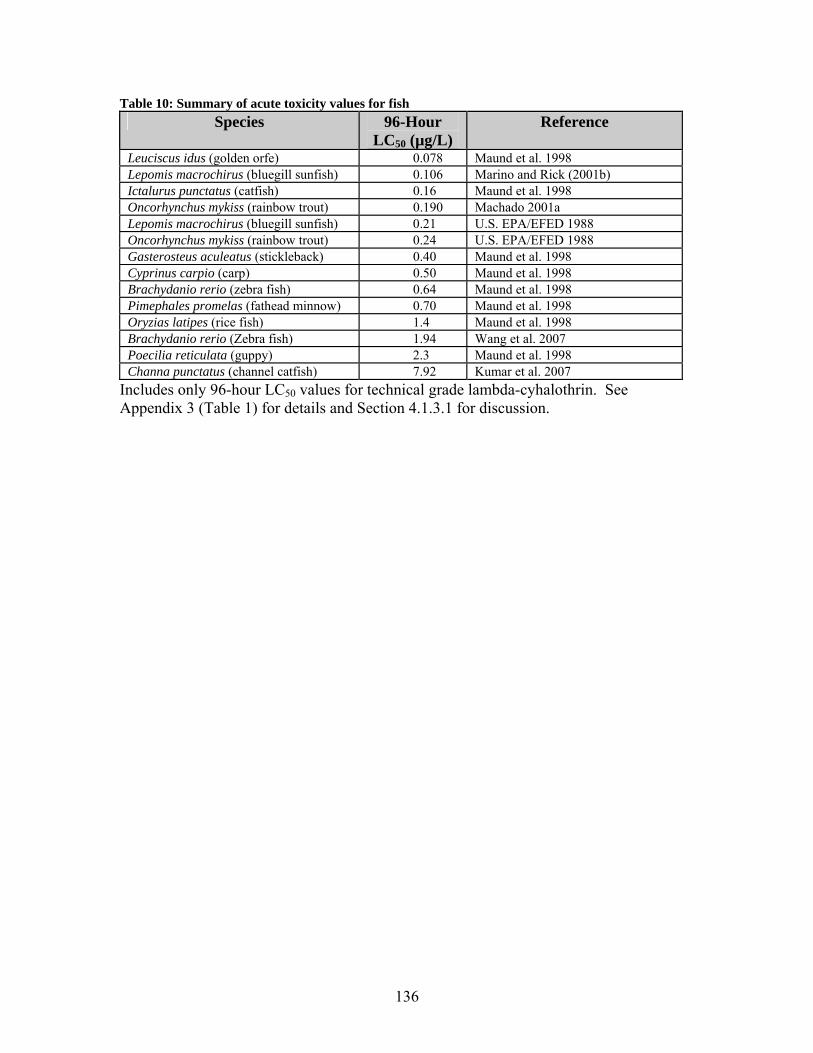
Table 10: Summary of acute toxicity values for fish Species 96-Hour
LC50 (µg/L) Reference
Leuciscus idus (golden orfe) 0.078 Maund et al. 1998 Lepomis macrochirus (bluegill sunfish) 0.106 Marino and Rick (2001b) Ictalurus punctatus (catfish) 0.16 Maund et al. 1998 Oncorhynchus mykiss (rainbow trout) 0.190 Machado 2001a Lepomis macrochirus (bluegill sunfish) 0.21 U.S. EPA/EFED 1988 Oncorhynchus mykiss (rainbow trout) 0.24 U.S. EPA/EFED 1988 Gasterosteus aculeatus (stickleback) 0.40 Maund et al. 1998 Cyprinus carpio (carp) 0.50 Maund et al. 1998 Brachydanio rerio (zebra fish) 0.64 Maund et al. 1998 Pimephales promelas (fathead minnow) 0.70 Maund et al. 1998 Oryzias latipes (rice fish) 1.4 Maund et al. 1998 Brachydanio rerio (Zebra fish) 1.94 Wang et al. 2007 Poecilia reticulata (guppy) 2.3 Maund et al. 1998 Channa punctatus (channel catfish) 7.92 Kumar et al. 2007
Includes only 96-hour LC50 values for technical grade lambda-cyhalothrin. See Appendix 3 (Table 1) for details and Section 4.1.3.1 for discussion.
136
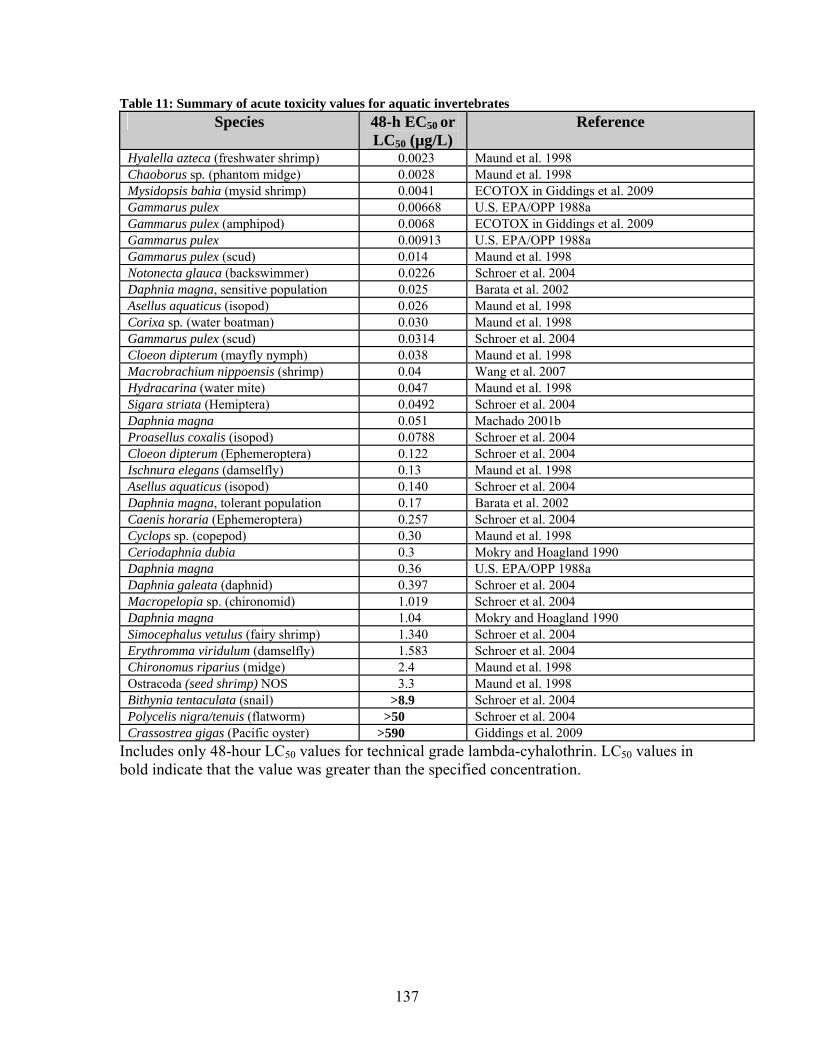
Table 11: Summary of acute toxicity values for aquatic invertebrates Species 48-h EC50 or
LC50 (µg/L) Reference
Hyalella azteca (freshwater shrimp) 0.0023 Maund et al. 1998 Chaoborus sp. (phantom midge) 0.0028 Maund et al. 1998 Mysidopsis bahia (mysid shrimp) 0.0041 ECOTOX in Giddings et al. 2009 Gammarus pulex 0.00668 U.S. EPA/OPP 1988a Gammarus pulex (amphipod) 0.0068 ECOTOX in Giddings et al. 2009 Gammarus pulex 0.00913 U.S. EPA/OPP 1988a Gammarus pulex (scud) 0.014 Maund et al. 1998 Notonecta glauca (backswimmer) 0.0226 Schroer et al. 2004 Daphnia magna, sensitive population 0.025 Barata et al. 2002 Asellus aquaticus (isopod) 0.026 Maund et al. 1998 Corixa sp. (water boatman) 0.030 Maund et al. 1998 Gammarus pulex (scud) 0.0314 Schroer et al. 2004 Cloeon dipterum (mayfly nymph) 0.038 Maund et al. 1998 Macrobrachium nippoensis (shrimp) 0.04 Wang et al. 2007 Hydracarina (water mite) 0.047 Maund et al. 1998 Sigara striata (Hemiptera) 0.0492 Schroer et al. 2004 Daphnia magna 0.051 Machado 2001b Proasellus coxalis (isopod) 0.0788 Schroer et al. 2004 Cloeon dipterum (Ephemeroptera) 0.122 Schroer et al. 2004 Ischnura elegans (damselfly) 0.13 Maund et al. 1998 Asellus aquaticus (isopod) 0.140 Schroer et al. 2004 Daphnia magna, tolerant population 0.17 Barata et al. 2002 Caenis horaria (Ephemeroptera) 0.257 Schroer et al. 2004 Cyclops sp. (copepod) 0.30 Maund et al. 1998 Ceriodaphnia dubia 0.3 Mokry and Hoagland 1990 Daphnia magna 0.36 U.S. EPA/OPP 1988a Daphnia galeata (daphnid) 0.397 Schroer et al. 2004 Macropelopia sp. (chironomid) 1.019 Schroer et al. 2004 Daphnia magna 1.04 Mokry and Hoagland 1990 Simocephalus vetulus (fairy shrimp) 1.340 Schroer et al. 2004 Erythromma viridulum (damselfly) 1.583 Schroer et al. 2004 Chironomus riparius (midge) 2.4 Maund et al. 1998 Ostracoda (seed shrimp) NOS 3.3 Maund et al. 1998 Bithynia tentaculata (snail) >8.9 Schroer et al. 2004 Polycelis nigra/tenuis (flatworm) >50 Schroer et al. 2004 Crassostrea gigas (Pacific oyster) >590 Giddings et al. 2009
Includes only 48-hour LC50 values for technical grade lambda-cyhalothrin. LC50 values in bold indicate that the value was greater than the specified concentration.
137

Table 12: EC50 Values for Immobilization of Hyalella azteca in different pond waters
Water body Dissolved Organic Carbon (mg/L)
48-h EC50 (µg/L)
UMFS pond S-4 1.0 0.0024 UMFS pond S-2 1.4 0.0017 UMFS pond Bramlett pond 1.7 0.0022 UMFS pond 97 1.9 0.0015 UMFS pond 146 2.7 0.0039 UMFS pond 167 2.8 0.0014 UMFS pond 179 5.3 0.0036 UMFS pond 1 10.6 0.0028 UMFS pond 98 11.4 0.0074 Beasley lake 11.4 0.0111 UMFS pond 92 16.7 0.0104 Coldwater bendway 32.9 0.0157
Data from Smith and Lizotte (2007), Tables 1 and 3. Data illustrated in Figure 7.
See Section 4.1.3.3 for discussion.
138
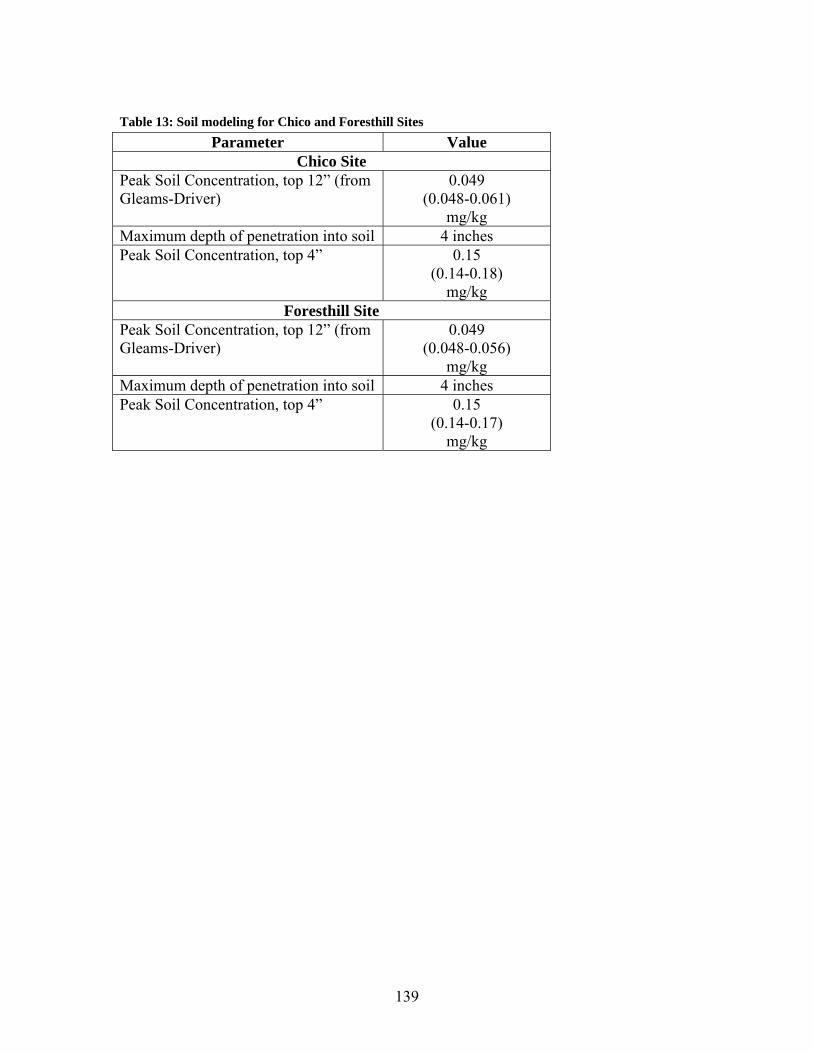
Table 13: Soil modeling for Chico and Foresthill Sites
Parameter Value Chico Site
Peak Soil Concentration, top 12” (from Gleams-Driver)
0.049 (0.048-0.061)
mg/kg Maximum depth of penetration into soil 4 inches Peak Soil Concentration, top 4” 0.15
(0.14-0.18) mg/kg
Foresthill Site Peak Soil Concentration, top 12” (from Gleams-Driver)
0.049 (0.048-0.056)
mg/kg Maximum depth of penetration into soil 4 inches Peak Soil Concentration, top 4” 0.15
(0.14-0.17) mg/kg
139

140
Table 14: Toxicity values used in ecological risk assessment
Group/Duration Organism Endpoint Toxicity Value (a.i.) Reference
Terrestrial Animals
Acute Non-canine Mammals NOEL 10 mg/kg bw Section 4.3.2.1.
Canids NOEL 0.5 mg/kg bw Section 4.3.2.1. Birds NOEL 150 mg/kg bw Section 4.3.2.2
Terrestrial Insects, contact LD50 ÷ 10 0.0065 mg/kg bw Section 4.3.2.3.1 Terrestrial Insects, oral LD50 ÷ 24 0.4 mg/kg bw Section 4.3.2.3.2
Earthworm NOEC 10 to 63.2 ppm soil Section 4.3.2.3.3 Soil Nematode LOEC 0.0002 ppm soil Section 4.3.2.3.3
Isopod LC50 ÷ 10 0.05 ppm soil Section 4.3.2.3.3 Longer-term
Non-canine Mammals NOEL 1.5 mg/kg bw/day Section 4.3.2.1 Canids NOEL 0.1 mg/kg bw/day Section 4.3.2.1
Bird NOEL 0.85 mg/kg bw/day Section 4.3.2.2. Earthworm NOEC 3.2 to 10 ppm soil Section 4.3.2.3.3
Soil Microorganisms NOEC 1 to 20 ppm soil Section 4.3.2.5
Aquatic Animals
Acute Fish Sensitive LC50 ÷ 20 0.000004 mg/L Section 4.3.3.1.1
Tolerant LC50 ÷ 20 0.0004 mg/L Section 4.3.3.1.1 Arthropods Sensitive Chronic NOEC 0.0000002 mg/L Section 4.3.3.3.1
Tolerant Chronic NOEC 0.00017 mg/L Section 4.3.3.3.1 Sensitive LOEC ÷ 10 0.0009 mg/L Section 4.3.3.3.2 Other
Invertebrates Tolerant >LC50 ÷ 10 0.06 mg/L Section 4.3.3.3.2 Longer-term Fish Sensitive Estimated life-cycle NOEC 0.0000031 mg/L Section 4.3.3.1.2
Tolerant Estimated life-cycle NOEC 0.00031 mg/L Section 4.3.3.1.2 Arthropods Sensitive NOEC 0.0000002 mg/L Section 4.3.3.3.1
Tolerant LC50 ÷ 20 0.00017 mg/L Section 4.3.3.3.1 Sensitive No data N/A Section 4.3.3.3.2 Other
Invertebrates Tolerant No data N/A Section 4.3.3.3.2
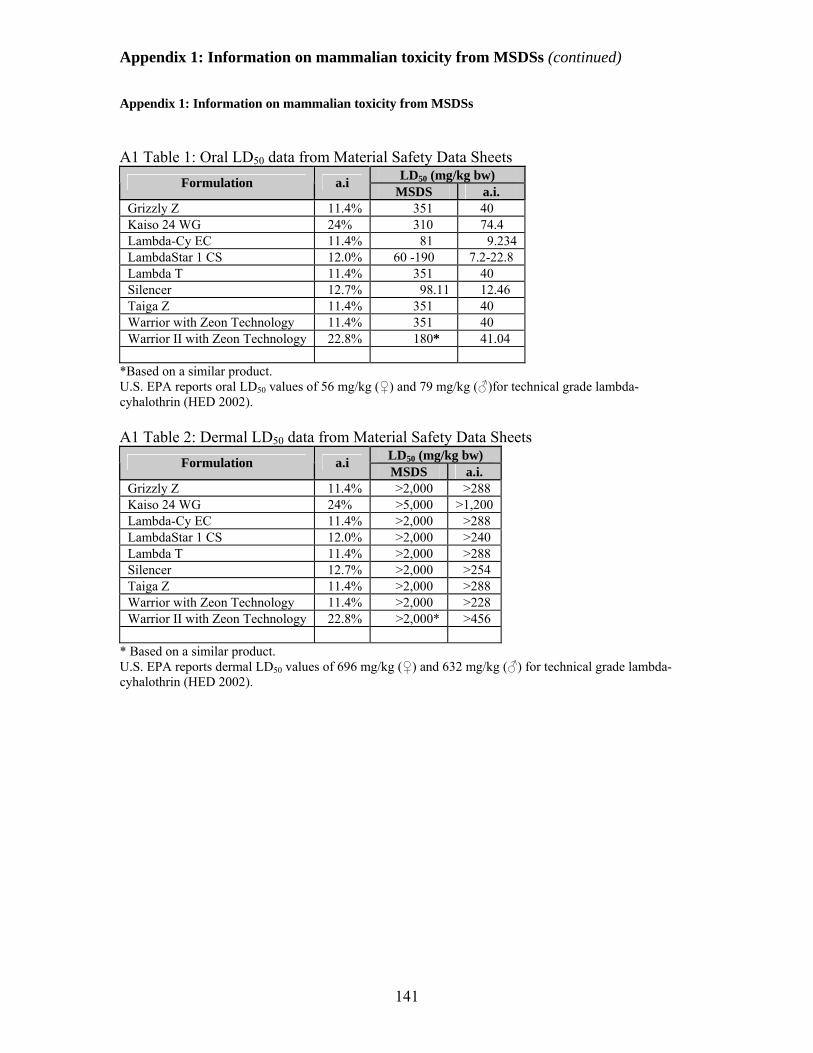
Appendix 1: Information on mammalian toxicity from MSDSs (continued)
Appendix 1: Information on mammalian toxicity from MSDSs A1 Table 1: Oral LD50 data from Material Safety Data Sheets
LD50 (mg/kg bw) Formulation a.i MSDS a.i.
Grizzly Z 11.4% 351 40 Kaiso 24 WG 24% 310 74.4 Lambda-Cy EC 11.4% 81 9.234 LambdaStar 1 CS 12.0% 60 -190 7.2-22.8 Lambda T 11.4% 351 40 Silencer 12.7% 98.11 12.46 Taiga Z 11.4% 351 40 Warrior with Zeon Technology 11.4% 351 40 Warrior II with Zeon Technology 22.8% 180* 41.04
*Based on a similar product. U.S. EPA reports oral LD50 values of 56 mg/kg (♀) and 79 mg/kg (♂)for technical grade lambda-cyhalothrin (HED 2002). A1 Table 2: Dermal LD50 data from Material Safety Data Sheets
LD50 (mg/kg bw) Formulation a.i MSDS a.i.
Grizzly Z 11.4% >2,000 >288 Kaiso 24 WG 24% >5,000 >1,200 Lambda-Cy EC 11.4% >2,000 >288 LambdaStar 1 CS 12.0% >2,000 >240 Lambda T 11.4% >2,000 >288 Silencer 12.7% >2,000 >254 Taiga Z 11.4% >2,000 >288 Warrior with Zeon Technology 11.4% >2,000 >228 Warrior II with Zeon Technology 22.8% >2,000* >456
* Based on a similar product. U.S. EPA reports dermal LD50 values of 696 mg/kg (♀) and 632 mg/kg (♂) for technical grade lambda-cyhalothrin (HED 2002).
141
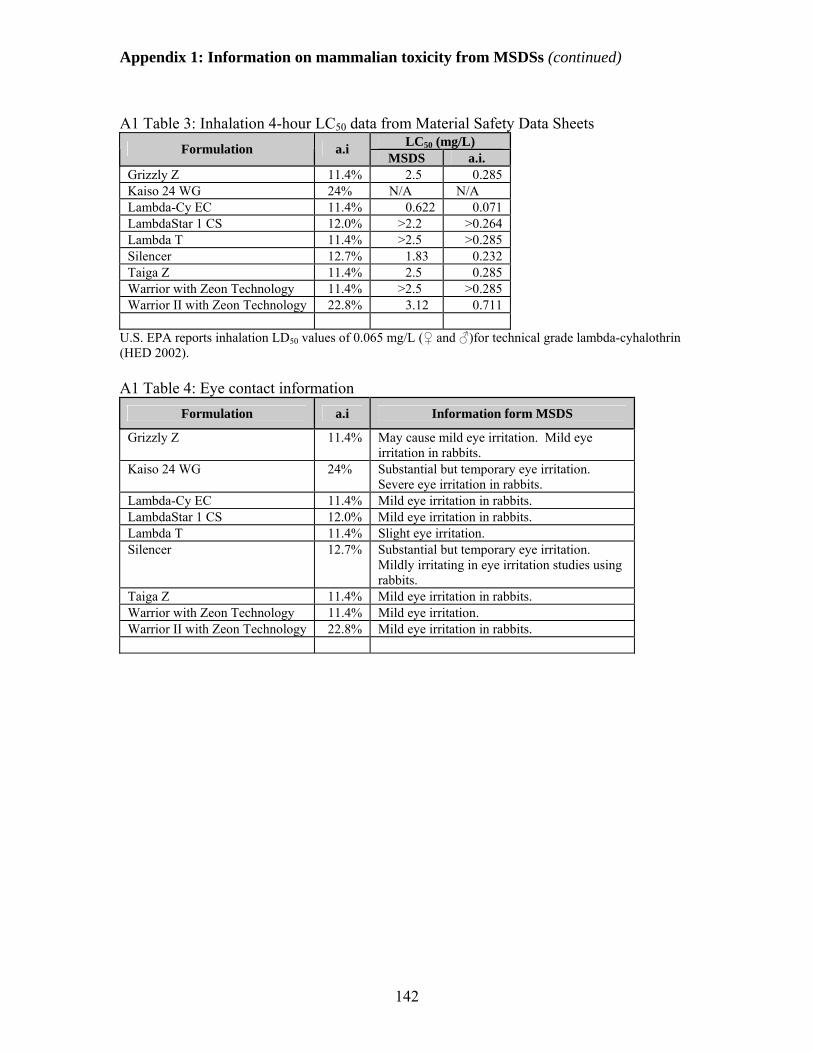
Appendix 1: Information on mammalian toxicity from MSDSs (continued)
A1 Table 3: Inhalation 4-hour LC50 data from Material Safety Data Sheets
LC50 (mg/L) Formulation a.i MSDS a.i.
Grizzly Z 11.4% 2.5 0.285 Kaiso 24 WG 24% N/A N/A Lambda-Cy EC 11.4% 0.622 0.071 LambdaStar 1 CS 12.0% >2.2 >0.264 Lambda T 11.4% >2.5 >0.285 Silencer 12.7% 1.83 0.232 Taiga Z 11.4% 2.5 0.285 Warrior with Zeon Technology 11.4% >2.5 >0.285 Warrior II with Zeon Technology 22.8% 3.12 0.711
U.S. EPA reports inhalation LD50 values of 0.065 mg/L (♀ and ♂)for technical grade lambda-cyhalothrin (HED 2002). A1 Table 4: Eye contact information
Formulation a.i Information form MSDS
Grizzly Z 11.4% May cause mild eye irritation. Mild eye irritation in rabbits.
Kaiso 24 WG 24% Substantial but temporary eye irritation. Severe eye irritation in rabbits.
Lambda-Cy EC 11.4% Mild eye irritation in rabbits. LambdaStar 1 CS 12.0% Mild eye irritation in rabbits. Lambda T 11.4% Slight eye irritation. Silencer 12.7% Substantial but temporary eye irritation.
Mildly irritating in eye irritation studies using rabbits.
Taiga Z 11.4% Mild eye irritation in rabbits. Warrior with Zeon Technology 11.4% Mild eye irritation. Warrior II with Zeon Technology 22.8% Mild eye irritation in rabbits.
142
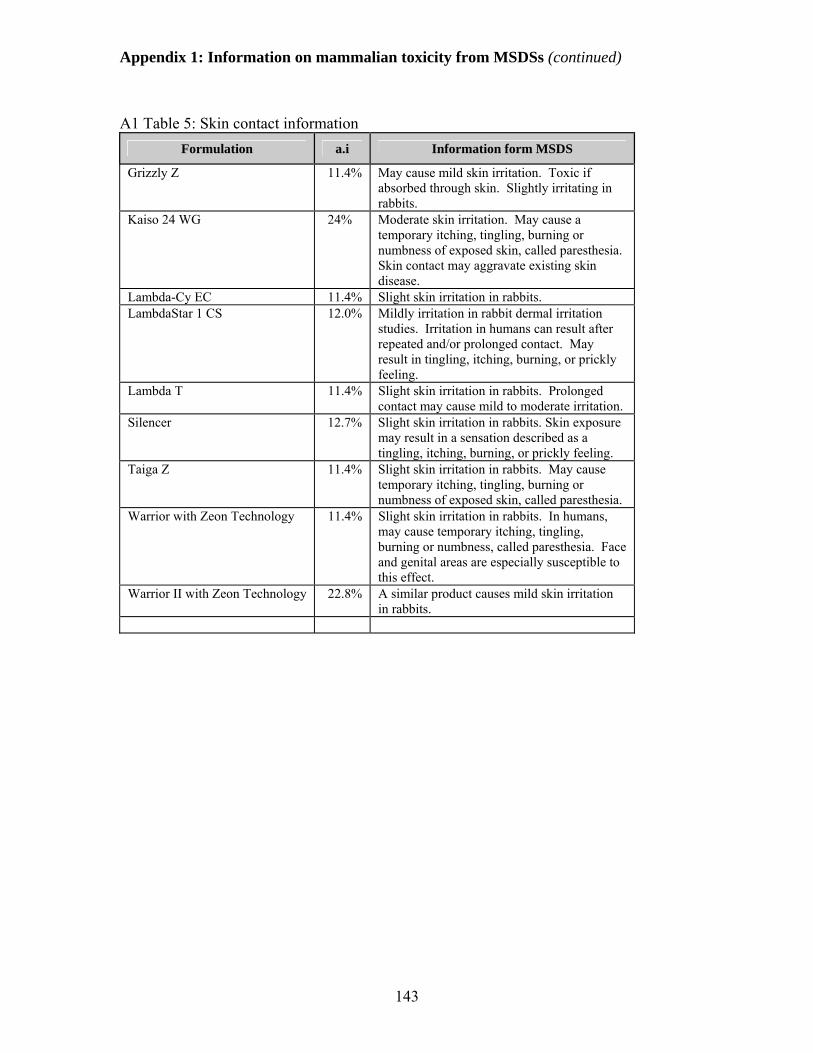
Appendix 1: Information on mammalian toxicity from MSDSs (continued)
A1 Table 5: Skin contact information
Formulation a.i Information form MSDS
Grizzly Z 11.4% May cause mild skin irritation. Toxic if absorbed through skin. Slightly irritating in rabbits.
Kaiso 24 WG 24% Moderate skin irritation. May cause a temporary itching, tingling, burning or numbness of exposed skin, called paresthesia. Skin contact may aggravate existing skin disease.
Lambda-Cy EC 11.4% Slight skin irritation in rabbits. LambdaStar 1 CS 12.0% Mildly irritation in rabbit dermal irritation
studies. Irritation in humans can result after repeated and/or prolonged contact. May result in tingling, itching, burning, or prickly feeling.
Lambda T 11.4% Slight skin irritation in rabbits. Prolonged contact may cause mild to moderate irritation.
Silencer 12.7% Slight skin irritation in rabbits. Skin exposure may result in a sensation described as a tingling, itching, burning, or prickly feeling.
Taiga Z 11.4% Slight skin irritation in rabbits. May cause temporary itching, tingling, burning or numbness of exposed skin, called paresthesia.
Warrior with Zeon Technology 11.4% Slight skin irritation in rabbits. In humans, may cause temporary itching, tingling, burning or numbness, called paresthesia. Face and genital areas are especially susceptible to this effect.
Warrior II with Zeon Technology 22.8% A similar product causes mild skin irritation in rabbits.
143
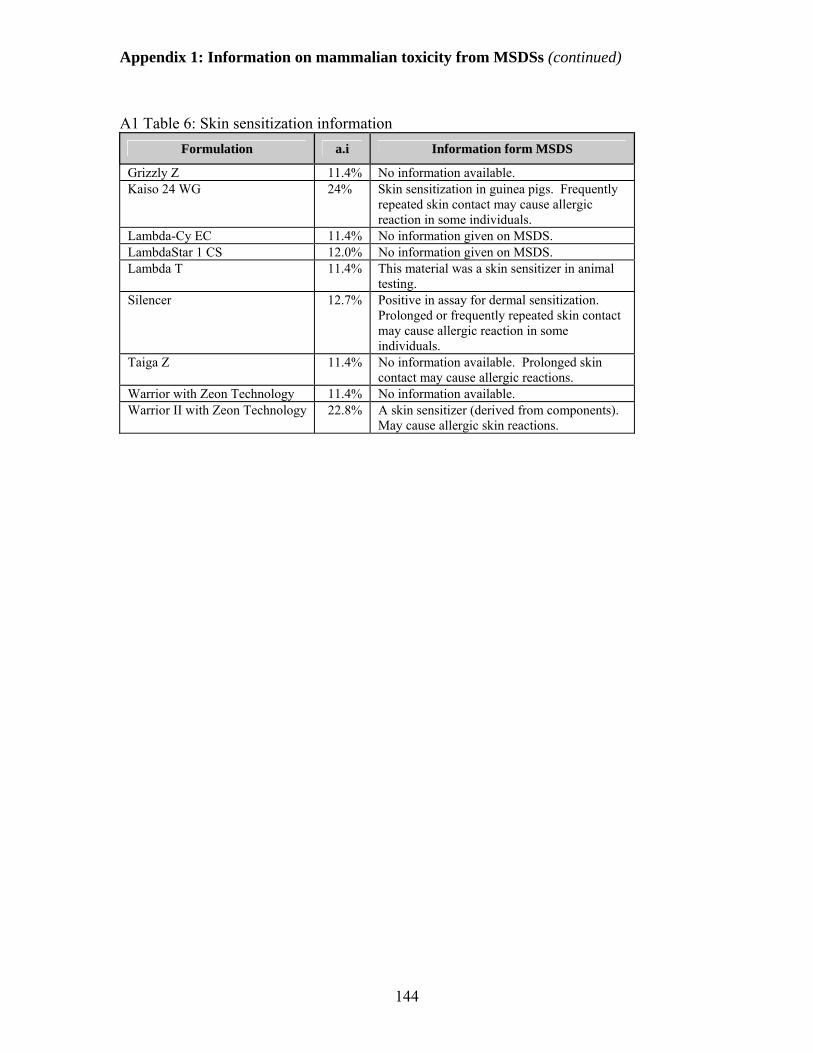
Appendix 1: Information on mammalian toxicity from MSDSs (continued)
144
A1 Table 6: Skin sensitization information
Formulation a.i Information form MSDS
Grizzly Z 11.4% No information available. Kaiso 24 WG 24% Skin sensitization in guinea pigs. Frequently
repeated skin contact may cause allergic reaction in some individuals.
Lambda-Cy EC 11.4% No information given on MSDS. LambdaStar 1 CS 12.0% No information given on MSDS. Lambda T 11.4% This material was a skin sensitizer in animal
testing. Silencer 12.7% Positive in assay for dermal sensitization.
Prolonged or frequently repeated skin contact may cause allergic reaction in some individuals.
Taiga Z 11.4% No information available. Prolonged skin contact may cause allergic reactions.
Warrior with Zeon Technology 11.4% No information available. Warrior II with Zeon Technology 22.8% A skin sensitizer (derived from components).
May cause allergic skin reactions.

Appendix 2: Toxicity to Terrestrial Invertebrates (continued)
Appendix 2: Toxicity to terrestrial invertebrates A2 Table 1: Acute and Chronic Toxicity Assays ........................................................... 145 A2 Table 2: Field Studies ............................................................................................... 148 A2 Table 1: Acute and Chronic Toxicity Assays
Species Exposure Response Reference Direct Contact/Topical Application Assays Erigone atra (spider) Direct contact assay LD50s
M: 0.33 µg/kg bw F: 0.31 µg/kg bw
Dinter and Poehling 1995
Oedothorax apicatus (spider)
Direct contact assay LD50s M: 0.44 µg/kg bw F: 0.45 µg/kg bw
Dinter and Poehling 1995
Apis mellifera (honey bees) BW not specified, assume 0.000093 kg
Direct contact bioassay. Diethyl maleate and S,S,S-tributylphosphorotrithioate were also tested. Less effective than PBO.
LD50 alone: 102 (73.0 – 133) ng/bee [0.102 µg/bee or about 1.1 mg/kg bw] LD50 with piperonyl butoxide: 1.28 (1.12 – 1.46) ng/bee [0.00128 µg/bee]
Johnson et al. 2006
Apis mellifera (honey bees), average bw: 126.5 mg
Direct contact assay LD50 = 0.022 µg/bee ≈1.74 mg/kg bw
Mayer et al. 1998
Nomia melanderi (alkali bee), average bw: 86.6 mg
Direct contact assay LD50 = 0.036 µg/bee ≈0.41 mg/kg bw
Mayer et al. 1998
Megachile rotundata (alfalfa leafcutter bee), average bw: 30.8 mg
Direct contact assay LD50 = 0.002 µg/bee ≈0.065 mg/kg bw
Mayer et al. 1998
Apis mellifera (honey bees) BW not specified, assume 0.000093 kg (USDA/APHIS 1993)
Direct contact assay LD50 = 68 ng/bee (0.068 µg/bee) ≈0.731 mg/kg bw Toxicity to bees synergized by
fungicides.
Pilling and Jepson 1993
Apis mellifera (honey bees) BW not specified, assume 0.000093 kg
Direct contact assay. 0.2, 0.1, 0.05, 0.02, 0.01, and 0.005 µg a.i. per bee. Apparently no untreated control group. Make conservative assumption of 0/60 for no treatment in Fisher Exact Test.
48-h LD50 = 0.038 µg/bee ≈0.409 mg/kg bw
Dose/response as 48-hours Dose N R 0.005 59 2 0.01 59 2 0.02 59 10 0.05 59 42 0.1 59 48 0.2 59 58
N: number tested; R: number dead.
Fisher Exact: 0/59 vs 2/59 = 0.247863
NOEC for mortality: 0.01 µg/bee. ≈ 0.11 mg/kg bw.
Gough et al. 1984 Used by U.S. EPA/EFED 1988
145

Appendix 2: Toxicity to Terrestrial Invertebrates (continued)
Residue Contact Assays Orius insidiosus (predatory flower bug)
Vegetation contact. 28 g/ha (≈0.025 lb a.i./ac) on corn. . Residue exposures for 3 days.
Significant increase in mortality (See Table 1 in study).
Al-Deeb et al. 2001
Orius insidiosus (predatory flower bug)
Vegetation contact. 560 g/ha (≈0.5 lb a.i./ac) on sorghum. Residue exposures for 3 days
Significant increase in mortality (See Table 7 in study).
Al-Deeb et al. 2001
Micromus tasmaniae(lacewings, predator species) and Rhopalosiphon padi (bird cherry-oat aphid, target species)
Contact with filter paper in petri dishes treated with lambda-cyhalothrin at concentrations of 0.1 to 10 mg/L.
LC50s Lacewings: >10 mg/L Aphids: ≈1.1 mg/L
Booth et al. 2007
Hyaliodes vitripennis (mite predator)
Indirect contact assays after insects and vegetation sprayed to runoff with varying concentrations. Data taken from Table 1 of paper
Nymphs LC50: 2.3 (1.8-2.9) mg a.i./L
Adults LC50: 0.7 (0.5-0.9) mg a.i./L
Bostanian et al. 2001
Aphidius ervi (parasitic wasp)
Indirect contact assay, glass LD50: 4.97 ng/cm2 Corresponds to 0.049 µg/cm2
or about 0.0044 lb a.i./acre.
Desneux et al. 2004b
Aphis mellifera (honeybees), 50 per assay
015 and 35 g a.i./ha (0.013 and 0.031 lb a.i./ac) to alfalfa. Foliage collected at 3, 8, 24, 48, and 96 hours. Bees exposed to residues for 24 hours with uncontaminated sucrose.
LT50: 23 hours at lower application rate.
LT50: 4 to 12 hours at higher
application rate
Gough and Brown 1987
Aphidius rhopalosiphi (parasitic hymenoptera)
Glass plate contact assay 5 g/ha: 100% mortality. Corresponds to 0.0045 lb/ac.
Jansen 1996
Anystis baccarum (predatory mite)
Indirect Contact LC50. LC50: 0.7 mg/L Working note: Cannot determine
application in mass/surface area.
Laurin and Bostanian 2007
Apis mellifera (honey bees)
Contact with foliage treated at 0.011 to 0.034 kg/ha that was collected 2 and 8 hours after treatment.
Approximate LD50: between 0.028 and 0.034 kg/ha at 2 and 8 h. LD50s correspond to 0.024 and 0.03 lb/ac.
Mayer et al. 1998
Nomia melanderi (alkali bee)
Contact with foliage treated at 0.011 to 0.034 kg/ha that was collected 2 and 8 hours after treatment.
Approximate LD50: 0.028 kg/ha at 2 hr and between 0.028 and 0.034 kg/ha at 8 h.
Mayer et al. 1998
Megachile rotundata (alfalfa leafcutter bee)
Contact with foliage treated at 0.011 to 0.034 kg/ha that was collected 2 and 8 hours after treatment.
Approximate LC50: between 0.022 and 0.028 kg/ha at 2 and 8 h.
Mayer et al. 1998
146

Appendix 2: Toxicity to Terrestrial Invertebrates (continued)
Dietary Assays Spodoptera litura (tobacco cutworm, target species)
Dietary feeding: Cauliflower leaves dipped in solutions of 0, 5, 7.5, 10, 12.5 and 25 ppm and then fed to insects. Concentrations on leaves not specified. Cannot approximated mg/kg bw dose.
NOAEL: Not identified LOAEL: 5 ppm for survival and
several other endpoints. Note: the concentrations refer to
liquid used to treat leaves and not to resulting concentration on leaves.
Abro et al. 1997
Apis mellifera (honey bees) , assume 0.000093 kg (USDA/APHIS 1993)
Oral LD50 with contaminated sucrose solution. Doses: 0.0025, 0.005, 0.01, 0.025, 0.05, 0.1 and 0.25 µg/bee.
48-h LD50 = 0.909 µg/bee ≈9.774 mg/kg bw
Note: The DER does not give the dose-response data for the oral assay.
Gough et al. 1984 Used by U.S. EPA/EFED 1988
Soil Assays Eisenia fetida (earthworm)
Avoidance behavior in tropical artificial soil, ≈6% OM (TAS)
Acute LC50/NOEC: 23.9 ppm/10 ppm
Chronic (repro) EC50/NOEC: 4.6 ppm/3.2 ppm
Avoidance EC50/NOEC: 0.2 ppm/<0.3 ppm
Garcia et al. 2008
Eisenia fetida (earthworm)
Avoidance behavior in ≈6.17% OM peat moss (OECD soil)
Acute LC50/NOEC: 99.8 ppm/63.2 ppm
Chronic (repro) EC50/NOEC: 37.4 ppm/10 ppm
Avoidance EC50/NOEC: 3.3 ppm/1 ppm
Garcia et al. 2008
Eisenia fetida (earthworm)
Avoidance behavior in European natural field soil, ≈4.6% OM (LUFA)
Acute LC50/NOEC: 139.9 ppm/31.6 ppm
Chronic (repro) EC50/NOEC: 44.5 ppm/3.216 ppm
Avoidance EC50/NOEC: 0.5 ppm/<0.3 ppm
Garcia et al. 2008
Caenorhabditis elegans (soil nematode)
Soil concentrations of 0.002, 0.02, 0.2, or 2 mg/L.
Concentration dependant decrease in locomotion. No apparent NOEC. Very slight decrease in brood size. Effect on body length only at highest concentration.
No statistics in this paper.
Ruan et al. 2009
Eisenia fetida (earthworm)
Soil LC50 265.5 mg/kg soil Frampton et al. 2006
Porcellionides pruinosus (woodlouse, Isopoda)
Soil LC50 ≈ 0.5 mg/kg soil (most sensitive species; read
from Figure 2, p. 2485
Frampton et al. 2006
147
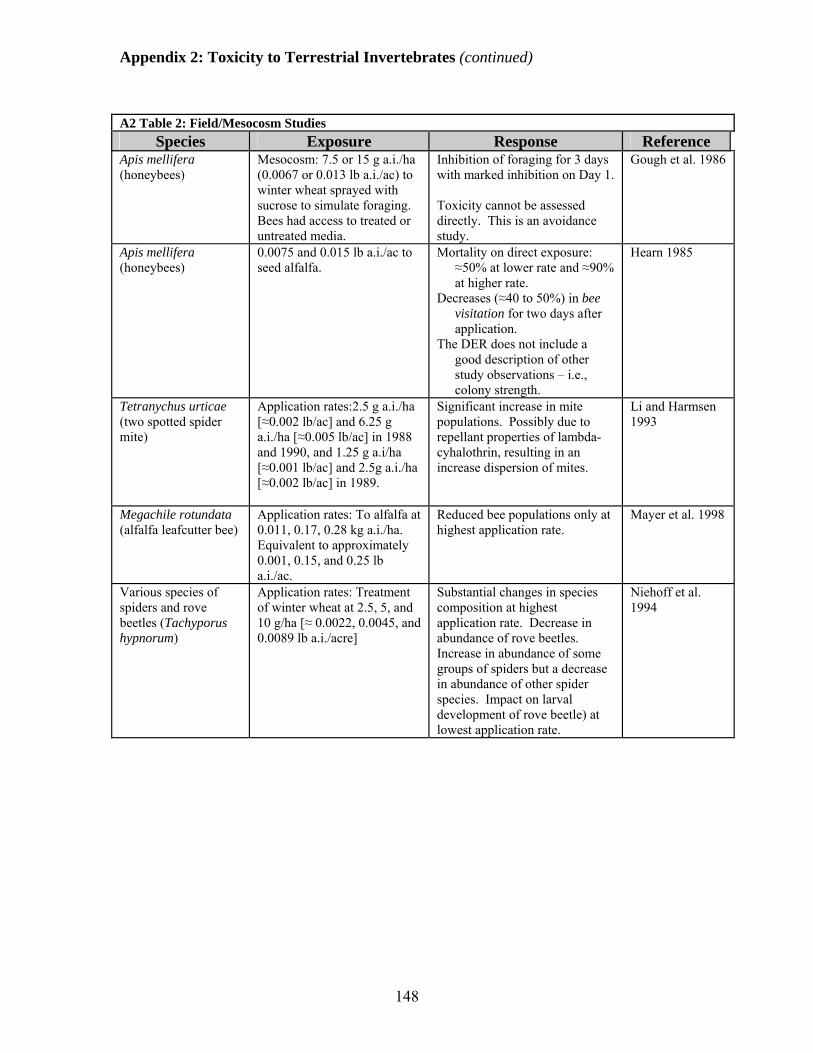
Appendix 2: Toxicity to Terrestrial Invertebrates (continued)
148
A2 Table 2: Field/Mesocosm Studies
Species Exposure Response Reference Apis mellifera (honeybees)
Mesocosm: 7.5 or 15 g a.i./ha (0.0067 or 0.013 lb a.i./ac) to winter wheat sprayed with sucrose to simulate foraging. Bees had access to treated or untreated media.
Inhibition of foraging for 3 days with marked inhibition on Day 1. Toxicity cannot be assessed directly. This is an avoidance study.
Gough et al. 1986
Apis mellifera (honeybees)
0.0075 and 0.015 lb a.i./ac to seed alfalfa.
Mortality on direct exposure: ≈50% at lower rate and ≈90% at higher rate.
Decreases (≈40 to 50%) in bee visitation for two days after application.
The DER does not include a good description of other study observations – i.e., colony strength.
Hearn 1985
Tetranychus urticae (two spotted spider mite)
Application rates:2.5 g a.i./ha [≈0.002 lb/ac] and 6.25 g a.i./ha [≈0.005 lb/ac] in 1988 and 1990, and 1.25 g a.i/ha [≈0.001 lb/ac] and 2.5g a.i./ha [≈0.002 lb/ac] in 1989.
Significant increase in mite populations. Possibly due to repellant properties of lambda-cyhalothrin, resulting in an increase dispersion of mites.
Li and Harmsen 1993
Megachile rotundata (alfalfa leafcutter bee)
Application rates: To alfalfa at 0.011, 0.17, 0.28 kg a.i./ha. Equivalent to approximately 0.001, 0.15, and 0.25 lb a.i./ac.
Reduced bee populations only at highest application rate.
Mayer et al. 1998
Various species of spiders and rove beetles (Tachyporus hypnorum)
Application rates: Treatment of winter wheat at 2.5, 5, and 10 g/ha [≈ 0.0022, 0.0045, and 0.0089 lb a.i./acre]
Substantial changes in species composition at highest application rate. Decrease in abundance of rove beetles. Increase in abundance of some groups of spiders but a decrease in abundance of other spider species. Impact on larval development of rove beetle) at lowest application rate.
Niehoff et al. 1994
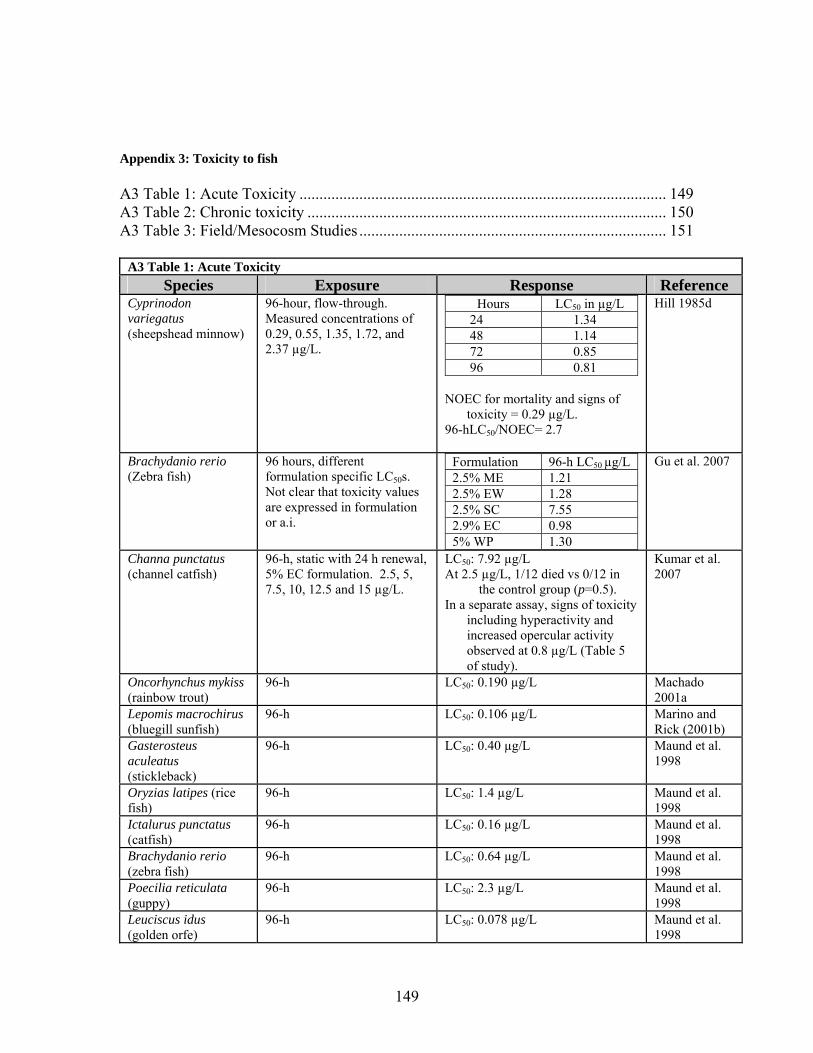
Appendix 3: Toxicity to fish A3 Table 1: Acute Toxicity ............................................................................................ 149 A3 Table 2: Chronic toxicity .......................................................................................... 150 A3 Table 3: Field/Mesocosm Studies ............................................................................. 151
A3 Table 1: Acute Toxicity Species Exposure Response Reference
Cyprinodon variegatus (sheepshead minnow)
96-hour, flow-through. Measured concentrations of 0.29, 0.55, 1.35, 1.72, and 2.37 µg/L.
Hours LC50 in µg/L 24 1.34 48 1.14 72 0.85 96 0.81
NOEC for mortality and signs of
toxicity = 0.29 µg/L. 96-hLC50/NOEC= 2.7
Hill 1985d
Brachydanio rerio (Zebra fish)
96 hours, different formulation specific LC50s. Not clear that toxicity values are expressed in formulation or a.i.
Formulation 96-h LC50 µg/L 2.5% ME 1.21 2.5% EW 1.28 2.5% SC 7.55 2.9% EC 0.98 5% WP 1.30
Gu et al. 2007
Channa punctatus (channel catfish)
96-h, static with 24 h renewal, 5% EC formulation. 2.5, 5, 7.5, 10, 12.5 and 15 µg/L.
LC50: 7.92 µg/L At 2.5 µg/L, 1/12 died vs 0/12 in
the control group (p=0.5). In a separate assay, signs of toxicity
including hyperactivity and increased opercular activity observed at 0.8 µg/L (Table 5 of study).
Kumar et al. 2007
Oncorhynchus mykiss (rainbow trout)
96-h LC50: 0.190 µg/L Machado 2001a
Lepomis macrochirus (bluegill sunfish)
96-h LC50: 0.106 µg/L Marino and Rick (2001b)
Gasterosteus aculeatus (stickleback)
96-h LC50: 0.40 µg/L Maund et al. 1998
Oryzias latipes (rice fish)
96-h LC50: 1.4 µg/L Maund et al. 1998
Ictalurus punctatus (catfish)
96-h LC50: 0.16 µg/L Maund et al. 1998
Brachydanio rerio (zebra fish)
96-h LC50: 0.64 µg/L Maund et al. 1998
Poecilia reticulata (guppy)
96-h LC50: 2.3 µg/L Maund et al. 1998
Leuciscus idus (golden orfe)
96-h LC50: 0.078 µg/L Maund et al. 1998
149
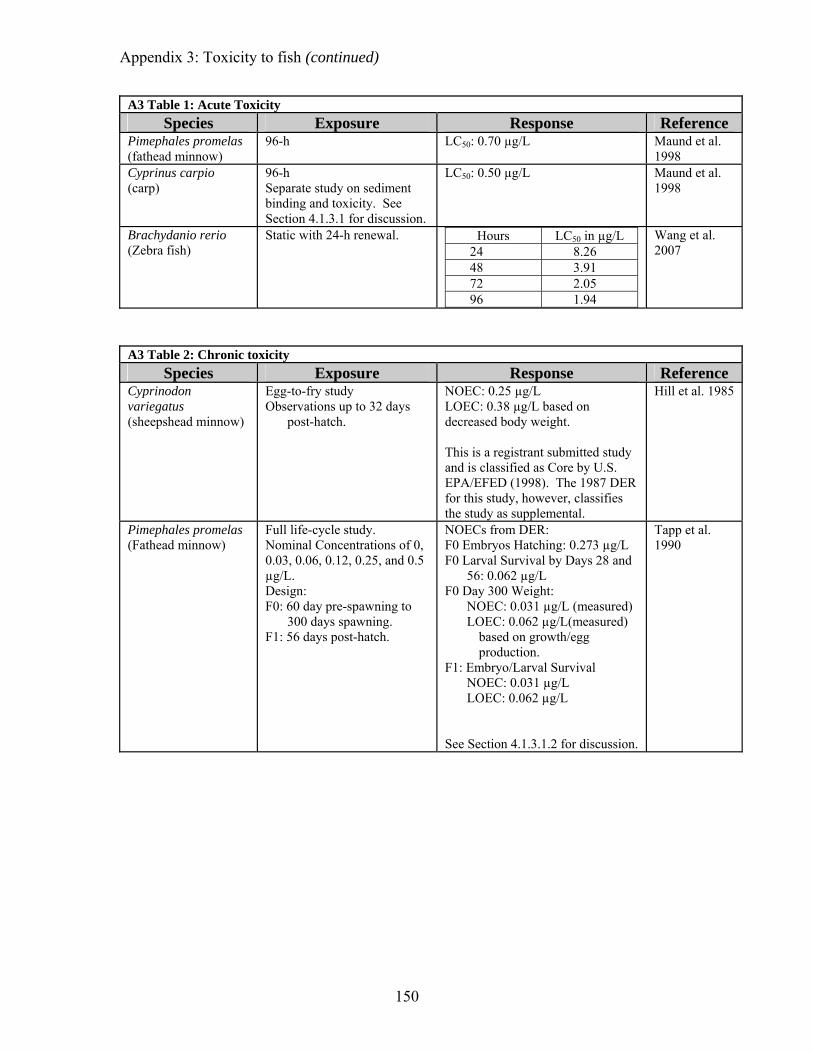
Appendix 3: Toxicity to fish (continued)
A3 Table 1: Acute Toxicity Species Exposure Response Reference
Pimephales promelas (fathead minnow)
96-h LC50: 0.70 µg/L Maund et al. 1998
Cyprinus carpio (carp)
96-h Separate study on sediment binding and toxicity. See Section 4.1.3.1 for discussion.
LC50: 0.50 µg/L Maund et al. 1998
Brachydanio rerio (Zebra fish)
Static with 24-h renewal.
Hours LC50 in µg/L 24 8.26 48 3.91 72 2.05 96 1.94
Wang et al. 2007
A3 Table 2: Chronic toxicity Species Exposure Response Reference
Cyprinodon variegatus (sheepshead minnow)
Egg-to-fry study Observations up to 32 days
post-hatch.
NOEC: 0.25 µg/L LOEC: 0.38 µg/L based on decreased body weight. This is a registrant submitted study and is classified as Core by U.S. EPA/EFED (1998). The 1987 DER for this study, however, classifies the study as supplemental.
Hill et al. 1985
Pimephales promelas (Fathead minnow)
Full life-cycle study. Nominal Concentrations of 0, 0.03, 0.06, 0.12, 0.25, and 0.5 µg/L. Design: F0: 60 day pre-spawning to
300 days spawning. F1: 56 days post-hatch.
NOECs from DER: F0 Embryos Hatching: 0.273 µg/L F0 Larval Survival by Days 28 and
56: 0.062 µg/L F0 Day 300 Weight:
NOEC: 0.031 µg/L (measured) LOEC: 0.062 µg/L(measured)
based on growth/egg production.
F1: Embryo/Larval Survival NOEC: 0.031 µg/L LOEC: 0.062 µg/L
See Section 4.1.3.1.2 for discussion.
Tapp et al. 1990
150
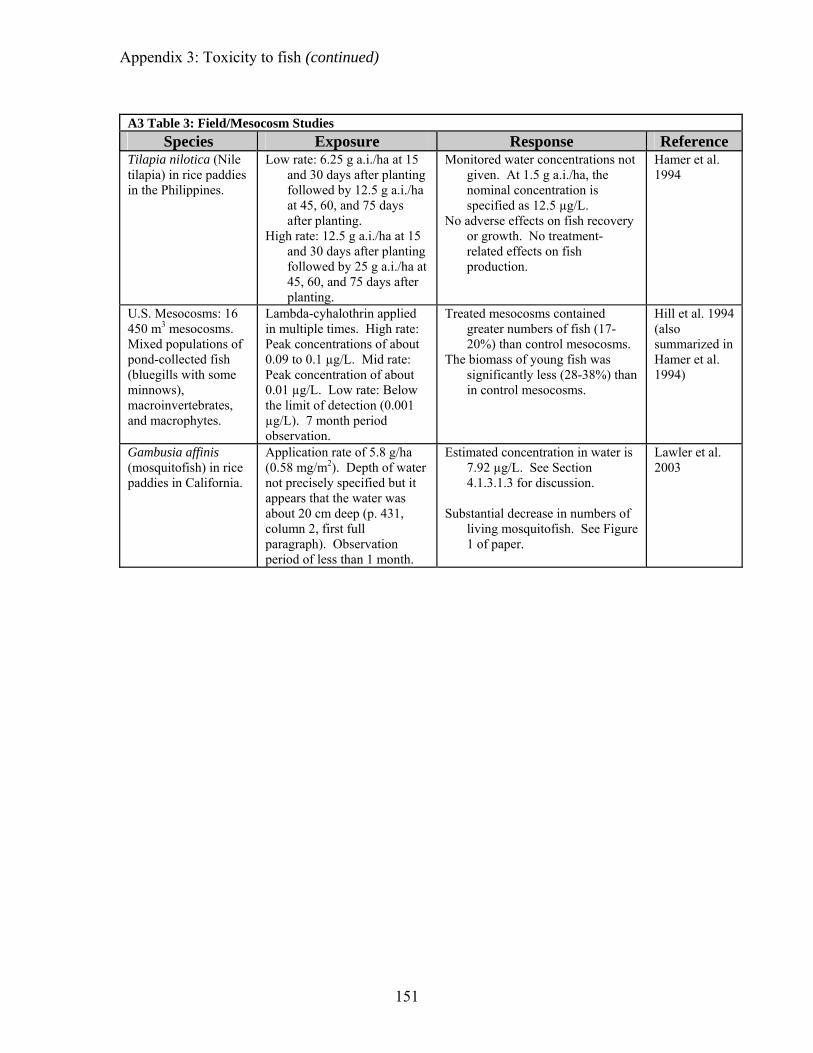
Appendix 3: Toxicity to fish (continued)
151
A3 Table 3: Field/Mesocosm Studies
Species Exposure Response Reference Tilapia nilotica (Nile tilapia) in rice paddies in the Philippines.
Low rate: 6.25 g a.i./ha at 15 and 30 days after planting followed by 12.5 g a.i./ha at 45, 60, and 75 days after planting.
High rate: 12.5 g a.i./ha at 15 and 30 days after planting followed by 25 g a.i./ha at 45, 60, and 75 days after planting.
Monitored water concentrations not given. At 1.5 g a.i./ha, the nominal concentration is specified as 12.5 µg/L.
No adverse effects on fish recovery or growth. No treatment-related effects on fish production.
Hamer et al. 1994
U.S. Mesocosms: 16 450 m3 mesocosms. Mixed populations of pond-collected fish (bluegills with some minnows), macroinvertebrates, and macrophytes.
Lambda-cyhalothrin applied in multiple times. High rate: Peak concentrations of about 0.09 to 0.1 µg/L. Mid rate: Peak concentration of about 0.01 µg/L. Low rate: Below the limit of detection (0.001 µg/L). 7 month period observation.
Treated mesocosms contained greater numbers of fish (17-20%) than control mesocosms.
The biomass of young fish was significantly less (28-38%) than in control mesocosms.
Hill et al. 1994 (also summarized in Hamer et al. 1994)
Gambusia affinis (mosquitofish) in rice paddies in California.
Application rate of 5.8 g/ha (0.58 mg/m2). Depth of water not precisely specified but it appears that the water was about 20 cm deep (p. 431, column 2, first full paragraph). Observation period of less than 1 month.
Estimated concentration in water is 7.92 µg/L. See Section 4.1.3.1.3 for discussion.
Substantial decrease in numbers of
living mosquitofish. See Figure 1 of paper.
Lawler et al. 2003

Appendix 4: Toxicity to aquatic invertebrates. A4 Table 1: Acute toxicity.............................................................................................. 152 A4 Table 2: Chronic toxicity .......................................................................................... 156 A4 Table 3: Field/Mesocosm Studies ............................................................................. 157 A4 Table 1: Acute toxicity
Species Exposure Response Reference Hyalella azteca (amphipod)
American River water, 10 day sediment toxicity bioassay
Sediment LC50: 6 ng/g dry sediment weight
Sediment LC50: 0.14 µg/g OC dry weight
LOEC: 0.14 µg/g OC, 35% reduction in biomass
Amweg et al. 2005
Hyalella azteca (amphipod)
Del Puerto Creek, 10 day sediment toxicity bioassay. Working Note: Concentrations given as sediment or OC and not water column.
Sediment LC50: 5.2 ng/g dry sediment weight
Sediment LC50: 0.46 µg/g OC dry weight.
LOEC: 0.23 µg/g OC, 36% reduction in biomass
Amweg et al. 2005
Daphnia magna lambda-cyhalothrin, technical grade
Determined EC50 and EC10 values in clones of three different populations. See Figure 2 of paper. EC10s: ≈ 0.01 – 0.07 µg/L EC50s: ≈ 0.025 – 0.17 µg/L
Barata et al. 2002
Daphnia magna Technical grade cyhalothrin. Not clear that this is the lambda-cyhalothrin mixture. Assayed for effects on dissolved organic carbon (DOC).
LC50 (µg/L) DOC mg/L 24-h 48-h
1.3 0.61 0.19 6.7 2.91 0.18 9.7 2.86 0.33
See study by Smith and Lizotte 2007 for similar pattern.
Day 1991
Gammarus pulex (amphipod)
48-h EC50: 6.8 ng/L (0.0068 µg/L) Giddings et al. 2009
Mysidopsis bahia (mysid shrimp)
48-h EC50: 4.1 ng/L (0.0041 µg/L) Giddings et al. 2009
Crassostrea gigas (Pacific oyster)
48-h EC50: >590 µg/L Giddings et al. 2009
Macrobrachium nippoensis (shrimp)
96 hours, different formulation specific LC50s. Not clear that toxicity values are expressed in formulation or a.i.
Formulation 96-h LC50 µg/L 2.5% ME 1.21 2.5% EW 1.28 2.5% SC 7.55 2.9% EC 0.98 5% WP 1.30
Gu et al. 2007
152
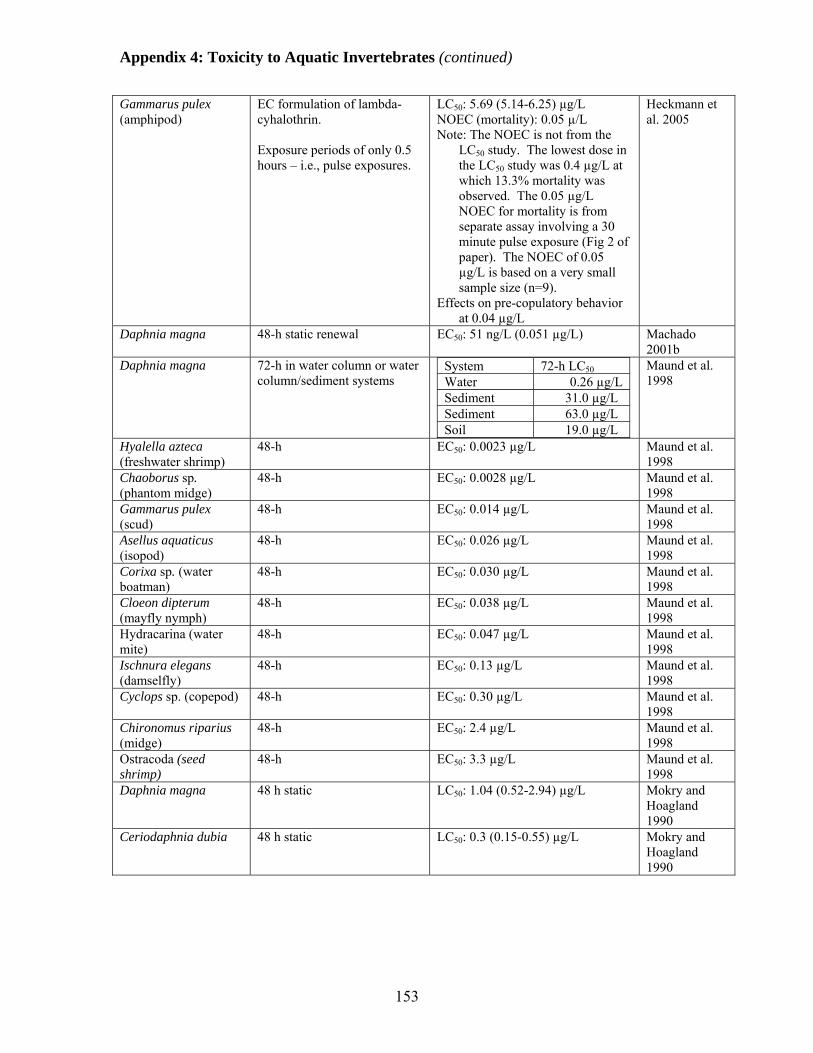
Appendix 4: Toxicity to Aquatic Invertebrates (continued)
Gammarus pulex (amphipod)
EC formulation of lambda-cyhalothrin. Exposure periods of only 0.5 hours – i.e., pulse exposures.
LC50: 5.69 (5.14-6.25) µg/L NOEC (mortality): 0.05 µ/L Note: The NOEC is not from the
LC50 study. The lowest dose in the LC50 study was 0.4 µg/L at which 13.3% mortality was observed. The 0.05 µg/L NOEC for mortality is from separate assay involving a 30 minute pulse exposure (Fig 2 of paper). The NOEC of 0.05 µg/L is based on a very small sample size (n=9).
Effects on pre-copulatory behavior at 0.04 µg/L
Heckmann et al. 2005
Daphnia magna 48-h static renewal EC50: 51 ng/L (0.051 µg/L) Machado 2001b
Daphnia magna 72-h in water column or water column/sediment systems
System 72-h LC50 Water 0.26 µg/L Sediment 31.0 µg/L Sediment 63.0 µg/L Soil 19.0 µg/L
Maund et al. 1998
Hyalella azteca (freshwater shrimp)
48-h EC50: 0.0023 µg/L Maund et al. 1998
Chaoborus sp. (phantom midge)
48-h EC50: 0.0028 µg/L Maund et al. 1998
Gammarus pulex (scud)
48-h EC50: 0.014 µg/L Maund et al. 1998
Asellus aquaticus (isopod)
48-h EC50: 0.026 µg/L Maund et al. 1998
Corixa sp. (water boatman)
48-h EC50: 0.030 µg/L Maund et al. 1998
Cloeon dipterum (mayfly nymph)
48-h EC50: 0.038 µg/L Maund et al. 1998
Hydracarina (water mite)
48-h EC50: 0.047 µg/L Maund et al. 1998
Ischnura elegans (damselfly)
48-h EC50: 0.13 µg/L Maund et al. 1998
Cyclops sp. (copepod) 48-h EC50: 0.30 µg/L Maund et al. 1998
Chironomus riparius (midge)
48-h EC50: 2.4 µg/L Maund et al. 1998
Ostracoda (seed shrimp)
48-h EC50: 3.3 µg/L Maund et al. 1998
Daphnia magna 48 h static LC50: 1.04 (0.52-2.94) µg/L Mokry and Hoagland 1990
Ceriodaphnia dubia 48 h static LC50: 0.3 (0.15-0.55) µg/L Mokry and Hoagland 1990
153

Appendix 4: Toxicity to Aquatic Invertebrates (continued)
Chaoborus obscuripes (phantom midge)
96-h static Note: units are ng not µg.
Duration
EC50 ng/L
LC50 ng/L
48-h 2.8 >27.4 96-h 2.8 75.7
Schroer et al. 2004
Notonecta glauca (backswimmer)
96-h static Note: units are ng not µg.
Duration EC50 ng/L LC50 ng/L
48-h 14.8 22.6 96-h 16.4
Schroer et al. 2004
Proasellus coxalis (isopod)
96-h static Note: units are ng not µg.
Duration EC50 ng/L LC50 ng/L
48-h 17.7 78.8 96-h 27.4 44.6
Schroer et al. 2004
Caenis horaria (Ephemeroptera)
96-h static Note: units are ng not µg.
Duration EC50 ng/L LC50 ng/L
48-h 17.9 257 96-h 13.6 34.6
Schroer et al. 2004
Sigara striata (Hemiptera)
96-h static Note: units are ng not µg.
Duration EC50 ng/L LC50 ng/L 48-h 18.2 49.2
Schroer et al. 2004
Gammarus pulex (scud)
96-h static Note: units are ng not µg.
Duration EC50 ng/L LC50 ng/L
48-h 23.6 31.4 96-h 24.2 24.2
Schroer et al. 2004
Asellus aquaticus (isopod)
96-h static Note: units are ng not µg.
Duration EC50 ng/L LC50 ng/L
48-h 24.8 140 96-h 24.8 75.2
Schroer et al. 2004
Cloeon dipterum (Ephemeroptera)
96-h static Note: units are ng not µg.
Duration EC50 ng/L LC50 ng/L
48-h 24.8 122 96-h 88.3 105
Schroer et al. 2004
Sialis lutaria (Alderfly)
96-h static Note: units are ng not µg.
Duration EC50 ng/L LC50 ng/L
48-h 51.5 >2179 96-h 28 >2179
Schroer et al. 2004
Daphnia galeata (daphnid)
96-h static Note: units are ng not µg.
Duration EC50 ng/L LC50 ng/L
48-h 117 397 Schroer et al. 2004
Macropelopia sp. (chironomid)
96-h static Note: units are ng not µg.
Duration EC50 ng/L LC50 ng/L
48-h 244 1019 96-h 63.4 698
Schroer et al. 2004
Erythromma viridulum (damselfly)
96-h static Note: units are ng not µg.
Duration EC50 ng/L LC50 ng/L
48-h 689 1583 96-h 493 493
Schroer et al. 2004
Simocephalus vetulus (fairy shrimp)
96-h static Note: units are ng not µg.
Duration EC50 ng/L LC50 ng/L
48-h 957 1340 Schroer et al. 2004
Bithynia tentaculata (snail)
96-h static
8900 ng/L. Organisms closed operculum.
Schroer et al. 2004
Lymnaea stagnalis (snail)
96-h static
No concentration-response relationship over the range of 207 to 20,129 ng/L.
Schroer et al. 2004
Polycelis nigra/tenuis (flatworm)
96-h static
No concentration-response relationship over the range of 226 to 30,759 ng/L.
Schroer et al. 2004
Hyalella azteca (amphipod)
48 h static bioassays in waters with difference concentrations of organic matter.
48 h-EC50 values ranging from 1.7 ng/L to 15.7 ng/L. Significant inverse correlation of toxicity with organic carbon as well as chlorophyll a, turbidity, and suspended solids.
See Figure 7 in the current Forest
Smith and Lizotte 2007
154

Appendix 4: Toxicity to Aquatic Invertebrates (continued)
Service risk assessment. Caridina laevis (freshwater shrimp)
Static exposures 24-h LC50: 0.87 (0.76-0.98) µg/L 96-h LC50: 0.33 (0.30-0.37) µg/L 96-h NOEC: 0.1 µg/L 96-h LOEC: 0.2 µg/L
Sucahyo et al. 2008
Daphnia magna N.S. LC50: 0.36 µg/L U.S. EPA/OPP 1988a
Gammarus pulex N.S. 2 LC50 values reported 6.68 ng/L (0.00668 µg/L) 9.13 ng/L (0.00913 µg/L)
U.S. EPA/OPP 1988a
Macrobrachium nippoensis (shrimp)
Static with 24-h renewal. Hours LC50 in µg/L 24 0.05 48 0.04 72 0.04 96 0.04
Wang et al. 2007
155

Appendix 4: Toxicity to Aquatic Invertebrates (continued)
A4 Table 2: Chronic toxicity
Species Exposure Response Reference Daphnia magna Technical grade, 0.1 to 0.5
nmol/L. 10-day reproduction study. (Based on a MW of 449.9, concentrations were about 0.045 µg/L to 0.225 µg/L).
Feeding: no NOEC. LOEC 0.1 nmol/L (or 0.045 µg/L).
Reproduction: Apparent NOEC of 0.045 µg/L with LOEC of about 0.135 µg/L.
See Fig. 1 in paper.
Barata et al. 2006 and Barata et al. 2007
Daphnia magna Details not specified but presumably a standard 21-day study.
Reproduction: NOEC: 8.5 ng/L (0.0085 µg/L) LOEC: 18.3 ng/L (0.0183 µg/L)
Growth: NOEC: 18.3 ng/L (0.0183 µg/L) LOEC: 37.2 ng/L (0.0372 µg/L)
Hamer et al. 1985b; summarized in U.S. EPA/EFED 1988
Daphnia magna Chronic study (NOS) NOEC: 0.00198 µg/L LOEC: 0.0035 µg/L
U.S. EPA/EFED 1994a,b
Daphnia magna 21-day study. See Table 1 of publication. No details.
NOEC: 0.002 µg/L. This appears to be the same study
summarized in U.S. EPA/EFED 1994a,b.
Maund et al. 1998
Mysidopsis bahia (mysid shrimp)
Life-cycle study. DER summarizes information on measured concentrations for a complete listing of measured concentrations is not given.
NOEC for survival and weight: 1.7 ng/L (0.0017 µg/L)
NOEC for reproduction: 0.22 ng/L (0.00022 µg/L)
LOEC for reproduction: 0.46 ng/L (0.00046 µg/L)
Thompson 1987
156
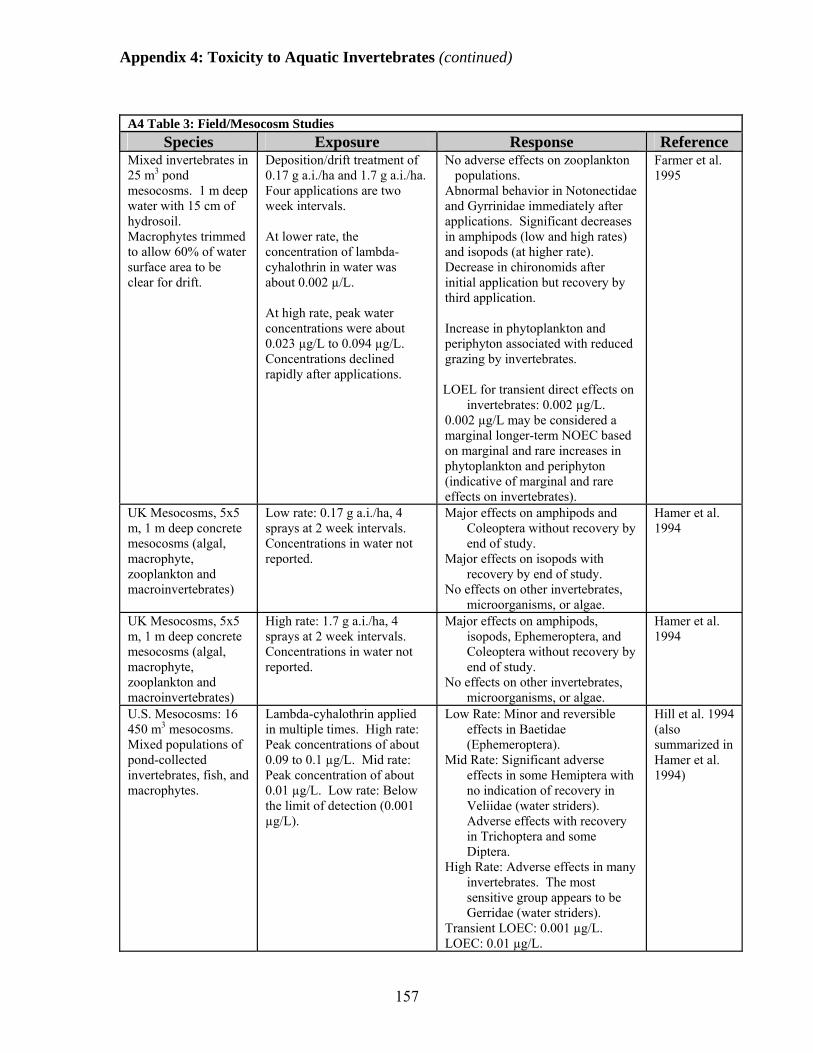
Appendix 4: Toxicity to Aquatic Invertebrates (continued)
A4 Table 3: Field/Mesocosm Studies
Species Exposure Response Reference Mixed invertebrates in 25 m3 pond mesocosms. 1 m deep water with 15 cm of hydrosoil. Macrophytes trimmed to allow 60% of water surface area to be clear for drift.
Deposition/drift treatment of 0.17 g a.i./ha and 1.7 g a.i./ha. Four applications are two week intervals. At lower rate, the concentration of lambda-cyhalothrin in water was about 0.002 µ/L. At high rate, peak water concentrations were about 0.023 µg/L to 0.094 µg/L. Concentrations declined rapidly after applications.
No adverse effects on zooplankton populations.
Abnormal behavior in Notonectidae and Gyrrinidae immediately after applications. Significant decreases in amphipods (low and high rates) and isopods (at higher rate). Decrease in chironomids after initial application but recovery by third application. Increase in phytoplankton and periphyton associated with reduced grazing by invertebrates. LOEL for transient direct effects on
invertebrates: 0.002 µg/L. 0.002 µg/L may be considered a marginal longer-term NOEC based on marginal and rare increases in phytoplankton and periphyton (indicative of marginal and rare effects on invertebrates).
Farmer et al. 1995
UK Mesocosms, 5x5 m, 1 m deep concrete mesocosms (algal, macrophyte, zooplankton and macroinvertebrates)
Low rate: 0.17 g a.i./ha, 4 sprays at 2 week intervals. Concentrations in water not reported.
Major effects on amphipods and Coleoptera without recovery by end of study.
Major effects on isopods with recovery by end of study.
No effects on other invertebrates, microorganisms, or algae.
Hamer et al. 1994
UK Mesocosms, 5x5 m, 1 m deep concrete mesocosms (algal, macrophyte, zooplankton and macroinvertebrates)
High rate: 1.7 g a.i./ha, 4 sprays at 2 week intervals. Concentrations in water not reported.
Major effects on amphipods, isopods, Ephemeroptera, and Coleoptera without recovery by end of study.
No effects on other invertebrates, microorganisms, or algae.
Hamer et al. 1994
U.S. Mesocosms: 16 450 m3 mesocosms. Mixed populations of pond-collected invertebrates, fish, and macrophytes.
Lambda-cyhalothrin applied in multiple times. High rate: Peak concentrations of about 0.09 to 0.1 µg/L. Mid rate: Peak concentration of about 0.01 µg/L. Low rate: Below the limit of detection (0.001 µg/L).
Low Rate: Minor and reversible effects in Baetidae (Ephemeroptera).
Mid Rate: Significant adverse effects in some Hemiptera with no indication of recovery in Veliidae (water striders). Adverse effects with recovery in Trichoptera and some Diptera.
High Rate: Adverse effects in many invertebrates. The most sensitive group appears to be Gerridae (water striders).
Transient LOEC: 0.001 µg/L. LOEC: 0.01 µg/L.
Hill et al. 1994 (also summarized in Hamer et al. 1994)
157
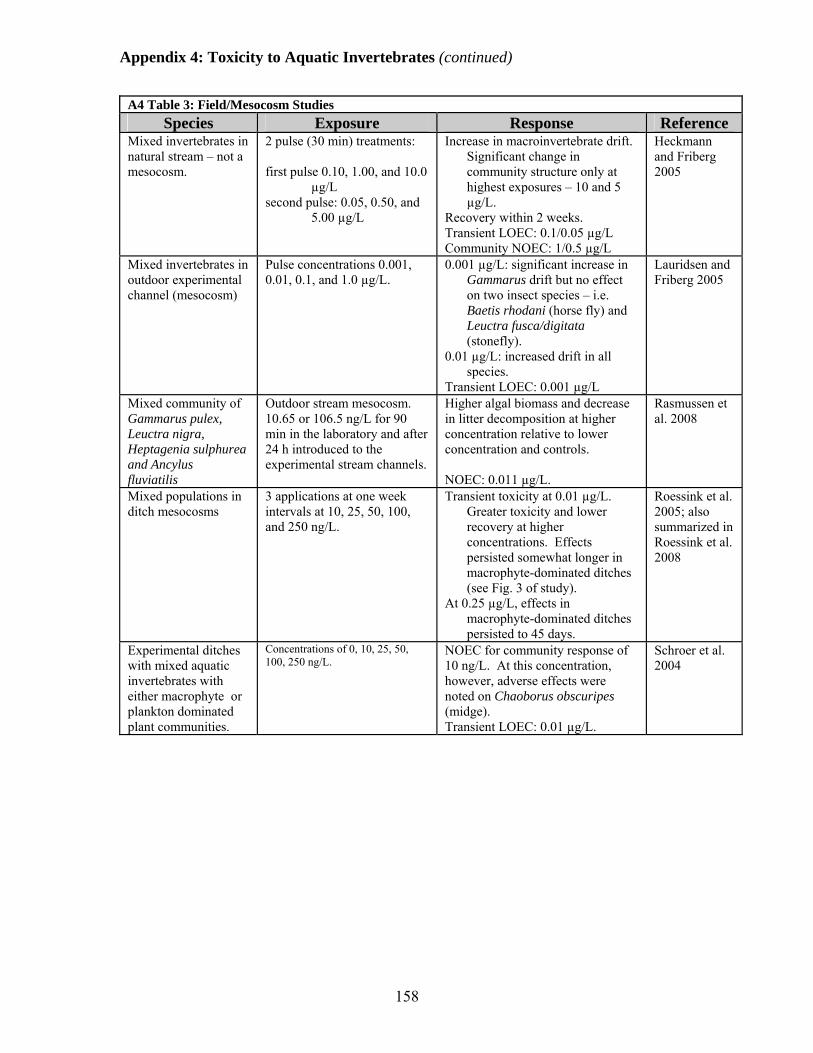
Appendix 4: Toxicity to Aquatic Invertebrates (continued)
A4 Table 3: Field/Mesocosm Studies Species Exposure Response Reference
Mixed invertebrates in natural stream – not a mesocosm.
2 pulse (30 min) treatments: first pulse 0.10, 1.00, and 10.0
µg/L second pulse: 0.05, 0.50, and
5.00 µg/L
Increase in macroinvertebrate drift. Significant change in community structure only at highest exposures – 10 and 5 µg/L.
Recovery within 2 weeks. Transient LOEC: 0.1/0.05 µg/L Community NOEC: 1/0.5 µg/L
Heckmann and Friberg 2005
Mixed invertebrates in outdoor experimental channel (mesocosm)
Pulse concentrations 0.001, 0.01, 0.1, and 1.0 µg/L.
0.001 µg/L: significant increase in Gammarus drift but no effect on two insect species – i.e. Baetis rhodani (horse fly) and Leuctra fusca/digitata (stonefly).
0.01 µg/L: increased drift in all species.
Transient LOEC: 0.001 µg/L
Lauridsen and Friberg 2005
Mixed community of Gammarus pulex, Leuctra nigra, Heptagenia sulphurea and Ancylus fluviatilis
Outdoor stream mesocosm. 10.65 or 106.5 ng/L for 90 min in the laboratory and after 24 h introduced to the experimental stream channels.
Higher algal biomass and decrease in litter decomposition at higher concentration relative to lower concentration and controls. NOEC: 0.011 µg/L.
Rasmussen et al. 2008
Mixed populations in ditch mesocosms
3 applications at one week intervals at 10, 25, 50, 100, and 250 ng/L.
Transient toxicity at 0.01 µg/L. Greater toxicity and lower recovery at higher concentrations. Effects persisted somewhat longer in macrophyte-dominated ditches (see Fig. 3 of study).
At 0.25 µg/L, effects in macrophyte-dominated ditches persisted to 45 days.
Roessink et al. 2005; also summarized in Roessink et al. 2008
Experimental ditches with mixed aquatic invertebrates with either macrophyte or plankton dominated plant communities.
Concentrations of 0, 10, 25, 50, 100, 250 ng/L.
NOEC for community response of 10 ng/L. At this concentration, however, adverse effects were noted on Chaoborus obscuripes (midge). Transient LOEC: 0.01 µg/L.
Schroer et al. 2004
158
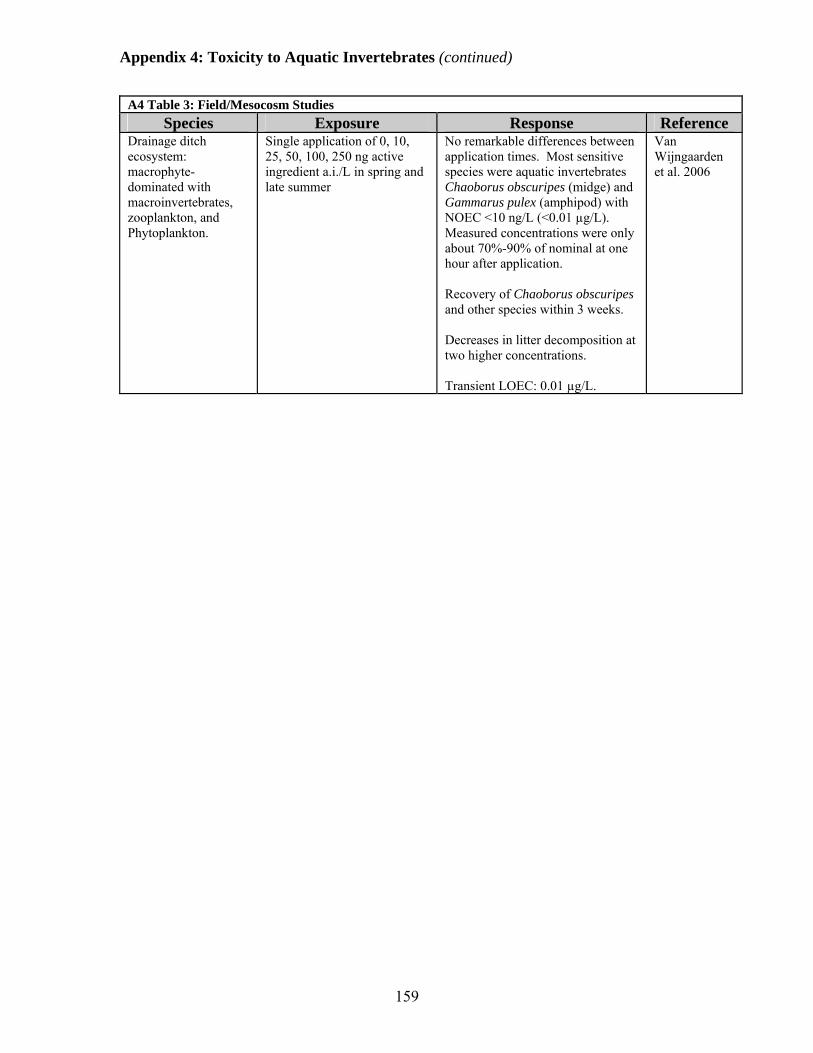
Appendix 4: Toxicity to Aquatic Invertebrates (continued)
159
A4 Table 3: Field/Mesocosm Studies Species Exposure Response Reference
Drainage ditch ecosystem: macrophyte-dominated with macroinvertebrates, zooplankton, and Phytoplankton.
Single application of 0, 10, 25, 50, 100, 250 ng active ingredient a.i./L in spring and late summer
No remarkable differences between application times. Most sensitive species were aquatic invertebrates Chaoborus obscuripes (midge) and Gammarus pulex (amphipod) with NOEC <10 ng/L (<0.01 µg/L). Measured concentrations were only about 70%-90% of nominal at one hour after application. Recovery of Chaoborus obscuripes and other species within 3 weeks. Decreases in litter decomposition at two higher concentrations. Transient LOEC: 0.01 µg/L.
Van Wijngaarden et al. 2006
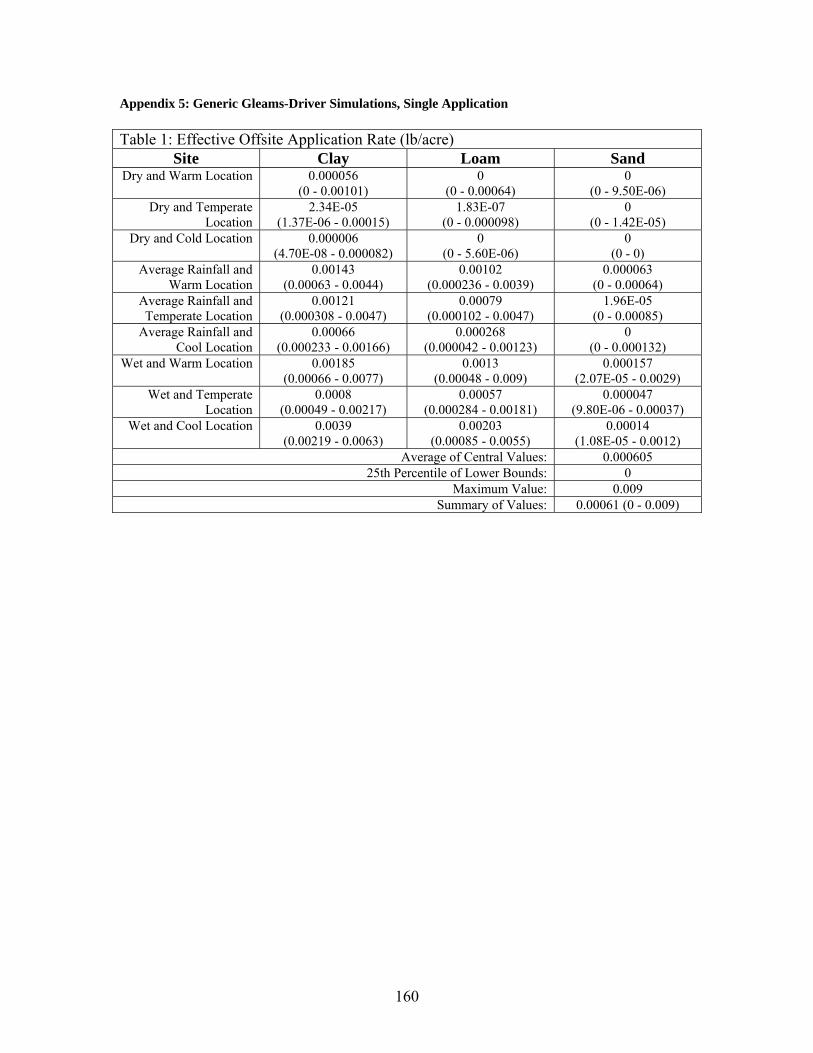
Appendix 5: Generic Gleams-Driver Simulations, Single Application Table 1: Effective Offsite Application Rate (lb/acre)
Site Clay Loam Sand Dry and Warm Location 0.000056
(0 - 0.00101) 0
(0 - 0.00064) 0
(0 - 9.50E-06) Dry and Temperate
Location 2.34E-05
(1.37E-06 - 0.00015) 1.83E-07
(0 - 0.000098) 0
(0 - 1.42E-05) Dry and Cold Location 0.000006
(4.70E-08 - 0.000082) 0
(0 - 5.60E-06) 0
(0 - 0) Average Rainfall and
Warm Location 0.00143
(0.00063 - 0.0044) 0.00102
(0.000236 - 0.0039) 0.000063
(0 - 0.00064) Average Rainfall and Temperate Location
0.00121 (0.000308 - 0.0047)
0.00079 (0.000102 - 0.0047)
1.96E-05 (0 - 0.00085)
Average Rainfall and Cool Location
0.00066 (0.000233 - 0.00166)
0.000268 (0.000042 - 0.00123)
0 (0 - 0.000132)
Wet and Warm Location 0.00185 (0.00066 - 0.0077)
0.0013 (0.00048 - 0.009)
0.000157 (2.07E-05 - 0.0029)
Wet and Temperate Location
0.0008 (0.00049 - 0.00217)
0.00057 (0.000284 - 0.00181)
0.000047 (9.80E-06 - 0.00037)
Wet and Cool Location 0.0039 (0.00219 - 0.0063)
0.00203 (0.00085 - 0.0055)
0.00014 (1.08E-05 - 0.0012)
Average of Central Values: 0.000605 25th Percentile of Lower Bounds: 0
Maximum Value: 0.009 Summary of Values: 0.00061 (0 - 0.009)
160
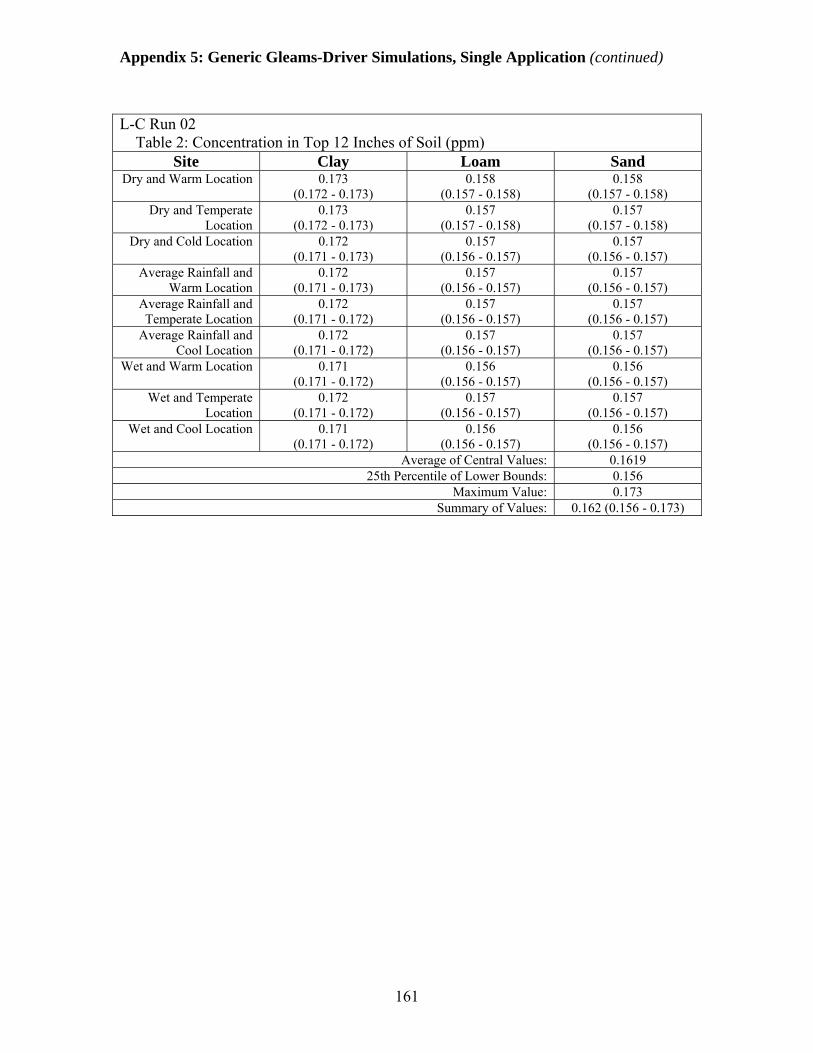
Appendix 5: Generic Gleams-Driver Simulations, Single Application (continued)
L-C Run 02 Table 2: Concentration in Top 12 Inches of Soil (ppm)
Site Clay Loam Sand Dry and Warm Location 0.173
(0.172 - 0.173) 0.158
(0.157 - 0.158) 0.158
(0.157 - 0.158) Dry and Temperate
Location 0.173
(0.172 - 0.173) 0.157
(0.157 - 0.158) 0.157
(0.157 - 0.158) Dry and Cold Location 0.172
(0.171 - 0.173) 0.157
(0.156 - 0.157) 0.157
(0.156 - 0.157) Average Rainfall and
Warm Location 0.172
(0.171 - 0.173) 0.157
(0.156 - 0.157) 0.157
(0.156 - 0.157) Average Rainfall and Temperate Location
0.172 (0.171 - 0.172)
0.157 (0.156 - 0.157)
0.157 (0.156 - 0.157)
Average Rainfall and Cool Location
0.172 (0.171 - 0.172)
0.157 (0.156 - 0.157)
0.157 (0.156 - 0.157)
Wet and Warm Location 0.171 (0.171 - 0.172)
0.156 (0.156 - 0.157)
0.156 (0.156 - 0.157)
Wet and Temperate Location
0.172 (0.171 - 0.172)
0.157 (0.156 - 0.157)
0.157 (0.156 - 0.157)
Wet and Cool Location 0.171 (0.171 - 0.172)
0.156 (0.156 - 0.157)
0.156 (0.156 - 0.157)
Average of Central Values: 0.1619 25th Percentile of Lower Bounds: 0.156
Maximum Value: 0.173 Summary of Values: 0.162 (0.156 - 0.173)
161
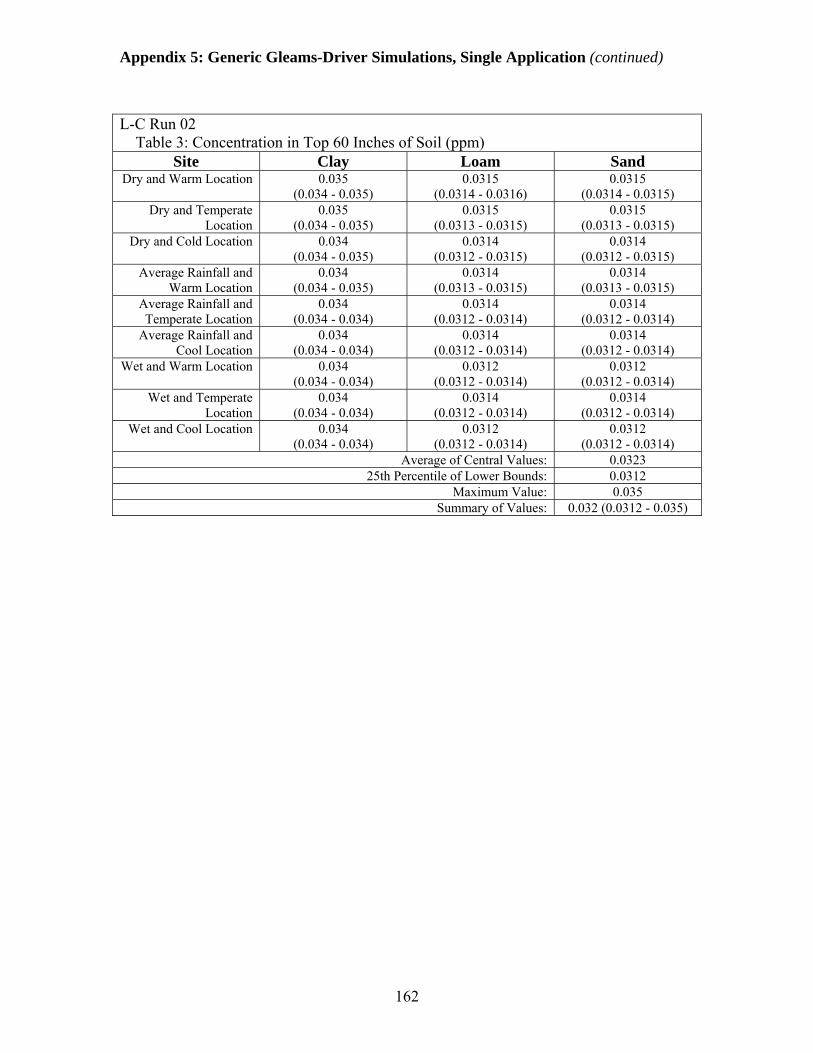
Appendix 5: Generic Gleams-Driver Simulations, Single Application (continued)
L-C Run 02 Table 3: Concentration in Top 60 Inches of Soil (ppm)
Site Clay Loam Sand Dry and Warm Location 0.035
(0.034 - 0.035) 0.0315
(0.0314 - 0.0316) 0.0315
(0.0314 - 0.0315) Dry and Temperate
Location 0.035
(0.034 - 0.035) 0.0315
(0.0313 - 0.0315) 0.0315
(0.0313 - 0.0315) Dry and Cold Location 0.034
(0.034 - 0.035) 0.0314
(0.0312 - 0.0315) 0.0314
(0.0312 - 0.0315) Average Rainfall and
Warm Location 0.034
(0.034 - 0.035) 0.0314
(0.0313 - 0.0315) 0.0314
(0.0313 - 0.0315) Average Rainfall and Temperate Location
0.034 (0.034 - 0.034)
0.0314 (0.0312 - 0.0314)
0.0314 (0.0312 - 0.0314)
Average Rainfall and Cool Location
0.034 (0.034 - 0.034)
0.0314 (0.0312 - 0.0314)
0.0314 (0.0312 - 0.0314)
Wet and Warm Location 0.034 (0.034 - 0.034)
0.0312 (0.0312 - 0.0314)
0.0312 (0.0312 - 0.0314)
Wet and Temperate Location
0.034 (0.034 - 0.034)
0.0314 (0.0312 - 0.0314)
0.0314 (0.0312 - 0.0314)
Wet and Cool Location 0.034 (0.034 - 0.034)
0.0312 (0.0312 - 0.0314)
0.0312 (0.0312 - 0.0314)
Average of Central Values: 0.0323 25th Percentile of Lower Bounds: 0.0312
Maximum Value: 0.035 Summary of Values: 0.032 (0.0312 - 0.035)
162

Appendix 5: Generic Gleams-Driver Simulations, Single Application (continued)
L-C Run 02 Table 4: Maximum Penetration into Soil Column (inches)
Site Clay Loam Sand Dry and Warm Location 4
(4 - 4) 4
(4 - 4) 4
(4 - 4) Dry and Temperate
Location 4
(4 - 4) 4
(4 - 4) 4
(4 - 4) Dry and Cold Location 4
(4 - 4) 4
(4 - 4) 4
(4 - 4) Average Rainfall and
Warm Location 4
(4 - 4) 4
(4 - 4) 8
(4 - 8) Average Rainfall and Temperate Location
4 (4 - 4)
4 (4 - 4)
8 (4 - 8)
Average Rainfall and Cool Location
4 (4 - 4)
4 (4 - 4)
4 (4 - 8)
Wet and Warm Location 4 (4 - 4)
4 (4 - 4)
8 (8 - 8)
Wet and Temperate Location
4 (4 - 4)
4 (4 - 4)
8 (4 - 8)
Wet and Cool Location 4 (4 - 4)
4 (4 - 8)
8 (8 - 8)
Average of Central Values: 4.74 25th Percentile of Lower Bounds: 4
Maximum Value: 8 Summary of Values: 4.74 (4 - 8)
163

Appendix 5: Generic Gleams-Driver Simulations, Single Application (continued)
L-C Run 02 Table 5: Stream, Maximum Peak Concentration in Surface Water (ug/L or ppb)
Site Clay Loam Sand Dry and Warm Location 0.005
(4E-17 - 0.07) 4E-105
(0 - 0.08) 0
(0 - 0.0025) Dry and Temperate
Location 0.0019
(0.00014 - 0.013) 0.00005
(0 - 0.01) 0
(0 - 0.0021) Dry and Cold Location 0.0007
(0.000005 - 0.008) 0
(0 - 0.0008) 0
(0 - 0) Average Rainfall and
Warm Location 0.08
(0.028 - 0.23) 0.08
(0.021 - 0.29) 0.014
(4.0E-10 - 0.16) Average Rainfall and Temperate Location
0.06 (0.018 - 0.3)
0.06 (0.012 - 0.4)
0.004 (1.7E-115 - 0.22)
Average Rainfall and Cool Location
0.04 (0.01 - 0.13)
0.024 (0.004 - 0.14)
1.3E-47 (0 - 0.04)
Wet and Warm Location 0.09 (0.03 - 0.6)
0.1 (0.03 - 1.03)
0.029 (0.004 - 0.7)
Wet and Temperate Location
0.04 (0.015 - 0.1)
0.04 (0.013 - 0.13)
0.008 (0.0014 - 0.06)
Wet and Cool Location 0.08 (0.04 - 0.4)
0.09 (0.029 - 0.5)
0.02 (0.0017 - 0.22)
Average of Central Values: 0.0321 25th Percentile of Lower Bounds: 8.5E-116
Maximum Value: 1.03 Summary of Values: 0.032 (8.5E-116 - 1.03)
164
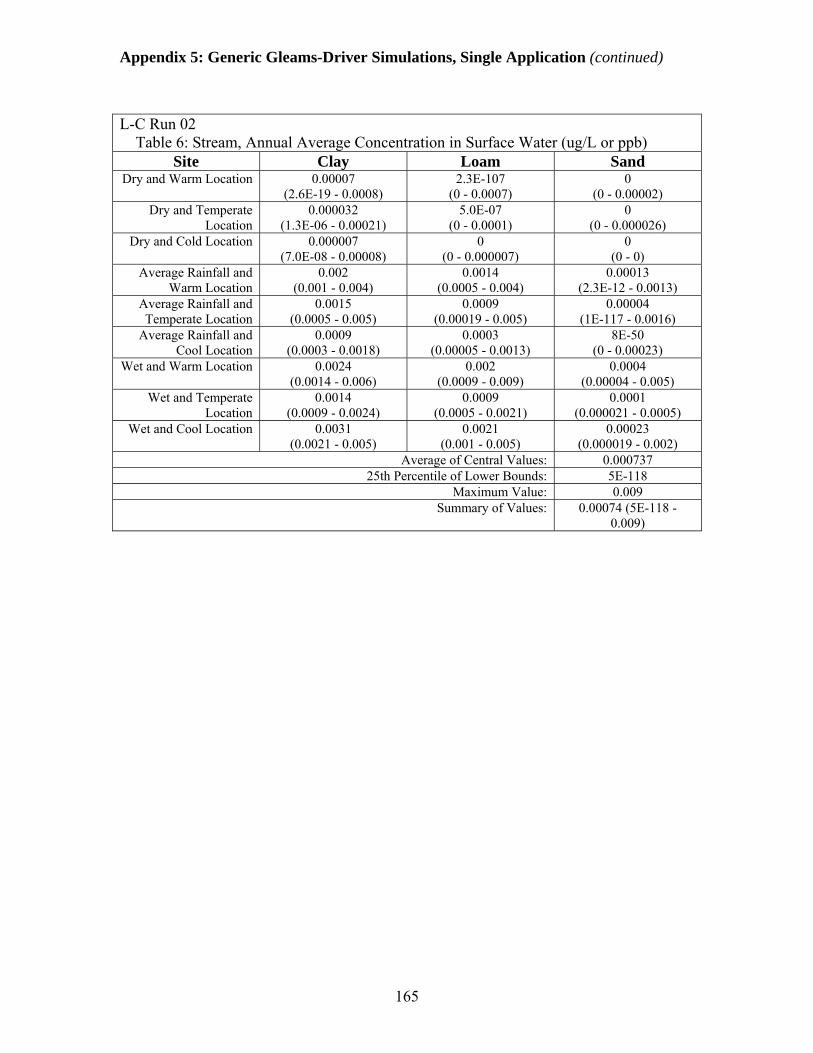
Appendix 5: Generic Gleams-Driver Simulations, Single Application (continued)
L-C Run 02 Table 6: Stream, Annual Average Concentration in Surface Water (ug/L or ppb)
Site Clay Loam Sand Dry and Warm Location 0.00007
(2.6E-19 - 0.0008) 2.3E-107
(0 - 0.0007) 0
(0 - 0.00002) Dry and Temperate
Location 0.000032
(1.3E-06 - 0.00021) 5.0E-07
(0 - 0.0001) 0
(0 - 0.000026) Dry and Cold Location 0.000007
(7.0E-08 - 0.00008) 0
(0 - 0.000007) 0
(0 - 0) Average Rainfall and
Warm Location 0.002
(0.001 - 0.004) 0.0014
(0.0005 - 0.004) 0.00013
(2.3E-12 - 0.0013) Average Rainfall and Temperate Location
0.0015 (0.0005 - 0.005)
0.0009 (0.00019 - 0.005)
0.00004 (1E-117 - 0.0016)
Average Rainfall and Cool Location
0.0009 (0.0003 - 0.0018)
0.0003 (0.00005 - 0.0013)
8E-50 (0 - 0.00023)
Wet and Warm Location 0.0024 (0.0014 - 0.006)
0.002 (0.0009 - 0.009)
0.0004 (0.00004 - 0.005)
Wet and Temperate Location
0.0014 (0.0009 - 0.0024)
0.0009 (0.0005 - 0.0021)
0.0001 (0.000021 - 0.0005)
Wet and Cool Location 0.0031 (0.0021 - 0.005)
0.0021 (0.001 - 0.005)
0.00023 (0.000019 - 0.002)
Average of Central Values: 0.000737 25th Percentile of Lower Bounds: 5E-118
Maximum Value: 0.009 Summary of Values: 0.00074 (5E-118 -
0.009)
165
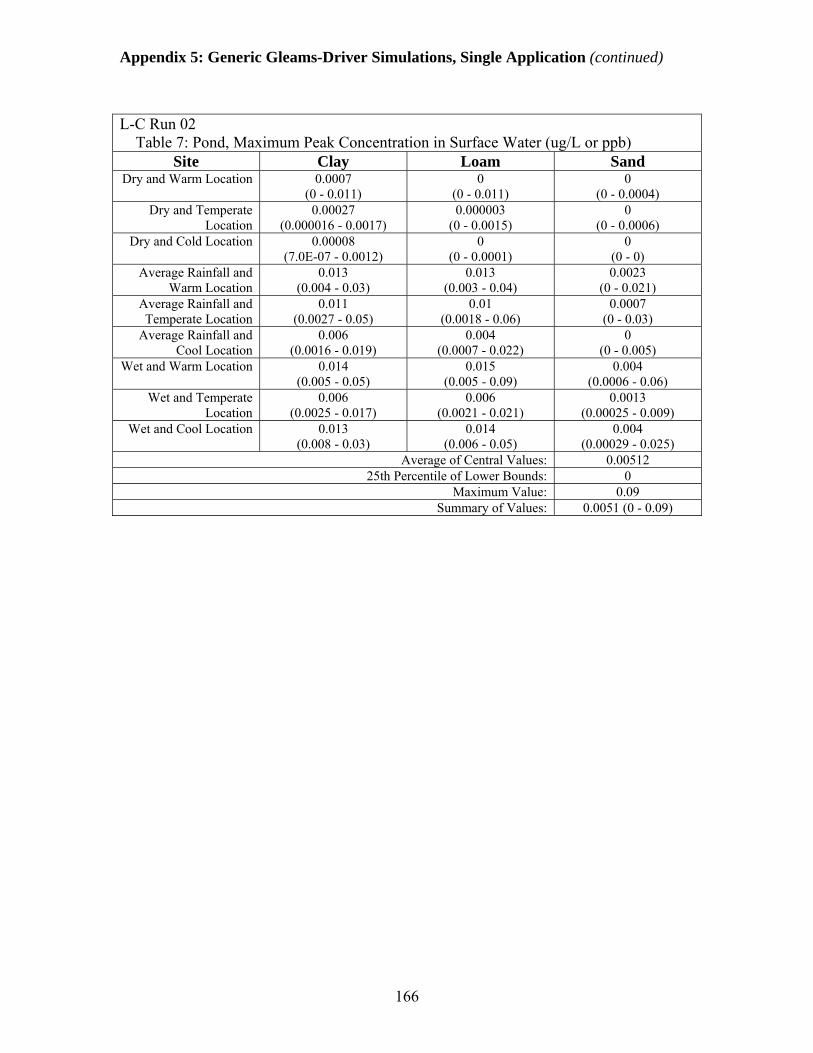
Appendix 5: Generic Gleams-Driver Simulations, Single Application (continued)
L-C Run 02 Table 7: Pond, Maximum Peak Concentration in Surface Water (ug/L or ppb)
Site Clay Loam Sand Dry and Warm Location 0.0007
(0 - 0.011) 0
(0 - 0.011) 0
(0 - 0.0004) Dry and Temperate
Location 0.00027
(0.000016 - 0.0017) 0.000003
(0 - 0.0015) 0
(0 - 0.0006) Dry and Cold Location 0.00008
(7.0E-07 - 0.0012) 0
(0 - 0.0001) 0
(0 - 0) Average Rainfall and
Warm Location 0.013
(0.004 - 0.03) 0.013
(0.003 - 0.04) 0.0023
(0 - 0.021) Average Rainfall and Temperate Location
0.011 (0.0027 - 0.05)
0.01 (0.0018 - 0.06)
0.0007 (0 - 0.03)
Average Rainfall and Cool Location
0.006 (0.0016 - 0.019)
0.004 (0.0007 - 0.022)
0 (0 - 0.005)
Wet and Warm Location 0.014 (0.005 - 0.05)
0.015 (0.005 - 0.09)
0.004 (0.0006 - 0.06)
Wet and Temperate Location
0.006 (0.0025 - 0.017)
0.006 (0.0021 - 0.021)
0.0013 (0.00025 - 0.009)
Wet and Cool Location 0.013 (0.008 - 0.03)
0.014 (0.006 - 0.05)
0.004 (0.00029 - 0.025)
Average of Central Values: 0.00512 25th Percentile of Lower Bounds: 0
Maximum Value: 0.09 Summary of Values: 0.0051 (0 - 0.09)
166

Appendix 5: Generic Gleams-Driver Simulations, Single Application (continued)
167
L-C Run 02 Table 8: Pond, Annual Average Concentration in Surface Water (ug/L or ppb)
Site Clay Loam Sand Dry and Warm Location 0.000008
(0 - 0.0001) 0
(0 - 0.00008) 0
(0 - 2.9E-06) Dry and Temperate
Location 0.000003
(1.5E-07 - 0.000029) 2.3E-08
(0 - 0.000013) 0
(0 - 0.000004) Dry and Cold Location 7.0E-07
(8.0E-09 - 0.000009) 0
(0 - 7.0E-07) 0
(0 - 0) Average Rainfall and
Warm Location 0.00028
(0.00014 - 0.0007) 0.00021
(0.00007 - 0.0007) 0.000023
(0 - 0.00021) Average Rainfall and Temperate Location
0.00022 (0.00006 - 0.0007)
0.00014 (0.000026 - 0.0007)
0.000007 (0 - 0.00028)
Average Rainfall and Cool Location
0.00012 (0.00004 - 0.00028)
0.00004 (0.000006 - 0.0002)
0 (0 - 0.00004)
Wet and Warm Location 0.0004 (0.0002 - 0.0008)
0.0003 (0.00013 - 0.0011)
0.00006 (0.000007 - 0.0007)
Wet and Temperate Location
0.0002 (0.00014 - 0.0003)
0.00014 (0.00008 - 0.00031)
0.000018 (0.000005 - 0.0001)
Wet and Cool Location 0.0006 (0.0004 - 0.0008)
0.0004 (0.00017 - 0.0007)
0.00004 (0.000004 - 0.00024)
Average of Central Values: 0.0001189 25th Percentile of Lower Bounds: 0
Maximum Value: 0.0011 Summary of Values: 0.000119 (0 - 0.0011)
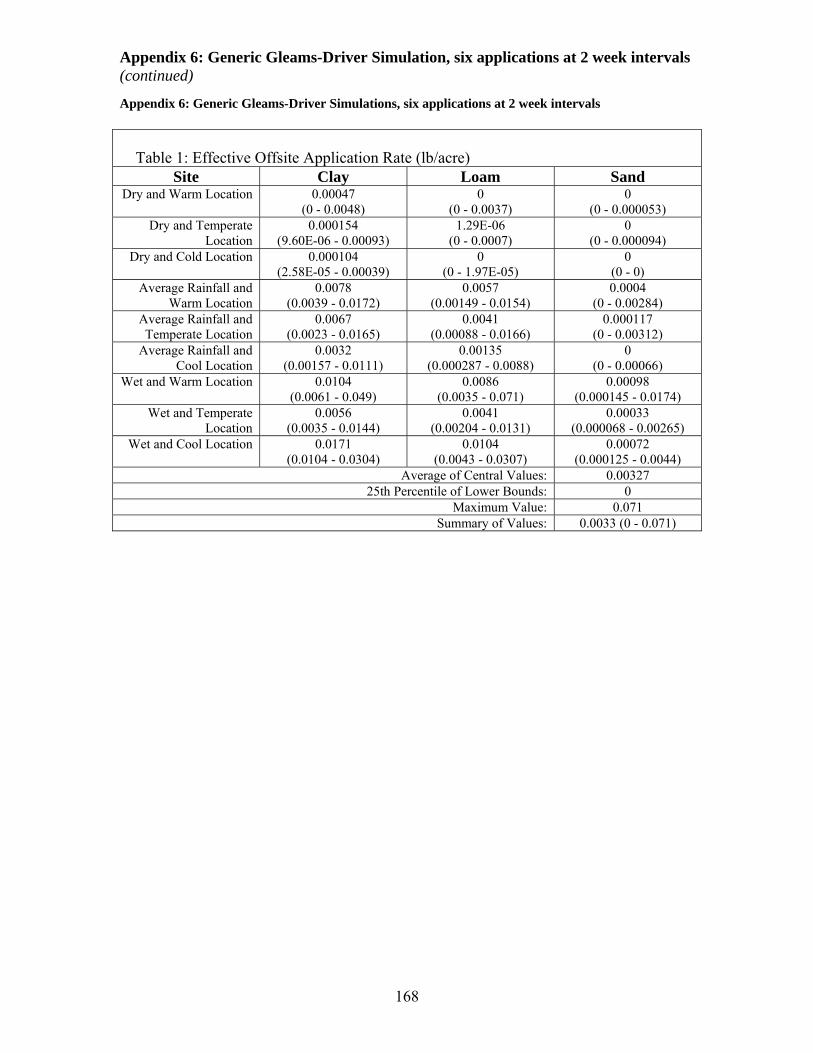
Appendix 6: Generic Gleams-Driver Simulation, six applications at 2 week intervals (continued)
Appendix 6: Generic Gleams-Driver Simulations, six applications at 2 week intervals Table 1: Effective Offsite Application Rate (lb/acre)
Site Clay Loam Sand Dry and Warm Location 0.00047
(0 - 0.0048) 0
(0 - 0.0037) 0
(0 - 0.000053) Dry and Temperate
Location 0.000154
(9.60E-06 - 0.00093) 1.29E-06
(0 - 0.0007) 0
(0 - 0.000094) Dry and Cold Location 0.000104
(2.58E-05 - 0.00039) 0
(0 - 1.97E-05) 0
(0 - 0) Average Rainfall and
Warm Location 0.0078
(0.0039 - 0.0172) 0.0057
(0.00149 - 0.0154) 0.0004
(0 - 0.00284) Average Rainfall and Temperate Location
0.0067 (0.0023 - 0.0165)
0.0041 (0.00088 - 0.0166)
0.000117 (0 - 0.00312)
Average Rainfall and Cool Location
0.0032 (0.00157 - 0.0111)
0.00135 (0.000287 - 0.0088)
0 (0 - 0.00066)
Wet and Warm Location 0.0104 (0.0061 - 0.049)
0.0086 (0.0035 - 0.071)
0.00098 (0.000145 - 0.0174)
Wet and Temperate Location
0.0056 (0.0035 - 0.0144)
0.0041 (0.00204 - 0.0131)
0.00033 (0.000068 - 0.00265)
Wet and Cool Location 0.0171 (0.0104 - 0.0304)
0.0104 (0.0043 - 0.0307)
0.00072 (0.000125 - 0.0044)
Average of Central Values: 0.00327 25th Percentile of Lower Bounds: 0
Maximum Value: 0.071 Summary of Values: 0.0033 (0 - 0.071)
168
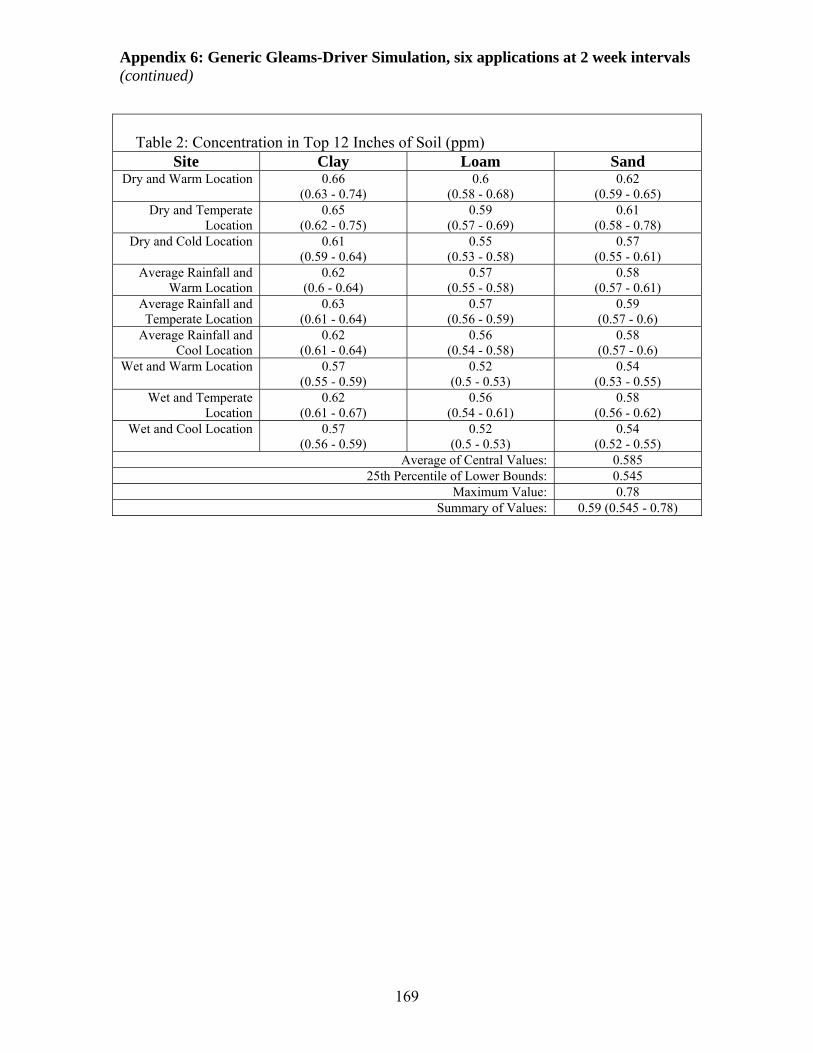
Appendix 6: Generic Gleams-Driver Simulation, six applications at 2 week intervals (continued)
Table 2: Concentration in Top 12 Inches of Soil (ppm)
Site Clay Loam Sand Dry and Warm Location 0.66
(0.63 - 0.74) 0.6
(0.58 - 0.68) 0.62
(0.59 - 0.65) Dry and Temperate
Location 0.65
(0.62 - 0.75) 0.59
(0.57 - 0.69) 0.61
(0.58 - 0.78) Dry and Cold Location 0.61
(0.59 - 0.64) 0.55
(0.53 - 0.58) 0.57
(0.55 - 0.61) Average Rainfall and
Warm Location 0.62
(0.6 - 0.64) 0.57
(0.55 - 0.58) 0.58
(0.57 - 0.61) Average Rainfall and Temperate Location
0.63 (0.61 - 0.64)
0.57 (0.56 - 0.59)
0.59 (0.57 - 0.6)
Average Rainfall and Cool Location
0.62 (0.61 - 0.64)
0.56 (0.54 - 0.58)
0.58 (0.57 - 0.6)
Wet and Warm Location 0.57 (0.55 - 0.59)
0.52 (0.5 - 0.53)
0.54 (0.53 - 0.55)
Wet and Temperate Location
0.62 (0.61 - 0.67)
0.56 (0.54 - 0.61)
0.58 (0.56 - 0.62)
Wet and Cool Location 0.57 (0.56 - 0.59)
0.52 (0.5 - 0.53)
0.54 (0.52 - 0.55)
Average of Central Values: 0.585 25th Percentile of Lower Bounds: 0.545
Maximum Value: 0.78 Summary of Values: 0.59 (0.545 - 0.78)
169

Appendix 6: Generic Gleams-Driver Simulation, six applications at 2 week intervals (continued)
Table 3: Concentration in Top 60 Inches of Soil (ppm)
Site Clay Loam Sand Dry and Warm Location 0.132
(0.127 - 0.148) 0.121
(0.115 - 0.136) 0.124
(0.118 - 0.131) Dry and Temperate
Location 0.13
(0.124 - 0.15) 0.119
(0.113 - 0.139) 0.122
(0.116 - 0.155) Dry and Cold Location 0.122
(0.118 - 0.127) 0.11
(0.106 - 0.116) 0.114
(0.111 - 0.122) Average Rainfall and
Warm Location 0.124
(0.121 - 0.127) 0.113
(0.111 - 0.117) 0.117
(0.114 - 0.122) Average Rainfall and Temperate Location
0.125 (0.123 - 0.129)
0.114 (0.112 - 0.118)
0.117 (0.115 - 0.12)
Average Rainfall and Cool Location
0.125 (0.122 - 0.128)
0.112 (0.109 - 0.115)
0.116 (0.113 - 0.12)
Wet and Warm Location 0.114 (0.111 - 0.117)
0.103 (0.101 - 0.106)
0.108 (0.105 - 0.11)
Wet and Temperate Location
0.124 (0.121 - 0.134)
0.112 (0.109 - 0.122)
0.115 (0.112 - 0.124)
Wet and Cool Location 0.114 (0.111 - 0.118)
0.103 (0.101 - 0.106)
0.107 (0.104 - 0.109)
Average of Central Values: 0.1169 25th Percentile of Lower Bounds: 0.11
Maximum Value: 0.155 Summary of Values: 0.117 (0.11 - 0.155)
170
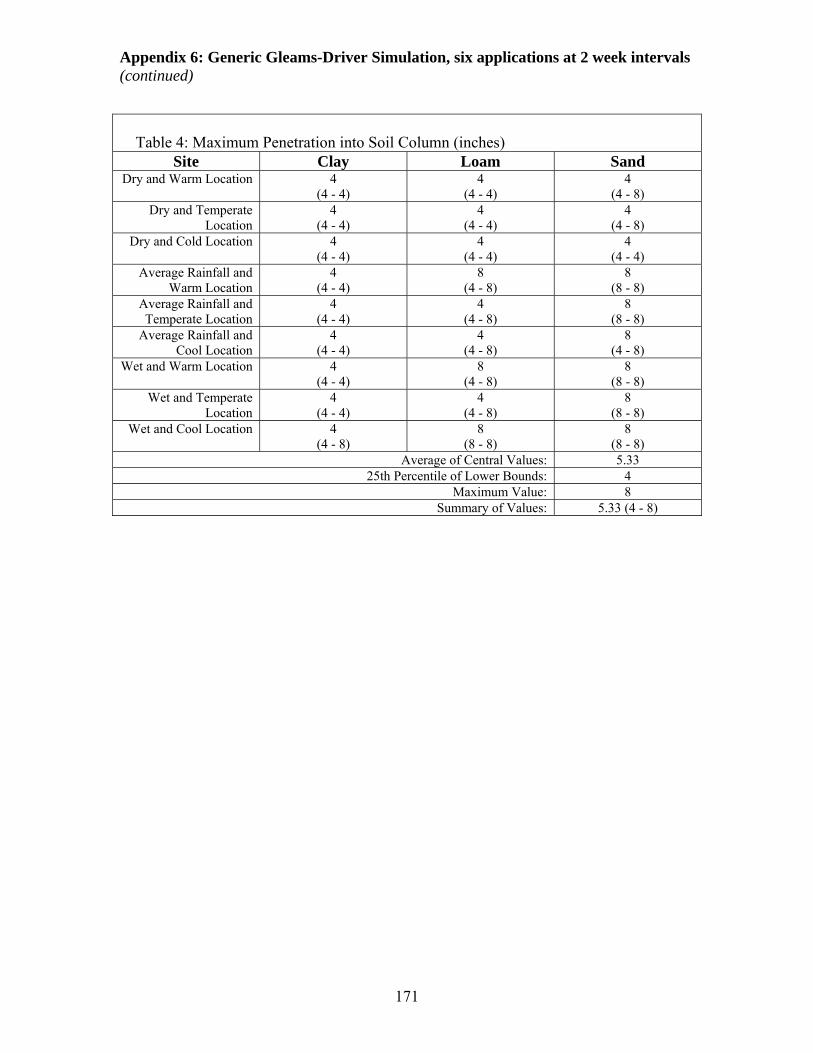
Appendix 6: Generic Gleams-Driver Simulation, six applications at 2 week intervals (continued)
Table 4: Maximum Penetration into Soil Column (inches)
Site Clay Loam Sand Dry and Warm Location 4
(4 - 4) 4
(4 - 4) 4
(4 - 8) Dry and Temperate
Location 4
(4 - 4) 4
(4 - 4) 4
(4 - 8) Dry and Cold Location 4
(4 - 4) 4
(4 - 4) 4
(4 - 4) Average Rainfall and
Warm Location 4
(4 - 4) 8
(4 - 8) 8
(8 - 8) Average Rainfall and Temperate Location
4 (4 - 4)
4 (4 - 8)
8 (8 - 8)
Average Rainfall and Cool Location
4 (4 - 4)
4 (4 - 8)
8 (4 - 8)
Wet and Warm Location 4 (4 - 4)
8 (4 - 8)
8 (8 - 8)
Wet and Temperate Location
4 (4 - 4)
4 (4 - 8)
8 (8 - 8)
Wet and Cool Location 4 (4 - 8)
8 (8 - 8)
8 (8 - 8)
Average of Central Values: 5.33 25th Percentile of Lower Bounds: 4
Maximum Value: 8 Summary of Values: 5.33 (4 - 8)
171

Appendix 6: Generic Gleams-Driver Simulation, six applications at 2 week intervals (continued)
Table 5: Stream, Maximum Peak Concentration in Surface Water (ug/L or ppb)
Site Clay Loam Sand Dry and Warm Location 0.04
(0 - 0.5) 0
(0 - 0.5) 0
(0 - 0.014) Dry and Temperate
Location 0.013
(0.001 - 0.07) 0.00015
(0 - 0.07) 0
(0 - 0.014) Dry and Cold Location 0.008
(0.0023 - 0.027) 0
(0 - 0.0027) 0
(0 - 0) Average Rainfall and
Warm Location 0.4
(0.15 - 0.9) 0.4
(0.14 - 1.24) 0.09
(0 - 0.6) Average Rainfall and Temperate Location
0.3 (0.13 - 1.07)
0.3 (0.07 - 1.51)
0.026 (0 - 0.8)
Average Rainfall and Cool Location
0.16 (0.06 - 0.7)
0.13 (0.03 - 0.9)
0 (0 - 0.18)
Wet and Warm Location 0.5 (0.19 - 4.2)
0.6 (0.21 - 7.9)
0.2 (0.029 - 3.4)
Wet and Temperate Location
0.21 (0.1 - 0.6)
0.24 (0.1 - 0.9)
0.05 (0.01 - 0.5)
Wet and Cool Location 0.4 (0.17 - 1.3)
0.5 (0.15 - 1.87)
0.09 (0.016 - 0.7)
Average of Central Values: 0.1725 25th Percentile of Lower Bounds: 0
Maximum Value: 7.9 Summary of Values: 0.172 (0 - 7.9)
172
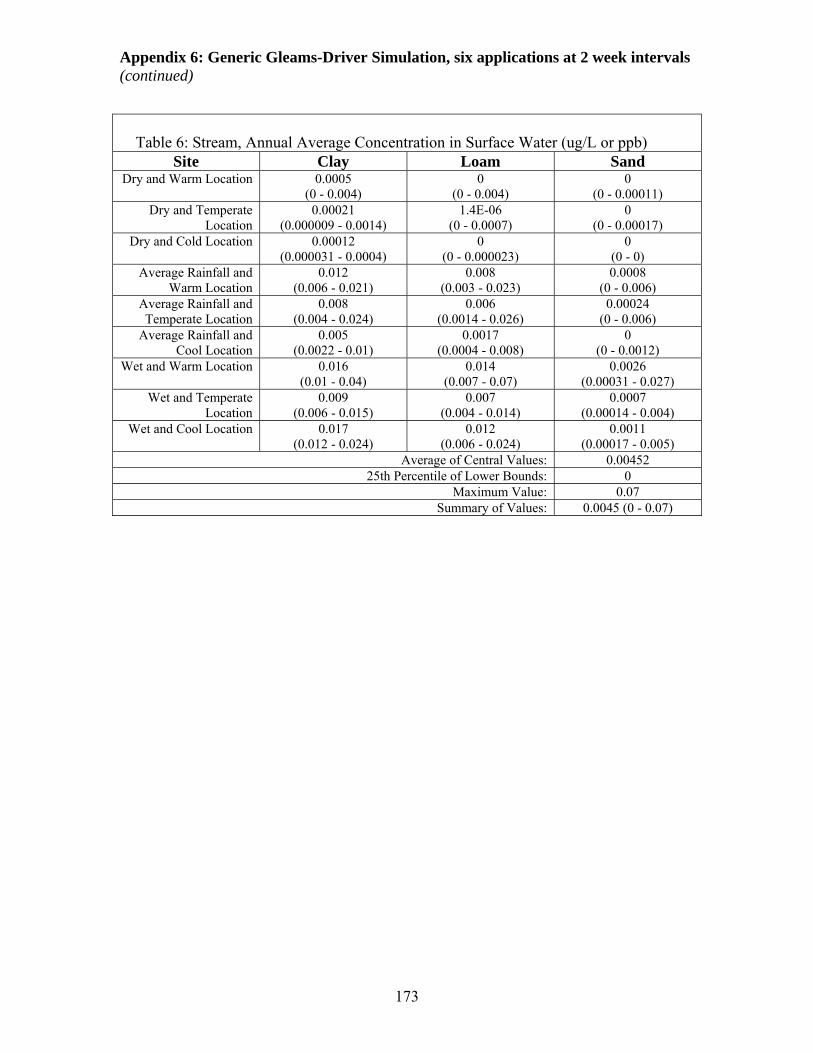
Appendix 6: Generic Gleams-Driver Simulation, six applications at 2 week intervals (continued)
Table 6: Stream, Annual Average Concentration in Surface Water (ug/L or ppb)
Site Clay Loam Sand Dry and Warm Location 0.0005
(0 - 0.004) 0
(0 - 0.004) 0
(0 - 0.00011) Dry and Temperate
Location 0.00021
(0.000009 - 0.0014) 1.4E-06
(0 - 0.0007) 0
(0 - 0.00017) Dry and Cold Location 0.00012
(0.000031 - 0.0004) 0
(0 - 0.000023) 0
(0 - 0) Average Rainfall and
Warm Location 0.012
(0.006 - 0.021) 0.008
(0.003 - 0.023) 0.0008
(0 - 0.006) Average Rainfall and Temperate Location
0.008 (0.004 - 0.024)
0.006 (0.0014 - 0.026)
0.00024 (0 - 0.006)
Average Rainfall and Cool Location
0.005 (0.0022 - 0.01)
0.0017 (0.0004 - 0.008)
0 (0 - 0.0012)
Wet and Warm Location 0.016 (0.01 - 0.04)
0.014 (0.007 - 0.07)
0.0026 (0.00031 - 0.027)
Wet and Temperate Location
0.009 (0.006 - 0.015)
0.007 (0.004 - 0.014)
0.0007 (0.00014 - 0.004)
Wet and Cool Location 0.017 (0.012 - 0.024)
0.012 (0.006 - 0.024)
0.0011 (0.00017 - 0.005)
Average of Central Values: 0.00452 25th Percentile of Lower Bounds: 0
Maximum Value: 0.07 Summary of Values: 0.0045 (0 - 0.07)
173

Appendix 6: Generic Gleams-Driver Simulation, six applications at 2 week intervals (continued)
Table 7: Pond, Maximum Peak Concentration in Surface Water (ug/L or ppb)
Site Clay Loam Sand Dry and Warm Location 0.006
(0 - 0.07) 0
(0 - 0.07) 0
(0 - 0.0022) Dry and Temperate
Location 0.0019
(0.00011 - 0.01) 0.000023 (0 - 0.011)
0 (0 - 0.004)
Dry and Cold Location 0.0012 (0.00026 - 0.004)
0 (0 - 0.0004)
0 (0 - 0)
Average Rainfall and Warm Location
0.06 (0.026 - 0.14)
0.07 (0.022 - 0.21)
0.013 (0 - 0.11)
Average Rainfall and Temperate Location
0.05 (0.02 - 0.16)
0.05 (0.013 - 0.22)
0.004 (0 - 0.11)
Average Rainfall and Cool Location
0.025 (0.011 - 0.1)
0.019 (0.005 - 0.13)
0 (0 - 0.027)
Wet and Warm Location 0.07 (0.032 - 0.4)
0.09 (0.03 - 0.7)
0.029 (0.005 - 0.4)
Wet and Temperate Location
0.04 (0.014 - 0.09)
0.04 (0.015 - 0.12)
0.008 (0.0017 - 0.07)
Wet and Cool Location 0.06 (0.028 - 0.14)
0.07 (0.024 - 0.2)
0.015 (0.0022 - 0.11)
Average of Central Values: 0.02675 25th Percentile of Lower Bounds: 0
Maximum Value: 0.7 Summary of Values: 0.0267 (0 - 0.7)
174
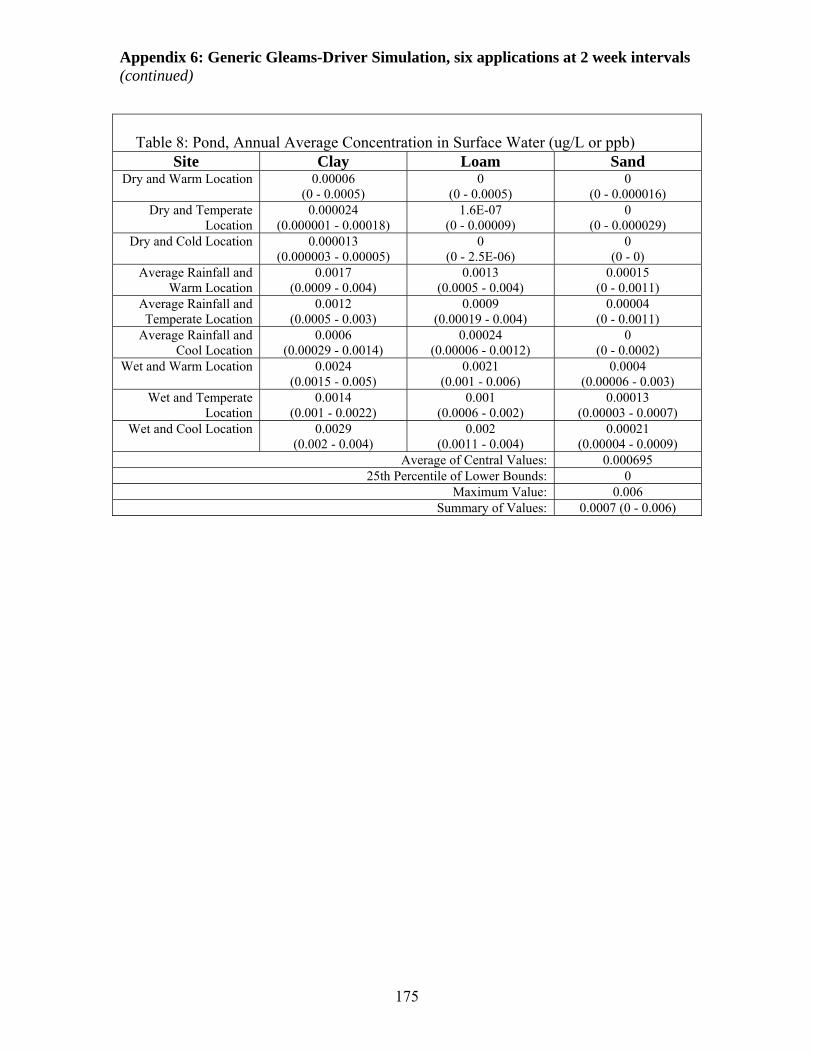
Appendix 6: Generic Gleams-Driver Simulation, six applications at 2 week intervals (continued)
175
Table 8: Pond, Annual Average Concentration in Surface Water (ug/L or ppb)
Site Clay Loam Sand Dry and Warm Location 0.00006
(0 - 0.0005) 0
(0 - 0.0005) 0
(0 - 0.000016) Dry and Temperate
Location 0.000024
(0.000001 - 0.00018) 1.6E-07
(0 - 0.00009) 0
(0 - 0.000029) Dry and Cold Location 0.000013
(0.000003 - 0.00005) 0
(0 - 2.5E-06) 0
(0 - 0) Average Rainfall and
Warm Location 0.0017
(0.0009 - 0.004) 0.0013
(0.0005 - 0.004) 0.00015
(0 - 0.0011) Average Rainfall and Temperate Location
0.0012 (0.0005 - 0.003)
0.0009 (0.00019 - 0.004)
0.00004 (0 - 0.0011)
Average Rainfall and Cool Location
0.0006 (0.00029 - 0.0014)
0.00024 (0.00006 - 0.0012)
0 (0 - 0.0002)
Wet and Warm Location 0.0024 (0.0015 - 0.005)
0.0021 (0.001 - 0.006)
0.0004 (0.00006 - 0.003)
Wet and Temperate Location
0.0014 (0.001 - 0.0022)
0.001 (0.0006 - 0.002)
0.00013 (0.00003 - 0.0007)
Wet and Cool Location 0.0029 (0.002 - 0.004)
0.002 (0.0011 - 0.004)
0.00021 (0.00004 - 0.0009)
Average of Central Values: 0.000695 25th Percentile of Lower Bounds: 0
Maximum Value: 0.006 Summary of Values: 0.0007 (0 - 0.006)