lan dissertation main3 for pdf - tulane university
TRANSCRIPT

Abstract
The migration of living cells plays an important role in immune response,
hemostasis, cancer progression, delivery of nutrients, and microfluidic technologies such
cell separation/enrichment and flow cytometry. Using three-dimensional computational
algorithm for multiphase viscoelastic flow and mass transport, this study is focused on
the investigation of the effects of cell size, viscoelasticity, cortical tension, fluid inertia
and cell-cell interaction on passive migration and deformation of leukocytes, and active
deformation of circulating cells during chemotactic migration in a rectangular
microchannel. The results of the passive migration modeling show that there is an almost
linear increase in the distance between the wall and the lateral equilibrium position of
liquid drops or leukocytes with the particle diameter-to-channel height ratio increased
from 0.1 to 0.5. Drops with different bulk viscosities can be efficiently separated if their
interfacial tension is low or the flow rate is sufficiently high. The microfluidic technology
is well suited for the separation of leukocytes with different cytoplasmic viscosities and
relaxation times, but it is much less sensitive to cortical tension. When a series of closely
spaced cells with same size are considered, they generally undergo damped oscillation in
both lateral and translational directions until they reach equilibrium positions where they
become evenly distributed in the flow direction (self-assembly phenomenon). For a series
of cells with different sizes, bigger cells could collide repeatedly with smaller ones and
enter the other side of the channel (above or below the centerline). For a series of cells
with different deformability, more deformable cells upon impact with less deformable
cells move to an equilibrium position closer to the centerline. The results of our study
provide better understanding of cell margination in bloodstream and cell
separation/enrichment in microfluidic devices. The simulation data on active migration
of cells show the formation of a finger- or lamellipodium-like projection of the cell
membrane towards the chemoattractant source and indicate that lowering the cortical
tension facilitates cell protrusion.


©Copyright by Hongzhi Lan, 2013
All Rights Reserved

ii
Acknowledgements
I would like to sincerely thank my advisor, Dr. Damir B. Khismatullin, for his
guidance, patience and support throughout the time of my dissertation research. I was
introduced into the exciting areas of cellular biomechanics and computational fluid
dynamics with his great help. I appreciate Dr. Donald P. Gaver, Dr. Walter Lee Murfee
and Dr. Ricardo Cortez for taking time to serve on my committee and providing
suggestions and encouragement. I thank Dr. Hideki Fujioka in Center for Computational
Science for his advice during my code development. My thanks also go to our
collaborators, Dr. Dino Di Carlo (UCLA), Dr. Soojung Claire Hur (Harvard University)
and Dr. Wonhee Lee (KAIST), for being willing to provide original experimental data
and giving me inspiration on the simulation work.
I thank all the lab members and friends for their help, friendship and joy they
brought to me during my graduate studies.
Lastly, I am deeply grateful to my parents and wife for their endless love,
encouragement and trust over all these years. They always cared about me and never
complained, even when they needed help themselves and even we were separated by
thousands of miles for years.

iii
Table of Contents
Acknowledgements ............................................................................................................. ii
Table of Contents ............................................................................................................... iii
List of Tables .......................................................................................................................v
List of Figures .................................................................................................................... vi
Chapter 1 Introduction .........................................................................................................1
1.1 Motivation and objective .......................................................................................1
1.2 Background ............................................................................................................7
1.2.1 Migration and deformation of a deformable particle ....................................7
1.2.2 Hydrodynamic interaction between particles ..............................................11
1.2.3 Cell mechanics ...........................................................................................14
1.2.4 Active migration of living cells ..................................................................15
Chapter 2 Methods .............................................................................................................19
2.1 Cell model ............................................................................................................19
2.2 Navier-Stokes equations ......................................................................................20
2.3 Volume-of-fluid method ......................................................................................23
2.4 Active migration ..................................................................................................28
2.5 Summary of computational algorithms ................................................................31
2.6 Parallel programming...........................................................................................32
Chapter 3 A numerical study of the lateral migration and deformation
of drops and leukocytes in a rectangular microchannel ...................................35
3.1 Abstract ................................................................................................................35
3.2 Simulation framework .........................................................................................36
3.3 Results and discussion .........................................................................................40
3.4 Conclusions ..........................................................................................................69
Chapter 4 Numerical simulation of deformable cell interaction during migration
in a microchannel ..............................................................................................70
4.1 Abstract ................................................................................................................70
4.2 Simulation framework .........................................................................................71
4.3 Results and discussion .........................................................................................72
4.4 Conclusions ..........................................................................................................89
Chapter 5 Active migration of circulating cells in a microchannel
explored by three-dimensional numerical simulation .......................................91
5.1 Abstract ................................................................................................................91

iv
5.2 Simulation framework .........................................................................................92
5.3 Results and discussion .........................................................................................94
5.4 Conclusions ........................................................................................................102
Chapter 6 Summary .........................................................................................................104
References ........................................................................................................................106

v
List of Tables
Table 3-1: Grid convergence test for D/H=0.5, γ=1, Re=10, Ca=0.14 ..............................40
Table 5-1: Parameters used in the simulation of active migration .....................................93

vi
List of Figures
Fig. 1-1 Lateral equilibrium positions of different types of living cells ..............................4
Fig. 1-2 Cellular deformation by hydrodynamic stretching .................................................5
Fig. 1-3 Segre-Silberberg effect: lateral migration of particles in a channel .......................9
Fig. 1-4 Neutrophils with a lamellipodium or finger-like projection during active
migration ..............................................................................................................16
Fig. 1-5 The treadmilling and dendritic nucleation of actin filaments ..............................17
Fig. 2-1 Variables in a MAC grid cell ...............................................................................23
Fig. 2-2 2-D sketch of reconstructed interface by the Piecewise-Linear Interface
Calculation (PLIC) method and calculation of C advection in x-direction ..........24
Fig. 2-3 Comparison of Continuous Surface Force (CSF) method and height
function (HF) method ...........................................................................................27
Fig. 2-4 Performance comparison between MPI code and OpenMP code ........................34
Fig. 3-1 Schematic of the computational domain showing geometrical dimensions
and initial and boundary conditions used for passive migration ..........................36
Fig. 3-2 Velocity disturbances caused by a Newtonian drop .............................................37
Fig. 3-3 Schematic of lateral migration and deformation of a deformable drop in a
microchannel ........................................................................................................38
Fig. 3-4 Comparison of the numerical and analytical shapes of a Newtonian fluid
drop moving at the centerline of the channel .......................................................42
Fig. 3-5 Comparison of the numerical and analytical data on the x-component of
the Newtonian fluid drop velocity ........................................................................44
Fig. 3-6 Migration of a drop in a rectangular microchannel ..............................................47
Fig. 3-7 Lateral equilibrium position, deformation index, and x-component
velocity of a Newtonian drop perfused through a microchannel for
different drop diameters and viscosities ...............................................................50
Fig. 3-8 Lateral equilibrium position, deformation index, and orientation angle of
a Newtonian drop perfused through a microchannel for different drop
viscosities and capillary numbers .........................................................................53
Fig. 3-9 Lateral equilibrium position, deformation index, and orientation angle of
a Newtonian drop perfused through microchannel for different flow rates
and drop viscosities ..............................................................................................55
Fig. 3-10 Effect of the Reynolds number on the lateral equilibrium position of
Newtonian drops ...................................................................................................57

vii
Fig. 3-11 Lateral equilibrium position and deformation index of leukocytes
perfused through a microchannel for different cell diameters and
cytoplasmic viscosities. ........................................................................................61
Fig. 3-12 Lateral equilibrium position and deformation index of leukocytes
perfused through a microchannel for different cell diameters and
relaxation times ....................................................................................................63
Fig. 3-13 Lateral equilibrium position, deformation index, and orientation angle
of leukocytes perfused through a microchannel for different flow rates
and cytoplasmic viscosities ..................................................................................65
Fig. 3-14 Comparison of lateral equilibrium position of cells and Newtonian drops
with different sizes between simulation and experimental results .......................68
Fig. 4-1 Schematic of the simulated problem on pairwise interaction of cells ..................71
Fig. 4-2 Lateral equilibrium position of a series of identical and periodically
spaced cells ...........................................................................................................73
Fig. 4-3 Migration of cells during pairwise interaction when located at the bottom
half of the microchannel .......................................................................................76
Fig. 4-4 Migration of only two cells during pairwise interaction when located at
the bottom half of the microchannel .....................................................................79
Fig. 4-5 Migration of only two cells during pairwise interaction when located at
the bottom half of the microchannel with larger cell diameters ...........................81
Fig. 4-6 Migration of cells during pairwise interaction when located at the top and
bottom halves of the microchannel respectively ..................................................83
Fig. 4-7 Migration of cells during pairwise interaction when located at the bottom
half of the microchannel with a large initial z-distance .......................................85
Fig. 4-8 Migration of cells with different diameters during pairwise interaction
when located at the bottom half of the microchannel ..........................................87
Fig. 4-9 Migration of cells with different deformability during pairwise
interaction when located at the bottom half of the microchannel ........................88
Fig. 5-1 Sketch of the channel dimensions for active migration .......................................92
Fig. 5-2 Boundary conditions for polymerization messenger and chemoattractant
in the simulation of finger-like projection ............................................................94
Fig. 5-3 3-D and 2-D views of cell finger-like projection .................................................95
Fig. 5-4 Elongation of the projection with time .................................................................96
Fig. 5-5 Boundary conditions chemoattractant in the simulation of lamellipodium-
like extension ........................................................................................................97
Fig. 5-6 3-D and 2-D views of cell lamellipodium -like extension ...................................98
Fig. 5-7 Concentration of chemoattractant and polymerization messenger at the
center point of the front end of the cell ................................................................99
Fig. 5-8 The “vision” of the cell on the chemoattractant near the membrane and
the corresponding polymerization messenger ....................................................101

1
Chapter 1 Introduction
1.1 Motivation and Objective
Blood is the most important bodily fluid in all vertebrates including human beings.
It plays a key role in delivery of nutrients to cells in tissues and removal of byproducts of
cell metabolism from the tissues, in the initiation of immune response to invading
pathogens, and in body thermoregulation. All these functions depend on rheological
properties of blood, i.e., its flow characteristics under various conditions (blood vessel
diameter, blood pressure, protein and blood cell content). Significant changes in the
blood rheological properties result in serious pathophysiological conditions such as
aneurysm, sickle cell disease, thrombosis, thromboembolism and atherosclerosis (leading
cause of deaths in the United States) and contribute to inflammatory and autoimmune
diseases, cancer and diabetes.
From a mechanical point of view, whole blood is a highly complex multiphase
fluid consisting of blood plasma (continuous phase) and circulating cells (dispersed
phases) [1]. The disperse phases are blood cells such as erythrocytes (red blood cells),
thrombocytes (platelets), and leukocytes (white blood cells) and other individual cells
under certain conditions (e.g., cancer/tumor cells during hematogenous metastasis [2]).
Circulating cells are the major determinant of blood rheology. They take ~45% of the
whole blood volume, and they are much more viscous and elastic than blood plasma,

2
which is a dilute solution of proteins, glucose, salt and other solutes in water and thus can
be treated as a Newtonian fluid with viscosity slightly higher (1.2 times) than the water
viscosity. Circulating cells are the primary reason why whole blood is a non-Newtonian
fluid with yield stress, shear thinning and viscoelastic properties. The rheological
properties of whole blood are highly dynamic properties because of different level of
deformation of circulating cells in vessels of different diameter and drastic differences in
geometric and mechanical properties between circulating cells of different type [3],
because of the ability of the circulating cells to adhere to each other and form aggregates
directly in blood flow, and because of passive and active migration of these cells in blood
flow due to their strong hydrodynamic interactions and adhesion and activation. These
features complicate the development of realistic biophysical models of blood flow that
can describe the conditions leading to diseases mentioned above and predict possible
therapeutic interventions that can overcome these conditions. The focus of my work is
on modeling passive and active migration of deformable circulating cells, which are
important processes in immune responses, hemostasis, cancer progression, and delivery
of oxygen and nutrients [2, 4-7] and play a central role in recent biotechnological
applications such as flow cytometry and cell separation/enrichment in microfluidic
devices [8-13].
Microfluidics has gained significant advances in various biochemical, clinical and
industrial applications because of its advantages such as reduced sample consumption,
laminar flow, portability, and parallelization over conventional cell handling processes
[14]. One application of this technology is to exploit cell migration for the separation or
enrichment of living cells, e.g., 1) the isolation of leukocytes from red blood cells in
3
whole human blood to reducing sample size and handling [10], 2) the capture of
circulating tumor cells for the identification of cancer metastases [11], 3) the detection of
bacteria in biological solutions for the investigation of microorganisms living within
human bodies [12], and 4) the derivation of a stem cell line from tissue aspirates for
regenerative medicine [13].
Many microfluidic methods has been developed for the separation of cells (and
pathogenic microorganisms), such as microfabricated fluorescence-activated cell sorter
(µFACS), microfluidic magnetic cell separation, transient cell-ligand adhesion,
electrophoresis and free flow acoustophoresis, which require the external assistance of
fluorescence, electro-magnetic force, acoustic force, or biochemical labeling, or adhesion
molecule coating [15]. However, the separation of particles or cells of different size
and/or deformability can be achieved by a purely hydrodynamic approach in a
microfluidic flow chamber [10, 16-22]. A particle or cell experiences a lateral drift during
its perfusion through a flow channel to reach a specific position (lateral equilibrium
position) between the walls and centerline of the channel, which depends on the size and
deformability of the particle [21, 23] and its interaction with other cells if multiple cells
exit in the channel[4]. As different types of cells could have different lateral equilibrium
positions, they can be separated with a special design of channel outlet (Fig. 1-1). Since
the aforementioned external assistance is not required, the hydrodynamic method can be
a simple, low-cost and high-throughput assay for the particle separation problem.

4
Fig. 1-1 (a) Lateral equilibrium positions of different types of living cells. Malignant
breast cancer cells are closer to the centerline than benign ones. (b) Special design of the
channel outlet for separation of different types of cells. (Copy from Hur et al. [21])
malignant breast cancer cells
(a)
benign breast cancer cells
(b)

5
Another promising application of the microfluidic technology is deformability-
based flow cytometry [8, 9]. Cellular deformation has been used as a distinctive
biomarker for certain cell types and pathological conditions [24, 25]. This includes sickle
cell disease where red blood cells become less deformable and more sticky [26], sepsis
where circulating leukocytes are less deformable because of their activation [27], and
cancer metastasis, which is associated with a change in the deformability of tumor cells
[28]. Living cells with different deformability can be assessed from the statistical analysis
of their deformed shape in a microchannel due to hydrodynamic stretching (Fig. 1-2) [29].
Their mechanical properties can further be extracted from these data by using realistic
computational models for cellular deformation in a microchannel. This application can
avoid the issue that leukocytes and other blood cells can be activated and have different
rheology when exposed to large external forces in other approaches[3], including
micropipette aspiration [30-32], atomic force microscopy [33, 34], nanoindentation [35],
optical tweezers [36, 37], and magnetic twisting cytometry [38, 39].
Fig. 1-2 (a) Hydrodynamic stretching of living cells during perfusion through a cross
flow channel. (b) The deformed shape of a cell with the long and short principal axes. (c)
Deformation profile of human embryonic stem cells. (Copy from Gossett et al. [29])
(a) (b)
(c)

6
Besides passive migration, many living cells including leukocytes can migrate
actively during embryogenesis, immune surveillance and wound healing [40]. One
typical example is chemotaxis, the directed movement of cells toward the source of
chemoattractant [41], which plays a crucial role in both innate and adaptive immune
responses of the body, and cancer metastasis [42, 43]. After contact and adhesion to
endothelium, circulating leukocytes in the blood are activated and migrate across the
endothelium and migrate in the interstitial tissue to pathogens [44]. During metastasis,
malignant cancer cells experience the similar behavior when they travel to a distant site
of the body through the cardiovascular or lymphatic system [43]. The cell’s active
migration is a dynamic process of cytoskeleton remodeling, involving various
biochemical reactions. In general, the active migration consists of protrusion of the cell
leading edge, adhesion of the cell front to the substrate through integrins, and retraction
of the rear of the cell [45]. However, in three-dimensional environments, integrin binding
is not necessary for active migration [46, 47]. Therefore, the migration is mainly driven
by intracellular forces generated by polymerization and depolymerization of actin
filaments (F-actin) [48].
The specific objective of my research is to develop fully three-dimensional
parallel algorithms for passive and active migration of living cells and then use these
algorithms to numerically simulate passive and active migration of leukocytes and tumor
cells in a microchannel with rectangular cross section. The specific aims include:
Specific Aim 1 (SA1): To develop a three-dimensional volume-of-fluid (VOF) based
algorithm for viscoelastic multiphase flow with parallel programming using

7
Message Passing Interface (MPI) to implement high performance computation of
the flow and deformation of drops and cells.
Specific Aim 2 (SA2): To simulate passive migration and deformation of leukocytes
during perfusion through a rectangular microchannel, and:
(a) To study the effects of leukocyte properties (size, bulk shear viscosity and
elasticity, cortical tension) and fluid inertia on leukocyte passive migration and
deformation in a rectangular microchannel;
(b) To study the effect of cell-cell interaction on passive migration of multiple
leukocytes in a rectangular microchannel;
Specific Aim 3 (SA3): To extend the VOF-based algorithm to model active cell
migration by introducing an “intracellular active force” term into the momentum
equations;
Specific Aim 4 (SA4): To study active migration of leukocytes and tumor cells
driven by a chemoattractant stimulus in a rectangular microchannel.
1.2 Background
1.2.1 Migration and deformation of a deformable particle
During perfusion in a microchannel, a particle moves relative to the surrounding
flow in the lateral (transverse) and translational directions. The lateral drift of a
deformable particle in shear flow is driven by the lift force in the lateral direction, which
changes with the lateral location of the particle. When the particle is near the wall the lift

8
force is positive due to the lubrication pressure field at the wall side of the particles [49-
54] and particle rotation [55, 56], leading to a drift away from the wall. The lift force
decreases in magnitude with increasing the distance between the particle and the wall
until it becomes zero at the lateral equilibrium position [55]. This position is either the
centerline or between the centerline and the wall [50]. The latter could be explained by
nonlinearity of the velocity field in confined channels that causes asymmetry in the
pressure field, with a higher pressure on the centerline side of the particle than that on the
wall side [57]. As a result, particles located near or at the centerline drift to a certain
position between the centerline and the wall, where the velocity nonlinearity and
lubrication pressure contributions to the lift force compensate each other.
This effect is observed for both rigid and deformable particles: small rigid
spherical particles migrate in a tube to the equilibrium position at approximately 0.4
times the tube radius from the wall in low Reynolds number (~10) [58], and move closer
to the wall with the spacing as little as 0.1 times the tube radius as Reynolds number
increases to 700 [59]. This tubular pinch of particles in Poiseuille flow is called Segre-
Silberberg effect (Fig. 1-3a). Similarly, oil drops [21, 23, 60] and living cells [21] move
in a rectangular channel to certain mid-way position between the centerline and the wall
dependent on size mechanical properties, or Reynolds number (Fig. 1-3b).

9
Fig. 1-3 (a) Segre-Silberberg effect: randomly distributed particles in a tube move to an
equilibrium position with a constant distance from the wall [58]. (b) Similar to Segre-
Silberberg effect, particles randomly distributed in a rectangular channel (channel cross
section W ≥ 2H) move to the middle plane in the width direction with a constant distance
from the channel wall [21].
cross-section view
Segre-Silberberg effect
lateral equilibrium positions
H
W ≥ 2H
(a)
(b)
middle plane in the width direction

10
The deformation of drops was extensively studied under simple shear flow
conditions [61-63]. However, the assumption that the velocity profile is linear is not
appropriate when describing flow in a microchannel, especially when the channel height
is comparable with the drop size. Several experimental studies were conducted on the
deformation of large drops in a tube or a rectangular channel [64, 65]. As discussed by
Olbricht [65] and Goldsmith and Mason [66], drops with the undeformed radius between
0.95 to 1.13 of the tube radius assume a bullet-like shape, with increased elongation and
larger gaps between the wall and the drop surface at higher capillary numbers (Ca).
When reaching a critical value of Ca, drops experience shape instability that eventually
leads to drop breakup [67]. Interestingly, less viscous drops show more deformation in
confined flows, though the effect of drop viscosity is less pronounced than the effect of
the capillary number [68]. Experimental analysis of small drop deformation in Poiseuille
flow is scarce. One recent study shows, for example, that drops with the diameter less
than half of the channel height deform to an ellipsoid-like shape at high Re, while they
experience very little deformation when Re is low [21].
A number of mathematical models were proposed to describe the motion of a
Newtonian fluid drop in Poiseuille flow. Some of them are analytical models restricted to
the cases of very low Reynolds number, infinitesimally small perturbations from a
spherical shape, and the ratio of the drop diameter to the channel height much less than
one [69-71]. These models predict that drops migrate to approximately the mid-way
between the centerline and the wall at the drop-to-fluid viscosity ratio between 0.5 and 10
and to the centerline for other values of the viscosity ratio. They also show that the axial
velocity of drops is lower than the velocity of the undisturbed flow at the location of a
11
drop centroid. Several numerical models were proposed to simulate drop deformation and
migration in a tube or a parallel-plate flow chamber under Stokes flow conditions. These
include boundary integral methods in both two and three dimensions [72-75]. They show
that if Re is low, drops migrate toward the centerline after initial rapid deformation and
during this migration the difference between the drop axial velocity and the undisturbed
flow velocity increases with drop size, drop distance from the wall, and viscosity. With
higher Ca, drops have higher deformation and steady-state velocities. Front tracking
algorithms as well as lattice Boltzmann and volume-of-fluid (VOF) methods were
exploited to study the drop dynamics in the presence of fluid inertia [76-78]. The
predictions of these models are in line with experimental data. For example, the
numerical simulation shows that at Re < 1, drops with low drop-to-fluid viscosity ratio (~
0.1) migrate to the centerline and those with higher viscosity ratio (> 1.0) move to about
the mid-way. At higher Re, even low-viscosity drops migrate to the mid-way. The
numerical models also predict that an increase in Ca leads to larger deformation of drops.
1.2.2 Hydrodynamic interaction between particles
Much research on the migration of circulating cells and deformable particles in
flow channels was conducted in the simplest scenario of negligible intercellular or
interparticle interactions where the cell-to-cell or particle-to-particle distance was much
larger than the size of cells or particles (scenario A). In fact, cell interaction plays an
important role when investigating cell migration in blood flow or microchannels when
multiple cells appear with close distance. Experimental works have been done on
interaction between white and red blood cells, which leads to erythrocyte aggregation and

12
leukocyte margination due to their different size, shape and deformability [4-7].
Therefore, scenario A does not work well for blood flow because of the large volume
fraction of circulating cells and thus a close spacing between cells. For example, the
volume fraction of erythrocytes (hematocrit) reaches 45% in humans [79].
In the scenario of dense suspension, called as scenario B, the migration of
circulating cells significantly depends on hydrodynamic cell-cell interactions.
Hydrodynamic interactions between erythrocytes and leukocytes and between
erythrocytes and thrombocytes were studied in a number of experimental works [4-7, 80,
81]. These studies revealed that the geometric (size, shape) and mechanical properties
(deformability) of the cells contribute to erythrocyte aggregation and leukocyte and
thrombocyte margination [82]. Erythrocyte aggregation near the centerline leads to the
formation a thin cell-free layer adjacent to the capillary wall. This layer is responsible for
the Fahraeus effect, i.e., a decrease in hematocrit and apparent viscosity of the blood with
a decrease in the capillary diameter [83]. Leukocyte margination, i.e., their lateral
migration to vessel wall margins, is necessary for leukocytes to adhere to the wall and
initiate the immune response [5]. Similarly, the migration of thrombocytes to vessel wall
margins is a necessary step in blood clotting [84]. In terms of microfluidic applications
for scenario B, it is important to mention biomimetic separation of leukocytes during
whole blood perfusion in a microfluidic channel [10]. Lattice Boltzmann and immersed
boundary methods have been used to model the flow of a dense suspension of deformable
particles or cells [85-87]. The results of these computational studies indicate that highly
deformable particles or erythrocytes aggregate during circulation, which pushes out solid

13
particles or leukocytes from the center, which enables the initial contact between
leukocytes and endothelial cells on the vessel wall.
There exists another scenario (scenario AB) where the interactions between
particles or cells may be significant but the average separation distance is larger than in
the case of a dense suspension (scenario B). One example is the “single chain” flow of
particles or cells in a small channel where a moving particle/cell interacts with only two
neighbors located at some distance from the cell [88]. This self-assembly of circulating
particles/cells has been employed in biomedicine, material synthesis, and logical
computation [89-91] and shown to be very important for microfluidics-based flow
cytometry and cell separation [92, 93]. Recent experimental studies show that circulating
particles migrate to a specific lateral position where they are uniformly spaced in the flow
direction (like beads on a string) as a result of the balance of attractive and repulsive
interactions imposed by nearby particles [88, 94-96]. The analysis of scenario AB is very
important for optimization of cell separation/enrichment microfluidic technologies
because of the potential to increase the efficiency of cell separation when the cell
concentration or volume fraction is between that of the dense and dilute suspensions. The
pairwise interactions of spherical and nonspherical rigid particles in linear or quadratic
shear flows have already been investigated [88, 97-99]. It was theoretically established
that the flow disturbances induced by a rotating particle could repel the neighboring
particle maintaining a finite distance between the particles [88]. The interactions of two
deformable particles have not been analyzed in the context of cell migration in confined
channels. Previous work was about the interaction of two elastic solid particles close to
14
the wall in linear shear flow [100] and the effect of the collision of two elastic capsules or
drops on their deformation in linear shear flow [101, 102].
1.2.3 Cell mechanics
Living cells have a very complex and dynamic structure. Their mechanical
properties strongly depend on the biochemical composition of the cell cytoskeleton and
plasma membrane and the presence and properties of cell organelles (e.g., nucleus).
Blood cells of different type differ in mechanical properties. For example, mature red
blood cells lack nucleus and have a rich cytoskeleton only in the vicinity of the plasma
membrane. These cells are highly deformable and have an equilibrium biconcave shape,
as compared to leukocytes that have most organelles and three-dimensional cytoskeleton
that spans all space from the nucleus to the plasma membrane [103]. Leukocytes are of
spherical shape when not exposed to shear flow. In addition to a difference in passive
mechanical properties, leukocytes (and circulating tumor cells) can deform actively, i.e.,
their deformability can change with time as a result of cytoskeleton remodeling induced
by outside-in signaling via chemoattractant molecules [104].
In this study, I focused on modeling the dynamics of leukocytes such as
neutrophils. More than 50% of all the leukocytes in human blood are neutrophils and
most of investigation about mechanical properties of leukocytes were conducted on
neutrophils [104]. Neutrophils play a central role in acute inflammation, and could
transmigrate during circulation through the endothelium activated by proinflammatory
mediators [3]. It is known that neutrophils deform to a teardrop shape during rolling on
the endothelium in vivo [105] and behave as a highly viscous liquid drop when aspirated
15
into a micropipette [106]. Neutrophils are other leukocytes have a ruffled plasma
membrane with microvilli, which produce excess surface area and protect the cells
against the dilation caused by deformation [107]. It’s also observed that their cortical
layer (plasma membrane together with actin cytoskeleton) possesses cortical tension
similar to interfacial tension in drops [31, 32]. Based on these observations, these cells
were modeled as a viscous drop in the simplest form[108]. A thorough investigation of
the cell behavior indicates that the cytoskeleton (a polymer network with a number of
cross links) can be modeled as a viscoelastic or non-Newtonian material [109, 110]. The
viscoelastic deformation of leukocytes was described by different constitutive equations
including Maxwell [111] and Giesekus models [112] as well as a power-law fluid model
[109]. Several computational models were developed for elastic capsules and fluid
vesicles [54, 113, 114]. In these models, the fluid inside a deformable particle has the
same properties as the external fluid, which makes them unsuitable for leukocytes and
other deformable particles with bulk properties different from that of the external fluid.
1.2.4 Active migration of living cells
During chemotaxis, the chemoattractant receptors on the cell membrane trigger
outside-in signaling, which can lead to cytoskeleton remodeling. When chemoattractant
binds its receptor, second messengers such as phosphoinositide 3-kinases (PI3-Ks), Rho
family GTPases, cyclic AMP and so on are produced [115-117]. PI3-Ks induce the
phosphorylation of phosphatidylinositol lipids, such as PtIns(3,4,5)P2 or PIP3. Both the
lipids and Rho GTPases activate Arp2/3 complex [118], which is required for actin
filament growth [119]. A neutrophil can develop a large polarized shape called

16
lamellipodium at the front of the cell and a contracted tail known as uropod at the back
[120, 121], or extend a finger-like projection called pseudopod towards the
chemoattractant source [46] (Fig. 1-4).
Fig. 1-4 (a) A neutrophil with a lamellipodium during active migration. (Copy from Eddy
et al. [121]) (b) A neutrophil with a finger-like projection. (Copy from Zhelev et al. [46])
(a) (b)
lamellipodium
uropod
pseudopod
micropipette
holding the cell
micropipette releasing
chemoattractant
17
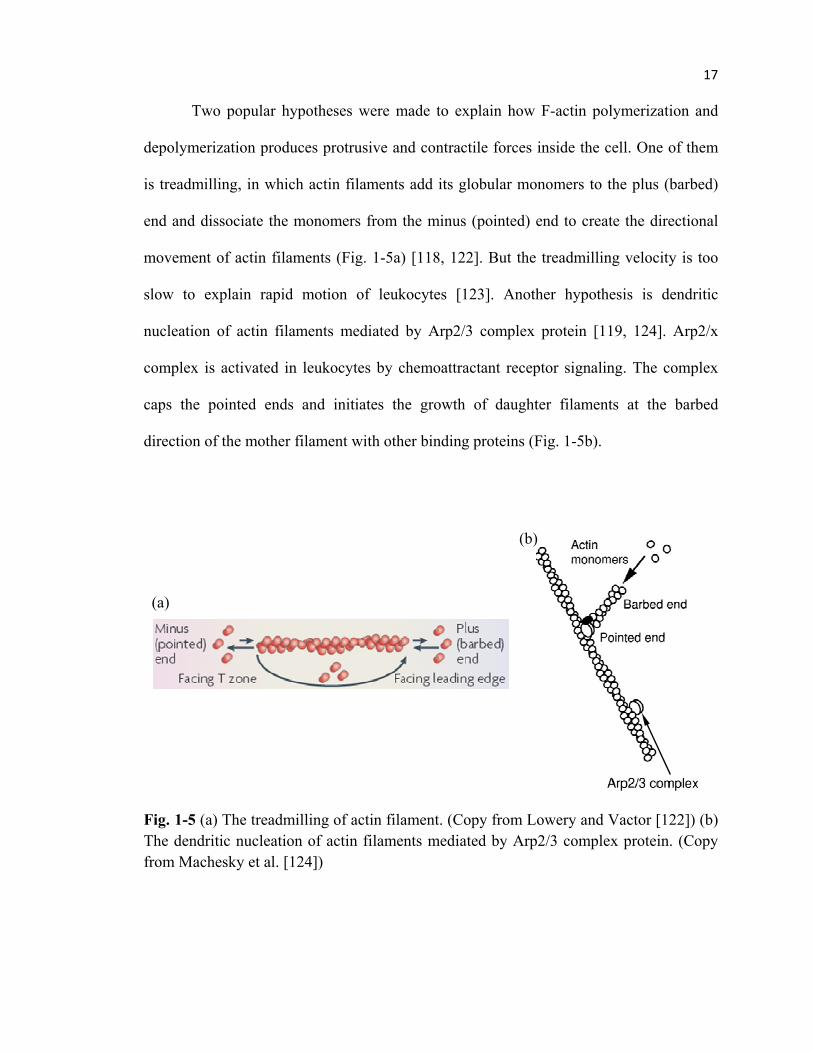
Two popular hypotheses were made to explain how F-actin polymerization and
depolymerization produces protrusive and contractile forces inside the cell. One of them
is treadmilling, in which actin filaments add its globular monomers to the plus (barbed)
end and dissociate the monomers from the minus (pointed) end to create the directional
movement of actin filaments (Fig. 1-5a) [118, 122]. But the treadmilling velocity is too
slow to explain rapid motion of leukocytes [123]. Another hypothesis is dendritic
nucleation of actin filaments mediated by Arp2/3 complex protein [119, 124]. Arp2/x
complex is activated in leukocytes by chemoattractant receptor signaling. The complex
caps the pointed ends and initiates the growth of daughter filaments at the barbed
direction of the mother filament with other binding proteins (Fig. 1-5b).
Fig. 1-5 (a) The treadmilling of actin filament. (Copy from Lowery and Vactor [122]) (b)
The dendritic nucleation of actin filaments mediated by Arp2/3 complex protein. (Copy
from Machesky et al. [124])
(a)
(b)

18
Mathematical models were developed to explain the generation of active force for
migration. To describe contractile biological polymer networks, the cell was regarded as
a multiphase reactive system (reactive interpenetrating flow formalism), including
cytosol (aqueous solvent) and cytoskeleton (network of filaments) [125]. The internal
active force was derived from a stress tensor due to the cytoskeleton dynamics, which
produces either an interfilament force (networking swelling model) or a network-to-
membrane interaction force (polymerization force model) [126]. The network-to-
membrane interaction also depends on the polymerization messenger concentration.
Other models on active force generation include Brownian ratchet model [127],
treadsevering model [128], stochastic branching model [129], molecular motors model
[130].
Although cytoskeleton remodeling can drive the cell motion and deformation,
integrin binding is still necessary to constrain the cell to migrate on a 2-D surface, such as
leukocyte migration on endothelium after firm adhesion. Firm adhesion of a leukocyte is
mediated by β2 and α4 integrins on its membrane and corresponding ligands such as
Intercellular Adhesion Molecule-1 (ICAM-1) and Vascular Cell Adhesion Molecule-1
(VCAM-1) [131]. The formation and rupture of bonds between integrin (receptor) and
ligand of endothelium was described by the spring-peeling kinetic model [132]. When the
separation distance between the leukocyte and the endothelium is less than the total
length of the unstretched receptor and ligand, receptor-ligands bonds can form and
impose a tensile force (bond force) on the leukocyte. Leukocyte adhesion has been
studied theoretically as a 3-D rigid particle or numerically as a viscoelastic drop by 2-D
or 3-D models [112].
19
Chapter 2 Methods
2.1 Cell model
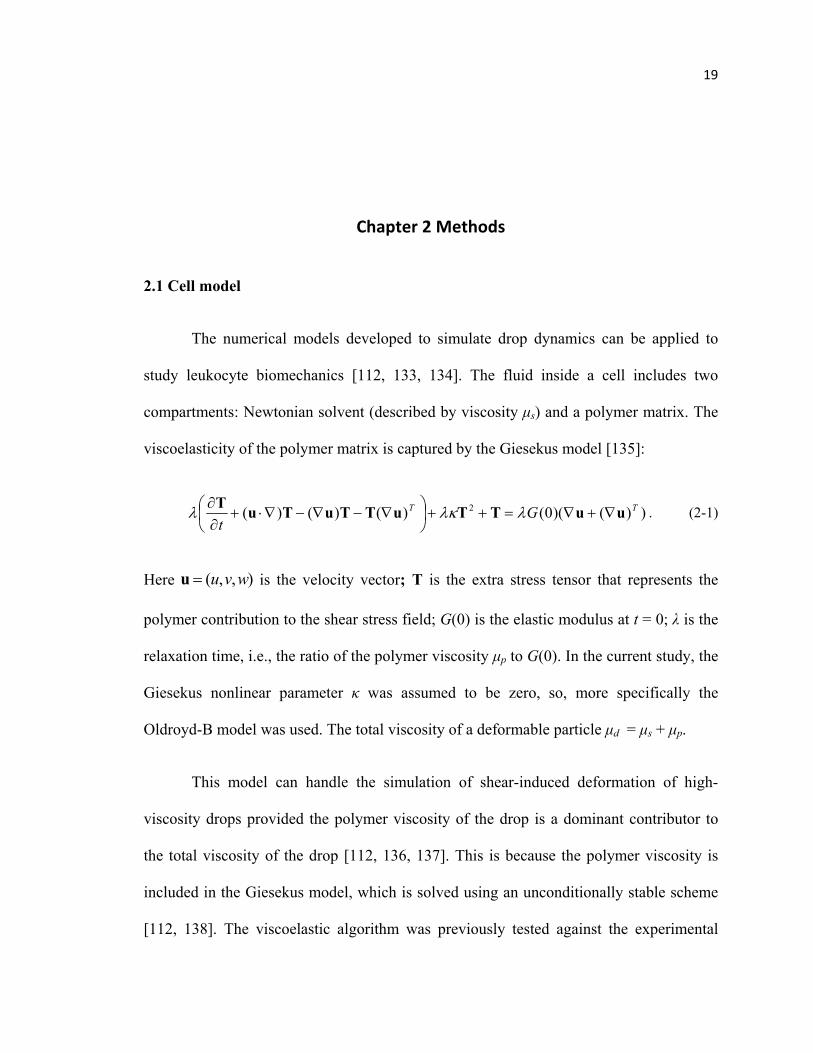
The numerical models developed to simulate drop dynamics can be applied to
study leukocyte biomechanics [112, 133, 134]. The fluid inside a cell includes two
compartments: Newtonian solvent (described by viscosity µs) and a polymer matrix. The
viscoelasticity of the polymer matrix is captured by the Giesekus model [135]:
))()(0()()()( 2 TT Gt
uuTTuTTuTuT
∇+∇=++
∇−∇−∇⋅+∂∂
λλκλ . (2-1)
Here ),,( wvu=u is the velocity vector; T is the extra stress tensor that represents the
polymer contribution to the shear stress field; G(0) is the elastic modulus at t = 0; λ is the
relaxation time, i.e., the ratio of the polymer viscosity µp to G(0). In the current study, the
Giesekus nonlinear parameter κ was assumed to be zero, so, more specifically the
Oldroyd-B model was used. The total viscosity of a deformable particle µd = µs + µp.
This model can handle the simulation of shear-induced deformation of high-
viscosity drops provided the polymer viscosity of the drop is a dominant contributor to
the total viscosity of the drop [112, 136, 137]. This is because the polymer viscosity is
included in the Giesekus model, which is solved using an unconditionally stable scheme
[112, 138]. The viscoelastic algorithm was previously tested against the experimental

20
data and small deformation theory for drop breakup [138], and it was also shown to
realistically describe leukocyte deformation in parallel-plate and microfluidic flow
chambers [112, 136, 137]. Other three-dimensional algorithms for viscoelastic fluid-fluid
flow were developed by Aggarwal and Sarkar [139], Pillapakkam and Singh [140],
Hooper et al. [141], Yue et al. [142], and Zhou et al. [133]. These algorithms were not
applied to the problem of drop migration. Recently, a two-dimensional numerical
algorithm for solid particle migration in a viscoelastic fluid has been developed [143].
Viscoelasticity is a property of all living cells and it is crucially important to take it into
account in the simulation of leukocyte motion and deformation [3, 106, 144].
The Giesekus model was solved by a semi-implicit scheme in which the advection
term and the last term in the left-hand side of the equation were in the implicit part, but
the contravariant and nonlinear terms were treated explicitly [112, 138]. By this way, a
factorized scheme could be used to solve the equation. For a more accurate solution, the
extra stress tensor is solved twice. First, the intermediate ∗
T is derived based on previous
velocity field )(n
u as Eq. (2-2). Then, )1( +n
T is solved in terms of new velocity field
)1( +nu .
)))(()0()()((
1)(
111211
*
1
1
1
1
1
11
TnnnnTnnnnnnnnn
n
n
nn
n
nn
n
nn
Gtt
zw
t
t
yv
t
t
xu
t
tt
uuuTTuTT
T
∇+∇+∇+∇∆+∆−
=
∂∂
+∆∆
+∂∂
+∆∆
+∂∂
+∆∆
++∆
+++++
+
+
+
+
+
++
λλκλλ
λλ
λλ
λλ
λ (2-2)
2.2 Navier-Stokes equations
The velocity field is found from the solution of the Navier-Stokes equations:

21
0=⋅∇ u , (2-3)
FuuTuuu
+∇+∇⋅∇+∇−⋅∇=
∇⋅+∂∂
)))((( T
spt
µρ . (2-4)
ρ is the mass density, F is the body force due to interfacial tension, and p is pressure. All
components of the extra stress tensor are zero in the external fluid, i.e., we model the
external fluid as a purely Newtonian fluid with viscosity µext replacing µs. Since the cell
solvent viscosity-to-external fluid viscosity ratio is O(1), the numeric solution of the
Navier-Stokes equations is stable. The numeric instability appears when the drop solvent
viscosity is more than 50 times higher than the external fluid viscosity.
The Navier-Stokes equations were solved by a semi-implicit predictor-corrector-
type projection method [138] on a staggered Marker-and-Cell (MAC) grid (Fig. 2-1). In
the predictor-corrector approach, the explicit scheme was used for the intermediate
velocity ∗explu :
))))((((1 11*
1
*
expl +++
+∇+∇⋅∇+⋅∇+∇⋅−=∆
−nTnnn
sn
nn
n
tFuuTuu
uuµ
ρ. (2-5)
ρn+1 and F
n+1 were calculated explicitly based on the new interface. Based on this velocity,
the pressure field *p was solved:
t
p
∆
⋅∇=
∇⋅∇
*
expl
*u
ρ. (2-6)
22
Then, a new intermediate velocity field ∗
u was recalculated via a semi-implicit scheme
using this intermediate pressure field*p (for instance, x-component):
∂∂
∂∂∆
+
∂∂
∂∂∆
+
∂
∂+
∂
∂+
∂
∂∆+
∂
∂−
∆+∇⋅∆−
=
∂∂
∂∂∆
−
∂∂
∂∂∆
−
∂∂
∂∂∆
−
++
++
++
+
++
++
++
x
w
z
t
x
v
y
t
z
T
y
T
x
Tt
x
pF
tutu
uzz
t
yy
t
xx
t
nn
sn
nn
sn
n
n
n
nnn
n
sn
n
sn
n
sn
1
1
1
1
*
13
*
12
*
11
1
*
1
11
*1
1
1
1
1
1
)(
21
µρ
µρ
ρρ
µρ
µρ
µρ
u . (2-7)
The final correction *
corrp to the pressure was found based on the new the intermediate
velocity field:
t
pn
corr
∆⋅∇
=
∇⋅∇
**u
ρ. (2-8)
The resulting velocity field at given time step was determined by adding the gradient of
the correction pressure to the intermediate velocity:
n
corr
n p
t ρ
**1 ∇−=
∆
−+uu
. (2-9)
The final pressure is:
**1
corr
n ppp +=+ . (2-10)
23
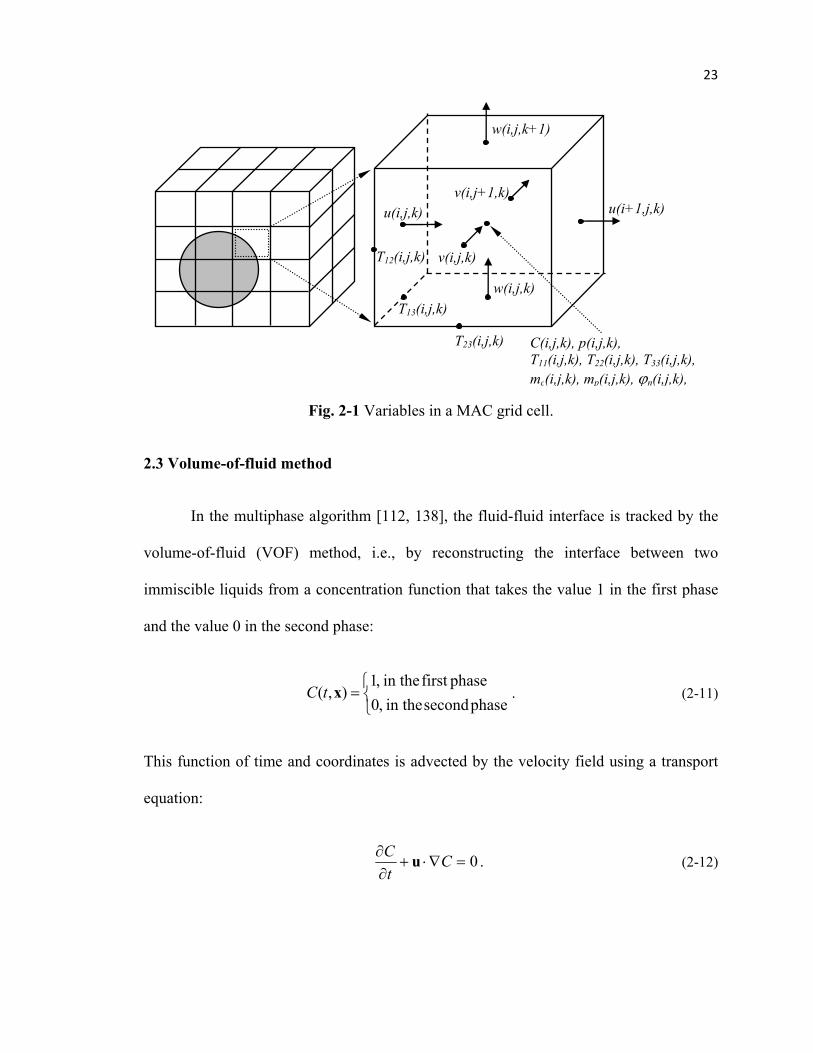
Fig. 2-1 Variables in a MAC grid cell.
2.3 Volume-of-fluid method
In the multiphase algorithm [112, 138], the fluid-fluid interface is tracked by the
volume-of-fluid (VOF) method, i.e., by reconstructing the interface between two
immiscible liquids from a concentration function that takes the value 1 in the first phase
and the value 0 in the second phase:
=phase second in the,0
phasefirst in the,1),( xtC . (2-11)
This function of time and coordinates is advected by the velocity field using a transport
equation:
0=∇⋅+∂∂
Ct
Cu . (2-12)
u(i,j,k) u(i+1,j,k)
w(i,j,k)
w(i,j,k+1)
T13(i,j,k)
v(i,j,k)
v(i,j+1,k)
T23(i,j,k)
T12(i,j,k)
C(i,j,k), p(i,j,k),
T11(i,j,k), T22(i,j,k), T33(i,j,k),
mc(i,j,k), mp(i,j,k), ϕn(i,j,k),

24
Here ),,( zyx=x is a position vector, and ( )zCyCxCC ∂∂∂∂∂∂=∇ /,/,/ is the gradient
of C. The grid cells which the interface passes through have values between 0 and 1 for
the concentration function. The transport equation (2-12) is solved by a Lagrangian
method [145, 146]. In this method, the interface is first reconstructed by the Piecewise-
Linear Interface Calculation (PLIC) method [146]. In PLIC, the outward normal of the
interface is derived by C∇ for the grid having the interface across it, and the linear
interface position is calculated according to the value of C in this grid. Based on the
reconstructed interface and the velocity field (for instance, in the x-direction), the new
value of C in next time step is calculated by (Fig. 2-2):
321
1 vofvofvofC n ++=+. (2-13)
Here vof1 and vof3 are the contribution from the left and right neighboring cells. vof2 is
the remained fraction from its previous value.
Fig. 2-2 2-D sketch of reconstructed interface (dashed lines) by the Piecewise-Linear
Interface Calculation (PLIC) method and calculation of C advection in x-direction.
vof1 ui+1
vof2
vof3=0ui
next
time
step

25
One of the advantages of the VOF method is that the whole velocity field of the
immiscible fluids is found by solving one set of Giesekus constitutive equations and
Navier-Stokes equations with variable parameters (mass density, shear viscosity, etc.) for
different fluids. The averaged values of these parameters are used over each grid cell
which has multiple phases when the interface passes through it.
Because of the averaging on the cells containing the interface, the boundary
conditions at the interface cannot be applied directly and, therefore, the interfacial tension
force should be included in the Navier-Stokes equations as a body force that acts on
interface. The methods used for calculating the body force include PLIC-based methods
[147, 148], parabolic reconstruction of surface tension (PROST) [149], C-based method
(only concentration function used without considering explicit interface). PROST is the
most accurate method but needs massive calculation, which is time-consuming. The
PLIC-based methods can give good approximation in 2-D but become unsuitable or time-
consuming to implement in 3-D. The C-based methods including Continuous Surface
Force (CSF) method [150] and height function (HF) method [151] are relatively simple
and easy to implement in 3D, and they provide good approximation.
In the CSF method, discontinuities in the concentration function at the interface
are smoothed artificially by the interpolation function, which decreases monotonically
with the distance from the interface [112]. The outward unit normal
||||/),(ˆˆ cct ∇∇== xnn and mean curvature nx ˆ),(~~ ⋅−∇== tκκ of the interface are
calculated from the smoothed concentration function (color function) ),( xtcc = . The
body force is then approximated as
26
nF ˆ||||~ c∇= κσ , (2-14)
where σ is the surface tension coefficient. The body force acts on the phases within a
transition region around the interface.
In the case of the HF method, it is assumed that the absolute value of the z-
component of the interface normal vector is largest in interfacial grid cells (0<C<1). Then,
the local distribution of a height function H is calculated as
∑−=
++++ ∆=up
down
t
tt
tktksjrisr zCH ,,,, (2-15)
where r=-1, 0, 1 and s = -1, 0, 1, tdown and tup are adaptively adjusted from 0 to 3, ∆z is the
grid height. The curvature of the interface at this grid is determined as
2/322
22
)1(
2~
yx
yxxyxyyyxxyyxx
HH
HHHHHHHHH
++
−+++=κ . (2-16)
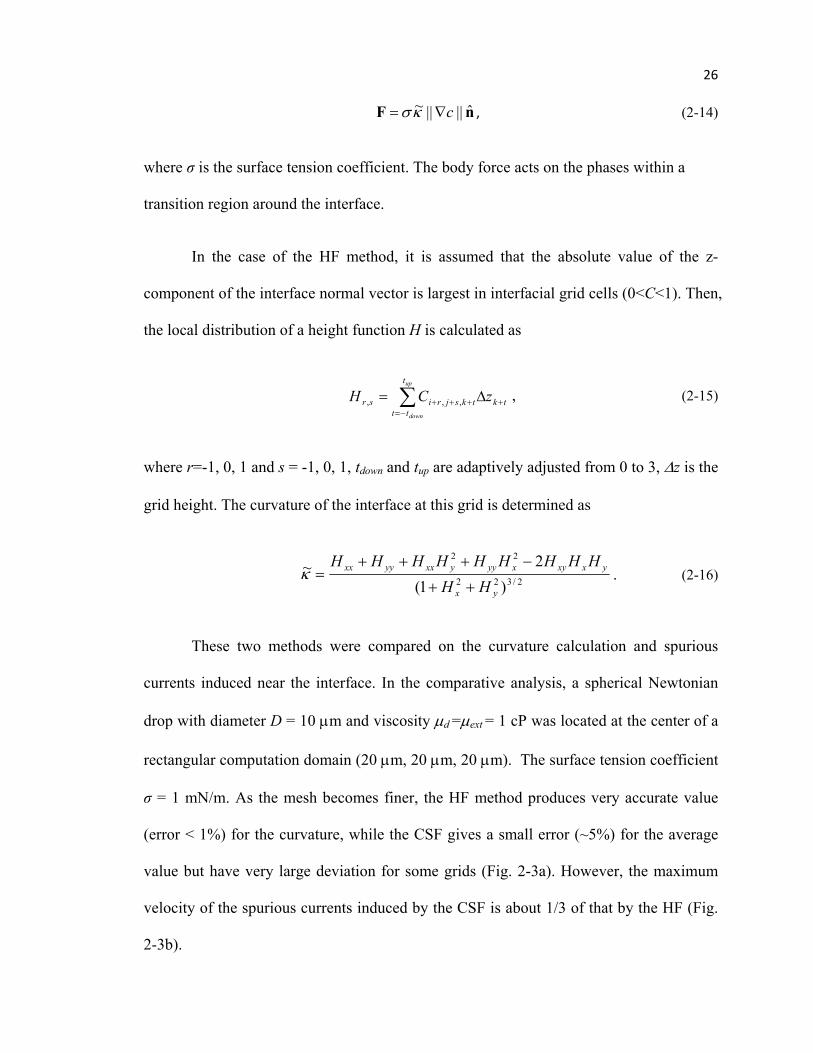
These two methods were compared on the curvature calculation and spurious
currents induced near the interface. In the comparative analysis, a spherical Newtonian
drop with diameter D = 10 µm and viscosity µd =µext = 1 cP was located at the center of a
rectangular computation domain (20 µm, 20 µm, 20 µm). The surface tension coefficient
σ = 1 mN/m. As the mesh becomes finer, the HF method produces very accurate value
(error < 1%) for the curvature, while the CSF gives a small error (~5%) for the average
value but have very large deviation for some grids (Fig. 2-3a). However, the maximum
velocity of the spurious currents induced by the CSF is about 1/3 of that by the HF (Fig.
2-3b).

27
Fig. 2-3 Comparison of the numerical solution produced by the Continuous Surface
Force (CSF) and height function (HF) methods. (a) The maximum, minimum and average
value of the relative error of curvature calculation with different mesh resolutions for
CSF (black error bar) and HF (red error bar). D is the drop diameter, ∆ = ∆x= ∆y= ∆z is
the grid size). (b) The maximum value of spurious current velocity in the computation
domain. D/∆ =40.
28
Since the VOF method was developed specifically for multiphase fluid flow
problems [152, 153], it is more advantageous in modeling drop and leukocyte dynamics
than other numerical approaches. The VOF approach makes the inclusion of a new fluid
phase straightforward and releases the necessity for the generation of a separate mesh or
marker points to track a fluid-fluid interface as in front-tracking methods [154, 155].
There are other VOF-like methods that use other simple functions to track the interface,
e.g., phase-field and level set methods [156, 157]. As compared to the classical VOF
method, they do not conserve mass [157-159] and this drawback makes these methods
inaccurate in modeling cell mechanics or the dynamics of nearly incompressible fluid
drops.
2.4 Active migration
To simulate active migration of a cell, an additional “intracellular active force”
term Fact is introduced into the momentum equation Eq. (3). It is derived according to
Dembo’s reactive interpenetrating flow formalism [125] and Herant’s polymerization
force model [126]. The cell consists of two compartments: cytosol (solvent) and
cytoskeleton (network), and their conservation of mass is written as
1),(),( =+ txtx sn ϕϕ , (2-17)
where ϕn and ϕs are the volume fractions of the network and solvent. The systems is
incompressible, so the continuity equation for each is
,...)()(,...),()( nss
s
nnn
n Jt
Jt
ϕϕϕ
ϕϕϕ
−=⋅∇+∂
∂=⋅∇+
∂
∂uu . (2-18)

29
J is the rate of specific volume change between two compartments and uses a logistic
type of law:
−+=
n
npn
n
nm
Jτ
ϕϕ
ϕϕ )1(0
0
. (2-19)
ϕn0 is the equilibrium volume fraction of the network, τn the life time of network, mp the
dimensionless concentration of polymerization messengers. The convection-diffusion-
reaction equation for the messengers is as following:
p
p
ppp
p mmDm
dt
dm
τ−∇=⋅∇+ 2)( u (2-20)
with the von Neumann boundary condition
ppp mD ε=∇⋅n . (2-21)
Here, Dp is the diffusion coefficient of the messengers, τp the lifetime of polymerization.
It is assumed that the receptors are uniformly distributed on the membrane and the
emissivity of polymerization messenger εp is a linear increasing function of
chemoattractant concentration mc on the membrane. The convection-diffusion equation
for mc is:
ccc
c mDmdt
dm 2)( ∇=⋅∇+ u . (2-22)
Dc is the diffusion coefficient of chemoattractant. The active force Fact is expressed as

30
ΨF ⋅−∇=act . (2-23)
ΨΨΨΨ is the stress tensor due to the network-membrane interaction as below:
npm ϕψψψ 0,ˆ:ˆ == nnΨ , (2-24)
where nn ˆ:ˆ is the dyadic product of the unit outward normal vector to the membrane, and
ψ0 is the equilibrium value of the network-membrane interaction stress. This equation
connects the intracellular active force to external chemoattractant through the
polymerization messengers.
In the VOF method, the boundary conditions for the emissivity of polymerization
messengers at the interface cannot be applied directly. To do so, Eq. 2-21 is converted to
reaction rate |||| cp ∇ε and integrated into Eq. 2-20 as a new boundary condition. Since
the cell and the external fluid are two immiscible phase and mc and mp (or ϕn) only exist
outside the cell and inside the cell respectively, Eqs. 2-20 and 2-22 are calculated by two
steps. First, the diffusion-reaction part is solved via a semi-implicit scheme. Then, similar
to the solution of the transport equation for concentration function C, the transport
equations for mc and mp are numerically solved by the Lagrangian method based on PLIC.
For example, the convection of mp is calculated by:
1
3
*
1,2
*
,1
*
1,
1
, /)( ++−
+ ++= n
iipipip
n
ip Cvofmvofmvofmm , (2-25)
where mp* is calculated from the diffusion-reaction part according the value at the
previous time step.

31
2.5 Summary of computational algorithms
Here is the summary of the computational algorithms for passive and active
migration:
1. Initialization: initial values of concentration function C, velocity u, pressure p,
extra stress tensor T, chemoattractant concentration mc, polymerization messenger
concentration mp, volume fraction of actin filament network ϕn
2. Solution of the diffusion-reaction equations for mc, mp and ϕn with the semi-
implicit scheme excluding convection terms: *** ,,,, npc
n
n
n
p
n
c mmmm ϕϕ →
3. Reconstruction of the interfaces by Piecewise-Linear Interface Calculation (PLIC)
and advection of mc, mp, and ϕn based on the previous velocity field:
111*** ,,,, +++→ n
n
n
p
n
cnpc mmmm ϕϕ
4. Active force calculation based on network volume fraction and polymerization
messenger concentration:
111, +++ → n
act
n
p
n
n m Fϕ
5. Calculation of surface tension force 1+nF by the Continuous Surface Force (CSF)
or height function (HF) method
6. Calculation of the intermediate extra stress tensor from the solution of the
Giesekus equation with the semi-implicit scheme based on the previous velocity
field n
u : *
TT →n
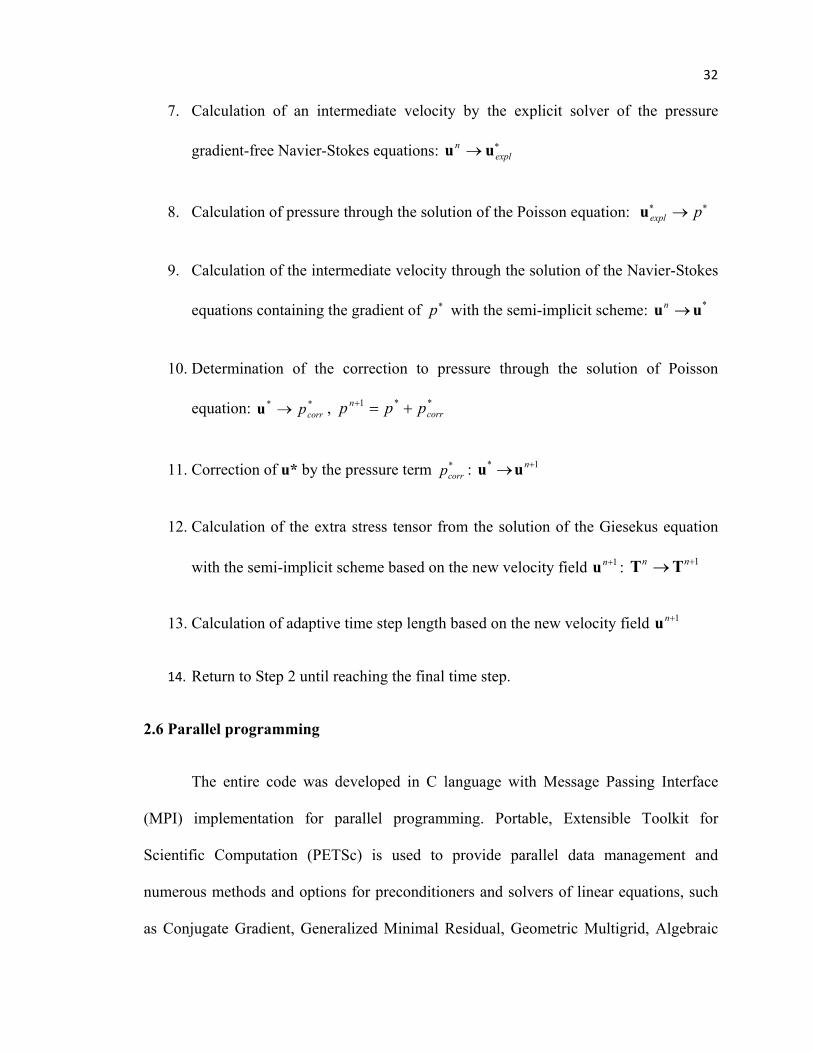
32
7. Calculation of an intermediate velocity by the explicit solver of the pressure
gradient-free Navier-Stokes equations: ∗→ expl
nuu
8. Calculation of pressure through the solution of the Poisson equation: ∗∗ → pexplu
9. Calculation of the intermediate velocity through the solution of the Navier-Stokes
equations containing the gradient of ∗p with the semi-implicit scheme:
*uu →n
10. Determination of the correction to pressure through the solution of Poisson
equation: **
corrp→u , **1
corr
n ppp +=+
11. Correction of u* by the pressure term *
corrp : 1* +→ n
uu
12. Calculation of the extra stress tensor from the solution of the Giesekus equation
with the semi-implicit scheme based on the new velocity field 1+n
u : 1+→ nn
TT
13. Calculation of adaptive time step length based on the new velocity field 1+n
u
14. Return to Step 2 until reaching the final time step.
2.6 Parallel programming
The entire code was developed in C language with Message Passing Interface
(MPI) implementation for parallel programming. Portable, Extensible Toolkit for
Scientific Computation (PETSc) is used to provide parallel data management and
numerous methods and options for preconditioners and solvers of linear equations, such
as Conjugate Gradient, Generalized Minimal Residual, Geometric Multigrid, Algebraic
33
Multigrid (through High Performance Preconditioners hypre) and so on. In general, the
code has a number of advantages and features:
• Three-dimensional multiphase viscoelastic or Newtonian fluid simulation,
including the simulation of multicellular flow in a microchannel;
• Changeable boundary conditions: constant velocity, constant pressure or periodic
conditions at boundary;
• High performance parallel computation, which makes the code extendable to
large computer clusters;
• Adaptive time step length during simulation, especially for high velocity flow;
• Various channel geometries: rectangular, circular, expansion, cross channels;
• Mass transfer simulation in multiphase fluid;
• Active force generation of a cell.
The previous code was developed in Fortran with Open Multi-Processing
(OpenMP). To compare computational performance and scalability, two cases (one with
a Newtonian drop, the other with a viscoelastic cell) were run by the old and new code
with different number of processors. The old code runs at the Ares cluster of Tulane
Center for Computational Science (CCS) for shared-memory computers, and has a
limited number of processors available. The new code runs at the Sphynx cluster of CCS
for distributed-memory computers with a large number of processors available, and has
excellent scalability even up to 128 processors as shown in Fig. 2-4. When using the
same number of processors (<8), the old code is faster than the new code because the old
code uses factorized scheme to solve linear equations, which takes less time for

34
calculation. For higher accuracy, the new code uses a non-factorized scheme. Especially
for the viscoelastic case, the new code takes much more time than the old code because
the extra stress tensor is solved twice in the new code. However, the computational time
can be easily decreased when running the new code on a large number of processors.
Fig. 2-4 Performance comparison between old code and new code. The old code runs at
the Ares cluster for shared-memory computers, and has a limited number (<8) of
processors available. The new code runs at the Sphynx cluster for distributed-memory
computers with a large number (up to 128) of processors available. The computational
domain: height H = 70 µm, width W = 70 µm, length L = 140 µm. Mesh number is 130 x
66 x 66. Time step length is 0.5 µs. The number of time step is 100. Velocity at the
centerline Uc = 0.1429 m/s. Boundary condition at the inlet and outlet is constant velocity
calculated by analytical solution of fully developed flow. External fluid: µ = 1 cP, ρ= 103
kg/m3. Newtonian drop: µ = 1 cP, σ = 1 mN/m, ρ = 10
3 kg/m
3. Viscoelastic cell: µs = 1
cP, G(0) = 50 Pa, λ = 0.2 s, σ = 0.03 mN/m, ρ = 103
kg/m3.

35
Chapter 3 A numerical study of the lateral migration and deformation of
drops and leukocytes in a rectangular microchannel
3.1 Abstract
When deformable particles (e.g., drops or living cells) are perfused through a flow
channel, they drift into a specific lateral position that depends on their size and
mechanical properties. This characteristic can be used for deformability-based particle
sorting. Using a fully three-dimensional algorithm for viscoelastic drop dynamics, I
studied numerically the effects of particle size, bulk shear viscosity and elasticity,
interfacial (or cortical) tension, and fluid inertia on lateral migration and deformation of
small liquid drops and leukocytes (white blood cells) in a rectangular microfluidic flow
chamber. The numerical data show that there is an almost linear increase in the distance
between the wall and the lateral equilibrium position of liquid drops or leukocytes with
the particle diameter-to-channel height ratio increased from 0.1 ≤ D/H ≤ 0.5. Excluding
the case of drops with high interfacial tension, an increase in bulk viscosity of these
particles led to a closer-to-wall equilibrium position. Overall, the results of this work
indicate that 1) drops with different bulk viscosities can be separated in a rectangular
microchannel if their interfacial tension is low or the flow rate is sufficiently high; and 2)
the microfluidic technology is well suited for the separation of leukocytes with different
cytoplasmic viscosities and relaxation times, but it is much less sensitive to cortical
36
tension. 3) This investigation opens up the possibility of using microfluidic systems for
deformability-based flow cytometry.
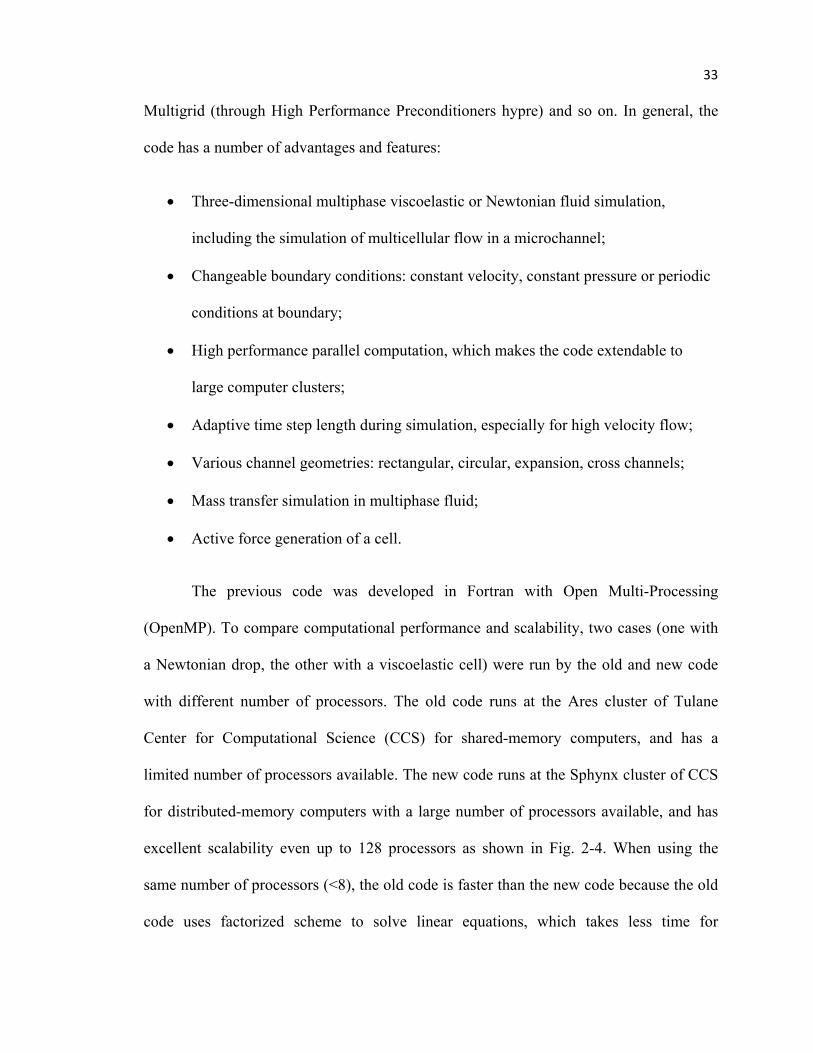
3.2 Simulation framework
Fig. 3-1 Schematic of the computational domain showing geometrical dimensions and
initial and boundary conditions used.
In this study, only one cell is simulated without considering cell-cell interaction.
In the simulation, an initially spherical drop/cell is initially located in an external fluid at
the middle plane (y = W/2) of a rectangular microchannel with parallel upper/lower and
front/back no-slip plates (Fig. 3-1). The channel geometry is based on a Bioflux
microfluidic system (Fluxion Biosciences, San Francisco, CA) installed in our laboratory.
The initial velocity field as well as the velocity field at the inlet and outlet were
calculated from the series solution for the fully developed flow in a rectangular duct
[160]:
( )1
0
1
3
2
3
2
)12(cos
2
12cosh
12cosh
1)12(
)1(4yn
k
n
zk
n
nL
pHkU
N
n
n
ext
x ππ
π
µπ+
⋅+
⋅+
−+
−∆= ∑
=
, (3-1)

37
0== zy UU . (3-2)
Here H
Hzz
21
−= ,
W
Wyy
21
−= , and
H
Wk = . In all runs, N = 100, which is large
enough to calculate accurate values. Equations (3-1) and (3-2) also describe the velocity
of the undisturbed flow when no drops exist in the channel and are used to calculate the
centerline velocity Uc.
When a drop is introduced, there is a strong flow disturbance in the velocity field
near the drop (Fig. 3-2). We found that this disturbance becomes less than 1% of
undisturbed flow velocity at 2.5 drop diameters away from the drop centroid. Therefore,
we positioned the drop at least 2.5D from the inlet/outlet to avoid the boundary effect.
For smaller drop, we considered a narrower computational domain with the velocity at
front/back boundaries calculated by Eq. (3-1).
Fig. 3-2 Velocity disturbances caused by a Newtonian drop. (a) changes in the x-
component of the velocity relative to the undisturbed velocity in the x-direction, ux/Ux -1;
(b) changes in the z-component of the velocity relative to the undisturbed velocity in the
x-direction, uz/Ux. Drop diameter D = 14 µm, centerline velocity Uc = 0.13 m/s, external
fluid viscosity µext = 1 cP, drop viscosity µd = 10 cP, and interfacial tension σ = 1 mN/m.
38
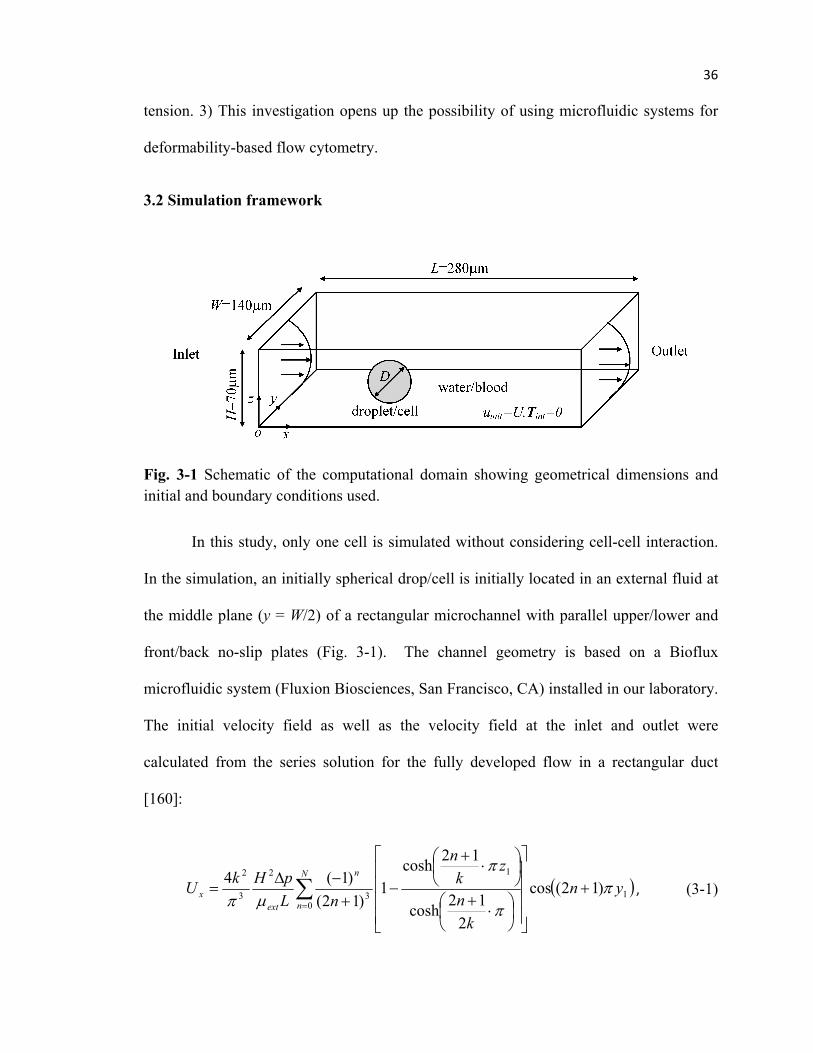
In this numerical study, we simulated the motion of viscous or viscoelastic drops
with different initial vertical displacements (z-coordinate of their centroid) from the
bottom wall of the channel. The equilibrium position zeq was determined from the
trajectories data as the threshold height at which the lateral migration velocity of all the
drops reaches zero. Specifically, the drops with the centroid located below or above zeq
migrate upward or downward to the equilibrium position, respectively (Fig. 3-3). Fluid
shear stresses induce their elongation with an acute orientation angle θ between the first
(long) principal axis of deformation and the xy-plane. We quantified the drop
deformation by the Taylor deformation index:
minmax
minmax
DD
DDDxz +
−= , (3-3)
where Dmax and Dmin are the lengths of the drop in the xz-plane along the long and short
principal axes of deformation.
Fig. 3-3 Schematic of lateral migration and deformation of a deformable drop in a
microchannel.

39
The centroid coordinates, velocity vector, deformation index, and orientation
angle of the drop at the equilibrium position are functions of the channel height, drop size
and rheological properties (viscosity, relaxation time), interfacial tension between the
external fluid and the drop, and flow rate and viscosity of the external fluid. For example,
the equilibrium position zeq of a viscoelastic drop can be expressed as
),,,,,,,,( λσµµρρ cdextdexteq UDHfz = . (3-4)
According to dimensional analysis, Eq. (3-4) can be written in the following
dimensionless form:
),,,,(2
WiCaReH
D
H
zeq γ∏= . (3-5)
In this expression, ext
d
µµ
γ = is the drop-to-external fluid viscosity ratio, ext
cext HURe
µρ
= is
the channel height-based Reynolds number, σ
µ cextUCa = is the external fluid viscosity-
based capillary number, and H
UWi c
γλ2
= is the drop-based Weissenberg number. Here,
we assume that the drop density is equal to the external fluid density (a neutrally buoyant
case): 1=ext
d
ρρ
. The deformation index and the orientation angle of the drop also depend
on these five dimensionless parameters: D/H, γ, Re, Ca, and Wi. Since we define the
polymer viscosity as a product of the relaxation time and the elastic modulus, the limiting
case of λ = 0 s (Wi = 0) corresponds to a Newtonian drop with the total viscosity µd
equal to its solvent viscosity µs. In this work, we changed the solvent viscosity only when
40
we simulated Newtonian drops. For the viscoelastic drop simulation, µd/ µs was always
one, and thus the code was stable when Wi approached zero.
3.3 Results and discussion
Validation of the numerical method
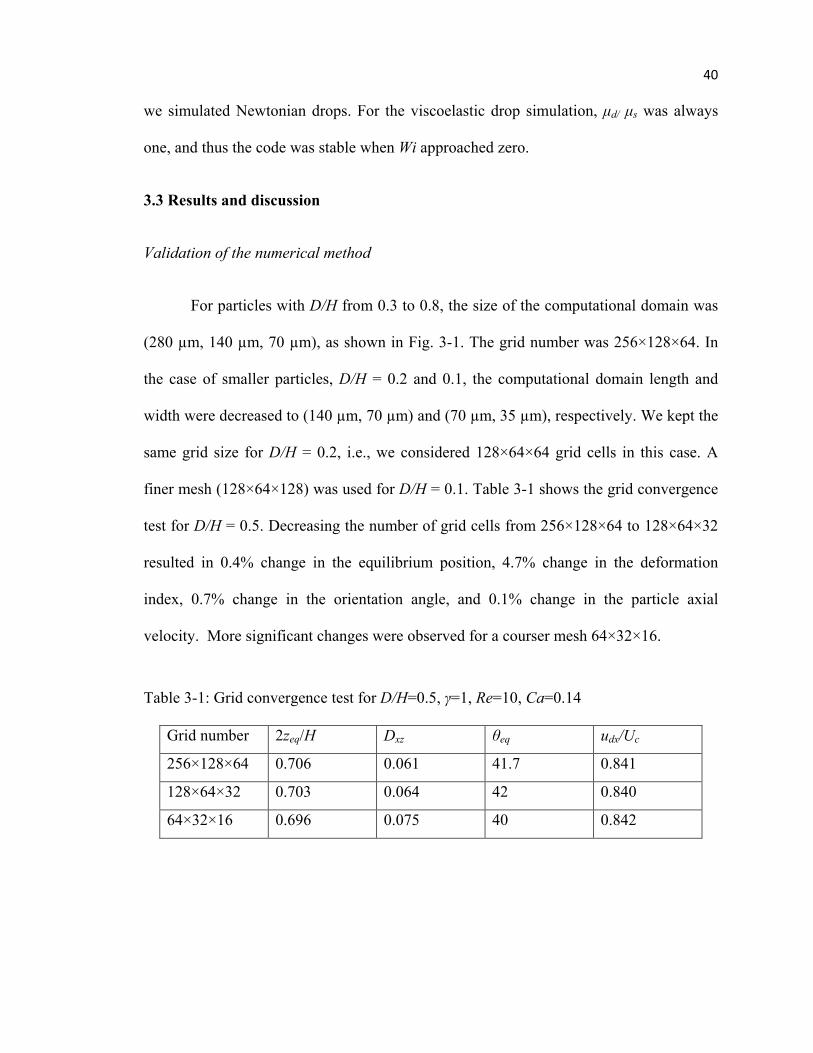
For particles with D/H from 0.3 to 0.8, the size of the computational domain was
(280 µm, 140 µm, 70 µm), as shown in Fig. 3-1. The grid number was 256×128×64. In
the case of smaller particles, D/H = 0.2 and 0.1, the computational domain length and
width were decreased to (140 µm, 70 µm) and (70 µm, 35 µm), respectively. We kept the
same grid size for D/H = 0.2, i.e., we considered 128×64×64 grid cells in this case. A
finer mesh (128×64×128) was used for D/H = 0.1. Table 3-1 shows the grid convergence
test for D/H = 0.5. Decreasing the number of grid cells from 256×128×64 to 128×64×32
resulted in 0.4% change in the equilibrium position, 4.7% change in the deformation
index, 0.7% change in the orientation angle, and 0.1% change in the particle axial
velocity. More significant changes were observed for a courser mesh 64×32×16.
Table 3-1: Grid convergence test for D/H=0.5, γ=1, Re=10, Ca=0.14
Grid number 2zeq/H Dxz θeq udx/Uc
256×128×64 0.706 0.061 41.7 0.841
128×64×32 0.703 0.064 42 0.840
64×32×16 0.696 0.075 40 0.842

41
Two benchmark tests of the computational algorithm were conducted. In the first
test, we compared the numeral data on the deformation of a Newtonian fluid drop moving
at the centerline of the microchannel with the corresponding analytical solution for the
problem of drop motion and deformation in an infinitely wide and long channel between
two parallel plates [71]. The drop viscosity was the same as the viscosity of the external
fluid, i.e., µd = µext = 1 cP, and two values of the capillary number were considered: Ca =
0.28 and 1.4. With a smaller value of Ca, the drop has small deformation and the drop
shape calculated by the numerical model (dashed line in Fig. 3-4a) matches well the
analytical formula (solid line):
)()1(8
11101
2
ϕγγ
fH
DCar
++
+= , (3-6)
where r is the radial coordinate, φ is the angular coordinate measured from the x-axis, and
f(φ) is a shape correction function:
( )ϕϕϕϕ 22 sin4coscos2.0)( −=f . (3-7)
Equations (3-6) and (3-7) describe the shape of the drop in the xz-plane (side view)
with the center at the origin that moves in an unbounded quadratic flow field at a low
Reynolds number. Both the numerical and analytical models predict the drop deformation
to a smoothed triangular shape at a larger value of Ca (Fig. 3-4b). However, the
analytical shape is characterized by concave regions at the top and bottom of the drop
located closer to the drop front. The numerical shape is akin to a bullet with a small
concave region on the back, which is completely consistent with the previous boundary
integral simulation by Griggs et al. [75] (cf. Fig. 5 in that paper). It should be noted that

42
Eqs. (3-6) and (3-7) were derived under the assumption of infinitesimally small
perturbations from the spherical shape and thus they are invalid when the drop
experiences large deformation.
Fig. 3-4 Comparison of the numerical (dotted) and analytical shapes (solid) of a
Newtonian fluid drop moving at the centerline of the channel. (a) Ca = 0.28 and (b) Ca =
1.4. For both plots, D/H = 0.5, Re = 1, and γ = 1.

43
In the second test, we compare the numerical results on the drop velocity in the
flow direction dxu with the corresponding analytical formula [71]:
2
321
4
+
−
−=H
D
H
z
H
z
U
u
c
dx
λλ
, (3-8)
The dimensionless drop position Hz /2 in the z-direction now varies from 0.3 to 1.0
(centerline). The results of this test are shown in Fig. 3-5 for a small drop (D/H = 0.2) and
a large drop (D/H = 0.5). As seen in this figure, there is an excellent agreement between
the numerical simulation and the analytical model when the drop size is small. An
increase in the drop size leads to some discrepancy between the numerical and analytical
models, especially for drops located closer to the channel walls, but the results agree well
with those from Griggs et al. [75] (cf. Fig. 4c in that paper). This could be explained by
the fact that the wall effects were not considered when deriving Eq. (3-8). This
comparison also indicates that the boundaries in the y direction have a negligibly small
effect on the drop dynamics when W is greater than H (in the simulation, W/H = 2).

44
Fig. 3-5 Comparison of the numerical (dashed) and analytical data (solid) on the x-
component of the Newtonian fluid drop velocity as a function of the z-coordinate of the
drop centroid. Triangles are the numerical data by Griggs et al. [75]. Two sizes of the
drop are considered: D/H = 0.2 and 0.5. The values of other dimensionless parameters are
Re = 10, Ca= 0.14, and γ = 1.

45
Lateral migration of Newtonian fluid drops
The viscosity ratio γ, capillary number Ca, and Reynolds number Re ranged in the
Newtonian drop simulation from 1 to 10, 0.1 to 10, and 10 to 100, respectively. These
ranges were selected on the basis of previous computational and experimental studies
mentioned in the Introduction section, including the data from microfluidic experiments.
One application of the results presented in this section could be the use of microfluidic
technology for efficient homogenization of milk, the process where large fat globules are
separated or break into small globules [161]. The milk viscosity is between 1 and 10 of
the water viscosity. Another application is the preparation of kerosene drops with similar
size and viscosity for accurate testing combustion systems such as diesel and jet engines
[162]. The kerosene viscosity is slightly more than the water viscosity. These results
provide the information about the equilibrium position of Newtonian liquid drops at
different viscosities and sizes that could be used for the design of microfluidic systems,
e.g., for separation of kerosene drops or fat globules in milk.
Figure 3-6 shows typical trajectories as well as lateral (perpendicular to the flow)
and translational (along the flow centerline) velocities of a Newtonian liquid drop before
it reaches the steady state. The trajectories of the drop migrating upwards from the
position close to the wall or downwards from the position close to the centerline
asymptotically approach the lateral equilibrium position zeq (Fig. 3-6a). As seen in Fig. 3-
6b, the lateral velocity udz calculated based on the displacement of the drop centroid
decreases to zero when the position of the drop approaches the equilibrium position.
Another result that follows from Figs. 3-6a and 3-6b is that drops located closer to the

46
wall migrate faster in the z-direction and therefore need less time and less travelling
distance in the x-direction to reach the equilibrium position, as compared to drops closer
to the centerline. This phenomenon may be explained by the larger lift force on a drop
near the wall [50, 163]. As evident from Fig. 3-6c, the translational velocity udx is always
less than the flow velocity, but the difference between the translational and flow
velocities decreases with an increase in the distance of the drop from the wall. For
different initial positions of the drop, the dependence of the velocity on the drop centroid
coordinates remains the same. Overall, Fig. 3-6 indicates that the length of a
microchannel with the traps at the outlet to capture particles of different properties should
be determined based on the lateral migration of particles initially located at the centerline.
Since the lateral velocity is less than 2% of the centerline velocity Uc (Fig. 3-6b), we
estimate that for particle separation applications the length of the microchannel should be
at least one order of magnitude more than its height.

47
Fig. 3-6 (a) A change in the z-coordinate of the drop centroid moving in a microchannel
at different initial positions. (b) The z-component and (c) the x-component of the drop
velocity as functions of the z-coordinate of the drop centroid. For all plots, D/H = 0.5, Re
= 10, Ca = 0.14, and γ> = 1.
48
Figure 3-7 shows the numerical data on the equilibrium position, deformation,
and the translational velocity of liquid drops with different viscosity and size. An increase
in the drop diameter D leads to a higher equilibrium position (Fig. 3-7a). Specifically, the
equilibrium position increases from 0.44 at the drop diameter-to-channel height ratio D/H
of 0.2 to 1.0 (centerline) at D/H = 0.8. This effect of the drop size agrees well with the
front tracking data by Mortazavi and Tryggvason [164] and the experimental data by Hur
et al. [21]. A decrease in the equilibrium position with a decrease in the drop size,
coupled with the data in Fig. 3-6, indicates that smaller droplets initially located at the
centerline travel much longer distance in the flow direction before settling at their lateral
equilibrium position than larger ones. Thus, trapping of the population of smaller drops
with specific mechanical properties requires longer microchannels. Shear flow induces
deformation of the drop from a sphere to either an ellipsoid-like shape oriented at a
specific angle of 35~42º to the channel wall if the drop size 5.0/ ≤HD or a bullet-like
shape (cf. Fig. 3-4b) for drops of size D/H = 0.8. The steady state deformation index Dxz
changes nonlinearly with the drop size, reaching the maximum of 0.06 at D/H between
0.4 and 0.5 (Fig. 3-7b). The translational velocity of very small drops (D/H ≤ 0.2) at the
equilibrium position is almost the same as the x-velocity of the external fluid, but the
difference between the velocities increases with an increase in the drop size (Fig. 3-7c).
This result is in line with Eq. (3-8). Thus, the flow velocity measured (or estimated from
the Poiseuille formula) at the lateral equilibrium position predicts well the steady-state
translational velocity of small drops, but not that of large ones.
The drop viscosity has a small effect on drop dynamics provided the capillary
number is small (0.14). The equilibrium position slightly increases with an increase in the

49
drop-to-external fluid viscosity ratio γ from 1 to 10 (Fig. 3-7a). This effect could be
explained by the increased lubrication force (and thus the increased hydrodynamic lift) on
high-viscosity drops [164]. It should be noted that the equilibrium position reaches the
peak value at γ = 10, according to the experimental data for oil drops in water [21]. We,
therefore, do not expect a further increase in the equilibrium position with γ > 10. Our
numerical data also predict a smaller deformation index at γ = 10 than at γ = 1 or 5 (Fig.
3-7b) and a larger deviation of the translational velocity of the drop from the flow
velocity with higher viscosity values (Fig. 3-7c).

50
Fig. 3-7 (a) Equilibrium position, (b) deformation index, and (c) x-component velocity of
a Newtonian drop perfused through a water-filled microchannel as functions of particle
diameter for different values of the drop-to-external fluid viscosity ratio. Here, Re = 10
and Ca = 0.14. The curve fitting is based on the quadratic form.

51
The interfacial tension can decrease and hence the capillary number Ca can
increase in the presence of surfactant molecules. The effects of Ca on the drop lateral
migration and deformation were studied in the case of D/H = 0.2 (Fig. 3-8). As seen in
this figure, an increase in the capillary number dramatically amplifies the effects of drop
viscosity on the drop equilibrium position, deformation index, and orientation angle. This
could be explained by the fact that the viscous force at higher values of Ca is more
dominant in drop dynamics than the interfacial tension force. For low-viscosity (γ = 1)
drops, the equilibrium position increases from 0.44 to 0.72 when Ca increases from 0.14
to 1.4 (Fig. 3-8a). It should be noted that an increase in the capillary number beyond 10
leads to significant elongation and then breakup of the drops (illustrated in Fig. 3-8a in
the case of γ = 1). For higher-viscosity drops, the non-dimensional equilibrium position
Hzeq /2 reaches the maximum of 0.59 at Ca ≈ 5 (for γ = 5) and 0.53 at Ca ≈ 0.6 (for γ =
10). For the highest value of Ca considered in this study (14), the equilibrium position
changes from 0.44 to 0.55 between γ = 5 and 10. This is a 20% change, while Fig. 3-7a
shows only a 0.6% for Ca = 0.14 and drops of the same size. Similarly, if Ca = 14, the
deformation index doubles (from 0.19 to 0.385) with a decrease in the drop-to-external
fluid viscosity ratio from 10 to 5 (Fig. 3-8b). However, if it is equal to 0.14, drops of the
same size show no change in the deformation index (0.043) between γ = 5 and 10.
The deformation index increases monotonically with the capillary number for all
viscosity values studied. Higher-viscosity drops (γ = 5 and 10) show a plateau of the
deformation index at large values of Ca (Fig. 3-8b). The orientation angle decreases by
30º with Ca increased from 0.14 to 14 such that higher-viscosity drops become almost

52
parallel to the wall at Ca = 14 (Fig. 3-8c). For Ca = 1, the orientation angle decreases by
about 2/3 when the drop viscosity changes from 1 cP to 10 cP (Fig. 3-8c), which is
completely consistent with the numerical data by Ghigliotti et al. [165]. The comparison
of Figs. 3-8a and 3-8c indicates that a decrease in the orientation angle below 10º will
result in the reduction of the lift force on the drop, thereby leading to a lower equilibrium
position at higher capillary numbers. The decrease of lift force due to a smaller
orientation angle was also discussed for vesicles in both computational and experimental
works [54, 166, 167].
There are two possible outcomes of the observed effect of the capillary number.
First, it would be much easier to 1) separate drops based on their bulk viscosity and 2)
measure their viscosity from the images of their shape in a microchannel if their
interfacial tension is low. Second, the separation of high-viscosity drops based on
interfacial tension is not feasible using microfluidic flow systems because their
equilibrium position changes nonmonotonically with interfacial tension. However, it is
possible to classify drops with different values of interfacial tension from the
measurements of their deformation index and orientation angle.
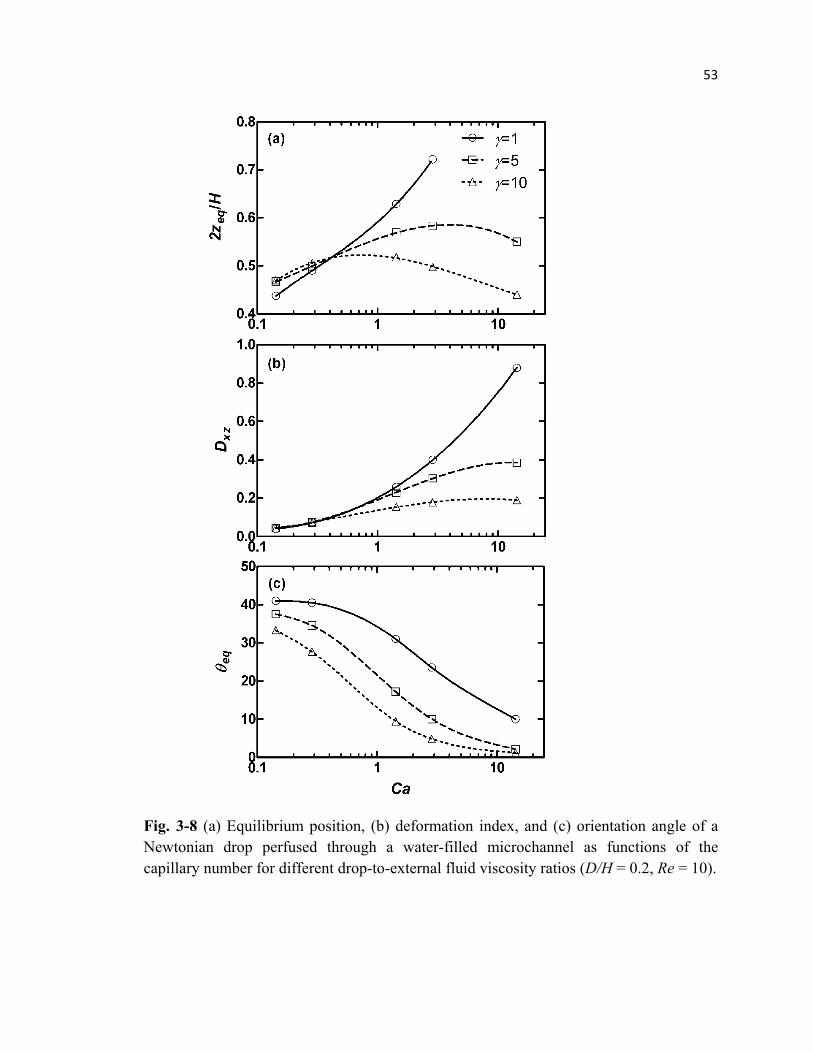
53
Fig. 3-8 (a) Equilibrium position, (b) deformation index, and (c) orientation angle of a
Newtonian drop perfused through a water-filled microchannel as functions of the
capillary number for different drop-to-external fluid viscosity ratios (D/H = 0.2, Re = 10).

54
In microfluidic applications, different flow rates can be used for separation of
liquid drops. Higher flow rates are often preferred for fast and efficient separation. Figure
10 illustrates the effect of the flow rate (or the centerline velocity) on the lateral
equilibrium position of Newtonian fluid drops. If the flow rate increases from 0.686 µL/s
(Re = 10) to 3.43 µL/s (Re = 50), and then to 6.86 µL/s (Re = 100), the equilibrium
position of low viscosity (1-5 cP) drops becomes higher (Fig. 3-9a) and they experience
larger deformation (Fig. 3-9b). However, the flow rate effects on the drop position and
deformation index are reduced at a further increase of the viscosity to 10 cP (Fig. 3-9a, b).
On the contrary, a change in the orientation angle with the flow rate becomes more
pronounced at higher viscosities (Fig. 3-9c). When the flow rate is low, the equilibrium
position increases with the drop viscosity and the deformation index remains essentially
the same (cf. solid line in Fig. 3-9a, b). These are consistent with the data from
microfluidic experiments [21]. An increase in the flow rate above the values used in these
experiments reverses the trend of the viscosity effect on the equilibrium position and
increases the viscosity effect on the deformation index (dotted line in Fig. 3-9a, b). These
results indicate that the separation of low viscosity drops from high viscosity ones and the
drop viscosity measurement will be more effective at high flow rates.

55
Fig. 3-9 (a) Equilibrium position, (b) deformation index, and (c) orientation angle of a
Newtonian drop perfused through a water-filled microchannel as functions of the drop-to-
external fluid viscosity ratio for different flow rates. D/H = 0.2. Flow rates were
determined by integration of Eq. (3-1) over the channel cross section at a given pressure
gradient. Re and Ca were calculated from the centerline velocity value in Eq. (3-1).

56
Both the Reynolds and capillary numbers change linearly with the flow rate and it
is unclear which of them contribute most significantly to the flow rate effects. To answer
this question, we have studied lateral migration and deformation of drops when both the
flow rate and the interfacial tension coefficient increased simultaneously to keep the
capillary number constant. This gives us the effect of the Reynolds number (cf. Fig. 3-10).
As seen in this figure, an increase in Re leads to a decrease in the equilibrium position of
drops, but this effect becomes significant only if their viscosity is low. We also found that
the deformation index (~0.045) was nearly independent on Re for all the values of drop
viscosity considered (not shown). Additionally, a small increase in the orientation angle
(2~6º) was observed with Re changed from 10 to 100. From comparison of these data
with Fig. 3-9 it follows that the Reynolds number is not a factor in the flow rate effects,
but rather these effects are resulted from an increase in the capillary number. Two
conclusions we can make from this analysis. First, the effects of the flow rate on drop
migration and deformation are not the same as the Reynolds number effects because the
drop dynamics also depends on the capillary number, which changes with the flow rate.
Second, the interfacial tension coefficient is one of the mechanical properties that we are
interested to measure, while the flow rate is an input parameter that can be well
controlled in experiments. Thus, the numerical or analytical studies based on a change in
the Reynolds number only are insufficient in understanding the separation of drops in a
microchannel.

57
Fig. 3-10 The effect of the Reynolds number on the equilibrium position of Newtonian
drops (D/H = 0.2, Ca = 0.14).

58
Lateral migration of leukocytes
The leukocyte was modeled as a viscoelastic drop with interfacial tension (known
as cortical tension) due to the elasticity of the actin cytoskeleton in the cell cortex [3].
Viscoelastic fluid models with cortical tension were widely used for the determination of
rheological properties of human neutrophils and other leukocytes from the micropipette
aspiration data and for modeling leukocyte biomechanics [111, 112, 136, 168, 169]. The
basic values of the model parameters were taken from experimental measurements.
Specifically, the viscosity and relaxation time of the leukocyte cytoplasm were
respectively 100 P and 0.2 s, in line with step aspiration studies [30]. The cortical tension
coefficient is 30 pN/µm which is in the range of values measured by Tsai et al. [109] and
other researchers [170, 171]. The basic value of the leukocyte diameter was selected to be
14 µm. This describes well the size of circulating monocytes [172] and the cells from
monocytic cell lines such as Mono Mac 6 [173]. The range of values considered was also
within the limits of the experimental data. For example, the cytoplasmic viscosity
changed in our study from 100 P to 1000 P, while the experimental range is between 65
and 2100 P [3, 30, 31, 106, 109, 111, 174].
The lateral equilibrium position and deformation index of the leukocyte are
shown in Fig. 3-11 as a function of the cell diameter-to-channel height ratio D/H for
different viscosity values. As in the case of a Newtonian fluid drop, the equilibrium
position of the leukocyte increases almost linearly with D/H An increase in the
cytoplasmic viscosity µd leads to a shift of the equilibrium position toward the lower wall
of the microchannel and a decrease in the deformation index. This corresponds to the
59
behavior observed for the drop in the high capillary number case (compare Figs. 3-8 and
3-11). If the channel height is 70 µm and the cell diameter is half the height, a 10-fold
increase in the cytoplasmic viscosity (from 100 to 1000 P, i.e., when γ = 104 to 10
5)
results in a decrease in the equilibrium position from 32.20 µm to 24.85 µm (7.35 µm
difference). Although this difference eqz∆ becomes smaller with a decrease in the cell
diameter, its ratio to the cell diameter ( Dzeq /∆ ) becomes larger. For example,
21.0/ =∆ Dzeq and 0.33 for D = 35 µm and 14 µm, respectively. This ratio is an
important factor in the problem of separation of living cells with different mechanical
properties. If we consider eqz∆ as the separation distance between cells, Dzeq /∆ will
determine the strength of their hydrodynamic interaction [175, 176]. The cell-cell
separation is more difficult to achieve with more closely spaced cells because of the
increased interaction force between cells. Thus, our analysis indicates that the efficiency
of a microfluidic flow chamber for the separation of particles with different mechanical
properties increases with a decrease in the particle size.
As about the deformation of leukocytes, we did not see any significant changes in
the orientation angle (43º) with the cell viscosity or diameter. The cell deformation index
decreases with the cell diameter-to-channel height ratio when the cytoplasmic viscosity is
at its basic value (solid line in Fig. 3-11b), but no significant effect of the cell size was
observed at higher values of the viscosity (dashed and dotted lines). This behavior is
different from that of a Newtonian fluid drop. There are two reasons for this difference.
First, the equilibrium position of the leukocyte is much closer to the centerline than that
of the drop. This is especially true for large cells (D/H = 0.5; Fig. 3-11a), which

60
experience less deformation than small cells located close to the channel wall because of
reduced fluid shear stresses. Second, the cortical tension coefficient is very small for
leukocytes and the leukocyte viscosity is several orders of magnitude higher than the
water viscosity. Thus, the capillary number for leukocytes is much higher than that for
drops we considered in the previous section. We therefore hypothesize that the bulk
mechanical properties such as viscosity and relaxation time but not the surface
mechanical properties such as cortical tension play an important role in the passive
migration and deformation of leukocytes. Indeed, our numerical simulation in the case of
γ = 104, D/H = 0.2, Re = 10, and Wi = 0.082 shows very small changes in the leukocyte
equilibrium position (from 0.62 to 0.65) and deformation index (from 0.04 to 0.07) when
the capillary number changes from 0.48 to 47.6. This effect is much less than the effects
of the cytoplasmic viscosity and relaxation time (see below). If we consider the
leukocyte cytoskeleton as a series of parallel cross-linked springs, the number of which
increases with the cell diameter, then the elastic force produced by this network will be
higher in a larger cell. Thus, a larger cell will have more resistance to shear-induced
deformation if our hypothesis is true.
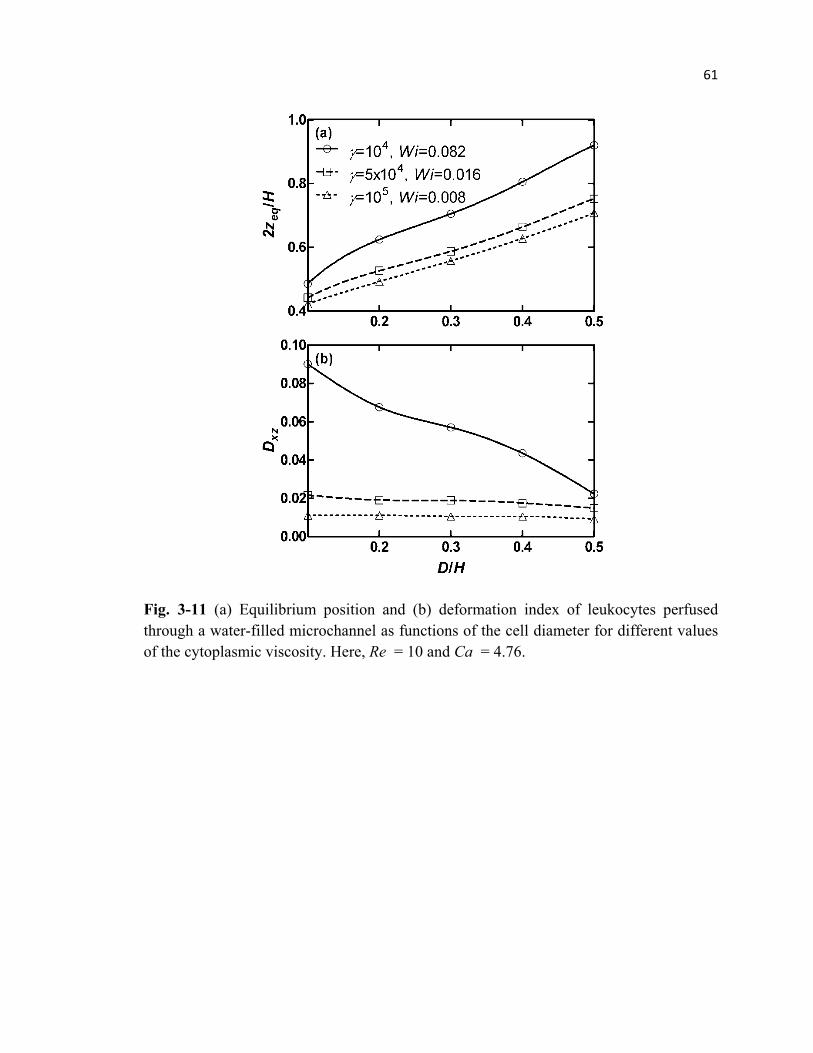
61
Fig. 3-11 (a) Equilibrium position and (b) deformation index of leukocytes perfused
through a water-filled microchannel as functions of the cell diameter for different values
of the cytoplasmic viscosity. Here, Re = 10 and Ca = 4.76.

62
Figure 3-12 illustrates the effect of the cytoplasmic relaxation time λ on the
equilibrium position and deformation index of leukocytes. Here, four values of the
relaxation time were considered: 0.05 s, 0.1 s, 0.2 s, and 0.5, which correspond to the
Weissenberg number Wi = 0.020, 0.041, 0.082, and 0.204, respectively. An increase in
the relaxation time leads to a closer-to-centerline equilibrium position (Fig. 3-12a) and
larger deformation (Fig. 3-12b). For the largest value of the relaxation time considered
(0.5 s), the cells with size 4.0/ ≥HD reach the centerline at steady state, with
deformation to a bullet-like shape. We should point out that the relaxation time is not an
equivalent to the elastic modulus in viscoelastic solid models. We can approximate this
modulus as λµ /d at high values of the cytoplasmic viscosity and the relaxation time
[177]. From this formula it follows that the cell elasticity in sense of elastic solid
deformation and thus the elastic restoring force decreases with an increase in the
relaxation time. This explains why leukocytes are more deformed at higher values of the
Weissenberg number (Fig. 3-12b).

63
Fig. 3-12 (a) Equilibrium position and (b) deformation index of leukocytes perfused
through a water-filled microchannel as functions of the cell diameter for different values
of the relaxation time. Here, Re = 10, Ca = 4.76, γ = 104.

64
Figure 3-13 shows the effect of the flow rate on leukocyte migration and
deformation in a microchannel and also illustrates which of the dimensionless groups is
dominant in these processes. The lateral equilibrium position increases significantly
(from 0.58 to 0.71) with the flow rate changed from 0.686 µL/s (Re = 10) to 6.86 µL/s
(Re = 100), with a plateau at higher values of the flow rate (Fig. 3-13a). The deformation
index is a linearly increasing function of the flow rate (Fig. 3-13b) and the cells become
more oriented in the flow direction at higher flow rates (Fig. 3-13c). Except the
orientation angle, the observed dependence of these parameters on the flow rate follows
the Weissenberg number effects in Fig. 3-12.
Coupled to the results in Fig. 3-11, these data indicate that the migration of living
cells such as leukocytes significantly depends on their bulk viscoelastic properties.
Additionally, the equilibrium position of leukocytes is a monotonic function of both the
viscosity and relaxation time of the cell cytoplasm (cf. Figs. 3-11a and 3-12a). Thus, it is
feasible to use a microfluidic flow system to separate cells with different mechanical
properties or to measure these properties including the viscosity and relaxation time from
the information about the equilibrium position and deformation index of the cells.

65
Fig. 3-13 (a) Equilibrium position, (b) deformation index, and (c) orientation angle of
leukocytes perfused through a water-filled microchannel for different centerline
velocities Other parameters: D/H = 0.2.

66
To compare with experimental data, simulation was done according to the
experimental setup of Hur et al. [21]. The microchannel was rectangular with height H =
38 µm and width W = 85 µm. The flow is fully established with the centerline velocity Uc
= 0.4 m/s. Figure 3-14 shows both the numerical data and experimental results on the
lateral migration of living cells with different viscoelasticity and size (breast cancer cell
lines MCF7 and modMCF7 and white blood cells from human blood). MCF7 are benign
breast cancer cells, which were found to be less deformable than chemically modified
modMCF7 that have an increased metastatic potential [25, 28].
According to the numerical simulation, if the relaxation time is fixed, the cell
equilibrium position moves closer to the wall with increasing polymer viscosity (dashed
lines in Fig. 3-14). When the polymer viscosity changes from 100 P to 10000 P, the
equilibrium position of the cell with D/H = 0.2 and 0.5 changes from 0.72 to 0.48 and
from 1.0 to 0.67, respectively. As in the case of drops, larger cells move closer to the
centerline. These trends are consistent with the experimental data (inverted triangles,
solid circles, and solid squares in Fig. 3-14). Less deformable MCF7 (solid circles) have
an equilibrium position closer to the wall than modMCF7 (solid squares). From the
comparison of the simulation and experiment, the polymer viscosity of the cells studied
falls within the range chosen in the simulation (100-10000 P). The cells with polymer
viscosity of 10000 P (asterisks) behave similarly to rigid particles (diamonds). On the
contrary, the cells with polymer viscosity of 100 P (crosses) have an equilibrium position
reaching the centerline at D/H > 0.4. From comparison of the numerical and experimental
data in Fig. 3-14, it follows that the polymer viscosity of white blood cells and MCF7
cells is slightly higher than 1000 P, while it is between 100 P and 1000 P for modMCF7

67
cells. The majority of micropipette aspiration measurements also predict the values close
to 1000 P for the cytoplasmic viscosity of white blood cells [106, 109, 174]. It should be
noted that the cells exposed to conditions of in vitro experiments can be easily activated
and thus become less deformable. Therefore, leukocytes may experience much higher
deformation in vivo than in vitro [3].
Interestingly, the cells with the polymer viscosity less than 1000 P have an
equilibrium position closer to the centerline than Newtonian liquid drops with much
lower viscosity (0.83~9.3 cP). This seemingly conflicting observation can be explained
by the dominance of solvent viscosity when cells undergo small deformation during
passive migration. This is especially true when the elastic modulus G(0) is sufficiently
small. In this situation, cortical tension still contributes to the lateral migration and since
it is much less for cells than the interfacial tension for drops, the cells go to a higher
equilibrium position than drops with similar internal viscosity.

68
Fig. 3-14 Comparison of equilibrium position of cells and Newtonian drops with
different sizes between our simulation (dashed lines) and the experimental results of Hur
et al. [21]. σ = 0.5 mN/m.
Dashed lines: simulation, polymer viscosity=100P, 1000P, 10000P
malignant cancer cells
oil droplets 9.3 cP
benign cancer cells
oil droplets 0.83 cP
rigid particles

69
3.4 Conclusions
The comprehensive computational study has been carried out to investigate lateral
migration and deformation of fluid drops and leukocytes in a rectangular microchannel.
Our simulation shows that the external force field-free microfluidic technology can be
used for separation of drops with different bulk viscosities if their interfacial tension is
low or the flow rate is sufficiently high. Living cells with different bulk mechanical
properties such as cytoplasmic viscosity and relaxation time can be separated in a
microchannel. It is possible to classify cells with different mechanical properties by
imaging their deformed shape during perfusion through a microchannel. These open up
the possibility of using microfluidics for deformability-based flow cytometry. The
microfluidic technology, however, could be much less effective in the separation of high-
viscosity drops based on interfacial tension. Additionally, our study shows that if the
majority of particles are close to the centerline when entering a microchannel (e.g., when
we perfuse blood through a microchannel and need to separate red blood cells from other
blood cells), they reach their lateral equilibrium position at larger distances from the inlet
than particles initially located close to the wall. Thus, the length of microchannels for
deformability-based cell sorting should be determined from the traveling distance of
particles migrating from the centerline. Our data also indicate an inverse relationship
between the particle size and the traveling distance. This means that the deformability-
based separation of smaller particles requires longer microchannels. Sorting of cells with
different deformability could be more effective with a low cell size-to-channel height
ratio.

70
Chapter 4 Numerical simulation of deformable cell interaction
during migration in a microchannel
4.1 Abstract
When the blood flows in vessels and channels, circulating cells deform and move
relatively to the blood flow in the lateral and translational directions. This migratory
property plays a key role in immune response, hemostasis, cancer progression, delivery
of nutrients, and microfluidic technologies such cell separation/enrichment and flow
cytometry. Using our three-dimensional computational algorithm for multiphase
viscoelastic flow, we have investigated the effect of pairwise interaction on the lateral
and translational migration of deformable cells in a microchannel. The numerical
simulation data show that when two cells with same size and close distance interact, they
repel each other until they reach a same lateral equilibrium position where their
equilibrium separation distance depends on their location relative to the centerline. When
a series of closely spaced cells with same size are considered, they generally undergo
damped oscillation in both lateral and translational directions until they reach equilibrium
positions where they become evenly distributed in the flow direction (self-assembly
phenomenon). For a series of cells with different sizes, bigger cells could collide
repeatedly with smaller ones and enter the other side of the channel (above or below the
centerline). For a series of cells with different deformability, more deformable cells upon
impact with less deformable cells move to an equilibrium position closer to the centerline.

71
The results of our study offer insight on cell margination in bloodstream and cell
separation/enrichment in microfluidic devices.
4.2 Simulation framework
In the simulation, two initially spherical cells with diameters D1 and D2 suspended
at the middle plane (y=W/2) of a rectangular microchannel with height H = 70 µm and
width W = 140 µm (Fig. 4-1). Initially, the flow is fully established with the centerline
velocity Uc = 0.14 m/s. All the walls of the rectangular duct are considered to be no slip
boundaries and periodic boundary conditions are applied at the inlet and outlet. In most
cases, we consider cells with same diameter D1 = D2 = D = 14 µm, elastic modulus G(0)
= 50 Pa, relaxation time λ = 0.2 s, and cortical tension coefficient σ = 0.03 mN/m. We
have also included the data for different size cells (D1 = 28 µm, D2 = 14 µm) and for the
cells with different deformability (G1(0) = 25 Pa, G2(0) = 250 Pa).
Fig. 4-1 Schematic of the simulated problem. Two interacting cells in a rectangular
microchannel. The cells may have different size and deformability and may have
different spacing in the x-direction (translational direction) and/or the z-direction (lateral
direction). They are subject to shear flow created by a pressure difference between inlet
and outlet. Periodic boundary conditions have been applied at the inlet and outlet. No-slip
boundary conditions were applied to the channel walls in the y- and z-directions. Chanel
height H and width W are 70 µm and 140 µm, respectively. Channel length L is variable.

72
4.3 Results and discussion
The simplest case in our simulation of cell-cell interaction is one cell in a
microchannel with periodic boundaries. Physically, this case represents a long series of
the cells equally spaced in the translational direction while having the same lateral
position. By changing the channel length in the simulation, the distance between the cells
can be changed. As seen in Figure 4-2, the later equilibrium position becomes closer to
the channel wall as the cell-cell separation distance shortens, in line with the
computational work on Newtonian drops by Mortazavi et al. [164]. When the distance
between cell centers (here, it is denoted as the x-distance) is below 70 µm, its effect on
the lateral equilibrium position remains strong. The slope of the lateral equilibrium
position vs. the x-distance becomes low when the x-distance increases beyond 70 µm,
indicating that 70 µm can serve as a threshold cell-to-cell distance for a transition from
scenario AB to scenario A provided the cell diameter is between 14 and 21 µm. The
difference in the lateral equilibrium position between scenario A [178] and the current
simulation of scenario AB at the x-distance of 140 µm is only 0.04 µm for D = 14 µm
(0.2 %) and 0.2 µm for D = 21 µm (0.8%). Figure 4-2 also shows a decrease in the slope
for smaller cells (D = 14 µm) when the x-distance decreases below 21 µm. This effect is
most likely caused by the wall repulsion that becomes higher as the cells get closer to the
wall and the close proximity of the cells.

73
Fig. 4-2 Lateral equilibrium position of cells as a function of x-distance (separation) for
different cell diameters (dashed line: D = 14 µm, solid line: D = 21 µm) for a series of
identical and periodically spaced cells. Dash-dot lines show the equilibrium position
values for single cell migration without interaction (Scenario A, as mentioned in the
Introduction).

74
Next, two equal diameter (D = 14 µm) cells are put in one computational domain.
The cells had the same initial lateral position z0 and different translational position x0. In
Figure 4-3a, the channel length was 140 µm, i.e., due to periodic boundary conditions,
the average x-distance was 140/2 = 70 µm. The initial lateral position for both cells was
21.2 µm, which is expected to be the equilibrium position according to the data in Fig. 4-
2. The initial x-distance between the cells was 42 µm. As shown in Fig. 4-3a, the lateral
position of both cells experienced damped oscillation around a specific lateral position
during migration in the channel. The oscillations of the two cells were in antiphase (i.e.,
the phase shift is 180°) and had a period of about 25 ms and the maximum amplitude of
about 1.9 µm (Fig. 4-3a). For another case (the channel length was 84 µm and the
average x-distance of cells was 42 µm), the period of the oscillations was 15 ms (Fig. 4-
3b) and the maximum amplitude was 2.5 µm. In each case, the distance (separation)
between the cells in the x-direction also oscillated around the average x-distance with
time (Fig. 4-3c). This oscillatory dynamics of cells occurs while the cells are dragged by
bulk flow toward the outlet, i.e., two interacting cells behave as two beads attached to a
string with a dashpot that regularly contracts and relaxes during its movement in shear
flow. The oscillation of the cells in the translational direction was out of phase (at a phase
shift of 90°) with the oscillation in the lateral direction, but the periods of these
oscillations were same. The maximum amplitude was 47 µm for the average x-distance of
70 µm (solid line in Fig 4-3c) and 34 µm for 42 µm (dashed line), which was more
significant than the amplitude of the lateral oscillation. After the decay of the oscillations,
the cells reached the same lateral equilibrium position and same x-distance between them,
as discussed in Figure 4-2 and agreed with the experimental results of Lee et al. [88] on

75
particle self-assembly in a microchannel. These oscillations in Fig. 3-3 were caused by
the repulsive and attractive interaction with the cells of the neighboring computation
domains since the periodic condition was used in the inlet and outlet of the channel.

76
Fig. 4-3 (a) Time evolution of the lateral positions of identical cells with the average x-
distance of 70 µm. The initial position for Cell 1 and Cell 2 is x0 = 49 µm and z0 = 21.2
µm and x0 = 91 µm and z0 = 21.2 µm, respectively. (b) Time evolution of the lateral
positions of cells with the average x-distance of 42 µm. The initial position for Cell 1 and
Cell 2 are x0 = 31.5 µm and z0 = 21.2 µm and x0 = 52.5 µm and z0 = 21.2 µm, respectively.
(c) The x-distance between the cells as a function of time for cases (a) (solid line) and (b)
(dashed line). In both cases, the cell diameter is 14 µm.

77
To reduce the effect of periodic boundaries on the interaction of two migrating
cells, we increased the channel length to 280 µm. In this simulation, the initial x-distance
between the cells was fixed at 140 µm to ensure that the cell-cell interaction was initially
negligible (cf. Fig. 4-2). By changing the initial z-distance (initial distance between the
cell centroids in the lateral direction), we then investigated the migration of both cells in a
microchannel. When the initial z-distance was 7 µm (Fig. 4-4a), the cells first moved
slowly towards the lateral equilibrium position as expected according to our previous
study on single cell migration [178]. Cell 1 was closer to the centerline and moved faster
in the x direction than Cell 2. This led to a decrease in the x-distance (Fig. 4-4c) with a
concurrent decrease in the z-distance (Fig. 4-4a). Just before t = 10 ms, the rate by which
the cells approached each other in the lateral direction increased. Then, at t = 10 to 11 ms,
the x-distance became almost zero and the strong interaction between the cells led to
strong cell deformation and to Cell 1 jumping upward and Cell 2 jumping downward (Fig.
4-4a). After t = 11 ms, Cell 1 passed Cell 2 and the cell-cell interaction weakened. The
cells recovered their pre-collision shapes and moved back rapidly to the lateral position
slightly higher (in the case of Cell 1) or lower (Cell 2) than they had before t = 10 ms. For
the initial z-distance of 7 µm, Cell 1 remained to be closer to the centerline and faster in
the translational direction than Cell 2, and thus the absolute value of the x-distance
continued to increase with time and the interaction gradually vanished (solid line in Fig.
4-4c). However, when the initial z-distance became 4 µm, a different migratory behavior
was observed. First, these cells never collided. Their x-distance was no less than 45 µm.
When they reach this minimum distance (at t = 13 ms), they had the same lateral position
(Fig. 4-4b). After t = 13 ms, Cell 1 continued to move downward, while Cell 2 moved
78
upward (Fig. 4-4b). As a result, Cell 1 went below Cell 2 and Cell 2 started moving faster
than Cell 1, as evident by positive and increasing values of the x-distance after t = 13 ms
(dashed line in Fig. 4-4c). At t = 40 ms, the x-distance was 163 µm, which was 11.6 times
higher than the cell diameter. The cells eventually reached their lateral equilibrium
position, which was higher than the initial z-position for Cell 2 and much lower than the
initial z-position for Cell 1. This case illustrates that although the cells at the end are far
from each other and their position equilibrates, they can be “swapped” during transient
interactions occurring before reaching this equilibrium position. The disturbance flow
reflected from the nearby channel wall by the lagging cell pushed the leading cell across
the streamlines of the external flow towards the centerline direction and caused the
“swapping” [88]. In Fig. 4-4, the channel length in the computation domain is large
enough and there are no repulsive and attractive interactions with the cells of the
neighboring computation domains, so there was no oscillation during migration.

79
Fig. 4-4. The effect of the initial z-distance on the migration of two identical cells. (a)
Time evolution of the cell lateral positions when the initial z-distance is 7 µm (z0 for Cell
1 and 2 is equal to 29 µm and 22 µm, respectively). (b) Time evolution of the cell lateral
positions when the initial z-distance is 4 µm (z0 for Cell 1 and 2 is equal to 26 µm and 22
µm, respectively). (c) Time evolution of the x-distance between the cells in cases (a)
(solid line) and (b) (dashed line). In both cases, the cell diameter is 14 µm; the channel
length, width, and height are 280 µm, 140 µm, and 70 µm; and the initial translational
position x0 for Cells 1 and 2 is 70 and 210 µm, respectively.

80
Figure 4-5 shows the results of the simulation of two cells with low deformability.
This case was selected to test the model against the experimental data on the interaction
of two solid particles by Lee et al. [88]. To match the experimental conditions, the flow
velocity increased to Uc = 0.53 m/s and the ratio of cell diameter to channel height
increased to 0.4. The initial x-distance of two equal size (here, D = 10 µm) cells was
fixed at 100 µm to have negligible interaction between cells initially, as in the previous
case. When the initial z-distance was 6 µm, Cell 1 moved downward slowly with time
and Cell 2 moved upward much faster than Cell 1 because of the wall repulsion (Fig. 4-
5a). As in Fig. 4-4b, cell “swapping” was observed. However, the cells quickly reached
the same lateral equilibrium position and their final x-distance was about 54 µm, i.e., less
than 6 times of the cell diameter (solid line in Fig. 4-5c). With a decrease in the initial z-
distance to 2 µm, “swapping” disappeared (Fig. 4-5b). Cell 1 moved initially upward and
then slightly downward. Cell 2 also moved upward. Both cells eventually reached the
same lateral equilibrium position at t ≈ 3 ms and the x-distance monotonically decreased
to about 70 µm at this time instant. These simulation results are consistent with the
experimental results [88]. The difference in the migratory behavior between Figs. 4-4 and
4-5 is due to a higher cell diameter-to-channel height ratio in the data shown in Fig. 4-5.

81
Fig. 4-5 The effect of the initial z-distance on the migration of two identical cells with
higher cell diameter-to-channel height ratio than that in Fig. 4-4. a) Time evolution of the
cell lateral positions when the initial z-distance is 6 µm (z0 for Cell 1 and 2 is equal to 12
µm and 6 µm, respectively). (b) Time evolution of the cell lateral positions when the
initial z-distance is 2 µm (z0 for Cell 1 and 2 is equal to 10 µm and 8 µm, respectively). (c)
Time evolution of the x-distance between the cells in cases (a) (solid line) and (b) (dashed
line). In both cases, the cell diameter is 10 µm, the channel length, width, and height are
300 µm, 90 µm, and 25 µm; and the initial translational position x0 for Cells 1 and 2 is
100 and 200 µm, respectively.

82
Our next simulation deals with two cells initially located in the top and bottom
halves of the channel (Fig. 4-6). The channel height was 70 µm. The bottom and top cells
were initially at z = 24 µm and 48 µm, respectively. In the data shown in Figure 4-6a, the
channel length was 280 µm and thus the average x-distance was 280/2 = 140 µm. The
initial x-distance between the cells was 130 µm. According to this simulation, both cells
experience damped oscillation in both lateral and translational directions. During these
in-phase (phase shift = 0°) oscillations with the maximum lateral amplitude of about 2
µm, they were slowly drifting to their expected lateral equilibrium positions. These
positions were symmetric around the centerline, i.e., if the bottom cells goes to the
equilibrium position zeq, the top cell has the equilibrium position H-zeq. As seen in Fig. 4-
6c, Cell 1 moved faster in the x-direction than Cell 2 because it was closer to the
centerline than Cell 2. This resulted in a decrease in the x-distance with time until t ≈ 20
ms, when the damped oscillation in the x-distance around 42 µm began (solid line in Fig.
4-6c). Since the cells did not move far from each other and the channel was long enough
to avoid the influence of cells outside the computational domain (due to channel
periodicity), the final x-distance of 42 µm was much less than the expected average x-
distance of 140 µm. The final x-distance did not change until the average x-distance
became less than the final x-distance (Fig. 4-6c). It should be noted that when the average
x-distance was 42 µm and the initial x-distance was 2 µm, the oscillation amplitude of top
and bottom cells (initially located at z = 50.2 µm and 19.8 µm, respectively) became
much higher (Fig. 4-6b) than for cells with larger initial and average x-distances (Fig. 4-
6a). This occurred due to stronger cell-cell interaction at smaller x-distance.
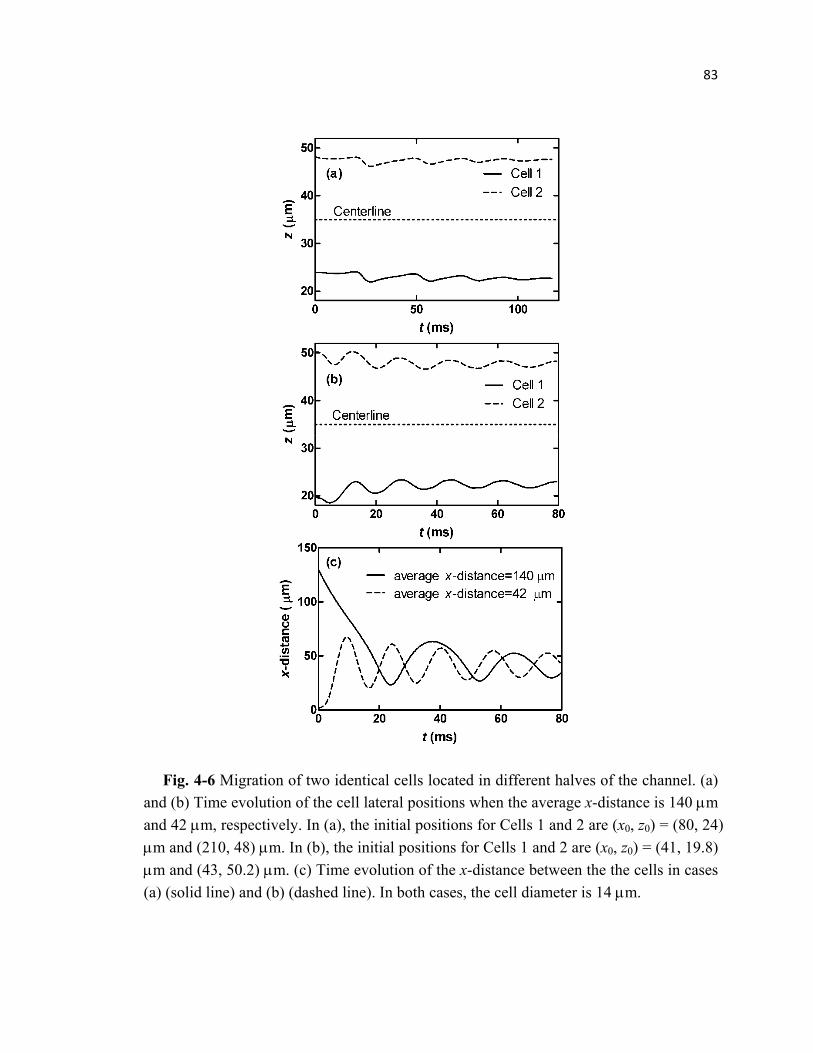
83
Fig. 4-6 Migration of two identical cells located in different halves of the channel. (a)
and (b) Time evolution of the cell lateral positions when the average x-distance is 140 µm
and 42 µm, respectively. In (a), the initial positions for Cells 1 and 2 are (x0, z0) = (80, 24)
µm and (210, 48) µm. In (b), the initial positions for Cells 1 and 2 are (x0, z0) = (41, 19.8)
µm and (43, 50.2) µm. (c) Time evolution of the x-distance between the the cells in cases
(a) (solid line) and (b) (dashed line). In both cases, the cell diameter is 14 µm.

84
Figure 4-7 shows the simulation data when two cells have very large initial z-
distance but are still located in the same half (bottom or top) of the channel. As seen in
Fig. 4-7, the upper cells repeatedly collided with the lower one. For comparison, the
migration data for a single cell (dotted and dash-dot-dot lines) is also plotted in Fig. 4-7a.
Similarly to Fig. 4-4a, during every collision, the cells have opposite spikes in their
lateral position. After collision, the cells moved toward the single-cell lateral equilibrium
position, but, during this motion, they again collided. These repeated collisions kept them
from reaching the single-cell equilibrium position. The spike height for the lower cell
(Cell 1) was shorter due to the wall repulsion, i.e., Cell 1 stayed closer to the trajectory of
the single cell migration than the upper cell (Cell 2). Eventually, due to longer spikes,
Cell 2 moved further and further from the trajectory of the single cell migration. It finally
crossed the centerline and entered another half of the channel, where it underwent
damped oscillation with larger amplitude than before (Fig. 4-7b), similar to what was
shown in Fig. 4-6b.

85
Fig. 4-7 The migration of a series of identical and periodically spaced cells (two lines of
cells with a large initial z-distance between them). (a) and (b) show the short- and long-
term evolution of the lateral positions of these two lines (denoted as Cell 1 and Cell 2). In
(a), dotted and dash-dot-dot lines are the time evolution of the lateral positions according
to scenario A (single cell). Here, the cell diameter is 14 µm; the channel length, width,
and height are 84 µm, 140 µm, and 70 µm; z0 for Cells 1 and 2 is 13 µm and 27 µm; and
x0 for Cells 1 and 2 is 63 and 21 µm, respectively.

86
In reality, cells may differ in their size and/or deformability. Figure 4-8 shows the
numerical data on the interaction of two different-diameter cells. In this simulation, the
length of the computational domain was small enough for periodic boundary conditions
(and thus cells outside the domain) to influence the cell migration dynamics. In Figure 4-
8a, the average x-distance was 42 µm. The initial lateral position of the bigger cell (Cell 2)
was higher than that of the smaller one (Cell 1). This situation was considered because
bigger cells generally migrate to higher lateral equilibrium positions (i.e., closer to the
centerline) than smaller ones [178]. Similar to Fig. 4-3a, both cells experienced damped
oscillation in antiphase, and the oscillation amplitude was much larger for the smaller cell
than that for the bigger cell. At the end of oscillation, the bigger cell remained at a lateral
position closer to the centerline than the smaller cell, i.e., no “swapping” occurred. This
result indicates that cells with different sizes can be separated using inertial microfluidics
even when the spacing between the cells is small and the cell-cell interaction is
significant. Interestingly, as the average x-distance decreased to 28 µm (Fig. 4-8b), the
bigger cell collided and then passed the smaller cell repeatedly (because of periodic
boundaries). This led to the oscillation of the cells and also the entrance of the bigger cell
to the top half of the microchannel, while the smaller cell remained in the bottom half
(the case similar to what is shown in Fig. 4-7b). Because of this phenomenon, the z-
distance between the cells increased dramatically: from 6 µm at the average x-distance of
42 µm to 28 µm at 28 µm (Fig. 4-8).

87
Fig. 4-8 Time evolution of the lateral positions of two cells of different size and the
average x-distance of 42 µm (a) and 28 µm (b). In (a), the initial translational positions
for Cells 1 and 2 are x0 = 21 µm and 63 µm. In (b) x0 = 10.5 and 38.5 µm for Cells 1 and
2, respectively. The diameters of Cell 1 and 2 are 28 µm and 14 µm, and their initial
lateral positions z0 = 22 µm and 28 µm.
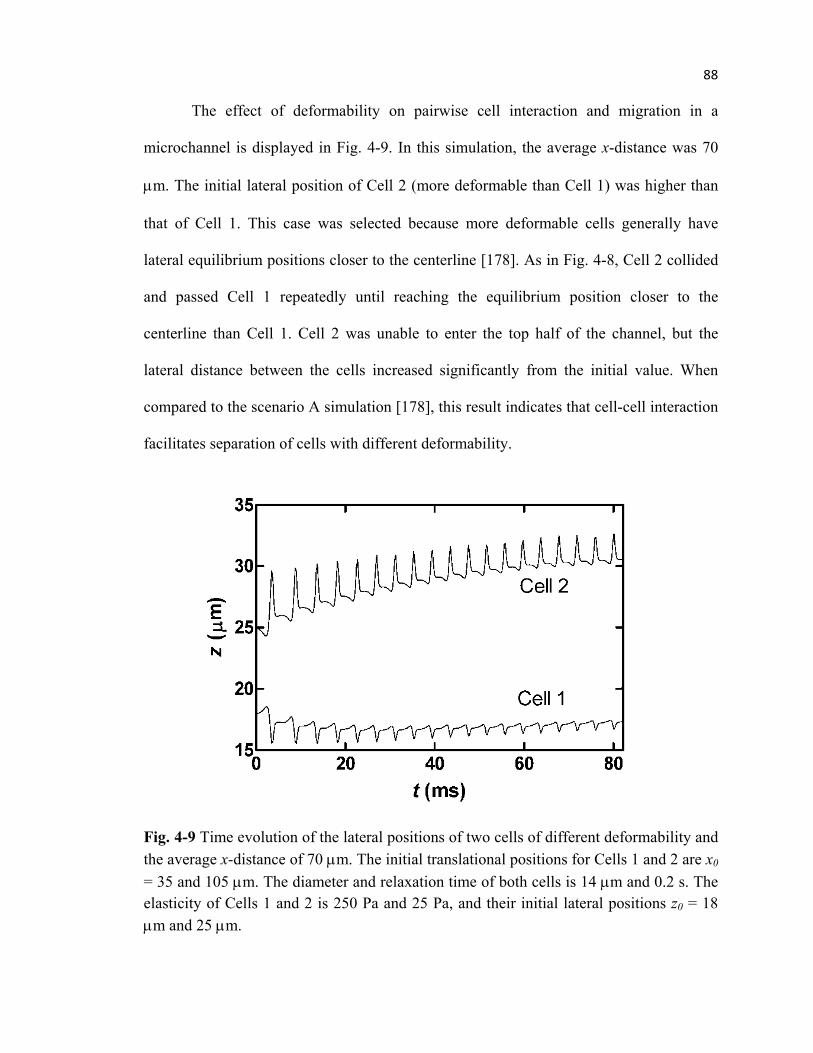
88
The effect of deformability on pairwise cell interaction and migration in a
microchannel is displayed in Fig. 4-9. In this simulation, the average x-distance was 70
µm. The initial lateral position of Cell 2 (more deformable than Cell 1) was higher than
that of Cell 1. This case was selected because more deformable cells generally have
lateral equilibrium positions closer to the centerline [178]. As in Fig. 4-8, Cell 2 collided
and passed Cell 1 repeatedly until reaching the equilibrium position closer to the
centerline than Cell 1. Cell 2 was unable to enter the top half of the channel, but the
lateral distance between the cells increased significantly from the initial value. When
compared to the scenario A simulation [178], this result indicates that cell-cell interaction
facilitates separation of cells with different deformability.
Fig. 4-9 Time evolution of the lateral positions of two cells of different deformability and
the average x-distance of 70 µm. The initial translational positions for Cells 1 and 2 are x0
= 35 and 105 µm. The diameter and relaxation time of both cells is 14 µm and 0.2 s. The
elasticity of Cells 1 and 2 is 250 Pa and 25 Pa, and their initial lateral positions z0 = 18
µm and 25 µm.

89
4.4 Conclusions
In this computational study, we have investigated the effect of pairwise
interaction of deformable cells on lateral and translational migration in a microchannel.
When two identical cells are located in the bottom or top half of the channel at different
lateral positions and not interacting with other cells, they pass each other or “bounce back”
in the translational direction, eventually reaching the same lateral equilibrium position
and a large separation distance (more than 10 times the cell diameter). The transient
interaction between these cells leads to cell “swapping” in the lateral direction provided
the lateral distance between the cells is small enough. “Swapping” can deleteriously
influence cell separation or enrichment, and our study indicates that there is a threshold
value in the lateral distance of cells entering the channel for this phenomenon to occur.
When the cells become bigger, or when they are located in different halves of the channel,
they keep a close x-distance between each other (3 to 7 times the cell diameter).
When considering a series of identical and periodically spaced cells with close x-
distance, these cells generally undergo damped oscillation in both the lateral and
translational directions until they reach equilibrium positions and become evenly
distributed in the translational direction (self-assembly phenomenon). For a series of cells
with different sizes, bigger cells have the equilibrium position closer to the centerline
than smaller ones. When their x-distance becomes small enough, bigger cells collide with
smaller ones and, as a result, enter the other half of the channel. This indicates that the
efficiency of separation/enrichment of cells with different size can be improved when the
cells are sufficiently close to each other when entering the channel, i.e., when their
migration follows scenario AB. For a series of cells with different deformability, the cell-
90
cell interaction leads to the migration of more deformable cells to the equilibrium
position closer to the centerline, thereby facilitating cell separation. This supports the
hypothesis that leukocytes margination occurs because of the interactions of these cells
with much more deformable red blood cells in the bloodstream.

91
Chapter 5 Active migration of circulating cells in a microchannel
explored by three-dimensional numerical simulation
5.1 Abstract
Circulating cells such as leukocytes can deform and migrate actively toward the
source of chemoattractant. This directed movement of cells, known as chemotaxis, plays
a crucial role in the immune response and cancer metastasis. The cell’s active
deformation and migration are driven by intracellular forces generated by
polymerization/depolymerization of cytoskeletal filaments due to various signaling
pathways. To numerically study these processes, we have implemented the Dembo’s
reactive interpenetrating flow formalism and Herant’s polymerization force model into
the three-dimensional computational algorithm for passive cell deformation. The
resulting computational model takes into account passive mechanical properties of the
cell, extracellular diffusion of chemoattractant molecules, intracellular release and
diffusion of signaling molecules, intracellular active force generation. We have applied
this algorithm to study circulating cell chemotaxis in a rectangular microchannel. The
simulation shows that the active stress near the membrane in the region facing the
chemoattractant source drives the cell to deform and migrate towards the chemoattractant
source, with the formation of a finger-like projection or a large lamellipodium, similar to
those observed in the experiments of chemoattractant-induced migration of motile cells.

92
5.2 Simulation framework
In this study the active migration and shape change of a non-adherent cell (e.g.,
leukocyte or cancer cell) was explored under different conditions in a rectangular
microchannel under static flow. An initially spherical cell is initially located in an
external fluid with the centroid position (xc, yc, zc) = (10, 10, 10) µm and diameter D = 10
µm (Fig. 5-1). No-slip condition with zero velocity on all the channel wall and
inlet/outlet is applied. Boundary values for polymer messenger and chemoattractant is set
zero except the outlet where mc could be non-zero to simulate chemoattractant source.
Fig. 5-1 (a) 3-D sketch of the channel dimensions for active migration. (b) View at the
middle plane y = W/2.

93
The other parameters used in active migration of a cell are chosen from Herant’s
simulation [126] and listed in Table 5-1.
Table 5-1: Parameters used in the simulation of active migration
ρ fluid density (for all phases), 103
kg/m3
µs solvent viscosity, 1 cP
G(0) Giesekus elasticity of cell , 0.5 Pa
λ relaxation time of cell, 0.2 s
σ cortical tension, 3×10⁻⁷
N/m
Dc chemoattractant diffusivity, 10-9
m2/s
Dp polymerization messenger diffusivity, 10-13
m2/s
tp polymerization messenger decay time, 1 s
ep polymerization messenger emissivity rate, 5.0×10⁻⁶
m/s
ϕn0 network baseline fraction, 0.001
tn network decay time, 20 s
Ψ0nM Network-network stress constant, 0.5×10
5 Pa

94
5.3 Results and discussion
Simulation of a finger-like projection
Here, only a small cap of the membrane facing the chemoattractant source was
stimulated with constant polymerization messenger concentration mp = mstimulated and
mass transport of chemoattractant was not considered (Fig. 5-2). In this study mstimulated is
set as 0.08 to get a proper value of active stress, according to Herant’s model and
parameters used here (Table 5-1).
Fig. 5-2 Boundary conditions for polymerization messenger and chemoattractant in the
simulation of a finger-like projection. In this study, mstimulated = 0.08.
z
Bottom x o
Top
mp=mstimulted at a small cap (radius=0.75 µm)
on the membrane
mc=0 at the whole outlet

95
For the case of mstimulated = 0.08, σ = 3×10⁻⁷
N/m (Fig. 5-3), the cell rapidly
extends a small projection and then keeps its elongation with slower velocity. The cross
sectional diameter of the front end of this finger-like projection is constant, nearly equal
to the size of the stimulated membrane region before the extension. These results are
consistent with the simulation of Herant’s work [126] and the experimental observation
[179].
Fig. 5-3 (a-c) 3-D view of cell finger-like projection with time (t = 25ms, 250ms, 475ms);
(d) the view at the middle plane y = W/2 (t = 475ms). mstimulated = 0.08, σ = 3×10⁻⁷
N/m.
(a) (b)
(c) (d)
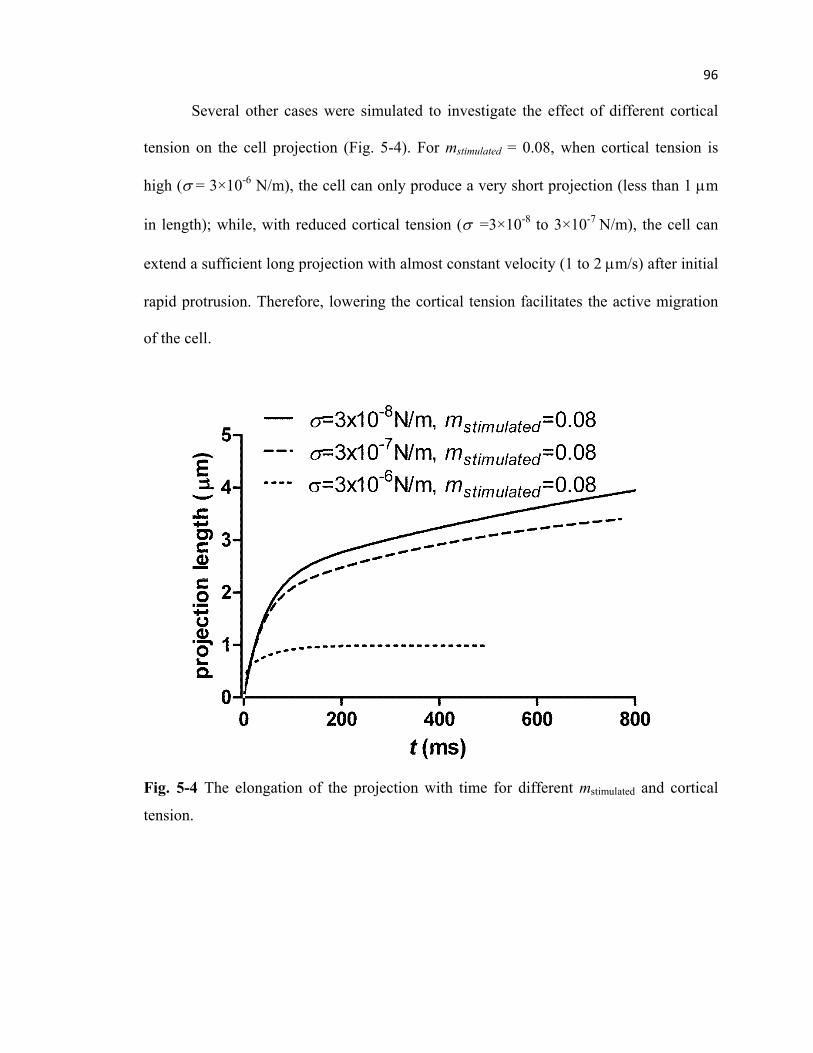
96
Several other cases were simulated to investigate the effect of different cortical
tension on the cell projection (Fig. 5-4). For mstimulated = 0.08, when cortical tension is
high (σ = 3×10⁻⁶
N/m), the cell can only produce a very short projection (less than 1 µm
in length); while, with reduced cortical tension (σ =3×10⁻⁸
to 3×10⁻⁷
N/m), the cell can
extend a sufficient long projection with almost constant velocity (1 to 2 µm/s) after initial
rapid protrusion. Therefore, lowering the cortical tension facilitates the active migration
of the cell.
Fig. 5-4 The elongation of the projection with time for different mstimulated and cortical
tension.
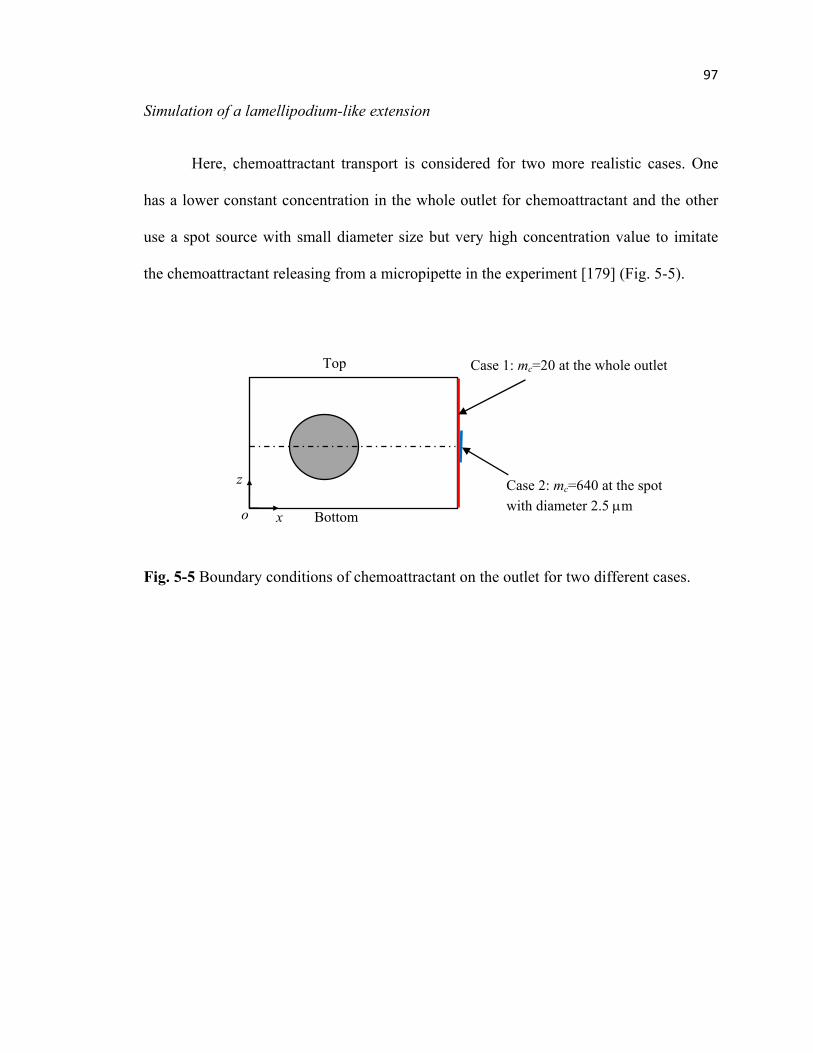
97
Simulation of a lamellipodium-like extension
Here, chemoattractant transport is considered for two more realistic cases. One
has a lower constant concentration in the whole outlet for chemoattractant and the other
use a spot source with small diameter size but very high concentration value to imitate
the chemoattractant releasing from a micropipette in the experiment [179] (Fig. 5-5).
Fig. 5-5 Boundary conditions of chemoattractant on the outlet for two different cases.
z
Bottom x o
Top Case 1: mc=20 at the whole outlet
Case 2: mc=640 at the spot
with diameter 2.5 µm
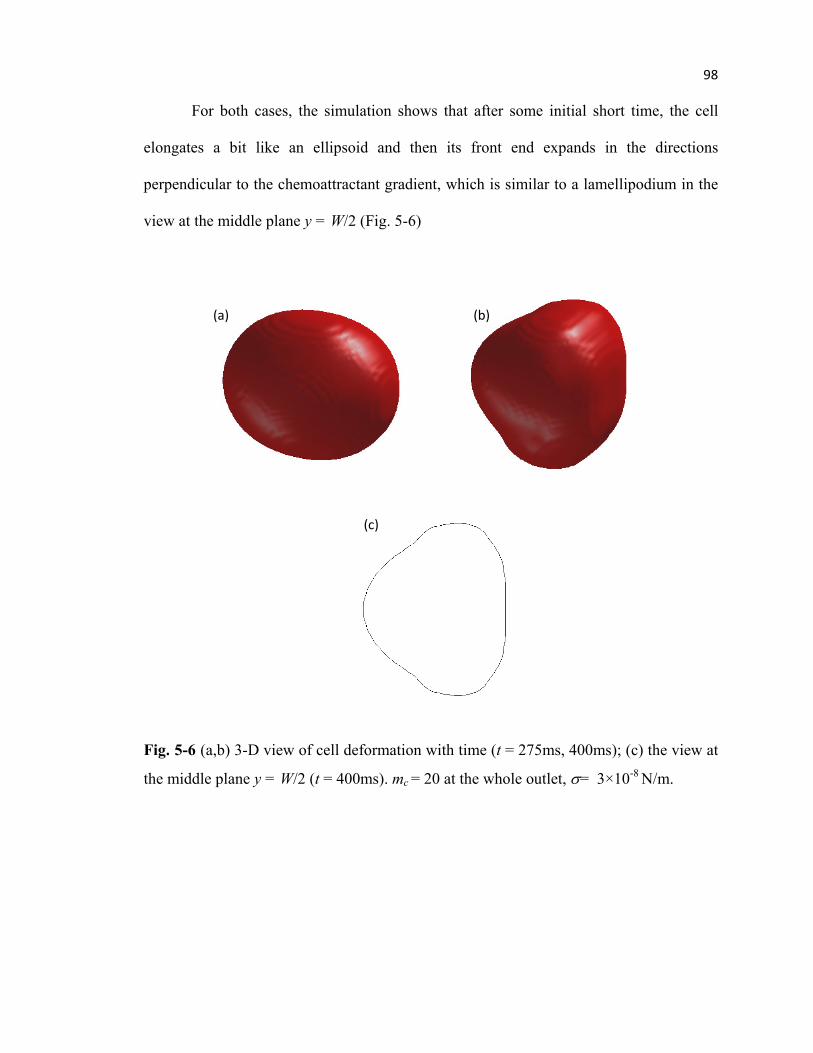
98
For both cases, the simulation shows that after some initial short time, the cell
elongates a bit like an ellipsoid and then its front end expands in the directions
perpendicular to the chemoattractant gradient, which is similar to a lamellipodium in the
view at the middle plane y = W/2 (Fig. 5-6)
Fig. 5-6 (a,b) 3-D view of cell deformation with time (t = 275ms, 400ms); (c) the view at
the middle plane y = W/2 (t = 400ms). mc = 20 at the whole outlet, σ= 3×10⁻⁸
N/m.
(a) (b)
(c)
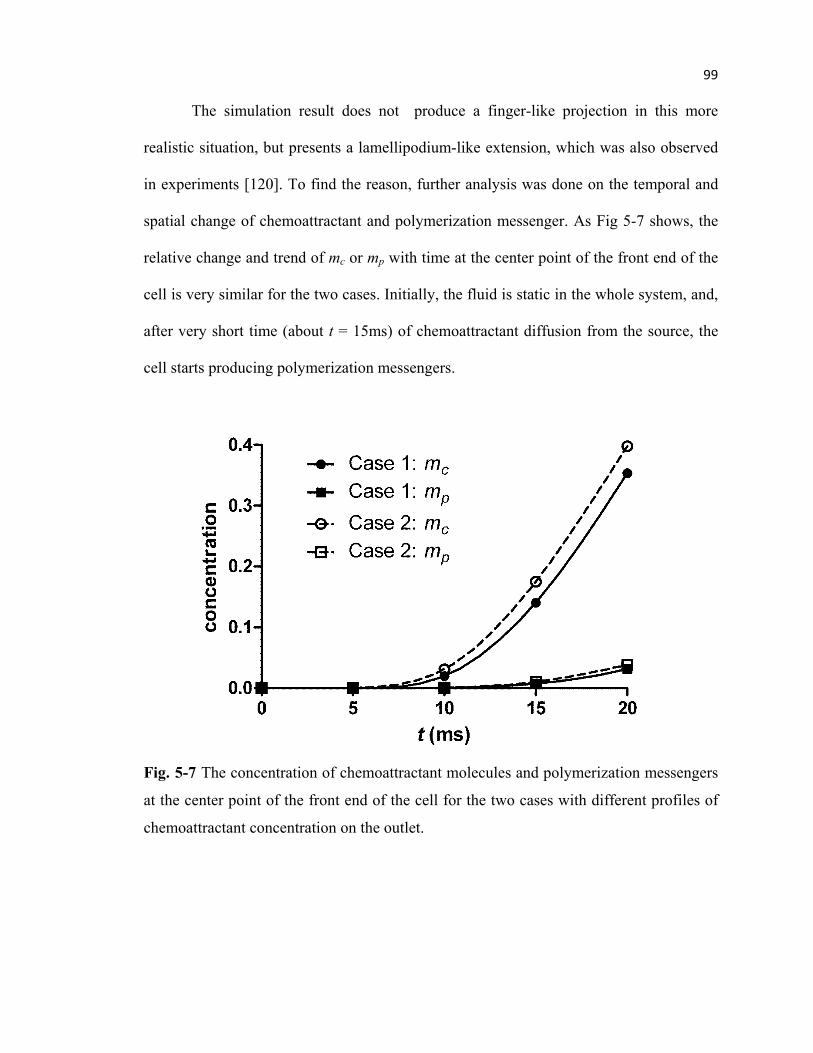
99
The simulation result does not produce a finger-like projection in this more
realistic situation, but presents a lamellipodium-like extension, which was also observed
in experiments [120]. To find the reason, further analysis was done on the temporal and
spatial change of chemoattractant and polymerization messenger. As Fig 5-7 shows, the
relative change and trend of mc or mp with time at the center point of the front end of the
cell is very similar for the two cases. Initially, the fluid is static in the whole system, and,
after very short time (about t = 15ms) of chemoattractant diffusion from the source, the
cell starts producing polymerization messengers.
Fig. 5-7 The concentration of chemoattractant molecules and polymerization messengers
at the center point of the front end of the cell for the two cases with different profiles of
chemoattractant concentration on the outlet.

100
At t = 15ms, what does the cell “see”? The cell can only sense the concentration
of chemoattractant at the region near the membrane. Hence, the spatial distribution of
chemoattractant around the cell membrane was plotted based on the data at the middle
plane y = W/2 for both cases (Fig. 5-8). The distribution is very similar for these two
cases, which indicates that when the distance of the cell front end to the chemoattractant
source is 1.5 times cell diameter, the chemoattractant source profile does not influence
the distribution of chemoattractant on the cell membrane. At the central part of the front
end, the chemoattractant concentration is much higher than that at the other region, and
polymerization messengers have similar distribution because their emissivity linearly
depends on the chemoattractant concentration. Even though it looks like only small
region have very high concentration for mc and mp, a relatively large area about (from -
30º to 30º from the central point) still has mc and mp above 80% of its maximum value
respectively, and the area diameter is equal to the cell radius. Therefore, a large part of
the front end can still migrate towards the chemoattractant source. As the cell move
closer to the source, more area on the front end has higher mc and mp, which finally lead
to a lamellipodium-like extension.

101
Fig. 5-8 The “vision” of the cell on the chemoattractant near the membrane and the
corresponding polymerization messenger at t = 15 ms. 0º is the center point of the front
end, -90º and 90º are the center point of the top end and bottom end, respectively, and
±180 º is the center point of the back end.
102
Based on experimental investigations, during a finger-like projection (pseudopod),
chemoattractant receptors on the cell membrane, such as interleukin 8 receptor alpha and
beta in neutrophils, are dynamically distributed and enriched near the projection region
[180, 181]. More complicatedly, actin dynamics also effect chemoattractant receptor
sensitivity [182]. Hence, the assumptions that receptors are distributed uniformly on the
membrane and the emissivity of polymerization messenger linearly depends on the
chemoattractant concentration near the membrane are not suitable for this situation. A
more realistic model needs to consider the effect of chemoattractant on the receptor
distribution and the sensitivity change of the receptor during migration.
5.4 Conclusions
The computational model for cell active migration has been developed by
introducing the active force term into the established 3-D multiphase viscoelastic fluid
algorithm, based on a simplified representation of signaling pathways during
polymerization, including the chemoattractant transport, polymerization messenger
production, and filament network remodeling.
When only a small region of membrane is stimulated, the model captures a
finger-like projection of the cell, as observed in micropipette experiments of
chemoattractant-induced leukocyte migration. The cortical tension was shown to be an
important factor to cell motility during migration. In a general case of chemotaxis, the
simulation shows the cell moves toward the chemoattractant source with a
lamellipodium-like projection. This demonstrates the assumption of the linear
dependence of polymerization messenger production on the chemoattractant

103
concentration near the membrane is not suitable to describe the cell biological response
resulting in a finger-like projection.

104
Chapter 6 Summary
In this dissertation study, a high-performance parallel three-dimensional
computational algorithm for multiphase viscoelastic fluid dynamics including mass
transport has been developed (Chapter 2). Numerical simulations were conducted on: (1)
passive lateral migration and deformation of a single drop or leukocyte during perfusion
in a rectangular microchannel (Chapter 3), (2) hydrodynamic interactions of passively
migrating cells in a rectangular microchannel (Chapter 4) and (3) active migration of
cells during chemotaxis (Chapter 5).
The simulation work on passive migration shows drops or living cells with
different bulk mechanical properties such as cytoplasmic viscosity and relaxation time
can be separated in a microchannel. It is possible to classify cells with different
mechanical properties by imaging their deformed shape during perfusion through a
microchannel. Cell-cell interaction could facilitate the separation of cells with different
sizes or deformability. These studies support the possibility of using microfluidics for
deformability-based flow cytometry and can give certain suggestion to optimize
microfluidic design for cell separation/enrichment. The exploratory work on the
simulation of active migration of a living cell reproduced some experimental
observations such as a finger-like and lamellipodium-like projection during chemotaxis.
There are some limitations in this study:

105
(1) Only a simple rectangular microchannel was considered, while some novel
microfluidic devices have started to use special channel geometry to improve
effectiveness and efficiency of cell sorting/separation.
(2) Although the viscoelastic drop model can describe the mechanical behavior of
leukocytes during passive migration in the microchannel, it may not suitable
for very deformable cells like red blood cells, which could easily break up if
modeled as a liquid drop.
(3) The simulation of active migration did not consider the effects of cell
adhesion, which is indispensable for various living cells to migrate on 2-D
surface.
(4) Regular structured mesh was used for numerical simulation, which is difficult
to use for geometrically complex computation domains and for tracking the
cell membrane.
For future study, the current code, without significant modification, can be used to
investigate cell deformation during aspiration into a micropipette, cell migration in the
expansion channel, and cell deformation in the cross-flow channel. By including the
adhesion model, the code will be able to simulate cell migration on a vessel wall and
transmigration across the endothelium.

106
References:
[1] G.J. Tortora and B. Derrickson, Principles of Anatomy & Physiology, Wiley, 2012.
[2] K.G. Phillips, A. Kolatkar, K.J. Rees, R. Rigg, D. Marrinucci, M. Luttgen, K. Bethel, P. Kuhn
and O.J. McCarty, Quantification of cellular volume and sub-cellular density fluctuations:
comparison of normal peripheral blood cells and circulating tumor cells identified in a
breast cancer patient, Front. Oncol., 2 (2012), 96.
[3] D.B. Khismatullin, The Cytoskeleton and Deformability of White Blood Cells, in: Current
Topics in Membranes. Vol. 64, K. Ley, edVol. 64, Academic Press, Burlington, 2009, pp.
47 - 111.
[4] H.L. Goldsmith and S. Spain, Margination of leukocytes in blood flow through small
tubes, Microvasc. Res., 27 (1984), 204-222.
[5] M.J. Pearson and H.H. Lipowsky, Influence of erythrocyte aggregation on leukocyte
margination in postcapillary venules of rat mesentery, Am. J. Physiol. Heart Circ. Physiol.,
279 (2000), H1460-1471.
[6] G.W. Schmid-Schonbein, S. Usami, R. Skalak and S. Chien, The interaction of leukocytes
and erythrocytes in capillary and postcapillary vessels, Microvasc. Res., 19 (1980), 45-70.
[7] L.L. Munn, R.J. Melder and R.K. Jain, Role of erythrocytes in leukocyte-endothelial
interactions: mathematical model and experimental validation, Biophysical Journal, 71
(1996), 466-478.
[8] B. Lincoln, H.M. Erickson, S. Schinkinger, F. Wottawah, D. Mitchell, S. Ulvick, C. Bilby and
J. Guck, Deformability-based flow cytometry, Cytom. Part A, 59 (2004), 203-209.
[9] H. Bow, I.V. Pivkin, M. Diez-Silva, S.J. Goldfless, M. Dao, J.C. Niles, S. Suresh and J. Han, A
microfabricated deformability-based flow cytometer with application to malaria, Lab on
a Chip, 11 (2011), 1065-1073.
[10] S.S. Shevkoplyas, T. Yoshida, L.L. Munn and M.W. Bitensky, Biomimetic autoseparation
of leukocytes from whole blood in a microfluidic device, Analytical Chemistry, 77 (2005),
933-937.
[11] H. Mohamed, M. Murray, J.N. Turner and M. Caggana, Isolation of tumor cells using size
and deformation, J. Chromatogr. A, 1216 (2009), 8289-8295.
[12] Z. Wu, B. Willing, J. Bjerketorp, J.K. Jansson and K. Hjort, Soft inertial microfluidics for
high throughput separation of bacteria from human blood cells, Lab on a Chip, 9 (2009),
1193-1199.
[13] R. David, M. Groebner and W.M. Franz, Magnetic cell sorting purification of
differentiated embryonic stem cells stably expressing truncated human CD4 as surface
marker, Stem Cells, 23 (2005), 477-482.
[14] W.C. Tian and E. Finehout, Mirofluidics for Biological Applications, Springer, New York,
2008.
[15] A.A. Bhagat, H. Bow, H.W. Hou, S.J. Tan, J. Han and C.T. Lim, Microfluidics for cell
separation, Med. Biol. Eng. Comput., 48 (2010), 999-1014.
[16] D. Di Carlo, Inertial microfluidics, Lab on a Chip, 9 (2009), 3038-3046.

107
[17] M.G. Lee, S. Choi and J.K. Park, Inertial separation in a contraction-expansion array
microchannel, J. Chromatogr. A, 1218 (2011), 4138-4143.
[18] M. Yamada, M. Nakashima and M. Seki, Pinched flow fractionation: Continuous size
separation of particles utilizing a laminar flow profile in a pinched microchannel,
Analytical Chemistry, 76 (2004), 5465-5471.
[19] H. Maenaka, M. Yamada, M. Yasuda and M. Seki, Continuous and size-dependent
sorting of emulsion droplets using hydrodynamics in pinched microchannels, Langmuir,
24 (2008), 4405-4410.
[20] A.J. Mach and D. Di Carlo, Continuous scalable blood filtration device using inertial
microfluidics, Biotechnol. Bioeng., 107 (2010), 302-311.
[21] S.C. Hur, N.K. Henderson-MacLennan, E.R.B. McCabe and D. Di Carlo, Deformability-
based cell classification and enrichment using inertial microfluidics, Lab on a Chip, 11
(2011), 912-920.
[22] L.L. Munn and M.M. Dupin, Blood cell interactions and segregation in flow, Annals of
Biomedical Engineering, 36 (2008), 534-544.
[23] A. Karnis, H.L. Goldsmith and S.G. Mason, Axial Migration of Particles in Poiseuille Flow,
Nature, 200 (1963), 159-160.
[24] H.W. Hou, Q.S. Li, G.Y. Lee, A.P. Kumar, C.N. Ong and C.T. Lim, Deformability study of
breast cancer cells using microfluidics, Biomed. Microdevices, 11 (2009), 557-564.
[25] H.W. Hou, A.A. Bhagat, A.G. Chong, P. Mao, K.S. Tan, J. Han and C.T. Lim, Deformability
based cell margination--a simple microfluidic design for malaria-infected erythrocyte
separation, Lab on a Chip, 10 (2010), 2605-2613.
[26] B.M. Cooke, N. Mohandas and R.L. Coppel, The malaria-infected red blood cell:
structural and functional changes, Adv. Parasit., 50 (2001), 1-86.
[27] A.T. Skoutelis, V. Kaleridis, G.M. Athanassiou, K.I. Kokkinis, Y.F. Missirlis and H.P. Bassaris,
Neutrophil deformability in patients with sepsis, septic shock, and adult respiratory
distress syndrome, Crit. Care Med., 28 (2000), 2355-2359.
[28] J. Guck, S. Schinkinger, B. Lincoln, F. Wottawah, S. Ebert, M. Romeyke, D. Lenz, H.M.
Erickson, R. Ananthakrishnan, D. Mitchell, J. Kas, S. Ulvick and C. Bilby, Optical
deformability as an inherent cell marker for testing malignant transformation and
metastatic competence, Biophysical Journal, 88 (2005), 3689-3698.
[29] D.R. Gossett, H.T. Tse, S.A. Lee, Y. Ying, A.G. Lindgren, O.O. Yang, J. Rao, A.T. Clark and D.
Di Carlo, Hydrodynamic stretching of single cells for large population mechanical
phenotyping, P Natl Acad Sci USA, 109 (2012), 7630-7635.
[30] G.W. Schmid-Schonbein, K.L. Sung, H. Tozeren, R. Skalak and S. Chien, Passive
mechanical properties of human leukocytes, Biophysical Journal, 36 (1981), 243-256.
[31] E. Evans and A. Yeung, Apparent Viscosity and Cortical Tension of Blood Granulocytes
Determined by Micropipet Aspiration, Biophysical Journal, 56 (1989), 151-160.
[32] R.M. Hochmuth, Micropipette aspiration of living cells, J. Biomech., 33 (2000), 15-22.
[33] A.B. Mathur, A.M. Collinsworth, W.M. Reichert, W.E. Kraus and G.A. Truskey,
Endothelial, cardiac muscle and skeletal muscle exhibit different viscous and elastic
properties as determined by atomic force microscopy, J. Biomech., 34 (2001), 1545-1553.
[34] E.M. Darling, S. Zauscher, J.A. Block and F. Guilak, A thin-layer model for viscoelastic,
stress-relaxation testing of cells using atomic force microscopy: do cell properties reflect
metastatic potential?, Biophysical Journal, 92 (2007), 1784-1791.
[35] W.H. Goldmann, Mechanical manipulation of animal cells: cell indentation, Biotechnol.
Lett., 22 (2000), 431-435.

108
[36] V.M. Laurent, P. Canadas, R. Fodil, E. Planus, A. Asnacios, S. Wendling and D. Isabey,
Tensegrity behaviour of cortical and cytosolic cytoskeletal components in twisted living
adherent cells, Acta Biotheor., 50 (2002), 331-356.
[37] M. Yanai, J.P. Butler, T. Suzuki, H. Sasaki and H. Higuchi, Regional rheological differences
in locomoting neutrophils, Am. J. Physiol. Cell Physiol., 287 (2004), C603-611.
[38] N. Wang and D.E. Ingber, Probing transmembrane mechanical coupling and
cytomechanics using magnetic twisting cytometry, Biochem. Cell Biol., 73 (1995), 327-
335.
[39] B. Fabry, G.N. Maksym, J.P. Butler, M. Glogauer, D. Navajas and J.J. Fredberg, Scaling the
microrheology of living cells, Physical Review Letters, 87 (2001), 148102.
[40] R.J. Petrie, A.D. Doyle and K.M. Yamada, Random versus directionally persistent cell
migration, Nat. Rev. Mol. Cell Biol., 10 (2009), 538-549.
[41] R.R. Kay, P. Langridge, D. Traynor and O. Hoeller, Changing directions in the study of
chemotaxis, Nat. Rev. Mol. Cell Biol., 9 (2008), 455-463.
[42] P. Friedl and B. Weigelin, Interstitial leukocyte migration and immune function, Nat.
Immunol., 9 (2008), 960-969.
[43] M. O'Hayre, C.L. Salanga, T.M. Handel and S.J. Allen, Chemokines and cancer: migration,
intracellular signalling and intercellular communication in the microenvironment,
Biochem. J., 409 (2008), 635-649.
[44] K. Ley, C. Laudanna, M.I. Cybulsky and S. Nourshargh, Getting to the site of inflammation:
the leukocyte adhesion cascade updated, Nat. Rev. Immunol., 7 (2007), 678-689.
[45] G. Giannone, B.J. Dubin-Thaler, O. Rossier, Y. Cai, O. Chaga, G. Jiang, W. Beaver, H.G.
Dobereiner, Y. Freund, G. Borisy and M.P. Sheetz, Lamellipodial actin mechanically links
myosin activity with adhesion-site formation, Cell, 128 (2007), 561-575.
[46] D.V. Zhelev, A.M. Alteraifi and D. Chodniewicz, Controlled pseudopod extension of
human neutrophils stimulated with different chemoattractants, Biophysical Journal, 87
(2004), 688-695.
[47] T. Lammermann, B.L. Bader, S.J. Monkley, T. Worbs, R. Wedlich-Soldner, K. Hirsch, M.
Keller, R. Forster, D.R. Critchley, R. Fassler and M. Sixt, Rapid leukocyte migration by
integrin-independent flowing and squeezing, Nature, 453 (2008), 51-55.
[48] D. Pantaloni, C. Le Clainche and M.F. Carlier, Mechanism of actin-based motility, Science,
292 (2001), 1502-1506.
[49] S. Sukumaran and U. Seifert, Influence of shear flow on vesicles near a wall: A numerical
study, Physical Review E, 64 (2001), 011916.
[50] J. Magnaudet, S. Takagi and D. Legendre, Drag, deformation and lateral migration of a
buoyant drop moving near a wall, Journal of Fluid Mechanics, 476 (2003), 115-157.
[51] M. Abkarian and A. Viallat, Dynamics of vesicles in a wall-bounded shear flow,
Biophysical Journal, 89 (2005), 1055-1066.
[52] B. Kaoui, G.H. Ristow, I. Cantat, C. Misbah and W. Zimmermann, Lateral migration of a
two-dimensional vesicle in unbounded Poiseuille flow, Physical Review E, 77 (2008),
021903.
[53] G. Danker, P.M. Vlahovska and C. Misbah, Vesicles in Poiseuille Flow, Phys Rev Lett, 102
(2009), 148102.
[54] G. Coupier, B. Kaoui, T. Podgorski and C. Misbah, Noninertial lateral migration of vesicles
in bounded Poiseuille flow, Phys. Fluids, 20 (2008), 111702.
[55] L.Y. Zeng, S. Balachandar and P. Fischer, Wall-induced forces on a rigid sphere at finite
Reynolds number, Journal of Fluid Mechanics, 536 (2005), 1-25.

109
[56] H. Lee and S. Balachandar, Drag and lift forces on a spherical particle moving on a wall in
a shear flow at finite Re, Journal of Fluid Mechanics, 657 (2010), 89-125.
[57] J.P. Matas, J.F. Morris and E. Guazzelli, Lateral forces on a sphere, Oil Gas Sci. Technol.,
59 (2004), 59-70.
[58] G. Segre and A. Silberberg, Radial particle displacements in Poiseuille flow of
suspensions, Nature, 189 (1961), 209-210.
[59] J.P. Matas, J.F. Morris and E. Guazzelli, Inertial migration of rigid spherical particles in
Poiseuille flow, Journal of Fluid Mechanics, 515 (2004), 171-195.
[60] W. Hiller and T.A. Kowalewski, An experimental study of the lateral migration of a
droplet in a creeping flow, Exp. Fluids, 5 (1987), 43-48.
[61] S. Guido, Shear-induced droplet deformation: Effects of confined geometry and
viscoelasticity, Curr. Opin. Colloid In., 16 (2011), 61-70.
[62] K.S. Sheth and C. Pozrikidis, Effects of Inertia on the Deformation of Liquid-Drops in
Simple Shear-Flow, Computers & Fluids, 24 (1995), 101-119.
[63] A. Vananroye, P.J.A. Janssen, P.D. Anderson, P. Van Puyvelde and P. Moldenaers,
Microconfined equiviscous droplet deformation: Comparison of experimental and
numerical results, Phys. Fluids, 20 (2008), 013101.
[64] S. Guido and V. Preziosi, Droplet deformation under confined Poiseuille flow, Adv.
Colloid Interfac., 161 (2010), 89-101.
[65] W.L. Olbricht, Pore-scale prototypes of multiphase flow in porous media, Ann. Rev. Fluid
Mech., 28 (1996), 187-213.
[66] H.L. Goldsmith and S.G. Mason, Axial Migration of Particles in Poiseuille Flow, Nature,
190 (1961), 1095-1096.
[67] W.L. Olbricht and D.M. Kung, The Deformation and Breakup of Liquid-Drops in Low
Reynolds-Number Flow through a Capillary, Phys. Fluids A, 4 (1992), 1347-1354.
[68] B.P. Ho and L.G. Leal, The creeping motion of liquid drops through a circular tube of
comparable diameter, Journal of Fluid Mechanics, 71 (1975), 361-383.
[69] P.C.-H. Chan and L.G. Leal, The motion of a deformable drop in a second-order fluid,
Journal of Fluid Mechanics, 92 (1979), 131-170.
[70] L.G. Leal, Particle Motions in a Viscous Fluid, Ann. Rev. Fluid Mech., 12 (1980), 435-476.
[71] A. Nadim and H.A. Stone, The Motion of Small Particles and Droplets in Quadratic Flows,
Stud. Appl. Math., 85 (1991), 53-73.
[72] M.J. Martinez and K.S. Udell, Axisymmetric Creeping Motion of Drops through Circular
Tubes, Journal of Fluid Mechanics, 210 (1990), 565-591.
[73] H. Zhou and C. Pozrikidis, Pressure-Driven Flow of Suspensions of Liquid-Drops, Phys.
Fluids, 6 (1994), 80-94.
[74] C. Coulliette and C. Pozrikidis, Motion of an array of drops through a cylindrical tube,
Journal of Fluid Mechanics, 358 (1998), 1-28.
[75] A.J. Griggs, A.Z. Zinchenko and R.H. Davis, Low-Reynolds-number motion of a
deformable drop between two parallel plane walls, Int. J. Multiphas. Flow, 33 (2007),
182-206.
[76] A. Nourbakhsh and S. Mortazavi, A Three-Dimensional Study of the Motion of a Drop in
Plane Poiseuille Flow at Finite Reynolds Numbers, Iran. J. Sci. Technol. B, 34 (2010), 179-
196.
[77] T. Inamuro and Y. Kataoka, Numerical simulations of the behaviour of a drop in a square
pipe flow using the two-phase lattice Boltzmann method, Phil. Trans. R. Soc. A, 369
(2011), 2528-2536.

110
[78] D.B. Khismatullin, Y. Renardy and V. Cristini, Inertia-induced breakup of highly viscous
drops subjected to simple shear, Phys. Fluids, 15 (2003), 1351-1354.
[79] P. W.K., S. D., G.H. Orians and C.H. H., Life: The Science of Biology, Sinauer Associates,
Sunderland, 2004.
[80] H. Schmidschonbein, G.V.R. Born, P.D. Richardson, N. Cusack, H. Rieger, R. Forst, I.
Rohlingwinkel, P. Blasberg and A. Wehmeyer, Rheology of Thrombotic Processes in Flow
- the Interaction of Erythrocytes and Thrombocytes Subjected to High Flow Forces,
Biorheology, 18 (1981), 415-444.
[81] D.A. Fedosov, J. Fornleitner and G. Gompper, Margination of white blood cells in
microcapillary flow, Phys Rev Lett, 108 (2012), 028104.
[82] D.A. Fedosov, H. Noguchi and G. Gompper, Multiscale modeling of blood flow: from
single cells to blood rheology, Biomech Model Mechanobiol (2013).
[83] R. Fahraeus, The suspenstion stability of the blood, 9 (1929), 241-274.
[84] R. Zhao, M.V. Kameneva and J.F. Antaki, Investigation of platelet margination
phenomena at elevated shear stress, Biorheology, 44 (2007), 161-177.
[85] M.M. Dupin, I. Halliday, C.M. Care, L. Alboul and L.L. Munn, Modeling the flow of dense
suspensions of deformable particles in three dimensions, Physical Review E, 75 (2007),
066707.
[86] C. Sun, C. Migliorini and L.L. Munn, Red blood cells initiate leukocyte rolling in
postcapillary expansions: a lattice Boltzmann analysis, Biophysical Journal, 85 (2003),
208-222.
[87] T.W. Pan, L.L. Shi and R. Glowinski, A DLM/FD/IB method for simulating cell/cell and
cell/particle interaction in microchannels, Chinese Ann Math B, 31 (2010), 975-990.
[88] W. Lee, H. Amini, H.A. Stone and D. Di Carlo, Dynamic self-assembly and control of
microfluidic particle crystals, P Natl Acad Sci USA, 107 (2010), 22413-22418.
[89] R. Tewhey, J.B. Warner, M. Nakano, B. Libby, M. Medkova, P.H. David, S.K. Kotsopoulos,
M.L. Samuels, J.B. Hutchison, J.W. Larson, E.J. Topol, M.P. Weiner, O. Harismendy, J.
Olson, D.R. Link and K.A. Frazer, Microdroplet-based PCR enrichment for large-scale
targeted sequencing, Nat. Biotechnol., 27 (2009), 1025-1031.
[90] Y.C. Tan and A.P. Lee, Microfluidic separation of satellite droplets as the basis of a
monodispersed micron and submicron emulsification system, Lab on a Chip, 5 (2005),
1178-1183.
[91] M.J. Fuerstman, P. Garstecki and G.M. Whitesides, Coding/decoding and reversibility of
droplet trains in microfluidic networks, Science, 315 (2007), 828-832.
[92] J. Oakey, R.W. Applegate, E. Arellano, D. Di Carlo, S.W. Graves and M. Toner, Particle
Focusing in Staged Inertial Microfluidic Devices for Flow Cytometry, Analytical Chemistry,
82 (2010), 3862-3867.
[93] N. Pamme, Continuous flow separations in microfluidic devices, Lab on a Chip, 7 (2007),
1644-1659.
[94] D. Di Carlo, D. Irimia, R.G. Tompkins and M. Toner, Continuous inertial focusing,
ordering, and separation of particles in microchannels, P Natl Acad Sci USA, 104 (2007),
18892-18897.
[95] S.C. Hur, H.T.K. Tse and D. Di Carlo, Sheathless inertial cell ordering for extreme
throughput flow cytometry, Lab on a Chip, 10 (2010), 274-280.
[96] K.J. Humphry, P.M. Kulkarni, D.A. Weitz, J.F. Morris and H.A. Stone, Axial and lateral
particle ordering in finite Reynolds number channel flows, Phys. Fluids, 22 (2010).

111
[97] M. Zurita-Gotor, J. Blawzdziewicz and E. Wajnryb, Swapping trajectories: A new wall-
induced cross-streamline particle migration mechanism in a dilute suspension of
spheres, Journal of Fluid Mechanics, 592 (2007), 447-469.
[98] P.M. Kulkarni and J.F. Morris, Pair-sphere trajectories in finite-Reynolds-number shear
flow, Journal of Fluid Mechanics, 596 (2008), 413-435.
[99] C. Migliorini, Y. Qian, H. Chen, E.B. Brown, R.K. Jain and L.L. Munn, Red blood cells
augment leukocyte rolling in a virtual blood vessel, Biophys J, 83 (2002), 1834-1841.
[100] D.R. Subramaniam, D.J. Gee and M.R. King, Deformable cell-cell and cell-substrate
interactions in semi-infinite domain, J. Biomech., 46 (2013), 1067-1074.
[101] S. Jadhav, Y.C. Kit, K. Konstantopoulos and C.D. Eggleton, Shear modulation of
intercellular contact area between two deformable cells colliding under flow, J.
Biomech., 40 (2007), 2891-2897.
[102] M. Loewenberg and E.J. Hinch, Collision of two deformable drops in shear flow, Journal
of Fluid Mechanics, 338 (1997), 299-315.
[103] J.C. Firrell and H.H. Lipowsky, Leukocyte margination and deformation in mesenteric
venules of rat, Am J Physiol, 256 (1989), H1667-1674.
[104] M.T. Quinn, F.R. DeLeo and G.M. Bokoch, Neutrophil methods and protocols. Preface,
Methods Mol. Biol., 412 (2007), vii-viii.
[105] C. Dong, J. Cao, E.J. Struble and H.H. Lipowsky, Mechanics of leukocyte deformation and
adhesion to endothelium in shear flow, Ann Biomed Eng, 27 (1999), 298-312.
[106] R.M. Hochmuth, H.P. Ting-Beall, B.B. Beaty, D. Needham and R. Tran-Son-Tay, Viscosity
of passive human neutrophils undergoing small deformations, Biophysical Journal, 64
(1993), 1596-1601.
[107] J.Y. Shao, H.P. Ting-Beall and R.M. Hochmuth, Static and dynamic lengths of neutrophil
microvilli, Proc Natl Acad Sci U S A, 95 (1998), 6797-6802.
[108] D. Needham and R.M. Hochmuth, Rapid flow of passive neutrophils into a 4 microns
pipet and measurement of cytoplasmic viscosity, J Biomech Eng, 112 (1990), 269-276.
[109] M.A. Tsai, R.S. Frank and R.E. Waugh, Passive mechanical behavior of human neutrophils:
power-law fluid, Biophysical Journal, 65 (1993), 2078-2088.
[110] M. Bathe, A. Shirai, C.M. Doerschuk and R.D. Kamm, Neutrophil transit times through
pulmonary capillaries: the effects of capillary geometry and fMLP-stimulation, Biophys J,
83 (2002), 1917-1933.
[111] C. Dong, R. Skalak, K.L. Sung, G.W. Schmid-Schonbein and S. Chien, Passive deformation
analysis of human leukocytes, J. Biomech. Eng., 110 (1988), 27-36.
[112] D.B. Khismatullin and G.A. Truskey, Three-dimensional numerical simulation of receptor-
mediated leukocyte adhesion to surfaces: Effects of cell deformability and viscoelasticity,
Phys. Fluids, 17 (2005), 031505.
[113] T.W. Secomb, B. Styp-Rekowska and A.R. Pries, Two-dimensional simulation of red blood
cell deformation and lateral migration in microvessels, Annals of Biomedical Engineering,
35 (2007), 755-765.
[114] H. Li and G. Ma, Modeling performance of a two-dimensional capsule in a microchannel
flow: Long-term lateral migration, Physical Review E, 82 (2010), 026304.
[115] A.P. Curnock, M.K. Logan and S.G. Ward, Chemokine signalling: pivoting around multiple
phosphoinositide 3-kinases, Immunology, 105 (2002), 125-136.
[116] A. Makino, M. Glogauer, G.M. Bokoch, S. Chien and G.W. Schmid-Schonbein, Control of
neutrophil pseudopods by fluid shear: role of Rho family GTPases, Am. J. Physiol. Cell
Physiol., 288 (2005), C863-871.

112
[117] N.C. Kaneider, P. Egger, F.J. Wiedermann, M. Ritter, E. Woll and C.J. Wiedermann,
Involvement of cyclic adenosine monophosphate-dependent protein kinase A and
pertussis toxin-sensitive G proteins in the migratory response of human CD14+
mononuclear cells to katacalcin, J. Bone Miner. Res., 17 (2002), 1872-1882.
[118] H.N. Higgs and T.D. Pollard, Activation by Cdc42 and PIP(2) of Wiskott-Aldrich syndrome
protein (WASp) stimulates actin nucleation by Arp2/3 complex, J. Cell Biol., 150 (2000),
1311-1320.
[119] T.D. Pollard, L. Blanchoin and R.D. Mullins, Molecular mechanisms controlling actin
filament dynamics in nonmuscle cells, Annu. Rev. Biophys. Biomol. Struct., 29 (2000),
545-576.
[120] D.V. Zhelev and A. Alteraifi, Signaling in the motility responses of the human neutrophil,
Ann Biomed Eng, 30 (2002), 356-370.
[121] R.J. Eddy, L.M. Pierini and F.R. Maxfield, Microtubule asymmetry during neutrophil
polarization and migration, Mol. Biol. Cell., 13 (2002), 4470-4483.
[122] L.A. Lowery and D. Van Vactor, The trip of the tip: understanding the growth cone
machinery, Nat Rev Mol Cell Biol, 10 (2009), 332-343.
[123] V. Niggli, Signaling to migration in neutrophils: importance of localized pathways, Int. J.
Biochem. Cell Biol., 35 (2003), 1619-1638.
[124] L.M. Machesky, R.D. Mullins, H.N. Higgs, D.A. Kaiser, L. Blanchoin, R.C. May, M.E. Hall
and T.D. Pollard, Scar, a WASp-related protein, activates nucleation of actin filaments by
the Arp2/3 complex, Proc Natl Acad Sci U S A, 96 (1999), 3739-3744.
[125] M. Dembo and F. Harlow, Cell motion, contractile networks, and the physics of
interpenetrating reactive flow, Biophysical Journal, 50 (1986), 109-121.
[126] M. Herant, W.A. Marganski and M. Dembo, The mechanics of neutrophils: synthetic
modeling of three experiments, Biophysical Journal, 84 (2003), 3389-3413.
[127] C.S. Peskin, G.M. Odell and G.F. Oster, Cellular motions and thermal fluctuations: the
Brownian ratchet, Biophysical Journal, 65 (1993), 316-324.
[128] P.A. Dufort and C.J. Lumsden, How profilin/barbed-end synergy controls actin
polymerization: a kinetic model of the ATP hydrolysis circuit, Cell Motil. Cytoskel., 35
(1996), 309-330.
[129] A.E. Carlsson, Growth of branched actin networks against obstacles, Biophysical Journal,
81 (2001), 1907-1923.
[130] R.B. Dickinson, L. Caro and D.L. Purich, Force generation by cytoskeletal filament end-
tracking proteins, Biophysical Journal, 87 (2004), 2838-2854.
[131] K. Ley, Integration of inflammatory signals by rolling neutrophils, Immunol. Rev., 186
(2002), 8-18.
[132] M. Dembo, D.C. Torney, K. Saxman and D. Hammer, The reaction-limited kinetics of
membrane-to-surface adhesion and detachment, P. R. Soc. Lond. B Bio., 234 (1988), 55-
83.
[133] C. Zhou, P. Yue and J.J. Feng, Simulation of neutrophil deformation and transport in
capillaries using newtonian and viscoelastic drop models, Annals of Biomedical
Engineering, 35 (2007), 766-780.
[134] Q. Jin, C. Verdier, P. Singh, N. Aubry, R. Chotard-Ghodsnia and A. Duperray, Migration
and deformation of leukocytes in pressure driven flows, Mech. Res. Commun., 34 (2007),
411-422.

113
[135] H. Giesekus, A Unified Approach to a Variety of Constitutive Models for Polymer Fluids
Based on the Concept of Configuration-Dependent Molecular Mobility, Rheol Acta, 21
(1982), 366-375.
[136] D.B. Khismatullin and G.A. Truskey, A 3D numerical study of the effect of channel height
on leukocyte deformation and adhesion in parallel-plate flow chambers, Microvasc. Res.,
68 (2004), 188-202.
[137] D.B. Khismatullin and G.A. Truskey, Leukocyte rolling on P-selectin: A 3D numerical study
of the effect of cytoplasmic viscosity, Biophysical Journal, 102 (2012), 1757-1766
[138] D. Khismatullin, Y. Renardy and M. Renardy, Development and implementation of VOF-
PROST for 3D viscoelastic liquid-liquid simulations, J Non-Newton Fluid, 140 (2006), 120-
131.
[139] N. Aggarwal and K. Sarkar, Deformation and breakup of a viscoelastic drop in a
Newtonian matrix under steady shear, Journal of Fluid Mechanics, 584 (2007), 1-21.
[140] S.B. Pillapakkam and P. Singh, A level-set method for computing solutions to viscoelastic
two-phase flow, Journal of Computational Physics, 174 (2001), 552-578.
[141] R.W. Hooper, V.F. de Almeida, C.W. Macosko and J.J. Derby, Transient polymeric drop
extension and retraction in uniaxial extensional flows, J Non-Newton Fluid, 98 (2001),
141-168.
[142] P.T. Yue, J.J. Feng, C. Liu and J. Shen, Viscoelastic effects on drop deformation in steady
shear, Journal of Fluid Mechanics, 540 (2005), 427-437.
[143] G. D'Avino, T. Tuccillo, P.L. Maffettone, F. Greco and M.A. Hulsen, Numerical simulations
of particle migration in a viscoelastic fluid subjected to shear flow, Computers & Fluids,
39 (2010), 709-721.
[144] R. Tran-Son-Tay, D. Needham, A. Yeung and R.M. Hochmuth, Time-dependent recovery
of passive neutrophils after large deformation, Biophysical Journal, 60 (1991), 856-866.
[145] J. Li, Y.Y. Renardy and M. Renardy, A numerical study of periodic disturbances on two-
layer Couette flaw, Phys. Fluids, 10 (1998), 3056-3071.
[146] D. Gueyffier, J. Li, A. Nadim, R. Scardovelli and S. Zaleski, Volume-of-fluid interface
tracking with smoothed surface stress methods for three-dimensional flows, Journal of
Computational Physics, 152 (1999), 423-456.
[147] M. Meier, G. Yadigaroglu and B.L. Smith, A novel technique for including surface tension
in PLIC-VOF methods, Eur J Mech B-Fluid, 21 (2002), 61-73.
[148] J.M. Martinez, X. Chesneau and B. Zeghmati, A new curvature technique calculation for
surface tension contribution in PLIC-VOF method, Comput Mech, 37 (2006), 182-193.
[149] Y. Renardy and M. Renardy, PROST: A parabolic reconstruction of surface tension for the
volume-of-fluid method, Journal of Computational Physics, 183 (2002), 400-421.
[150] J.U. Brackbill, D.B. Kothe and C. Zemach, A Continuum Method for Modeling Surface-
Tension, Journal of Computational Physics, 100 (1992), 335-354.
[151] J. Lopez, C. Zanzi, P. Gomez, R. Zamora, F. Faura and J. Hernandez, An improved height
function technique for computing interface curvature from volume fractions, Comput
Method Appl M, 198 (2009), 2555-2564.
[152] C.W. Hirt and B.D. Nichols, Volume of fluid (VOF) for the dynamics of free boundaries,
Journal of Computational Physics, 39 (1981), 201-225.
[153] D.L. Youngs, Time-dependent multi-material flow with large fluid distortion, in:
Numerical Methods for Fluid Dynamics, Academic, New York, 1982, p. 27.
[154] R.W. Yeung, Numerical-Methods in Free-Surface Flows, Ann. Rev. Fluid Mech., 14 (1982),
395-442.

114
[155] S.O. Unverdi and G. Tryggvason, A Front-Tracking Method for Viscous, Incompressible,
Multi-Fluid Flows, Journal of Computational Physics, 100 (1992), 25-37.
[156] J. Lowengrub and L. Truskinovsky, Quasi-incompressible Cahn-Hilliard fluids and
topological transitions, P. Roy. Soc. Lond. A Mat., 454 (1998), 2617-2654.
[157] J.A. Sethian and P. Smereka, Level set methods for fluid interfaces, Ann. Rev. Fluid Mech.,
35 (2003), 341-372.
[158] D. Jacqmin, Calculation of two-phase Navier-Stokes flows using phase-field modeling,
Journal of Computational Physics, 155 (1999), 96-127.
[159] Y. Sun and C. Beckermann, Sharp interface tracking using the phase-field equation,
Journal of Computational Physics, 220 (2007), 626-653.
[160] L.G. Loitsyanskii, Mechanics of Liquids and Gases, Elsevier, Burlington, 1966.
[161] V.A. Vaclavik and E.W. Christian, Essentials of Food Science, Springer, New York, 2008.
[162] R.L. Gordon and E. Mastorakos, Autoignition of monodisperse biodiesel and diesel
sprays in turbulent flows, Experimental Thermal and Fluid Science (2012), (in press).
[163] I. Cantat and C. Misbah, Lift force and dynamical unbinding of adhering vesicles under
shear flow, Physical Review Letters, 83 (1999), 880-883.
[164] S. Mortazavi and G. Tryggvason, A numerical study of the motion of drops in Poiseuille
flow. Part 1. Lateral migration of one drop, Journal of Fluid Mechanics, 411 (2000), 325-
350.
[165] G. Ghigliotti, T. Biben and C. Misbah, Rheology of a dilute two-dimensional suspension
of vesicles, Journal of Fluid Mechanics, 653 (2010), 489-518.
[166] P. Olla, The lift on a tank-treading ellipsoidal cell in a shear flow, Journal de Physique II, 7
(1997), 1533-1540.
[167] S. Messlinger, B. Schmidt, H. Noguchi and G. Gompper, Dynamical regimes and
hydrodynamic lift of viscous vesicles under shear, Physical Review E, 80 (2009), 011901.
[168] J.L. Drury and M. Dembo, Aspiration of human neutrophils: effects of shear thinning and
cortical dissipation, Biophysical Journal, 81 (2001), 3166-3177.
[169] N.A. N'Dri, W. Shyy and R. Tran-Son-Tay, Computational modeling of cell adhesion and
movement using a continuum-kinetics approach, Biophysical Journal, 85 (2003), 2273-
2286.
[170] E. Evans and B. Kukan, Passive material behavior of granulocytes based on large
deformation and recovery after deformation tests, Blood, 64 (1984), 1028-1035.
[171] A. Yeung and E. Evans, Cortical shell-liquid core model for passive flow of liquid-like
spherical cells into micropipets, Biophysical Journal, 56 (1989), 139-149.
[172] F. Geissmann, S. Jung and D.R. Littman, Blood monocytes consist of two principal
subsets with distinct migratory properties, Immunity, 19 (2003), 71-82.
[173] W. Erl, C. Weber, C. Wardemann and P.C. Weber, Adhesion properties of Mono Mac 6, a
monocytic cell line with characteristics of mature human monocytes, Atherosclerosis,
113 (1995), 99-107.
[174] D. Needham and R.M. Hochmuth, Rapid flow of passive neutrophils into a 4 microns
pipet and measurement of cytoplasmic viscosity, J. Biomech. Eng., 112 (1990), 269-276.
[175] A. Ramachandran and G. Leal, A scaling theory for the hydrodynamic interaction
between a pair of vesicles or capsules, Phys. Fluids, 22 (2010), 091702.
[176] H. Yang, C.C. Park, Y.T. Hu and L.G. Leal, The coalescence of two equal-sized drops in a
two-dimensional linear flow, Phys. Fluids, 13 (2001), 1087-1106.
[177] D.B. Khismatullin and A. Nadim, Shape oscillations of a viscoelastic drop, Physical Review
E, 63 (2001), 061508.

115
[178] H.Z. Lan and D.B. Khismatullin, A numerical study of the lateral migration and
deformation of drops and leukocytes in a rectangular microchannel, Int J Multiphas Flow,
47 (2012), 73-84.
[179] D.V. Zhelev, A.M. Alteraifi and R.M. Hochmuth, F-actin network formation in tethers and
in pseudopods stimulated by chemoattractant, Cell Motil Cytoskeleton, 35 (1996), 331-
344.
[180] Z. Xiao, N. Zhang, D.B. Murphy and P.N. Devreotes, Dynamic distribution of
chemoattractant receptors in living cells during chemotaxis and persistent stimulation, J
Cell Biol, 139 (1997), 365-374.
[181] V.M. Loitto, B. Rasmusson and K.E. Magnusson, Assessment of neutrophil N-formyl
peptide receptors by using antibodies and fluorescent peptides, J Leukoc Biol, 69 (2001),
762-771.
[182] S.N. Dandekar, J.S. Park, G.E. Peng, J.J. Onuffer, W.A. Lim and O.D. Weiner, Actin
dynamics rapidly reset chemoattractant receptor sensitivity following adaptation in
neutrophils, Philos Trans R Soc Lond B Biol Sci, 368 (2013), 20130008.
116
Biography
I was born in Qingzhen, a small city in the southwest of China. I received my
bachelor degree in science in 1999 and master degree in science in 2002 in Mechanical
Engineering from Tsinghua University in Beijing, China. During the study in Tsinghua
University, I obtained broad background on mathematics, mechanics, electronics,
mechanical design, materials processing, computer programming. After two years of
work in industry for software development, I decided to continue my academic study and
research in US. I was admitted by Tulane University to the PhD program in Mechanical
Engineering to study solid mechanics on micro-indentation of alloys and piezoelectric
materials. Unfortunately, the program was cut later in the aftermath of Hurricane Katrina.
Luckily, after I received a master degree in science in Mechanical Engineering, I had a
chance to switch to Biomedical Engineering in 2007 to study biotransport in complex
networks of bone cells. My current research is focused on numerical computation of
passive and active migration of living cells in a microfluidic channel, using three-
dimensional algorithms for multiphase viscoelastic fluid dynamics and mass transport. I
would like to carry on my career in the field of biomedical engineering, with strong
interest on computational and experimental research on cell migration and deformation
related to microfluidic applications.