land degradation and improvement in cuba 1. … · and resource conservation. to meet this need,...
TRANSCRIPT

GLADA Report 1b Version August 2008
Land Degradation and Improvement
in Cuba
1. Identification by remote sensing
Z G Bai D L Dent
FOOD AND AGRICULTURE ORGANIZATION OF THE UNITED NATIONS

This report has been prepared under the conditions laid down in the Letter of Agreement FAO-ISRIC PR 35852. Correct citation: Bai ZG and Dent DL 2007. Land degradation and improvement in Cuba. 1. Identification by remote sensing. Report 2007/04, ISRIC – World Soil Information, Wageningen Inquiries: c/o Director, ISRIC – World Soil Information PO Box 353 6700 AJ Wageningen The Netherlands Telefax: +31-(0)317-471700 E-mail: [email protected] Web: www.isric.org

Land Degradation and Improvement in Cuba i
MAIN POINTS
1. Land degradation is a global environment and development issue. Up-to-date, quantitative information is needed to support policy and action for food and water security, economic development, environmental integrity and resource conservation. To meet this need, the Global Assessment of Land Degradation and Improvement uses remote sensing to identify degraded areas and areas where degradation has been arrested or reversed. This screening will be followed up in the LADA partner countries by field investigations to establish the situation on the ground.
2. Land degradation and improvement is inferred from long-term trends of productivity when other factors that may be responsible (climate, soil, terrain and land use) are accounted for. The remotely-sensed normalized difference vegetation index (NDVI) or greenness index is used as a proxy indicator of productivity; it may be translated to net primary productivity (NPP). Spatial patterns and temporal trends of NDVI combined with climatic indices are analysed for the period 1981-2003 at 8km resolution; land degradation is indicated by a declining trend of climate-adjusted NDVI and land improvement by an increasing trend.
3. In Cuba, over the period of 1981-2003, net primary productivity
increased overall. Areas of decreasing climate-adjusted NPP occupy 29 per cent of the country, notably in the south-east. Over the 23 years, degrading areas, so defined, suffered an average loss of net primary production of 10 kgC/ha-1 year-1.
4. 69 per cent of the degrading area is cropland – almost 30 per cent
of the cultivated area – mostly in the drier south east of the country.
5. About 3.2 million people - 28 per cent of the population - depend directly on these degrading areas. The correlation between land degradation and log population density is positive: te he higher the population density, the more severe the degradation.
6. Land improvement, defined by an increase in climate-adjusted net
primary productivity, is identified across just over one per cent of the country. Sixty per cent of the improving area is cropland – about 1 per cent of the cultivated area.
Key words: land degradation/improvement, remote sensing, NDVI, rain-use efficiency, net primary productivity, land use/cover, Cuba
ISRIC Report 2007/04

ii Land Degradation and Improvement in Cuba
Contents
MAIN POINTS ..............................................................................................i Abbreviations ............................................................................................iv 1 Introduction........................................................................................ 1 2 Context and methods .......................................................................... 2
2.1 LADA partner country: Cuba ........................................................... 2 2.2 Data............................................................................................ 2
2.2.1 NDVI and net primary productivity.......................................... 2 2.2.2 Climatic data ....................................................................... 2 2.2.3 Soil and terrain.................................................................... 3 2.2.4 Land cover and land use ....................................................... 3 2.2.5 Population, urban areas and poverty indices ............................ 4 2.2.6 Aridity index........................................................................ 4
2.3 Analysis ....................................................................................... 4 3 Results ................................................................................................ 7
3.1 Trends in biomass productivity ........................................................ 7 3.2 Spatial patterns of biomass and rainfall ............................................ 9 3.3 Rain-use efficiency .......................................................................11 3.4 RESTREND ..................................................................................14 3.5 Net primary productivity................................................................16 3.6 Land degradation .........................................................................18 3.7 Land improvement .......................................................................19 3.8 Urban areas.................................................................................21 3.9 Comparison of indicators ...............................................................21 3.10 Analysis of degrading and improving areas.......................................22
3.10.1 Association with land cover and land use ................................22 3.10.2 Association with population density........................................27 3.10.3 Relationship with aridity .......................................................28 3.10.4 Relationship with poverty .....................................................28 3.10.5 Relationship with soils and terrain .........................................28
4 What GLADA can and cannot do .........................................................31 5 Conclusions ........................................................................................33 Acknowledgements ..................................................................................34 References................................................................................................35
ISRIC Report 2007/04

Land Degradation and Improvement in Cuba iii
Appendix 1: Analytical methods ...........................................................39 Appendix 2: NDVI indicators of land degradation and improvement ....41 Figures
Figure 1. Main land cover types................................................................... 3 Figure 2. Spatially aggregated annual sum NDVI 1981-2003, p<0.001 ............. 7 Figure 3. Annual sum NDVI 1981-2003 ........................................................ 8 Figure 4. Spatially aggregated annual rainfall 1981-2003............................... 9 Figure 5. Annual rainfall 1981-2003...........................................................10 Figure 6. Relationship between annual sum NDVI (all pixels) and annual rainfall
(all pixels) .................................................................................11 Figure 7. Rain-use efficiency 1981-2003: spatial pattern (a) and temporal trend
(b – percentage changes, c – absolute changes, confidence d) ..........13 Figure 8. Residual trend of sum NDVI (RESTREND) 1981-2003 .......................15 Figure 9. Net primary productivity: mean (a), trends (b, % change; c, absolute
change); confidence level (d) .......................................................17 Figure 10. Negative trend in RUE-adjusted annual sum NDVI, 1981-2003 ..........18 Figure 11. NPP loss in the degrading areas 1981-2003 ....................................19 Figure 12. Areas of increasing NPP, RUE and EUE, 1981-2003 ..........................20 Figure 13. Confidence levels of positive climate-adjusted NDVI, 1981-2003........20 Figure 14. Population counts affected by the land degradation..........................27 Figure 15. Relationship between population density and land degradation/
improvement..............................................................................27 Figure 16. Soil and terrain attributes for dominant soil types............................29 Figure 17. Total soil organic carbon in degrading areas....................................30 Tables
Table 1. Changes in net primary productivity 1981-2003 ..............................16 Table 2. Cuba and World: NPP loss in degrading land between 1981 and 2003.18 Table 3. Comparison of trends in various indicators......................................22 Table 4. Degrading and improving land by land cover...................................23 Table 5. Degrading and improving areas by land use systems (FAO 2008).......24 Table 6. Degrading/improving lands in the aggregated land use systems ........26 Table 7. Degrading areas in different landforms...........................................28 Table 8. Total soil organic carbon in degrading areas....................................30
ISRIC Report 2007/04

iv Land Degradation and Improvement in Cuba
Abbreviations
CIESIN Center for International Earth Science Information Network, Colombia University, Palisades, NY
CoV Coefficient of Variation CRU TS Climate Research Unit, University of East Anglia, Time Series
ENSO El Niño/Southern Oscillation
FAO Food and Agriculture Organization of the United Nations, Rome
GIMMS The Global Inventory Modelling and Mapping Studies, University of Maryland
GLADA Global Assessment of Land Degradation and Improvement
JRC Joint Research Centre, European Commission, Ispra, Italy
LADA Land Degradation Assessment in Drylands
Landsat ETM+ Land Resources Satellite, Enhanced Thematic Mapper
LUS Land Use Systems, FAO
MOD17A3 MODIS 8-Day Net Primary Productivity dataset
MODIS Moderate Resolution Imaging Spectroradiometer
NDVI Normalized Difference Vegetation Index NPP Net Primary Productivity RESTREND Residual Trend of sum NDVI
RUE Rain-Use Efficiency SOTER Soil and Terrain database
SPOT Système Pour l’Observation de la Terre
SRTM Shuttle Radar Topography Mission
UNCED United Nations Conference on Environment and Development
UNEP United Nations Environment Programme, Nairobi, Kenya
VASClimO Variability Analyses of Surface Climate Observations
ISRIC Report 2007/04

Land Degradation and Improvement in Cuba 1
1 Introduction
Economic development, burgeoning cities and growing rural populations are driving unprecedented land-use change. In turn, unsustainable land use is driving land degradation: a long-term loss in ecosystem function and productivity that requires progressively greater inputs to repair the situation. Its symptoms include soil erosion, nutrient depletion, salinity, water scarcity, pollution, disruption of biological cycles, and loss of biodiversity. This is a global development and environment issue - recognised by the UN Convention to Combat Desertification, the Conventions on Biodiversity and Climatic Change, and Millennium Goals (UNCED 1992, UNEP 2007). Quantitative, up-to-date information is needed to support policies for food and water security, economic development and the environment. The only harmonized assessment, the Global assessment of human-induced soil degradation (Oldeman and others 1991), is a map of perceptions - the kinds and degree of degradation, not a measure of degradation - and is now out of date. Within the FAO program Land Degradation Assessment in Drylands (LADA), the new Global Assessment of Land Degradation and Improvement (GLADA) maps degradation and improvement according to change in net primary productivity (NPP, the rate of removal of carbon dioxide from the atmosphere and its conversion to biomass). Satellite measurements of the normalised difference vegetation index (NDVI or greenness index) for the period 1981-2003 are used as a proxy for NPP. NDVI data have been widely used in studies of land degradation from the field scale to the global scale (e.g. Tucker and others 1991, Bastin and others 1995, Stoms and Hargrove 2000, Wessels and others 2004, 2007, Singh and others 2006). However, remote sensing can provide only indicators of land degradation and improvement: a negative trend in greenness does not necessarily mean land degradation, nor does a positive trend necessarily mean land improvement. Greenness depends on several factors including climate (especially fluctuations in rainfall, temperature, sunshine and the length of the growing season), land use and management; changes may be interpreted as land degradation or improvement only when these other factors are accounted for. Where productivity is limited by rainfall, rain-use efficiency (RUE, the ratio of NPP to rainfall) accounts for variability of rainfall and, to some extent, local soil and terrain characteristics. RUE is strongly correlated with rainfall; in the short term, it says more about rainfall fluctuation than land degradation but we judge that its long-term trends distinguish between rainfall variability and land degradation. To get around the correlation of RUE with rainfall, Wessels and others (2007) have suggested the alternative use of residual trends of NDVI (RESTREND) – the difference between the observed NDVI and that modelled from the local rainfall-NDVI relationship. In this report, land degradation is identified by a declining trend in both NDVI and RUE; in addition the comparable RESTREND values are presented. The pattern of land degradation is further explored by comparisons with soil and terrain, land cover, and socio-economic data. In the LADA program, areas identified by this first screening will be validated and characterized in the field by national teams.
ISRIC Report 2007/04

2 Land Degradation and Improvement in Cuba
2 Context and methods
2.1 LADA partner country: Cuba
Land degradation is widespread in Cuba. It threatens food and water security, economic development, natural resources and the environment; its symptoms are soil erosion, nutrient depletion including depletion of soil organic matter, soil compaction, salinity and sodicity. According to Herrera and others (1986), some 70 per cent of the country has suffered from soil erosion, a quarter of which is rated as serious. The immediate causes are deforestation, shifting cultivation without adequate fallows, overgrazing, and poor uptake of soil conservation practices. Apart from loss of topsoil by erosion, soil organic is lost under cropping without incorporation of crop residues, manure or compost, particularly under mono-cropping. Nutrient depletion and acidification are related symptoms of land degradation. Soil salinity is attributed to overexploitation of groundwater and inadequate drainage.
2.2 Data
NDVI and net primary productivity 2.2.1
2.2.2
The NDVI data from July 1981 to December 2003 used in this study are produced by the Global Inventory Modelling and Mapping Studies (GIMMS) group from measurements made by the AVHRR radiometer on board US National Oceanic and Atmospheric Administration satellites. The fortnightly images at 8km-spatial resolution are corrected for calibration, view geometry, volcanic aerosols, and other effects not related to vegetation cover (Tucker and others 2004). These data are compatible with those from other sensors such as MODIS, SPOT Vegetation, and Landsat ETM+ (Tucker and others 2005, Brown and others 2006). To provide a measure of land degradation and improvement open to economic analysis, the GIMMS NDVI time series has been translated to NPP using MODIS (moderate-resolution imaging spectro-radiometer) data for the overlapping period 2000-2003. MOD17A3 is a dataset of terrestrial gross and net primary productivity, computed at 1-km resolution at an 8-day interval (Heinsch and others 2003, Running and others 2004). Though far from perfect (Plummer 2006), the dataset has been validated in various landscapes (Fensholt and others 2004, 2006, Gebremichael and Barros 2006, Turner and others 2003, 2006); MODIS gross and net primary productivity are related to observed atmospheric CO2 and the inter-annual variability associated with the ENSO phenomenon, indicating that these data are reliable at the regional scale (Zhao and others 2005, 2006).
Climatic data
The VASClimO 1.1 dataset comprises the most complete monthly precipitation data for 1951-2000, compiled on the basis of long, quality-controlled station records, 10
ISRIC Report 2007/04
Land Degradation and Improvement in Cuba 3
in Cuba, gridded at resolution of 0.5° (Beck and others 2005); monthly rainfall data since January 1981 were used for this analysis, supplemented by the GPCC full re-analysis product (Schneider and others 2008) to produce rainfall values matching the GIMMS NDVI data. Mean annual temperature values from the CRU TS 2.1 dataset (Mitchell and Jones 2005) of monthly, station-observed values also gridded at 0.5o resolution, were used to calculate the aridity index and energy-use efficiency.
Soil and terrain 2.2.3
2.2.4
The global Soil and Terrain database (SOTER) comprises harmonized spatial and soil-attribute data, incorporating the 90m-resolution SRTM digital elevation model (Engelen and others 2005). The updated 1:5million Soil and terrain database for Latin America and the Caribbean (Dijkshoorn and others 2005) has been used in this preliminary analysis; a 1:1million soil and terrain dataset for Cuba has been compiling for further analysis of land degradation in relation to soils and terrain (Engelen and others 2008).
Land cover and land use
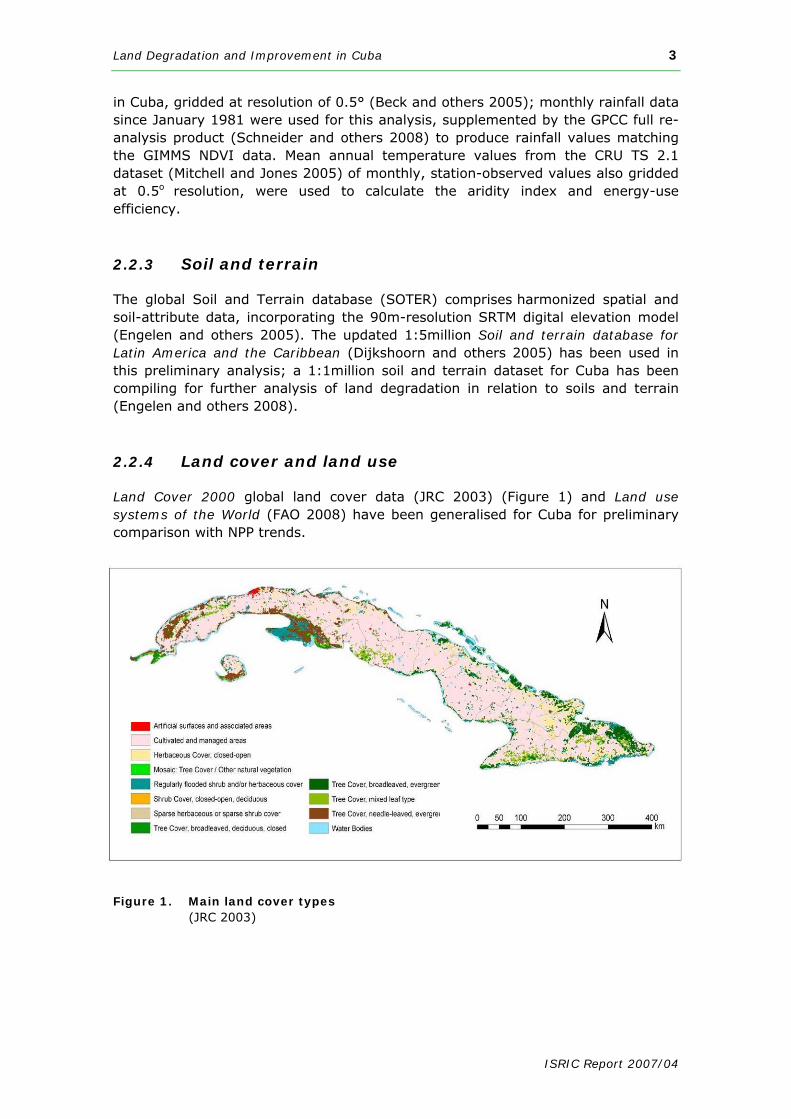
Land Cover 2000 global land cover data (JRC 2003) (Figure 1) and Land use systems of the World (FAO 2008) have been generalised for Cuba for preliminary comparison with NPP trends.
Figure 1. Main land cover types (JRC 2003)
ISRIC Report 2007/04

4 Land Degradation and Improvement in Cuba
Population, urban areas and poverty indices 2.2.5
2.2.6
The CIESIN Global Rural-Urban Mapping Project provides data for population and urban extent, gridded at 30 arc-second resolution (CIESIN 2004); for this study, the Urban/Rural Extents dataset is used to mask the urban area. Sub-national rates of infant mortality and child underweight status and the gridded population for 2005 at 2.5 arc-minutes resolution (CIESIN 2005) were compared with indices of land degradation.
Aridity index
Turc’s aridity index was calculated as P/PET where P is annual precipitation in mm
and ))/(9.0(/ 2LPPPET += where L = 300 + 25T + 0.05T3 where T is mean
annual temperature (Jones 1997). Precipitation was taken from the gridded VASClimO data, mean annual temperature from the CRU TS 2.1 data.
2.3 Analysis
Areas of land degradation and improvement are identified by a sequence of analyses of remotely sensed data:
1. Simple NDVI indicators: NDVI minimum, maximum, maximum-minimum, mean, sum, standard deviation and coefficient of variation. Their trends are analysed over the 23-year period of the GIMMS data (Appendix 2).
2. The annual sum NDVI, representing the aggregate of greenness over the year, period is chosen as the standard proxy for annual biomass productivity. NDVI is translated to net primary productivity (NPP) by correlation with MODIS data.
3. To distinguish between declining productivity caused by land degradation and decline owing to rainfall variability, the following procedure was adopted:
a. Identify the areas where there is a positive relationship between productivity and rainfall, i.e. where rainfall determines NPP;
b. For those areas where rainfall determines productivity, RUE is considered: where productivity declined but RUE increased, declining productivity is attributed to declining rainfall and these areas are masked;
c. For the remaining areas with a positive relationship between productivity and rainfall but declining RUE, and also for areas where there is a negative relationship between NDVI and rainfall, i.e. humid and irrigated areas where rainfall does not determine NPP, NDVI trend was calculated as RUE-adjusted NDVI;
d. Land degradation is indicated by a negative trend in RUE-adjusted NDVI and may be quantified as RUE-adjusted NPP.
ISRIC Report 2007/04

Land Degradation and Improvement in Cuba 5
4. Residual trends of NDVI (RESTREND).
Energy-use efficiency – ratio of annual sum NDVI to accumulated tempe
5. rature, combined with RUE-adjusted NPP to arrive at climate-adjusted
7. se, aridity, soil and terrain, rural population density and indices of poverty.
n
the drivers of land degradation, provided that these other
and improvement ill be undertaken by national teams within the LADA program.
NPP.
6. Calculation of loss of NPP in degrading areas.
Comparison of climate-adjusted NPP with land cover and land u
Details of the analytical methods are given as Appendix 1. Algorithms have beedeveloped that enable these screening analyses to be undertaken automatically. At the next stage of analysis, areas of land degradation and improvement identified on the basis of NDVI indices will be characterised manually, using 30m-resolution Landsat data, to identify the probable kinds of land degradation and relationships with land use change. At the same time, the continuous field of the index of land degradation derived from NDVI and climatic data will enable a statistical examination of other data for which continuous spatial coverage is not available - for instance spot measurements of soil attributes, and other social and economic data that may reflect data are geo-located. Finally, field examination of the identified areas of degradationw
ISRIC Report 2007/04


Land Degradation and Improvement in Cuba 7
ISRIC Report 2007/04
3 Results
The spatial patterns and temporal trends of several indicators of land degradation and improvement are presented in Appendix 2. The main text deals with interpretation of the annual sum NDVI data which are taken to represent annual green biomass production.
3.1 Trends in biomass productivity
Biomass productivity fluctuates according to rainfall cycles. Countrywide, greenness increased over the period 1981-2003 (Figure 2, Table A1).
Figure 2. Spatially aggregated annual sum NDVI 1981-2003, p<0.001 Figure 3 depicts the pattern and trends of annual sum NDVI indicator for each pixel, determined by the slope of the linear regression equation; the trends increased across 63 per cent of the country and decreased over 37 per cent; confidence levels refer to T-test values.
y = 0.0007x + 1.2748
1992
1993
1994
1995
1996
1997
1998
1999
2000
2001
2002
2003
Years
1.20
1.25
1.30
1.35
1981
1982
1983
1984
1985
1986
1987
1988
1989
1990
1991
4S
patia
lly a
ggre
gate
d su
m N
DVI
(*10
)

8 Land Degradation and Improvement in Cuba
d
b
Pattern (a), trends (b – % change, c – absolute change) and confidence levels (d) Figure 3. Annual sum NDVI 1981-2003
ISRIC Report 2007/04
c
a

Land Degradation and Improvement in Cuba 9
ISRIC Report 2007/04
3.2 Spatial patterns of biomass and rainfall
Biomass productivity varies according to rainfall, stage of growth and changes in land use, as well as land quality. Rainfall varies both cyclically (Figure 4) and across the country (Figure 5b, c). Statistics show a weak negative correlation between NDVI and annual rainfall: NDVIann. sum = 0.00059*Rainfall [mm yr-1] + 8.144 [1] (r=-0.12, n=1 551) The error in the regression model [1] is: slope (0.00059) ± 0.0003; intercept (8.144) ± 0.306. For Cuba as a whole, rainfall increased over the study period, at an average of 7.4mm annually; increasing over 83 per cent of the country (with an annual rate of 9mm); decreasing over 11 per cent (average rate of 6mm), in particular across north Pinar del Rio, Ciudad de la Habana, La Habana and east Villa Clara; there was no overall change across 6 per cent of the country.
y = 0.0125x + 2.038
1.5
1.8
2.1
2.4
2.7
1981
1982
1983
1984
1985
1986
1987
1988
1989
1990
1992
1993
1994
1995
1996
1997
1998
1999
2000
2001
2002
2003
Years
Spa
tially
agg
rega
ted
rain
fall
(x10
m
m)
Figure 4. Spatially aggregated annual rainfall 1981-2003
6
1991

10 Land Degradation and Improvement in Cuba
ISRIC Report 2007/04
d
b
c
a
Spatial pattern (a), temporal trends (b – percentage change, c – absolute change, confidence levels d) Figure 5. Annual rainfall 1981-2003

Land Degradation and Improvement in Cuba 11
Over the same period, biomass productivity increased overall. However, the correlation with rainfall is weak at pixel level, equation [1], and also for the country as a whole (Figure 6). This situation contrasts with most other LADA partner countries, such as South Africa (Bai and Dent 2007), where rainfall is the dominant factor explaining variation in biomass productivity.
y = -2.0493x + 4.8306R2 = 0.0546
1.5
1.8
2.1
2.4
2.7
1.23 1.26 1.29 1.32Spatially aggregated annual sum NDVI (*104)
Figure 6. Relationship between annual sum NDVI (all pixels) and annual rainfall
(all pixels) Each dot represents one year, p<0.01
3.3 Rain-use efficiency
Allowance may be made for the effect of fluctuations in rainfall on biomass productivity of by considering rain-use efficiency (RUE), i.e. production per unit of rainfall. RUE may fluctuate dramatically in the short term - often, there is a sharp decline in RUE in a wet year and we may assume that the vegetation, whether cultivated or semi-natural, cannot make immediate use of the additional rain. However, where rainfall is the main limiting factor on biomass productivity, we judge that the long-term trend of RUE is a good indicator of land degradation or improvement (Houérou 1984, 1988, 1989; Snyman 1998; Illius and O’Connor 1999; O’Connor and others 2001). RUE also accommodates the effects of local variations in slope, soil and vegetation (Justice and others 1991). In North China and Kenya, Bai and others (2005, 2006) demonstrated that values for RUE calculated from NDVI, which are easy to obtain, were comparable with those calculated from measurements of net primary productivity, which are not easy to obtain. For Cuba, RUE was calculated as the ratio of annual sum NDVI and station-observed annual rainfall.
Spat
ially
agg
rega
ted
annu
al ra
infa
ll (*
106 m
m)
ISRIC Report 2007/04

12 Land Degradation and Improvement in Cuba
ISRIC Report 2007/02
Figure 7 shows mean annual RUE and its trend over the period of 1981-2003: RUE is generally higher in drylands than in humid areas - which generate drainage to streams and groundwater (Figure 7a). Over the period 1981-2003, RUE decreased over 87 per cent of the country, notably in the south-east, and increased over 13 per cent of the country. Confidence levels are assessed by the T-test.

Land Degradation and Improvement in Cuba 13
ISRIC Report 2007/02
Figure 7. Rain-use efficiency 1981-2003: spatial pattern (a) and temporal trend (b – percentage changes, c – absolute changes, confidence d)
Figure 7. Rain-use efficiency 1981-2003: spatial pattern (a) and temporal trend (b – percentage changes, c – absolute changes, confidence d)
d c
b a

14 Land Degradation and Improvement in Cuba
ISRIC Report 2007/02
3.4 RESTREND
Countrywide, there is a significant negative correlation between RUE and rainfall (r=-0.81, n=1551) and RUE fluctuates wildly from year to year so that RUE, used in isolation, says as much about rainfall variability as about land degradation. To avoid the correlations between RUE and rainfall, and to distinguish land degradation from the effects of rainfall variability, Wessels and others (2007) suggest the alternative use of Residual Trends (RESTREND). Following their general procedure, we have correlated for each pixel annual sum NDVI and annual rainfall. The resulting regression equation represents the statistical association between observed sum NDVI and rainfall (Figure 8a, b); the model predicts sum NDVI according to rainfall. Residuals of sum NDVI (i.e. differences between the observed and predicted sum NDVI) for each pixel were calculated, and the trend of these residuals (RESTREND) was analysed by linear regression (Figure 8c). T-test confidence levels are shown in Figure 8d. RESTREND points in the same direction as RUE: a negative RESTREND may indicate land degradation, a positive RESTREND improvement but the spatial distribution is different from RUE; overall, RESTREND patterns are remarkably close to sum NDVI of lesser amplitude (Figure 3c), see Section 3.9.

(a) Correlation coefficient between sum NDVI and annual rainfall; (b) Slope of linear regression between sum NDVI and rainfall; (c), RESTREND; (d) Confidence levels of RESTREND
Land Degradation and Improvement in Cuba 15
ISRIC Report 2007/04
d c
b a
Figure 8. Residual trend of sum NDVI (RESTREND) 1981-2003

16 Land Degradation and Improvement in Cuba
ISRIC Report 2007/02
3.5 Net primary productivity
It is hard to visualise the degree of land degradation and improvement from NDVI. For a quantitative estimation, NDVI may be translated to net primary productivity (NPP) - the rate at which vegetation fixes CO2 from the atmosphere less losses through respiration; in other words, biomass productivity – which includes food, fibre and wood. The most accessible global NPP data are from the MODIS model (at 1km resolution from the year 2000). Figure 9a shows four-year (2000-2003) mean annual MODIS NPP at 1-km resolution; the pattern is similar to the GIMMS annual sum NDVI (Figure 3a) but at finer detail. We have translated the 1981-2003 GIMMS NDVI data to NPP by correlation with MODIS 8-day NPP values for the overlapping period. MODIS four-year annual mean NPP was re-sampled to 8km resolution by nearest neighbour assignment; the four-year mean annual sum NDVI over the same period (2000-2003) was then calculated. Correlation between the two data sets is moderate:
NPPMOD17 [tonneC ha-1 year-1] = 0.556 * NDVIsum + 4.602 [2]
(r = 0.6, n = 1 806, P<0.01) Where NPPMOD17 is annual NPP derived from MOD17, NDVIsum is a four-year (2000-2003) mean annual sum NDVI derived from GIMMS, C is carbon. Error or uncertainty in the regression model [2] is: slope (0.556) ± 0.077; intercept (4.602) ± 0.555. Correlation between the two raster data for all land cover types is only moderate but very high globally (Bai and others 2008) so the MOD17A3 NPP product has been used to convert the NDVI values to NPP. The translation is approximate. The percentage and absolute changes in NPP over the period 1981-2003 are mapped in Figure 9b and c; the confidence level refers to the T-test (Appendix 1). During the period, there was a slight overall increase in NPP (Table 1). Table 1. Changes in net primary productivity 1981-2003
Positive Negative Average
Land area (%) 63 37
% NPP change/year (tonneC ha-1 year-1) 0.13 0.08 0.06
∆ NPP (kgC ha-1 year-1) 12.2 8.1 4.52

ISRIC Report 2007/02
Land Degradation and Improvement in Cuba 17
d
b
Figure 9. Net primary productivity: mean (a), trends (b, % change; c, absolute change); confidence level (d)
c
a

18 Land Degradation and Improvement in Cuba
3.6 Land degradation
Land degradation means a loss of NPP but a decrease in NPP is not necessarily land degradation. To distinguish between declining productivity caused by land degradation and decline due to other factors, it is necessary to eliminate false alarms arising from climatic variability and changes in land use and management. Rainfall variability: has been taken into account by using both rain–use efficiency (RUE) and RESTREND. RUE is considered by, first, identifying pixels where there is a positive relationship between productivity and rainfall. For those areas where productivity depends on rainfall and where productivity declined but RUE increased, we attribute the decline of productivity to drought. Those areas are masked (urban areas are also masked). NDVI trends are presented for the remaining parts of the country as RUE-adjusted NDVI. Countywide, 29 per cent of the country suffered declining RUE-adjusted NDVI (Figure 10). Figure 10. Negative trend in RUE-adjusted annual sum NDVI, 1981-2003 Quantitative estimation: Table 2 and Figure 11 present a pixel-based estimate of the loss of NPP compared with the average over the period 1981-2003. Table 2. Cuba and World: NPP loss in degrading land between 1981 and 2003
Degrading land (km2)
% territory % global degrading land
NPP loss, (kgC/ha/yr)
Total NPP loss
(TonneC/23yr)
Cuba 32 430 29.3 0.10 10.1 755 493
Globe 35 058 104 23.5 100 11.8 955 221 419
ISRIC Report 2007/04

Land Degradation and Improvement in Cuba 19
Figure 11. NPP loss in the degrading areas 1981-2003 Comparison between RUE-adjusted NDVI and RESTREND: For Cuba, the two indicators of land degradation show very similar patterns (compare Figures 10 and 8c). Negative RESTREND encompasses a somewhat larger area than negative RUE-adjusted NDVI; their statistical confidence levels are proportional, see Section 3.9. Land use change: As with rainfall variability, land use change may also generate false alarms. For instance, conversion of forest or grassland to cropland or pasture will usually result in an immediate reduction in NDVI (and NPP) but may well be profitable and sustainable, depending on management. Lack of consistent time series data for land use and management precludes a generalised analysis of land use change. However, this will be undertaken manually for the potential hot spots of land degradation identified in this analysis and will be reported later.
3.7 Land improvement
Land improvement is identified by combination of: 1) a positive trend in sum NDVI for those areas where NDVI does not depend on rainfall; 2) for areas where NDVI is correlated with rainfall, a positive trend in rain-use efficiency; and 3) a positive trend in energy-use efficiency (Figure 12). These areas account for little more than 1 per cent of the country (Figure 13).
ISRIC Report 2007/06

20 Land Degradation and Improvement in Cuba
Figure 12. Areas of increasing NPP, RUE and EUE, 1981-2003 Figure 13. Confidence levels of positive climate-adjusted NDVI, 1981-2003
ISRIC Report 2007/04

Land Degradation and Improvement in Cuba 21
3.8 Urban areas
Whether urbanisation is degradation is arguable. It brings a huge increase in the financial value of the land but, if it which involves sealing of the land surface, it is degradation according to our criterion of partial loss of ecosystem function. The CIESIN Global Rural Urban Mapping Project shows 8.5 per cent of the land area as urban. These areas are masked in the maps. This makes a difference to the results: a reduction of 14.6 per cent for the identified degrading land, and a reduction of 8 per cent for the improving land.
3.9 Comparison of indicators
Annual sum NDVI is our standard indicator of productivity. Rain-use efficiency, RUE-adjusted NDVI and RESTREND are different ways of eliminating false alarms about land degradation caused by rainfall variability; each of these measures is useful in its own right. An advantage of RUE-adjusted NDVI is that, for areas considered to be degrading or improving, the original NDVI values are retained ad can be converted to NPP, which is open to economic analysis. Negative RUER-adjusted NDVI and negative RESTREND show similar patterns but negative RESTREND encompasses a somewhat larger area. Table 3 presents a comparison of indicators. Countrywide, the patterns of the trends in sum NDVI and RESTREND are almost identical: about 34 per cent of land area shows negative change in both sum NDVI and RESTREND, 62 per cent shows positive trend in both indicators, 4 per cent gives a mixed signal - either positive sum NDVI and negative RESTREND, or vice versa. If we take negative RUE-adjusted NDVI as the primary definition of degrading areas, then 95 per cent of these areas are also degrading in terms of both unadjusted NDVI and RESTREND. Taking a positive trend in RUE-adjusted NDVI as the primary indicator of improving land, the correspondence is even greater: all areas are also positive in terms of both unadjusted NDVI and RESTREND. Comparing RUE with RESTREND: 30 per cent of the land area shows negative trend in both RUE and RESTREND, 8 per cent shows positive trend in both RUE and RESTREND, 2 per cent shows no change, but we get mixed signals from 60 per cent - either positive RUE and negative RESTREND, or vice versa. If we again take RUE-adjusted NDVI as the primary definition of degrading areas, then 88 per cent shows negative trend in both RUE and RESTREND. Taking a positive trend in RUE-adjusted NDVI as the primary indicator of improving land, 91 per cent of the improving area shows positive trend in both RUE and RESTREND.
ISRIC Report 2007/06

22 Land Degradation and Improvement in Cuba
ISRIC Report 2007/04
Table 3. Comparison of trends in various indicators
Indicators Total pixel
Negative trend
Positive trend No change Mixed
(%) (%) (%) (%) (%)
Annual sum NDVI 100 37.3 62.3 0.4 0
RESTREND1 100 36.2 63.8 0.0 0
Sum NDVI ∩ RESTREND 100 34.4 61.9 0.0 3.7
Sum NDVI ∩ RESTREND within LD2 95.0
Sum NDVI ∩ RESTREND within LI3 100
RUE 100 76.7 11.6 11.7 0.0
RUE ∩ RESTREND 100 30.5 7.7 1.6 60.2
RUE ∩ RESTREND within LD 87.6
RUE ∩ RESTREND within LI 90.5
1 Residual trend of sum NDVI, 2 LD - identified improving land, 3 LI - identified degrading land
3.10 Analysis of degrading and improving areas
3.10.1 Association with land cover and land use
Table 4 compares degrading and improving areas with land cover (Figure 1): 66 per cent of the degrading area is cropland, comprising 30 per cent of all cropland; 13 per cent is grassland and scrub (codes 12-15; 30 per cent of these areas); and 18 per cent under forest (codes 1, 2, 4, and 9). Of the improving areas, 58 per cent is cropland (1 per cent of cropland); 23 per cent forest; and 16 per cent grassland and scrub. Comparison of degrading areas with global land use systems (Tables 5 and 6) indicates that 60 per cent of degrading land is agricultural land, 15 per cent is forestry, 9 per cent is in grassland (herbaceous vegetation in the FAO legend), 17 per cent is in urban and other lands. 75 per cent of improving land is agricultural land, 25 per cent is under forest and urban.

Land Degradation and Improvement in Cuba 23
Table 4. Degrading and improving land by land cover
Code
Land cover Total pixels
(TP)Degrading pixels
(DP)1DP/TP DP/TDP 2 Improving pixels
(IP)IP/TP IP/TIP 3
(0.536’) (0.536’) ( % ) ( % ) (0.536’) ( % ) ( % )
1 Tree cover, broadleaved, evergreen 8103 2483 30.6 7.4 105 1.3 7.6
2 Tree cover, broadleaved, deciduous, closed 2203 392 17.8 1.2 21 1.0 1.5
4 Tree cover, needle-leaved, evergreen 7934 1988 25.1 5.9 169 2.1 12.2
6 Tree cover, mixed leaf type 5096 1114 21.9 3.3 24 0.5 1.7
9 Mosaic: tree cover/other natural vegetation 2 0 0.0 0.0 0 0.0 0.0
12 Shrub cover, closed-open, deciduous 30 3 10.0 0.0 0 0.0 0.0
13 Herbaceous cover, closed-open 9257 3376 36.5 10.0 204 2.2 14.7
14 Sparse herbaceous or sparse shrub cover 912 226 24.8 0.7 4 0.4 0.3
15 Regularly flooded shrub and/or herbaceous cover 4188 642 15.3 1.9 8 0.2 0.6
16 Cultivated and managed areas 74221 22414 30.2 66.4 806 1.1 58.2
20 Water bodies 7882 1089 13.8 3.2 44 0.6 3.2
22 Artificial surfaces and associated areas 405 47 11.6 0.1 0 0.0 0.0
Total 112351 33774 100 1385 100.0 1 Urban extent excluded, 2 TDP - total degrading pixels, 3 TIP - total improving pixels
ISRIC Report 2007/06

24 Land Degradation and Improvement in Cuba
Table 5. Degrading and improving areas by land use systems (FAO 2008)
Code
Land use system Total pixels (TP)
Degrading pixels (DP) DP/TP DP/TDP1 Improving pixels
(IP) IP/TP IP/TIP2
( 5'x5' ) ( 5'x5' ) ( % ) ( % ) ( 5'x5' ) ( % ) ( % )
0 Undefined 0 0 0.0 0 0.0 0.0
1 Forestry - not managed (natural) 10 1 10.0 0.3 0 0.0 0.0
2 Forestry - protected areas 76 26 34.2 6.6 0 0.0 0.0
4 Forestry - pastoralism moderate or higher intensity
14 3 21.4 0.8 0 0.0 0.0
5 Forestry - pastoralism moderate or higher intensity with scattered plantations 67 23 34.3 5.9 1 4.3 6.3
6 Forestry - scattered plantations 40 4 10.0 1.0 1 25.0 6.3
7 Herbaceous -not managed (natural) 21 10 47.6 2.6 0 0.0 0.0
8 Herbaceous - protected areas 5 1 20.0 0.3 0 0.0 0.0
9 Herbaceous - extensive pastoralism 1 0 0.0 0.0 0 0.0 0.0
10 Herbaceous - moderately intensive pastoralism 8 3 37.5 0.8 0 0.0 0.0
11 Herbaceous - intensive pastoralism 60 21 35.0 5.4 0 0.0 0.0
13 Rain-fed agriculture 151 36 23.8 9.2 2 5.6 12.5
14 Agro-pastoralism - moderately intensive 48 11 22.9 2.8 0 0.0 0.0
15 Agro-pastoralism - intensive 456 142 31.1 36.2 6 4.2 37.5
16 Agro-pastoralism - moderately intensive or higher with large-scale irrigation 72 28 38.9 7.1 0 0.0 0.0
17 Agriculture - large scale irrigation (> 25% pixel size) 23 7 30.4 1.8 3 42.9 18.8
18 Agriculture - protected areas 34 10 29.4 2.6 1 10.0 6.3
19 Urban areas 121 41 33.9 10.5 2 4.9 12.5
20 Wetlands - not managed (natural) 14 5 35.7 1.3 0 0.0 0.0
21 Wetlands - protected areas 23 5 21.7 1.3 0 0.0 0.0
22 Wetlands - mangroves 0 0 0.0 0.0 0 0.0 0.0
23 Wetlands - agro-pastoralism 0 0 0.0 0.0 0 0.0 0.0
ISRIC Report 2007/06

Land Degradation and Improvement in Cuba 25
Code
Land use system Total pixels
(TP) Degrading pixels
(DP) DP/TP DP/TDP1 Improving pixels (IP) IP/TP IP/TIP2
24 Bare areas - not managed (natural) 2 1 50.0 0.3 0 0.0 0.0
25 Bare areas - protected areas 0 0 0.0 0.0 0 0.0 0.0
26 Bare areas - extensive pastoralism 0 0 0.0 0.0 0 0.0 0.0
27 Bare areas - moderately intensive or intensive pastoralism 0
0 0.0 0.0 0 0.0 0.0
28 Water - Coastal or not managed (natural) 34 11 32.4 2.8 0 0.0 0.0
29 Water - protected areas 17 0 0.0 0.0 0 0.0 0.0
30 Water - inland fisheries 9 3 33.3 0.8 0 0.0 0.0
100 Undefined 0 0 0.0 0.0 0 0.0 0.0
Total 1306 392 100.0 16 100.0 1TDP - total degrading pixels, 2TIP - total improving pixels
ISRIC Report 2007/06

26 Land Degradation and Improvement in Cuba
ISRIC Report 2007/06
Table 6. Degrading/improving lands in the aggregated land use systems
Land use system Codes Total pixels (TP) Degrading pixels (DP) DP/TP DP/TDP1 Improving pixels (IP) IP/TP IP/TIP2
(LUS) ( 5'x5' ) ( 5'x 5' ) (%) (%) ( 5'x 5' ) (%) (%)
Forestry 1-6 207 57 27.5 14.5 2 1.0 12.5
Herbaceous
7-11 95 35 36.8 8.9 0 0.0 0.0
Agricultural land 13-18 784 234 29.8 59.7 12 1.5 75.0
Urban 19 121 41 33.9 10.5 2 1.7 12.5
Wetlands 20-23 37 10 27.0 2.6 0 0.0 0.0
Bare areas 24-27 2 1 50.0 0.3 0 0.0 0.0
Water 28-30 60 14 23.3 3.6 0 0.0 0.0
Undefined 0,100 0 0 0.0 0.0 0 0.0 0.0
Total 1306 392 100.0 16 100.0
1TDP - total degrading pixels; 2TIP - total improving pixels

Land Degradation and Improvement in Cuba 27
Association with population density 3.10.2
Twenty-eight per cent of the Cuban population (3.2 million out of 11.3 million in 2005) lives in the degrading areas (Figure 14). There is a weak, positive correlation (r=0.23) between land degradation and loge population density (Figure 15). Figure 14. Population counts affected by the land degradation
0
50
100
150
200
250
-9 -8.5 -8 -7.5 -7 -6.5 -6 -5.5 -5 -4.5 -4 -3.5 -3 -2.5 -2 -1.5 -1 -0.5 0 0.5 1 1.5 2 2.5 3 3.5 4 4.5 5 5.5 6 6.5 7 7.5 8 8.5
Land degradation (-) and improvement (+)
Mean population density (person/km2)
Figure 15. Relationship between population density and land degradation/
improvement
ISRIC Report 2007/04

28 Land Degradation and Improvement in Cuba
ISRIC Report 2007/04
3.10.3
3.10.4
3.10.5
Relationship with aridity
There is no correlation (r=-0.055) between land degradation and Turc’s aridity index. 85 per cent of degrading land is in humid and cool regions, 13 per cent in dry sub-humid areas and 1 per cent in the very small semi-arid region.
Relationship with poverty
Taking the infant mortality rate as a proxy for poverty, there appears to be a negative relationship between degrading areas and poverty (r=0.6). This is the opposite of what might be expected; a more rigorous analysis is needed to tease out the underlying social and economic variables.
Relationship with soils and terrain
Various soil and terrain attributes are mapped in Figure 16. There is no obvious relationship between land degradation and any individual biophysical attribute: about 80 per cent of the degrading land is flat, 5 per cent is medium gradient, 9 per cent high gradient, and 5 per cent is ridges (Table 7). Table 7. Degrading areas in different landforms
SOTER label
Landforms Total pixels (TP)
Degrading pixels (DP)
DP/TP (%)
DP/TDP* (%)
LL Plateau 5 2 40 0.4
LP Plain 1367 400 29.3 80.3
SH Medium-gradient hill 92 25 27.2 5.0
SR Ridges 89 24 27.0 4.8
TE High-gradient escarpment 48 17 35.4 3.4
TH High-gradient hill 36 4 11.1 0.8
TM High-gradient mountain 115 26 22.6 5.2
Total 1752 498 28.4 100.0
*TDP - total degrading pixels

ISRIC Report 2007/04
Land Degradation and Improvement in Cuba 29
Cuba: slope of landform Cuba: soil pH values (PHAQ)
Cuba: dominant landform Cuba: lithology
Cuba: total soil nitrogen (TOTN)
Cuba: total soil organic carbon (TOTC)
Figure 16. Soil and terrain attributes for dominant soil types

30 Land Degradation and Improvement in Cuba
In respect of soil organic carbon, classes defined by 0-5, 5-15, 15-20 and >20 g/kilogram, occupy 33, 4, 53 and 10 per cent of the degrading area, respectively (Figure 17), similar to the national extent of each class (Table 8); there is almost no relationship between total soil organic carbon and land degradation at pixel level; Figure 17. Total soil organic carbon in degrading areas Table 8. Total soil organic carbon in degrading areas
TOTC (g/kg) Pixels in class % Pixels in degrading land % of total degrading land
0-5 727 40.0 169 32.8
5-15 102 5.6 21 4.1
15-20 823 45.2 273 53 > 20 167 9.2 52 10.1
total 1 819 100 515 100
There is a weak relationship between degradation and soil pH. In short, it appears that land degradation is influenced more by management, in particular by management under cultivation, than by soils and terrain per se.
ISRIC Report 2007/04

Land Degradation and Improvement in Cuba 31
4 What GLADA can and cannot do
• We have defined land degradation as a long-term loss of ecosystem function and we use net primary productivity (NPP) as an indicator. GLADA is an interpretation off GIMMS time series NDVI data, i.e. a measure of greenness, which is taken as a proxy for NPP. Translation of NDVI is robust but approximate.
• The proxy is several steps removed from recognisable symptoms of land
degradation as it is commonly understood - such as soil erosion, salinity or nutrient depletion; the same goes for land improvement. Greenness is determined by several factors and, to interpret it in terms of land degradation and improvement, these other factors must be accounted for –in particular variability of rainfall and temperature and changes I land use and management, Rain-use efficiency (RUE, NPP per unit of rainfall) accounts for rainfall variability and, to some extent, local soil and land characteristics. We assume that, where NPP is limited by rainfall, a declining trend in RUE indicates land degradation. Where rainfall is not limiting, NPP is the best indicator available. Taken together, the two indicators may provide a more robust assessment than either used alone. Alternatively, RESTREND points in the same direction: it shows much the same pattern as NDVI though with lesser amplitude.
Land use change is not taken into account in this study owing to the lack of consistent time series data.
• Declining NPP, even allowing for climatic variability, may not even be
reckoned as land degradation: urban development is generally considered to be development – although it generally means a long-term loss of ecosystem function; land use change from forest or grassland to cropland or rangeland is usually associated with a loss of NPP but it may or may not be accompanied by soil erosion, compaction and nutrient depletion, and it may well be profitable and sustainable , depending on management. Similarly, increasing NPP means greater biological production but may reflect, for instance, encroachment of bush or invasive species – which is not land improvement as commonly understood.
• The coarse resolution of the GIMMS data is a limitation: an 8km pixel
integrates the signal from a wider surrounding area. Many symptoms of even severe degradation, such as gullies, rarely extend over such a large area; degradation must be severe indeed to be seen against the signal of surrounding unaffected areas.
• As a quantitative estimate of land degradation, loss of NPP relative to the
average trend has been calculated for those areas where both NPP and RUE are declining. This is likely to be a conservative estimate: where NPP is increasing but RUE is declining, some land degradation may have begun that is reducing NPP but is not yet reflected in declining NPP.
ISRIC Report 2007/04

32 Land Degradation and Improvement in Cuba
• By the same reasoning, RUE should be used alone for early warning of degradation or as a herald of improvement. Where NPP is rising but RUE is declining, some process of degradation may be under way which will remain undetected if we consider only those areas where both indices are declining. The reverse also holds true: we might not recognise promising interventions that increase RUE but have not yet brought about increasing NPP.
• GLADA presents a different picture from previous assessments of land
degradation which compounded historical degradation with what is happening now. The data from the last 25 years indicate present trends but tell us nothing about the historical legacy; many degraded areas have become stable landscapes with a stubbornly low level of productivity. For many purposes, it is more important to address present-day degradation; much historical degradation maybe irreversible.
• Remote sensing provides only indicators of biomass productivity. The
various kinds of land degradation and improvement are not distinguished; the patterns revealed by remote sensing should be followed up by fieldwork to establish the actual conditions on the ground and results are provisional until validated in the field. This is not straightforward: an 8km pixel cannot be checked by a windscreen survey and a 23-year trend cannot be checked by a snapshot. A rigorous procedure must be followed, as defined in the forthcoming LADA Field Handbook. Apart from systematically and consistently characterising the situation on the ground across a range of scales, the field teams may validate the GLSAA interpretations by addressing the following questions:
1. Is the biomass trend indicated by GLADA real? 2. If so, does it correspond with physical manifestations of land
degradation and improvement that are measurable on the ground? 3. If the answer to either of the above questions is no, what has caused
the observed trend? 4. Is the mismatch a question of timing of observations – where the
situation on the ground has subsequently recovered or reverted?
ISRIC Report 2007/04

Land Degradation and Improvement in Cuba 33
5 Conclusions
• Land degradation and improvement have been assessed by remotely sensed indicators of biomass productivity based on NDVI, the greenness index, which may be translated in terms of net primary productivity (NPP). The indicators show clear decreasing and increasing trends over the period 1981-2003 which may be interpreted, respectively, as land degradation or improvement.
• Greenness is determined by several factors. To interpret it in terms of land
degradation and improvement, these other factors must be accounted for – in particular, variability of rainfall and changes in land use and management. Rain-use efficiency (RUE), i.e. NPP per unit of rainfall, accounts for rainfall variability and, to some extent, local soil and land characteristics. We assume that, where NPP is limited by rainfall, a declining trend in RUE indicates land degradation. Where rainfall is not limiting, NPP is the best indicator available. Taken together, the two indicators may provide a more robust assessment than either used alone. Alternatively, RESTREND points in the same direction; it shows much the same pattern as the sum NDVI.
• As a quantitative measure of land degradation, loss of NPP relative to the
average has been calculated for those areas where both NPP and RUE are declining. This is likely to be a conservative estimate: where NPP is increasing but RUE is declining, some process of land degradation may have begun that is reducing NPP but is not yet reflected in a declining NPP trend.
• By the same reasoning, RUE should be used alone for early warning of land
degradation, or a herald of improvement. Where NPP is rising but RUE declining, some process of land degradation might be under way that is not yet reflected in declining NPP; it will remain undetected if we consider only those areas where both indices are declining. The reverse also holds true: we might forgo promising interventions that increase RUE but have not yet brought about increasing NPP.
• In Cuba overall NPP increased very slightly over the period of 1981-2003;
not enough to match population growth or to provide a sound foundation for development. Degrading areas, suffering both declining NPP and declining RUE, occupy 29 per cent of the country, and suffered an average loss of NPP of 10 kgC ha-1 year-1.
• Land improvement, defined by increasing NPP, RUE and energy-use efficiency, is identified across only 1 per cent of the country.
• About 3.2 million people (28 per cent of the Cuban population) live in the degrading areas. However, the correlation between land degradation and loge population density is weak and there is no obvious relationship with poverty. A more rigorous analysis is needed to tease out the underlying social and economic drivers.
ISRIC Report 2007/04

34 Land Degradation and Improvement in Cuba
• GLADA presents a different picture from previous assessments of land degradation which compounded historical land degradation with what is happening now. The data since 1981 indicate current trends but tell us nothing about the historical legacy. However, for many purposes, it is more important to address present-day land degradation; much historical land degradation may be irreversible.
• Remote sensing provides only indicators of trends of biomass productivity.
The various kinds of land degradation and improvement are not distinguished; the patterns derived from remote sensing should be followed up by fieldwork to establish the actual conditions on the ground.
Acknowledgements
This work is part of the GEF/UNEP/FAO project Land Degradation Assessment in Drylands. We thank CJ Tucker, JE Pinzon and ME Brown for access to the GIMMS datasets; J Grieser for providing the VASClimO precipitation data, T Fuchs for the GPCC precipitation data, and M Salmon for providing the CRU TS climatic data; we are indebted ME Schaepman for concept development; we thank F Nachtergaele R Biancalani, S Prince and A Anyamba for critical comments on the draft, and local LADA partner institutions for their collaboration; and ISRIC colleagues GWJ van Lynden and NH Batjes for editing, P Tempel and JRM Huting for help with data handling, G Heuvelink for help with statistics and Y Karpes-Liem for text layout.
ISRIC Report 2007/04

Land Degradation and Improvement in Cuba 35
References
Bai ZG & DL Dent 2006 Global assessment of land degradation and improvement: pilot study in Kenya. Report 2006/01, ISRIC- World Soil Information, Wageningen
Bai ZG & DL Dent 2007 Land degradation and improvement in South Africa 1: identification by remote sensing. Report 2007/03, ISRIC – World Soil Information, Wageningen
Bai ZG, DL Dent & ME Schaepman 2005 Quantitative global assessment of land degradation and improvement: pilot study in North China. ISRIC Rep 2005/06, Wageningen
Bai ZG, DL Dent, L Olsson & ME Schaepman 2008 Global assessment of land degradation and improvement 1. Identification by remote sensing. Rept 2008/1, ISRIC World Soil Information, Wageningen
Bastin GN, G Pickup & G Pearce 1995 Utility of AVHRR data for land degradation assessment - a case study. International Journal of Remote Sensing 16, 651-672
Beck C, J Grieser & B Rudolf 2005 A new monthly precipitation climatology for the global land areas for the period 1951 to 2000. 181-190 in Climate Status Report 2004. German Weather Service, Offenbach
Brown ME, JE Pinzon, K Didan, JT Morisette & CJ Tucker 2006 Evaluation of the consistency of long-term NDVI time series derived from AVHRR, SPOT-Vegetation, SeaWIFS, MODIS and Landsat ETM+. IEEE Transactions on Geoscience and Remote Sensing 44, 1787-1793
CIESIN 2005 Gridded population of the World. Socioeconomic Data and Applications Center, Center for International Earth Science Information Network Columbia University, UN Food and Agriculture Organization and Centro Internacional de Agricultura Tropical, Palisades NY: http://sedac.ciesin.columbia.edu/gpw Accessed 15 June, 2007
CIESIN 2004 Global rural-urban mapping project: urban/rural extents. Center for International Earth Science Information Network Columbia University, International Food Policy Research Inst., World Bank and Centro Internacional de Agricultura Tropical, Palisades NY http://sedac.ciesin.columbia.edu/gpw/ Accessed 20 Dec 2006
Dijkshoorn JA, JRM Huting & P Tempel 2005. Update of the 1:5 million Soil and Terrain Database for Latin America and the Caribbean (SOTERLAC, version 2.0). Rept 2005/01, ISRIC – World Soil Information, Wageningen
Engelen VWP van, JA Dijkshoorn & JRM Huting 2008 Global assessment of land degradation and improvement 2. Soil and landform properties for SOTER units. ISRIC Rept 2008/02, Wageningen
Engelen VWP van, NH Batjes, K Dijkshoorn & J Huting 2005 Harmonized Global Soil Resources Database. Rept 2005/6, ISRIC - World Soil Information, Wageningen
FAO 2008 Land use systems of the World. http://www.fao.org/geonetwork/srv/en/metadata.show Accessed 15 June 2008
Fensholt R, I Sandholt & MS Rasmussen 2004 Evaluation of MODIS LAI, fAPAR and the relation between fAPAR and NDVI in a semi-arid environment using in situ measurements. Remote Sensing of Environment 91, 490–507
ISRIC Report 2007/04

36 Land Degradation and Improvement in Cuba
Fensholt R, I Sandholt, MS Rasmussen, S Stisen & A Diouf 2006 Evaluation of satellite-based primary production modelling in the semi-arid Sahel. Remote Sensing of Environ. 105, 173-188
Gebremichael M & AP Barros 2006 Evaluation of MODIS gross primary productivity in tropical monsoon regions. Remote Sensing of Environ 100, 150–166
Heinsch FA, M Reeves, P Votava & others 2003 User's Guide: GPP and NPP (MOD17A2/A3) Products NASA MODIS Land Algorithm Version 20, December 2, 2003. University of Montana ftp://ftp.ntsg.umt.edu/pub/MODIS/TERRA/Mosaics Accessed 1 Dec 2006
Herrera A & Seco R 1986 La agricultura y el medio ambiente en Cuba. Acta Universitatis Carolinae, Geographica 2, 53-64
Houérou HN Le 1984 Rain-use efficiency: a unifying concept in arid-land ecology. Journal of Arid Environments 7, 213-247
Houérou HN Le 1989 The grazing land ecosystems of the African Sahel. Springer-Verlag, Berlin
Houérou HN Le, RL Bingham & W Skerbek 1988 Relationship between the variability of primary production and variability of annual precipitation in world arid lands. Journal of Arid Environments 15, 1-18
Illius AW & TG O’Connor 1999 On the relevance of nonequilibrium concepts to arid and semiarid grazing systems. Ecological Applications 9, 798–813
Jones JAA 1997 Global hydrology: processes, resources and environmental management Longman, Harlow
JRC 2003 Global Land Cover 2000 database. European Commission, Joint Research Centre. http://www-gemjrcit/glc2000 Accessed 30 Aug 2006
Justice CO, G Dugdale, JRG Townshend, AS Narracott & M Kumar 1991 Synergism between NOAAAVHRR and Meteosat data for studying vegetation development in semi-arid West Africa. International Journal of Remote Sensing 12, 1349–1368
Livezy RE & WY Chen 1983 Statistical field significance and its determination by Monte Carlo techniques. Monthly Weather Review, 111, 46-59
Mitchell TD & PD Jones 2005 An improved method of constructing a database of monthly climate observations and associated high resolution grids. International Journal of Climate 25, 693-712
O'Connor TG, LM Haines & HA Snyman 2001 Influence of precipitation and species composition on phytomass of a semi-arid African grassland. Journal of Ecology 89, 850-860
Oldeman LR, RTA Hakkeling & WG Sombroek 1991 World map of the status of human-induced soil degradation: An explanatory note, second revised edition ISRIC, Wageningen
Plummer S 2006 On validation of the MODIIS gross primary production product. IEEE Transactions on Geoscience and Remote Sensing 44, 7, 1936-1938
Running SW, FA Heinsch, M Zhao, M Reeves & H Hashimoto 2004 A continuous satellite-derived measure of global terrestrial production. Bioscience, 54, 547-60
Schneider U, T Fuchs, A Meyer-Christoffer & B Rudolf 2008 Global precipitation analysis products of the GPCC, full data re-analysis product version 4. Global Precipitation Climatology Centre, Deutscher Wetterdienst, Offenbach, ftp://ftp-anon.dwd.de/pub/data/gpcc/html/fulldata_download.html Accessed August 8 2008
ISRIC Report 2007/04

Land Degradation and Improvement in Cuba 37
Singh D, MSP Meirelles, GA Costa & others 2006 Environmental degradation analysis using NOAA/AVHRR data. Advances in Space Research 37, 720-727
Snyman HA 1998 Dynamics and sustainable utilization of rangeland ecosystems in arid and semi-arid climates of southern Africa. Journal of Arid Environments 39, 645–666
Stoms DM & WW Hargrove 2000 Potential NDVI as a baseline for monitoring ecosystem functioning. International Journal of Remote Sensing 21, 401-407
Tucker CJ, HE Dregne & WW Newcomb 1991 Expansion and contraction of the Sahara Desert from 1980-1990. Science 253, 299-301
Tucker CJ, JE Pinzon and ME Brown 2004 Global Inventory Modeling and Mapping Studies (GIMMS) Satellite Drift Corrected and NOAA-16 incorporated Normalized Difference Vegetation Index (NDVI), Monthly 1981-2002. University of Maryland
Tucker CJ, JE Pinzon, ME Brown & others 2005 An extended AVHRR 8-km NDVI Dataset compatible with MODIS and SPOT vegetation NDVI data. International Journal of Remote Sensing 26, 4485-4498
Turner DP, WD Ritts, WB Cohen & others 2003 Scaling gross primary production (GPP) over boreal and deciduous forest landscapes in support of MODIS GPP product validation. Remote Sensing of Environ. 88, 256–270
Turner DP, WD Ritts, WB Cohen & others 2006 Evaluation of MODIS NPP and GPP products across multiple biomes. Remote Sensing of Environ. 102, 282–292
UNCED 1992 Managing fragile ecosystems: combating desertification and drought Agenda 21, Chapter 12 United Nations Conference on Environment and Development http://wwwunorg/esa/sustdev/documents/agenda21 Accessed 5 Aug 2005
UNEP 2007 Global Environmental Outlook GEO-4. Environment for development. UN Environment Programme, Nairobi
Wessels KJ, SD Prince, J Malherbe & others 2007 Can human-induced land degradation be distinguished from the effects of rainfall variability? A case study in South Africa. Journal of Arid Environments 68, 271-297
Wessels KJ, SD Prince, PE Frost & D van Zyl 2004 Assessing the effects of human-induced land degradation in the former homelands of northern South Africa with a 1km AVHRR NDVI time-series. Remote Sensing of Environ. 91, 47-67
Zhao M, FA Heinsch, RR Nemani & SW Running 2005 Improvements of the MODIS terrestrial gross and net primary production global data set. Remote Sensing of Environ. 95, 164-176
Zhao M, SW Running & RR Nemani 2006 Sensitivity of Moderate Resolution Imaging Spectroradiometer (MODIS) terrestrial primary production to the accuracy of meteorological reanalyses. Journal of Geophysical Research 111, G01002, doi:10.1029/2004JG000004
ISRIC Report 2007/04


Land Degradation and Improvement in Cuba 39
Appendix 1: Analytical methods
Derivation of NDVI indicators
ArcGIS Spatial Analyst, ERDAS IMAGINE and ENVI-IDL were used to calculate NDVI minimum, maximum, maximum-minimum, mean, sum, standard deviation (STD) and coefficient of variation (CoV), as well as climate variables. The fortnightly NDVI data were geo-referenced and averaged to monthly; annual NDVI indicators were derived for each pixel; their temporal trends were determined by linear regression at an annual interval and mapped to depict spatial changes (Appendix 2). A negative slope of linear regression indicates a decline of green biomass and a positive slope, an increase – except for STD and CoV which indicate trends in variability. The absolute change (∆ in map legends, titled “changes in …..”) is the slope of the regression; the relative change (% in map legends, titled “trend in ….”) is 100(slope of the regression/multi-year mean). Monthly grids of rainfall for the period 1981-2002 were geo-referenced and re-sampled to the same spatial resolution as the NDVI (8km) using neighbourhood statistics. Spatial pattern and temporal trend of rainfall and rain-use efficiency (RUE, the ratio of annual NDVI and annual rainfall) for each pixel were determined by regression. Land degradation was identified by negative trends of both biomass and rain-use efficiency. To distinguish between declining productivity caused by land degradation, and declining productivity due to other factors, rainfall variability has been accounted for by, first, identifying pixels where there is a positive relationship between productivity and rainfall; secondly, for those areas where productivity depends on rainfall, rain-use efficiency has been considered: where productivity declined but RUE increased, we attribute the decline of productivity to declining rainfall and those areas are masked. Land improvement was identified by positive changes in sum NDVI where show positive rain-use efficiency which has a positive correlation between sum NDVI and rainfall and energy-use efficiency. Both were masked by the mapped urban extents. Statistical tests
The trend analysis assumes that the data are spatially and temporally independent. This was tested by examining autocorrelation coefficients following Livezy and Chen (1983). When the absolute values of the autocorrelation coefficients of lag-1 to lag-3 calculated for a time series consisting of n observations are not larger than the
typical critical value corresponding to 5 per cent significance level, i.e., 1.96/ n ,
the observations in this time series can be accepted as being independent from each other.
ISRIC Report 2007/04
40 Land Degradation and Improvement in Cuba
The T-test was used to arrange the slope values in classes showing strong or weak positive or negative trends:
T = b / se(b) Where b is the calculated slope of the regression line between the observation values and time and se(b) represents the standard error of b. The class boundaries were defined for 95 per cent confidence level; trends were labelled high if the T-values of the slope exceeded the 0.025 p-value of either tail of the distribution; lesser T- values were labelled low. In addition, SPSS and MS Excel were employed to analyze trends, correlations and significances of the non-gridded variables. Associations between land degradation/improvement and other variables
Maps of the negative trend in climate-adjusted NDVI were overlaid on the other maps. Corresponding comparative values were calculated, pixel-by-pixel and a univariate correlation calculated.
ISRIC Report 2007/04

Land Degradation and Improvement in Cuba 41
ISRIC Report 2007/04
Appendix 2: NDVI indicators of land degradation and improvement
Minimum NDVI: The lowest value that occurs in any one year (annual) - which is usually at the end of the dry season. Variation in minimum NDVI may serve as a baseline for other parameters. Maximum or peak NDVI: Represents the maximum green biomass. The large spatial variations reflect the diverse landscapes and climate. Maximum-minimum NDVI: The difference between annual maximum and minimum NDVI reflects annual biomass productivity for areas with one, well-defined growing season but may not be meaningful for areas with bimodal rainfall. Sum NDVI: The sum of fortnightly NDVI values for the year most nearly aggregates annual biomass productivity. Standard deviation (STD): NDVI standard deviation is the root mean square deviation of the NDVI time series values (annual) from their arithmetic mean. It is a measure of statistical dispersion, measuring the spread of NDVI values. Coefficient of variation (CoV): CoV can be used to compare the amount of variation in different sets of sample data. NDVI CoV images were generated by computing for each pixel the standard deviation (STD) of the set of individual NDVI values and dividing this by the mean (M) of these values. This represents the dispersion of NDVI values relative to the mean value. Temporal trends: The long-term trends of the indicators of biological productivity may be taken as indicators of land degradation (where the trend is declining) or land improvement (where the trend is increasing). A positive change in the value of a pixel-level CoV over time relates to increased dispersion of values, not increasing NDVI; similarly, a negative CoV dispersion – which is the case over nearly the whole country - means decreasing dispersion of NDVI around mean values, not decreasing NDVI. The patterns and trends of all NDVI indicators for each pixel, determined by the slope of the linear regression equation, are depicted in Figures A1-7; their values are summarised in Table A1. No further analyses were made for these indicators except for the sum NDVI which is discussed in detail in the main text. It is recommended, however, that these maps should be considered in the field investigation - in particular the land use change during the study period (1981-2003).

42 Land Degradation and Improvement in Cuba
Table A1. Statistics of NDVI indicators*
Indicator NDVI values Pixels (%) % NDVI change/year ∆ NDVI/year
min max mean Pos. Neg. Pos. Neg. mean Pos. Neg. mean
Minimum 0.323 0.538 0.448 56.7 43.3 0.430 0.405 0.046 0.00174 0.00167 0.00017
Maximum 0.613 0.754 0.684 64.2 35.8 0.208 0.150 0.066 0.00137 0.00088 0.00047
Max-Min 0.124 0.391 0.235 51.3 48.7 1.034 0.939 0.068 0.00248 0.00197 0.00030
Mean 0.523 0.619 0.578 62.6 37.4 0.161 0.113 0.055 0.00090 0.00061 0.00031
Sum 6.278 7.432 6.932 62.6 37.4 0.161 0.113 0.055 0.01074 0.00737 0.00375
STD 0.039 0.118 0.073 49.7 50.3 0.981 0.949 -0.004 0.00072 0.00059 0.00005
CoV 0.070 0.221 0.131 47.5 52.5 1.053 0.989 -0.050 0.00139 0.00117 0.00001
* In the calculations of the min., max. and mean values of each NDVI indicator, an average value of the all pixels in the vegetated area, defined as areas with net primary productivity greater than 1 g C m-2 year-1, were calculated. For example, min. value of the Maximum NDVI indicator: overlay statistic minimum of CELL STATISTIC in ArcMap was performed to extract minimum values of the time series annual Maximum NDVI for each pixel over the period (1981-2003), and the averaged minimum value of the maximum NDVI for all pixels was assigned as min. for the Maximum NDVI indicator; max. value of the Maximum NDVI indicator: overlay statistic maximum of CELL STATISTIC in ArcMap was performed to extract maximum values of the time series annual Maximum NDVI for each pixel over the period (1981-2003), and the averaged maximum value of the maximum NDVI for all pixels was assigned as max. for the Maximum NDVI indicator; mean value of the Maximum NDVI indicator: overlay statistic mean of CELL STATISTIC in ArcMap was performed to extract mean values of the time series annual Maximum NDVI for each pixel over the period (1981-2003), and the averaged mean value of the maximum NDVI for all pixels was assigned as mean for the Maximum NDVI indicator. The rates of the positive and negative pixels were counted from the slope of the regression, i.e., positive slope (pos.) negative slope (neg.). % NDVI change/year was calculated from the trend maps for each NDVI indicator: positive value (pos.) is the average of the all pixels with a positive trend; negative (neg.) is the average of the all pixels with a negative trend; mean value is the average of the all pixels; ∆ NDVI/year is calculated the same as % NDVI change but from the absolute change maps.
ISRIC Report 2007/04

Land Degradation and Improvement in Cuba 43
d
b
c
a
Figure A1. Annual minimum NDVI 1981-2003: mean (a), trends (b – percentage, c – absolute, d confidence levels)
ISRIC Report 2007/04

44 Land Degradation and Improvement in Cuba
d
b
c
a
Figure A2. Annual maximum NDVI 1981-2003: pattern (a), trends (b - percentage, c – absolute d - confidence levels)
ISRIC Report 2007/04

Land Degradation and Improvement in Cuba 45
d
b
c
a
Figure A3. Max-min NDVI 1981-2003: pattern (a), trends (b - percentage, c – absolute, d - confidence levels)
ISRIC Report 2007/04

46 Land Degradation and Improvement in Cuba
ISRIC Report 2007/04
c
a
d
b
Figure A4. Mean NDVI 1981-2003: pattern (a), trends (b - percentage, c – absolute, d - confidence levels)

Land Degradation and Improvement in Cuba 47
d
b
c
a
Figure A5. Annual sum NDVI 1981-2003: pattern (a), trends (b – percentage, c – absolute, d - confidence levels)
ISRIC Report 2007/04

48 Land Degradation and Improvement in Cuba
d
b
c
a
Figure A6. NDVI standard deviation 1981-2003: pattern (a), trends (b - percentage, c – absolute, d - confidence levels)
ISRIC Report 2007/04

Land Degradation and Improvement in Cuba 49
ISRIC Report 2007/04
d
b
c
a
Figure A7. NDVI coefficient of variation 1981-2003: pattern (a), trends (b - percentage, c – absolute, d - confidence levels)

ISRIC - World Soil Information is an independent foundation with a global mandate, funded by the Netherlands Government. We have a strategic association with Wageningen University and Research Centre. Our aims: - To inform and educate - through the World Soil Museum, public information, discussion
and publication - As ICSU World Data Centre for Soils, to serve the scientific community as custodian
of global soil information - To undertake applied research on land and water resources.