land degradation risk assesment with remote sensing presentation
TRANSCRIPT

Land degradation risk monitoring with remote
sensing
Institute of agroecology and natural management
National University of Kyiv-Mohyla Academy
Tetyana Kuchma [email protected]

fragmentation of landscapes Lack of water protection zones and shelterbelts Plow to the boundary of forest and water bodies
Climate change mitigation requires the improvement of technologies to reduce the risks of
land degradation, especially in regions with deficient landscape structure and erodibility risk
Land degradation risk 2
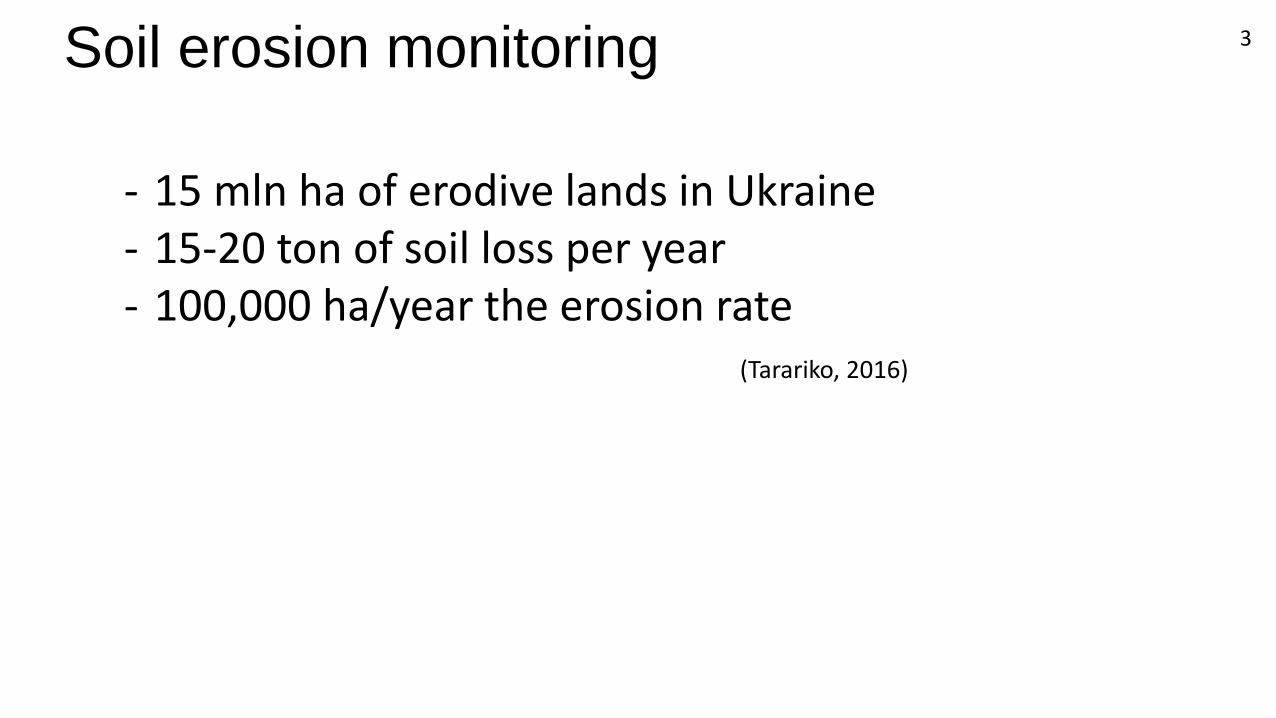
Soil erosion monitoring
- 15 mln ha of erodive lands in Ukraine - 15-20 ton of soil loss per year - 100,000 ha/year the erosion rate (Tarariko, 2016)
3

Soil erosion monitoring
Legend
soil samples
soil class 1 (chornozem clayey)
soil class 2 (chornozem normal)
soil class 3 (chornozem on granites)
soil class 4 (chornozem on sand)
soil class 5 (meadow soils)
Humus
-1,5 - 2,03
2,04 - 2,87
2,88 - 3,5
3,51 - 4,09
4,1 - 5,43
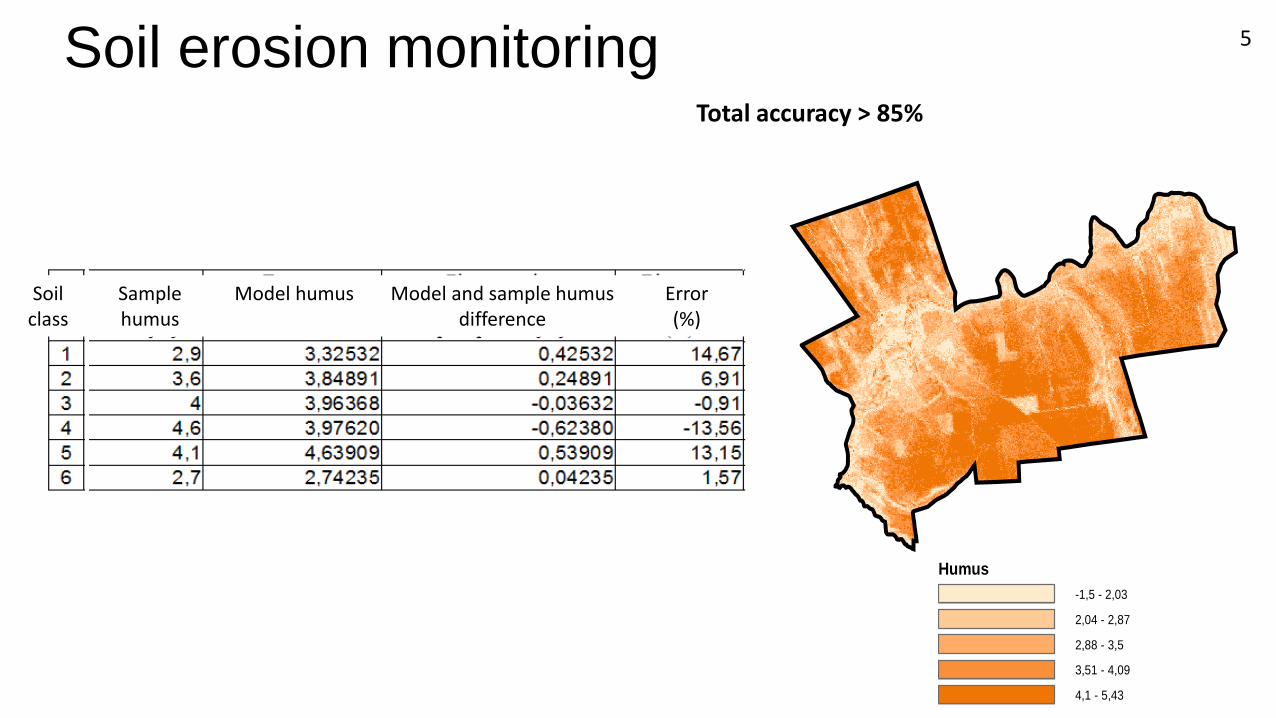
Multiple regression analysis of humus samples and reflection combination (Landsat-8, 11 bands) for different soil types
4
Soil erosion monitoring
Humus
-1,5 - 2,03
2,04 - 2,87
2,88 - 3,5
3,51 - 4,09
4,1 - 5,43
Sample humus
Model humus
Model and sample humus difference
Soil class
Error (%)
5
Total accuracy > 85%

Soil erosion monitoring
vegetation
soil erodibility
very high
high
moderate
low
Soil erodibility risk assessment and recommendations development for crop structure and land use management
• development of contour reclamation project (forestbelts and terraces development)
• exclusion the lands with very high soil erodibility from intensive agriculture
6

Soil erosion monitoring Soil erodibility risk assessment and recommendations development
Сontour reclamation project (Tarariko, 1990), decreasing a soil erodibility risk and crop condition according to the field observation
7

Soil moisture monitoring
Soil moisture data is essential for planning agricultural activities, crop condition monitoring and drought prediction. InSAR remote sensing technology offers a means of measuring surface soil moisture, however temporal and spatial data resolution is crucial for effective remote sensing soil moisture data integration in decision making. NASA SMAP mission provides volumetric measurement of water content in surface soil with three day revisit time producing to the wide number of time series with global coverage.
8

Soil moisture monitoring
0
0,1
0,2
0,3
0,4
0,5
0,6
0 10 20 30 40 50 60
R = 0,66
Precipitation, mm
Soil
mo
istu
re, c
m3
/cm
3
Comparison of soil moisture map, obtained from SMAP data and ground measurements of precipitation from gauging stations (Ukrainian Hydrometcenter)
9

Soil moisture dynamic in Kyiv region
Data product time series were developed for the vegetation period (May– September 2016)
Soil moisture monitoring
0
0,05
0,1
0,15
0,2
0,25
0,3
0,35
0,4
12
.05
.201
6
19
.05
.201
6
26
.05
.201
6
02
.06
.201
6
09
.06
.201
6
16
.06
.201
6
23
.06
.201
6
30
.06
.201
6
07
.07
.201
6
14
.07
.201
6
21
.07
.201
6
28
.07
.201
6
04
.08
.201
6
11
.08
.201
6
18
.08
.201
6
25
.08
.201
6
01
.09
.201
6
soil moisture dynamic
Since the loss of radar of SMAP satellite there are only low spatial resolution data products of 40 km is available from SMAP radiometer.
Dry soils are observed since 20th of June, 2016
10

Soil moisture monitoring
L3_SM_40km Gridded Radiometer Brightness Temperature / Soil Moisture and Sentinel-1A images were used to merge with Sentinel-1 Radar data > 70 % accuracy based on SMAP 9-km soil moisture L3 GRID
Combined use of Sentinel-1 and SMAP data for soil moisture mapping
11

Conclusions
• Need for continuous monitoring using common and clear for agrarians land degradation indicators at national level
• Need for recommendations development and scenario modelling algorithms to mitigate land degradation at local level
12

Thank you for your attention Tetyana Kuchma, PhD
Oleshky Sands, one of the largest European desert (>160 km2)