land environments of new zealand: a technical guide
TRANSCRIPT

Land Environments ofNew Zealand:
A Technical Guide


John LeathwickFraser MorganGareth WilsonDaniel RutledgeMalcom McLeodKirsty Johnston

Copyright NoticeCopyright © Ministry for the Environment 2002.All rights reserved. Except for purposes authorised under the Copyright Act 1994, no
part of this publication may be reproduced or transmitted in any form or by any means,electronic or mechanical, including photocopying, recording or any information storageand retrieval system, without the written permission of the publisher.
DisclaimerThe authors and publishers have endeavoured to ensure that the information
contained in this publication is accurate and up-to-date at the date of publication.Neither the publishers nor the authors accept any responsibility for any errors oromissions or for the results of any actions taken in reliance on the contents of thispublication. The authors and publishers expressly disclaim any and all liability for anyloss or damages, whether direct, indirect or consequential, arising from anything done oromitted to be done based wholly or in part on the contents of this publication.
For further information on the environmental classification system described in thispublication, please contact Landcare Research New Zealand Limited, Private Bag 3127,Hamilton, New Zealand, www.landcareresearch.co.nz.
Photo Credits (Cover)Front, back right: Lloyd Homer, reproduced under licence from the Institute of
Geological and Nuclear Sciences Ltd.
Back left: Gareth Wilson.
ESRI, ArcView® Spatial Analyst, Avenue™, ArcGIS™, and ArcView® GIS 3.2 aretrademarks, registered trademarks, or service marks of ESRI in the United States, theEuropean Community, or certain other jurisdictions. Copyright © 2002 ESRI. AllRights Reserved.
Book Design: Errol McLearyTypesetting: Jetset Design, Hamilton

Authors
John Leathwick is a forest ecologist at Landcare Research, Hamilton, with a particularinterest in New Zealand’s forest pattern. After working at the Forest Research Instituteat Rotorua from the early 1980’s he transferred to Landcare Research when CrownResearch Institutes were established in 1992. John has led the development of this landenvironments classification from its inception and contributed the technical chapters forthis volume.
Fraser Morgan is a GIS/Spatial Analyst with broad interests in spatial modelling, 3Dvisualization and internet mapping. Fraser contributed to the development of theanalyses behind the LENZ classification, the preparation of statistical summaries and thecreation of the companion website. His major tasks have been leading the preparation ofthe Technical Guide and writing the environment descriptions.
Gareth Wilson is a spatial ecologist/GIS analyst with interests in ecological and resourcemanagement, environmental impacts, and biotic patterns. Gareth’s responsibilities in thisproject included generating the underlying spatial data and the LENZ classificationlayers, production of maps, graphics and 3D images, and preparation of the case studies.
Daniel Rutledge is an ecologist with interests in broad-scale ecological questions relatedto landscape dynamics, biodiversity conservation and sustainability, and in modelingecological systems. Daniel contributed substantially to the preparation of both volumesthrough his role both in overseeing and contributing to the development, external review,and revision of text and graphical material.
Malcolm McLeod is a soil scientist who worked for the Department of Scientific andIndustrial Research (DSIR) before joining Landcare Research at its inception. He hasparticular interests in the mapping and description of soils, including use of newtechnologies such as remotely sensed data. Malcolm led the development of the GISlayers describing soil attributes used in the land environments classification.
Kirsty Johnston is a senior policy analyst with the Ministry for the Environment whereshe has played a leading role in the development of their Environmental PerformanceIndicators Programme. Her major contributions to LENZ have been the management ofinteractions between the Ministry and Landcare Research, and championing the use ofspatial classifications as tools for environmental monitoring and reporting.

AcknowledgementsA wider acknowledgement of the numerous people who contributed to the overall
development of LENZ is provided in Land Environments of New Zealand, the companionvolume to this Technical Guide.
The text and graphics for this volume benefited greatly from comments provided byMurray Jessen, Bill Lee, Ian Lynn, Diederik Meenken, Shona Myers, David Norton,Colin O’Donnell and Robyn Reid. Anne Austin provided us with a thorough editorialcritique and David Hunter assisted with the preparation of many of the graphics. TraceyBorgfeldt of David Bateman provided invaluable guidance and advice on the preparationof the material for this volume.
ContentsChapter One Introduction 1Chapter Two The underlying data layers 3Chapter Three Creation of LENZ 32Chapter Four The LENZ Environments Levels II — IV 41
A - Northern Lowlands 46B - Central Dry Lowlands 56C - Western and Southern North Island Lowlands 68D - Northern Hill Country 74E - Central Dry Foothills 81F - Central Hill Country and Volcanic Plateau 88G - Northern Recent Soils 99H - Central Sandy Recent Soils 108I - Central Poorly Drained Recent Soils 115J - Central Well-drained Recent Soils 124K - Central Upland Recent Soils 131L - Southern Lowlands 139M- Western South Island Recent Soils 148N - Eastern South Island Plains 155O - Western South Island Foothills and Stewart Island 166P - Central Mountains 174Q - Southeastern Hill Country and Mountains 185R - Southern Alps 193S - Ultramafic Soils 198T - Permanent Snow and Ice 204
Chapter Five Using LENZ 208Case Study One - Loss of Indigenous Ecosystems 215Case Study Two - Loss and fragmentation of ecosystems 219Case Study Three - Restoration of a degraded ecosystem 223Case Study Four - Setting priorities for international
biosecurity screening 227Case Study Five - Predicting pest distributions within
New Zealand 230Case Study Six - Finding sites suitable for crops 233
Endnotes 235

Introduction
1
CHAPTER ONEIntroductionWHAT IS LAND ENVIRONMENTS OF NEW ZEALAND?
This Technical Guide and a parallel volume, Land Environments of New Zealand,describe an environmental classification of New Zealand that is designed toprovide a framework for addressing a range of conservation and resource
management issues. This classification has been produced by Landcare Research withfunding and support from the Ministry for the Environment. While the role of LandcareResearch staff in this project reflects their interests in providing robust tools forconservation management, the objectives of the Ministry for the Environment focusmore on the provision of tools to underpin indicator-based monitoring of the state ofNew Zealand’s environment.
In large measure, the production of Land Environments of New Zealand (or LENZ)reflects a wider global trend towards ecosystem-oriented approaches to resourcemanagement. In New Zealand, this trend is evident in the prominence given toecosystems and their integrated management in legislation such as the Environment Act(1986) and the Resource Management Act (1991). The New Zealand Department ofConservation is also embracing this trend through their development of an overarchingnatural heritage framework to facilitate more robust and accountable management of theassets for which it is responsible. Chapter One of Land Environments of New Zealandcontains a more extended discussion of related conceptual issues and the consequent needfor ecosystem-based classifications of New Zealand’s landscapes.
Distinctive Features of LENZTwo main features distinguish LENZ from previous ecological classifications of New
Zealand. The first of these is its use of numerical data layers describing various aspects ofNew Zealand’s climate, landforms and soils. These variables were selected using resultsfrom an extended study of relationships between New Zealand’s forest pattern andenvironment. This involved use of an extensive set of plot data describing forestcomposition, which was coupled with estimates of climate derived from long-termmeteorological station data, and soil attributes derived mostly from the New ZealandLand Resource Inventory. In a series of analyses, the environmental variables used topredict forest pattern were progressively refined, allowing a final set of variables for usein LENZ to be chosen on both functional and statistical grounds. Chapter Two of LandEnvironments of New Zealand discusses these variables in-depth and why they wereselected, while Chapter Two of this volume describes the methods used to derive eachvariable and their consequent reliability. The rationale for focussing on variables relevantto forest trees and the resulting implications for using LENZ with other biotic groups areaddressed in Chapters Three and Five of this volume.
The second point of difference between LENZ and previous classifications of NewZealand landscapes is its use of a computerised classification procedure that is described

Introduction
2
in Chapter Three of both Land Environments of New Zealand and this volume. Oneimportant feature of classifications defined using this approach is their ability to identifysimilar environments, including small distinctive environments that are otherwise easilyoverlooked, regardless of their geographic location. Other benefits stem from thehierarchical nature of such classifications, which allows results to be displayed at widelyvarying levels of detail, in turn facilitating their use over a wide range of map scales (inthis case 1: 5 000 000 to 1: 50 000). While the classification can be viewed at varying levelsof detail, LENZ is presented at four standard levels of classification detail (I-VI) thathave been selected for documentation, these containing 20, 100, 200 and 500environments nationally. Detailed descriptions of Level I environments are contained inChapter Four of Land Environments of New Zealand, while the remaining levels aredescribed in Chapter Four of this volume.
Case StudiesTo encourage uptake by conservation and resource managers, case studies are
presented that demonstrate practical applications of LENZ. The cases studies address arange of resource management issues including loss and fragmentation of indigenousecosystems, ecological restoration of degraded sites, assessment of biosecurity risks bothwithin and outside New Zealand, and the identification of sites having suitable climatesfor high value crops. Chapter Five of Land Environments of New Zealand containsdetailed descriptions of the case study results, while Chapter Five of this volume providesbroader guidelines for the use of LENZ and its underlying data layers, and outlines themethods used to develop the case studies and any corresponding technical issues. Theapplications presented were developed using ESRI®’s ArcView® 3.2 and itsaccompanying Spatial Analyst extension; however, any geographic information systemcapable of raster processing could be used to produce similar results.
Availability of LENZIn contrast to previous classifications, LENZ is designed primarily for electronic use;
Land Environments of New Zealand and this volume are currently its only printedproducts. This development is made possible by both the enormous growth in the powerof desktop computers and the increasing availability of user-friendly geographicinformation systems. Together, these allow the flexible and powerful combination ofgeographic data from a wide range of sources, in turn enabling managers to quicklyassemble custom maps to expedite a range of management activities as illustrated inChapter Five. For details concerning the availability of LENZ contact:
For details concerning the availability of LENZ contact:Landcare Research, Private Bag 3127, HamiltonPh: +64-7-858 3700, [email protected]
For information about the Ministry for the Environment’s use of LENZ in environmentalreporting or policy work contact:
Ministry for the Environment, PO Box 10 362, WellingtonPh: +64-4-917 7400

3
The underlying data layers
CHAPTER TWOThe underlying data layers
INTRODUCTION
This chapter describes the environmental layers used in the creation of LENZ,including technical definitions of the various layers, methods used to createthem, and assessments of their accuracy. Chapter Two of Land Environments of
New Zealand provides a broader discussion of both our rationale for choosing them andtheir individual effects on biological distributions.
THE LENZ CLIMATE LAYERSLack of reliable climate data at sites remote from meteorological stations has often
frustrated the ability of ecologists to relate their observations of species distributions toclimate factors such as temperature, solar radiation and rainfall. In the absence of suchdata, many studies have used measures of geographic location such as latitude andelevation as surrogates for climate. Substantial progress has been made over the last twoto three decades in the development of techniques for interpolating climate statistics,mainly through use of mathematical surfaces fitted to meteorological station data.1 Thishas in turn made it much easier to estimate reliably climate parameters for ecologicalstudies at sites distant from meteorological stations, and enables indirect measures such aslatitude and elevation to be replaced with explicit data describing climatic factors that aredirectly relevant to biota.
All seven climate layers used in LENZ were derived either directly or indirectly frommathematical surfaces (thin-plate splines) that use information about the climate,location and elevation of a number of meteorological stations. Locations are describedeither in terms of their latitude and longitude or their coordinates on a map projectionsuch as the New Zealand Map Grid (NZMG). Each surface is calculated using a processin which data values for each climate station are omitted in turn and its climate ispredicted from the surrounding stations. This process is repeated until no furtherimprovement can be made to the fit of the surface to the raw data. Surfaces can besimultaneously fitted to up to 12 variables, typically monthly data for various climateparameters, e.g., monthly estimates of temperature or rainfall. An important measurederived from this process is the generalised cross validation (GCV) that indicates theaverage deviation of the actual station values from those predicted from the surroundingstations. This provides a robust measure of the overall fit of the surface to the underlyingdata.
In some cases, the fit of a surface can be improved through use of additionalinformation that is relevant to the variable being predicted. For example, in creatingvapour pressure deficit and rainfall surfaces for New Zealand, a measure of east-westtopographic protection derived by analysis of a national digital elevation model(D. Giltrap, unpublished data) was used. Similarly, when fitting the solar radiation

4
The underlying data layers
surface, measurements of humidity were used as an indicator of cloudiness, substantiallyimproving its generalised cross validation values.
Once the surface has been fitted, predictions can be made for any point of knownlocation and elevation. For example, coupling the surface with a digital elevation model,a regular grid of elevation values, allows the generation of digital climate maps as used inthe creation of LENZ. Finally, maps that show the standard errors of the predictedvalues can be derived using results from more sophisticated analyses of the errorsassociated with the climate surfaces.2
The majority of the climate station data used in the development of our climatesurfaces were derived from summaries of climate observations published by the NewZealand Meteorological Service.3 Temperature and rainfall data were collected over theperiod from 1950 to 1980, while data describing humidity and solar radiation consisted ofaverages of all data collected up until 1980. Some additional short-duration records ofrainfall, including information from storage rain gauges, were used to describegeographic variation in high-rainfall mountainous areas of the South Island. Details ofany other processing required to create the LENZ climate layers, either before or afterfitting the climate surfaces, are described in the following sections.
Mean annual temperatureThe LENZ layer describing mean annual temperature was derived directly from a
thin-plate spline surface fitted to data from 300 meteorological stations. Followingconventions used in the calculation of climate summary statistics, the values used to fitthe surface consisted of the mean of the 12 monthly averages for daily averagetemperature. Standard errors about the predictions are mostly less than 0.35ºC, but errorsgenerally increase with increasing elevation (Fig. 2.1), reflecting the paucity of climaterecords from montane environments.
Table 2.1: Annual temperature statistics
Number of data points 300
Period over which climate data collected 1950–1980
Predictor variables NZMG coordinates, elevation
Meteorological station data – mean 12.03 ºC
– standard deviation 2.03 ºC
Generalised cross validation statistic 0.42 ºC
LENZ data layer – mean 10.1 ºC
– range -6.9–16.2 ºC
– standard deviation 2.9 ºC

5
The underlying data layers
Figure 2.1: Geographic variation in the standard errors of the predictions of mean annualtemperature used in LENZ. Triangular symbols indicate the locations of themeteorological stations used in fitting the climate surface.

6
The underlying data layers
Number of data points 346
Period over which climate data collected 1950–1980
Predictor variables NZMG coordinates, elevation
Meteorological station data – mean 2.51 ºC
– standard deviation 2.92 ºC
Generalised cross validation statistic Average for 12 months – 0.86 ºC
GCV for July – 1.00 ºC
LENZ data layer – mean 0.86 ºC
– range -9.6–10.2 ºC
– standard deviation 3.0 ºC
Mean minimum temperature of the coldest monthEstimates of the mean minimum temperature in July, the coldest month of winter,
were derived from a surface fitted to monthly estimates of mean daily temperatures. Thegeneralised cross validation errors for this surface are higher than for the annualtemperature surface, reflecting the greater difficulty in predicting minimumtemperatures, which are more sensitive to local topographic effects during nocturnaltemperature inversions. Such effects reach a maximum in winter, as reflected in the highGCV value for July minimum temperatures. As a consequence of these difficulties,standard errors associated with predictions of minimum winter temperatures (Fig. 2.2)are also higher than for mean annual temperature but show similar geographic variation.
Table 2.2: Minimum temperature statistics

7
The underlying data layers
Figure 2.2: Geographic variation in the standard errors of the predictions of mean minimumtemperature of the coldest month used in LENZ. Triangular symbols indicate thelocations of the meteorological stations used in fitting the climate surface.

8
The underlying data layers
Mean annual solar radiationDevelopment of surfaces for annual and monthly solar radiation required
substantially more data preparation than for the other climate surfaces, reflecting thesmall number of stations at which solar radiation has traditionally been measured.Monthly estimates of average daily solar radiation to 1980 were available for 22meteorological stations, but measurements of sunshine hours were available for a total of98 stations, including 18 of the stations for which solar radiation measurements wereavailable.
To extract as much information as possible from these data, a surface was fitted firstthat predicted for each month the ratio of solar radiation reaching the earth’s surface tothat reaching the top of the atmosphere, with the latter calculated from solar geometryequations. In fitting this surface, only the 18 data points where measurements were madeof both solar radiation and sunshine hours were used. In addition to NZMG coordinates,it used as an additional predictor the ratio of measured sunshine hours for each month tothe maximum possible sunshine hours given no cloud. This surface was then used toestimate the monthly solar radiation received at each of the 80 sites for whichmeasurements of sunshine hours alone were available.
Using a total of 98 sites for which solar radiation data were either measured directlyor estimated from sunshine hours, surfaces predicting annual and monthly solarradiation were then fitted. In fitting similar surfaces in Australia, rainfall data has beenused as a surrogate measure of cloudiness to improve the fit of the surface to theunderlying data.4 When this approach was tried with New Zealand data it was found todegrade rather than improve the surface fit. After exploring alternative predictors, it wasfound that data describing monthly humidity5 substantially improved the surfacepredictions in all months. This also increases the local accuracy of the surface predictions,as the number of meteorological stations used to fit the humidity surface is more thanthree times greater than the number of sites used to fit the solar radiation surface.
Standard errors of the predictions of mean annual solar radiation (Fig. 2.3) are mostlyless than 0.25 MJ/m2/day but increase in the southwest of the South Island and about EastCape.
Table 2.3: Annual solar radiation statistics
Number of data points 98
Period over which climate data collected Averages to 1980
Predictor variables NZMG coordinates, humidity
Meteorological station data – mean 14.2 MJ/m2/day
– standard deviation 0.95 MJ/m2/day
Generalised cross validation statistic 0.36 MJ/m2/day
LENZ data layer – mean 13.9 MJ/m2/day
– range 11.5 – 15.5 MJ/m2/day
– standard deviation 0.93 MJ/m2/day

9
The underlying data layers
Figure 2.3: Geographic variation in the standard errors of the predictions of mean annualsolar radiation used in LENZ. Triangular symbols indicate the locations of themeteorological stations used in fitting the climate surface.

10
The underlying data layers
Winter solar radiationEstimates of winter solar radiation across New Zealand were derived from a surface
fitted to monthly solar radiation estimates for 98 sites as described for annual solarradiation. Winter solar radiation reaches a minimum in June, the month when the sun islowest in the sky and day lengths are at their shortest. Standard errors for predictions ofwinter solar radiation (Fig. 2.4) are higher than for annual solar radiation, with highestvalues occurring on the South Island’s West Coast and about Wellington.
Table 2.4: Winter solar radiation statistics
Number of data points 98
Period over which climate data collected Averages to 1980
Predictor variables NZMG coordinates, humidity
Meteorological station data – mean 5.6 MJ/m2/day
– standard deviation 0.92 MJ/m2/day
Generalised cross validation statistic 0.20 MJ/m2/day
LENZ data layer – mean 4.61 MJ/m2/day
– range 2.7–7.1 MJ/m2/day
– standard deviation 0.93 MJ/m2/day

11
The underlying data layers
Figure 2.4: Geographic variation in the standard errors of the predictions of mean wintersolar radiation used in LENZ. Triangular symbols indicate the locations of themeteorological stations used in fitting the climate surface.

12
The underlying data layers
October vapour pressure deficitEstimates of the vapour pressure deficit for each month were derived from
measurements of humidity and temperature made at 287 meteorological stations.Calculation of the vapour pressure deficit first required estimation of the temperature at0900 hours, the time at which humidity measurements are made. This was calculatedfrom the measured mean daily minimum and maximum temperatures for each monthusing a function that simulates the temperature course through the day.6 The estimatedtemperature at 0900 hours was then used to calculate the saturation water vapourpressure (e)7 , which indicates the maximum amount of water vapour able to be held inthe air given its temperature. As the relative humidity (RH) indicates the percentage ofthis maximum that is actually occupied, the vapour pressure deficit (ðe) can then becalculated as
Vapour pressure deficits in October were used in LENZ as this is the month whenwesterly winds are generally most persistent, resulting in strong geographic variation invapour pressure deficits across New Zealand. Standard errors associated with predictionsof October vapour pressure deficits (Fig. 2.5) are mostly less than 0.05 kPa but increase athigher elevation, particularly in the South Island.
Table 2.5: Vapour pressure deficit statistics
100 — RH100
Number of data points 287
Period over which climate data collected Averages to 1980
Predictor variables NZMG coordinates, topography, elevation
Meteorological station data – mean 0.39 kPa
– standard deviation 0.09 kPa
Generalised cross validation statistic Average for 12 months – 0.057 kPaOctober – 0.053 kPa
LENZ data layer – mean 0.33 kPa
– range 0.0–0.66 kPa
– standard deviation 0.12 kPa
ðe = x e

13
The underlying data layers
Figure 2.5: Geographic variation in the standard errors of the predictions of October vapourpressure deficits used in LENZ. Triangular symbols indicate the locations of themeteorological stations used in fitting the climate surface.

14
The underlying data layers
Annual water deficit and monthly water balance ratioThree sets of 12 monthly climate estimates were used to calculate geographic
variation in annual water deficits and monthly water balance ratios across New Zealand.These were derived from surfaces fitted to monthly data describing daily averagetemperature, daily solar radiation and monthly rainfall. The rainfall surface was fittedusing NZMG coordinates, elevation, and a model describing relationships betweentopography and westerly winds. Having derived the 36 input climate layers, an empiricalmodel8 was first used to calculate the monthly potential evaporation from the monthlyestimates of solar radiation and temperature. These estimates of evaporation were thencompared with the monthly rainfall estimates. Where the rainfall exceeded evaporation,the monthly deficit was assumed to be zero, but where monthly evaporation exceededmonthly rainfall, the shortfall was accumulated through the year to derive an estimate ofthe annual water deficit. To calculate the monthly water balance ratio, the ratio ofrainfall to evaporation was computed for each month, and then the average of thesetwelve ratios was calculated. Because of conceptual difficulties in combining the errors ofthe contributing surfaces, no estimates have been made of the likely errors associatedwith the resulting water deficit and water balance ratio layers. Because of the alternativemethod used to fit a surface to the large number of data points used to fit the rainfallsurface (Fig. 2.6), it was not possible to map spatial estimates of uncertainties associatedwith the estimates of rainfall, although GCV values (Table 2.6) indicate that these aretypically around 10% of the monthly mean rainfall. Errors for the temperature and solarradiation surfaces are illustrated in the previous descriptions of temperature and solarradiation layers.
It should be noted that this approach to calculating water deficits could be extendedby calculating losses of water by evaporation and inputs from rainfall on a daily basisand/or by making allowance for the buffering effects of soil water storage.9 Although useof such models would be desirable in LENZ, given their greater precision, they requiremore reliable descriptions of soil attributes than are currently available. They are alsomuch more computationally demanding than the model used here. Furtherimprovements could also be made by taking account of the effects of geographicvariation in vegetation cover on both the interception of rainfall and the evaporation ofwater. In this case, a choice would have to be made between using a description ofcurrent vegetation cover or of potential vegetation cover, i.e. that expected in the absenceof human modification.

15
The underlying data layers
Table 2.6: Water deficit and water balance ratio statistics
Number of data points Solar radiation – 98Temperature – 346Rainfall – 2202
Period over which climate data collected Solar radiation – to 1980Temperature – 1950–1980Rainfall – 1950–1980
Predictor variables Solar radiation – NZMG coordinates,humidityMean temperature – NZMG coordinates,elevationRainfall – NZMG coordinates, topography,elevation
Generalised cross validation statistic Solar radiation – 0.45 MJ/m2/day(average of 12 monthly values) Temperature – 0.50 ºC
Rainfall – 16.7 mm
LENZ data layer – mean Annual water deficit – 36.2 mmMonthly water balance ratio – 4.73
– range Annual water deficit – 0–396 mmMonthly water balance ratio – 0.6–48.8
– standard deviation Annual water deficit – 56.9 mmMonthly water balance ratio – 4.15

16
The underlying data layers
Figure 2.6: Distribution of rainfall stations underlying the rainfall surface used in the estimationof annual water deficits and monthly water balance ratios. Shading shows variationin mean annual rainfall.

17
The underlying data layers
THE LENZ SLOPE LAYERThe slope data layer used in LENZ was created from a 25-metre digital elevation
model (DEM) fitted to 20-m digital contour data derived from New Zealand’s NZMS260 map series using in-house software developed at Landcare Research. All contourswere originally derived photogrammetrically from stereo photographs for final mapreproduction at a scale of 1: 50 000. Additional intermediate contours and spot heightswere used in generating the DEM where available, while coastlines and shorelines (forlakes greater than 10 ha in extent) were used to constrain the DEM surface around waterbodies. The linear interpolation method used to create the DEM threads contoursthrough the cells before interpolation so that any cell intersected by a contour will begiven the elevation value of that contour, leading to a high percentage of cells withelevations that are multiples of 20 or 10 in steep areas.
The accuracy of the DEM was assessed using over 2500 independent geographicpositioning system (GPS) data points (Landcare Research unpublished data) taken fromlocations throughout the South Island. All GPS data were collected using a Trimble ProXL system, post-processed to (nominally) sub-metre accuracy in all three dimensions.Results of this analysis indicate a mean elevation error for the DEM of 0.41 m andstandard error of 6.13 m (Landcare Research unpublished data).
Because of storage limitations, the slope layer was created from an integer version ofthe DEM. Smoothing of the DEM followed by storage of the resulting layer as realnumbers would have reduced the number of slope artefacts created by the 1 m steps inthe integer DEM, particularly in extensive areas of low slope, but the working data layerswould have required substantially more disk storage than was available.
An initial slope layer was produced from a filtered DEM layer in which a 5 x 5 cellaveraging filter was used to provide a smoothed elevation surface. A selective filteringprocedure was then used in which values on this smoothed surface were first convertedfrom degrees to dy/dx tangent values, expanding the slope scale on low slopes. Thistransformed layer was also subject to a 5 x 5 cell averaging filter, with greatest filteringoccurring in areas of low slope. Finally, the filtered layer was converted back to degreesand a bilinear interpolation filter was used to resample the 25 m slope layer to 100 mresolution. Both the 25 m and 100 m slope layers are stored as integers, i.e. they recordslopes rounded to the nearest degree. No assessment has been made of the errorsassociated with the slope layer.
Table 2.7: Slope statistics
LENZ data layer – mean 12.2 º
– range 0–67 º
– standard deviation 10.9 º
18
The underlying data layers
THE LENZ SOIL LAYERS
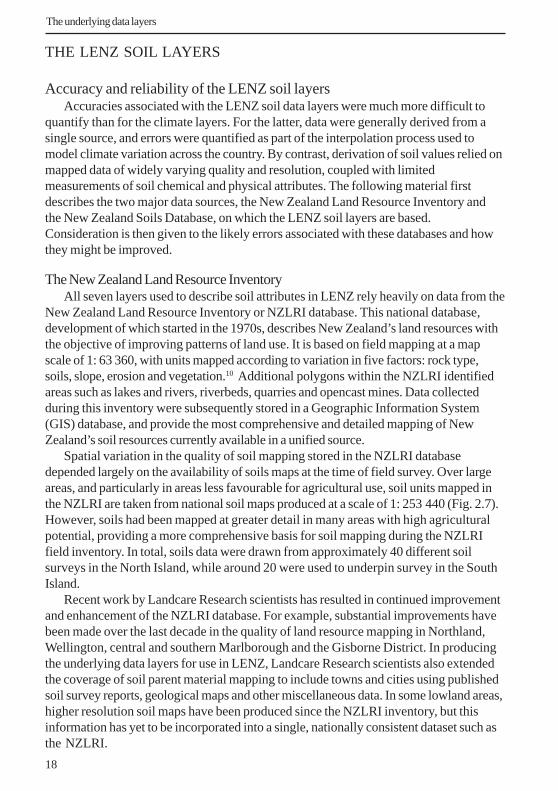
Accuracy and reliability of the LENZ soil layersAccuracies associated with the LENZ soil data layers were much more difficult to
quantify than for the climate layers. For the latter, data were generally derived from asingle source, and errors were quantified as part of the interpolation process used tomodel climate variation across the country. By contrast, derivation of soil values relied onmapped data of widely varying quality and resolution, coupled with limitedmeasurements of soil chemical and physical attributes. The following material firstdescribes the two major data sources, the New Zealand Land Resource Inventory andthe New Zealand Soils Database, on which the LENZ soil layers are based.Consideration is then given to the likely errors associated with these databases and howthey might be improved.
The New Zealand Land Resource InventoryAll seven layers used to describe soil attributes in LENZ rely heavily on data from the
New Zealand Land Resource Inventory or NZLRI database. This national database,development of which started in the 1970s, describes New Zealand’s land resources withthe objective of improving patterns of land use. It is based on field mapping at a mapscale of 1: 63 360, with units mapped according to variation in five factors: rock type,soils, slope, erosion and vegetation.10 Additional polygons within the NZLRI identifiedareas such as lakes and rivers, riverbeds, quarries and opencast mines. Data collectedduring this inventory were subsequently stored in a Geographic Information System(GIS) database, and provide the most comprehensive and detailed mapping of NewZealand’s soil resources currently available in a unified source.
Spatial variation in the quality of soil mapping stored in the NZLRI databasedepended largely on the availability of soils maps at the time of field survey. Over largeareas, and particularly in areas less favourable for agricultural use, soil units mapped inthe NZLRI are taken from national soil maps produced at a scale of 1: 253 440 (Fig. 2.7).However, soils had been mapped at greater detail in many areas with high agriculturalpotential, providing a more comprehensive basis for soil mapping during the NZLRIfield inventory. In total, soils data were drawn from approximately 40 different soilsurveys in the North Island, while around 20 were used to underpin survey in the SouthIsland.
Recent work by Landcare Research scientists has resulted in continued improvementand enhancement of the NZLRI database. For example, substantial improvements havebeen made over the last decade in the quality of land resource mapping in Northland,Wellington, central and southern Marlborough and the Gisborne District. In producingthe underlying data layers for use in LENZ, Landcare Research scientists also extendedthe coverage of soil parent material mapping to include towns and cities using publishedsoil survey reports, geological maps and other miscellaneous data. In some lowland areas,higher resolution soil maps have been produced since the NZLRI inventory, but thisinformation has yet to be incorporated into a single, nationally consistent dataset such asthe NZLRI.

19
The underlying data layers
Figure 2.7: Geographic scales of underlying soil survey maps used in field survey for the NewZealand Land Resource Inventory.

20
The underlying data layers
Other work has concentrated on the development of a new classification for NewZealand’s soils11 that is based on their observed properties rather than their presumedgenesis as in the preceding national classification. The New Zealand Soil Classificationarranges soils in a hierarchical fashion where the coarsest level distinguishes 15 Orders,while more comprehensive levels describe Groups and Subgroups. All soil units mappedin the NZLRI database have been subsequently allocated to orders, groups andsubgroups in this new classification. Lastly, by drawing on data contained in reportsassociated with the soil surveys underlying the NZLRI inventory, Landcare Researchscientists have assembled an extended range of soil attribute data for all soil units mappedin the NZLRI. This includes descriptions of the physical and chemical attributes of eachsoil along with estimates of data reliability.
The National Soils DatabaseThe National Soils Database (NSD) provided much of the remaining information
used in the development of the LENZ soils layers. This contains results from analyses ofthe chemical and physical properties of soil samples from nearly 1500 sites throughoutNew Zealand (Fig. 2.8). Analyses from sub-soil samples, where effects of fertiliserapplication are generally minimal, provided invaluable descriptions of the naturalfertility of soils formed on different parent materials as described below.
Issues of data reliabilityMany of the problems associated with the inconsistent mapping of soils in the NZLRI
database and the predominance of agricultural soils in the National Soils Database werereduced by using information from underlying soil surveys to group soils according totheir parent material. The following discussion describes more fundamental sources oferror associated with both the core NZLRI data and with the National Soils Database.
The wide variation in map scale and quality of the underlying soil surveys used tounderpin the NZLRI poses perhaps the most serious problem with the LENZ soil layers.Particularly in non-agricultural landscapes, early maps at a scale of 1: 253 440 providedvery limited separation of soils so that significant variation in soil attributes might beencompassed within a single soil class. Although the spatial resolution of LRI units wassignificantly increased compared with the underlying soil mapping, the limited numberof classes in the underlying soil classification placed varying limitations on the ability ofthe LRI field crews to differentiate adequately soils of significantly different character.In one example west of the Alpine Fault in South Westland, soils on small areas of steepgreywacke hill country are mapped as Haast silt loams derived from schist. Although thediscrepancy between the parent material ascribed to this soil and the geology recorded inthe NZLRI could be used to identify and correct such problems, this would requiremanual checking of data from over 100 000 polygons.
A second source of error in the LENZ soil data layers is likely to arise from variationin the size of units mapped in the NZLRI database (Fig. 2.9). In part, this reflects naturalvariation in the spatial scales over which soils vary with some landscapes containing moreinherent variability in soil attributes than others (e.g., parts of the Canterbury andSouthland plains). However, significantly more detail was often mapped in areas with

21
The underlying data layers
Figure 2.8: Locations of National Soils Database soil sample sites.

22
The underlying data layers
potential for agriculture or forestry than on land that had either severe land-uselimitations or was set aside for catchment protection or conservation, reflecting theNZLRI’s objectives of improving land use. Overall, lowest resolution generally occurs inmontane environments with the largest polygons found in the eastern Bay of Plenty.Much smaller polygon sizes have been used in revised NZLRI mapping in areas such asMarlborough and north of Gisborne.
The third source of potential error in the LENZ soil layers arises from a lack ofrequired topographic detail in some of the older NZLRI mapping and reflects the LRI’soriginal production mode of over-printing polygon boundaries onto monochromeversions of one inch to one mile (NZMS 1) topographic maps. As a consequence, manyfeatures such as smaller rivers and lakes were not discriminated by the NZLRI polygonboundaries, as the underlying topographic layer was relied on to indicate their locations.Unfortunately, not all this additional topographic detail was included when the polygonboundaries were captured in an electronic form. Examples of the resulting loss in detailcan be seen throughout the LENZ classification and underlying data layers where riversand small lakes are merged into the surrounding landscape. For example, whileapproximately 30 small lakes are mapped in the Hamilton basin on topographic mapseven at a scale as coarse as 1: 250 000, only two of these are mapped in the NZLRI despiteits finer mapping scale. Similar problems occur with a number of major riversthroughout the country that disappear over parts of their course with the lowermostreaches of the Motueka River, for example, omitted for five kilometres upstream from itsmouth. Here, the required line work is shown on the original field sheets, but wasomitted in the digital version of the NZLRI, presumably because the river wasconsidered too narrow to justify differentiating it from the adjacent land, which sharedthe same classification on both sides of the river.
A fourth source of potential error arises from considerable variation in the quality ofdata sources used in deriving parent material mapping within town and city ‘holes’ in theNZLRI. For this reason, parts of the LENZ classification layers covering towns andcities for which original field-survey based NZLRI mapping was not available should betreated as having lower inherent reliability than the rest of LENZ.
The main problem associated with use of the National Soils Database arises from itsuneven distribution of sample points, and this results in inadequate information beingavailable for many soils. As with the NZLRI, much of the research that led to thecollection of these samples was motivated by a desire to improve agricultural and forestproductivity. Consequently, the geographic distribution of these samples is biasedtowards lowland environments (Fig. 2.10), so that sites with elevations of less than 250 mconstitute less than 40% of New Zealand’s land area but make up nearly 70% of thesamples held in the NSD. The main information gaps are associated with soils ofmontane environments.

23
The underlying data layers
Figure 2.9: Variation in the size of polygons in the New Zealand Land Resource Inventory. Mapvalues show the median polygon size for polygons within one km of each grid cell.

24
The underlying data layers
Figure 2.10: Altitudinal distribution of all land in New Zealand (grey bars) compared with thealtitudinal distribution of soil profile descriptions contained in the New ZealandSoils Database (open bars).
Improving the LENZ soil layersAlthough improving the accuracy of the underlying soil-attribute layers presents a
considerable challenge, separate advances in remote sensing, terrain analysis and statisticsare all likely to assist this process substantially. For example, use of gamma radiometricdata offers considerable promise for mapping soil parent materials,12 while highresolution digital elevation models are capable of providing considerable informationabout topographic variation that in turn controls variation in some soil attributes. Whencoupled with more recent detailed soil mapping and appropriate climate data, such toolsare likely to collectively deliver substantial improvements in both the accuracy andreliability of descriptions of spatial variation in the physical and chemical attributes ofsoils. However, development of such data layers would require significant research effortand ongoing funding to bring together relevant existing data, collect additional data asrequired to fill gaps, and apply recently developed analysis techniques.
This process will also be made substantially more efficient by recently enabled accessto the digital topographic data layers from which New Zealand’s 1: 50 000 topographicmaps are produced.

25
The underlying data layers
Technical definitions of the LENZ soil layers
DrainageThe drainage layer used in LENZ describes the internal drainage of soils. While
earlier definitions of drainage emphasised the speed of removal of water from the soil,13
the scale used in LENZ was developed as part of the diagnostic features used inconjunction with the New Zealand Soil Classification, and was defined in terms of thesoil attributes that develop under different drainage conditions (Table 2.8).14 Spatialvariation in the reliability and lineage of the LENZ drainage estimates is shown inFigures 2.11 and 2.12. Some discrepancies in drainage descriptions may also arise becausemany published assignments used the older drainage scale, and a different assignmentmight be made on the basis of the new soil morphology-based drainage scale. While soilswith very poor to moderate drainage may be described in the Chapter Four descriptionsas ‘very poorly drained’ or ‘moderately drained’, the term ‘well-drained’ is occasionallyused in the environment descriptions to describe a soil with good drainage.
Table 2.8: Drainage classes, their definition and extent
Diagnostic criteria
Having an organic horizon with pale colours due towater-logging in the horizon immediately below
Have pale colours due to water-loggingimmediately below the topsoil
Have pale mottled colours due to water-logging atintermediate depths in the subsoil
Have pale mottled colours due to water-logging atlower depths in the subsoil
Lacking significant mottling or pale colours
Class
Very poor
Poor
Imperfect
Moderate
Good(=well)
Area (%)
2
4
14
22
58
Area (km2)
4884
10,597
36,923
56,999
150,297

26
The underlying data layers
Figure. 2.11: Reliability of drainage estimates as recorded in the NZLRI extended legends. 0 –values occur mostly within the nominated class; 1 – values straddle the class aboveand below; 1- – values straddle the class and the class below; 1+ – values straddlethe class and the class above; 2 – values straddle 2 classes above and below.

27
The underlying data layers
Figure 2.12: Lineage of drainage estimates as recorded in the NZLRI extended legends. m –estimated from measurements on the named soil; r – estimated fromrelationships with other soils – estimate thought to be reliable; u – estimated fromrelationships with other soils – estimate quality unknown; uf – estimated

28
The underlying data layers
Soil FertilityAs described in Land Environments of New Zealand, the four data layers used to
describe soil fertility in LENZ were derived by grouping soils together by their parentmaterial – the surface rock or other material from which the soil develops. This wasnecessary both to derive soil layers that indicate the long-term nutrient status of differentparent materials independent of the modifying effects of climate and to accommodatevariability in the mapping of soils in the NZLRI database. Variation in the numbers ofclasses used for different broad groupings of soil parent materials is shown in Table 2.9.
Table 2.9: Broad parent material groups used in the development of the LENZ soils layers,and their extent
Sedimentary rocks – older, including schist 15 41,001
Sedimentary rocks – Tertiary – non-calcareous 19 32,345
Sedimentary rocks – Tertiary - calcareous 6 7476
Sedimentary rocks – limestone, and marble 10 2069
Intrusive rocks, including gneiss 5 15,867
Volcanic rocks – basaltic and ultramafic 15 7695
Volcanic rocks – andesitic 7 12,397
Volcanic rocks – rhyolitic 9 30,451
Loess 5 19,207
Peat 1 3044
Dune sand 6 4610
Total 129 259,679
Parent material group No. of parent material classes Area (km2)

29
The underlying data layers
Table 2.10: Acid soluble phosphorous classes, their definition and extent
Class Range (mg/100 g) Area (km2)
Very low 0–70 69,958 26.2
Low 7–15 47,917 17.9
Moderate 15–30 107,139 40.1
High 30–60 30,412 11.4
Very high 60–100 4281 1.6
Area (%)
Table 2.11 Exchangeable calcium classes, their definition and extent
Class Range (mg/100 g) Area (km2)
Low 0–10 135,563 50.7
Moderate 1–10 109,584 41.0
High 10–40 12,490 4.7
Very high >40 2070 0.8
Area (%)

30
The underlying data layers
Table 2.12: Induration classes, their definition and extent
Class Definition Area (km2) Area (%)
20,520 7.7
66,105 24.7
26,507 9.9
131,948 49.4
14,627 5.5
Non-indurated
Very weakly indurated
Weakly indurated
Strongly indurated
Very strongly
A specimen disaggregates orslakes within one hour whenplaced in water
A specimen does not slake inwater but can be crushed withthe thumb and forefinger whenwet
A wet test specimen cannot becrushed with the thumb andfinger but fails when subjectedto average body weight appliedslowly with the foot
A wet test specimen can only bebroken when struck a sharpblow with a hammer
Indurated cannot be brokenwhen struck a sharp blow with ahammer
Class Average particle size Area (km2) Area (%)
Table 2.13: Particle size classes, their definition and extent
Silt and clay less than 0.06 mm 65,582 24.5
Sand 0.6–2.0 mm 26,155 9.8
Gravel 2–60 mm 26,868 10.1
Coarse to very coarse gravel 60–200 mm 83,562 31.3
Boulders to massive greater than 200 mm 57,540 21.5

31
The underlying data layers
Table 2.15: Chemical limitations to plant growth—class definitions and their extent
Class Definition Area (km2) Area (%)
Low
Moderate
High
Most soils
Fluid-saline and sandy-salinesulphuric gley soils, saline recentgley soils, saline orthic gley soils,saline gley raw soils, salinefluvial recent soils
Ultramafic soil parent materials
258,722 96.8
641 0.2
339 0.1
Class Definition Area (km2) Area (%)
All NZLRI soil units belongingto the Recent or Raw soil ordersin the New Zealand SoilClassification, but excludingsoils classified as recent becauseof erosion of an original intactsoil
All other NZLRI soil units
Younger
Older
16,210 6.1
243,498 91.1
Chemical limitations to plant growthSoils were classified into three classes based on factors that lead to the accumulation
of chemicals that limit plant growth. Classes were differentiated either by their parentmaterial or by their position in the New Zealand Soil Classification. Although it wouldhave also been desirable to include geothermal soils within this classification, insufficientinformation was available within the NZLRI database to enable this to be implemented.
Table 2.14: Age classes, their definition and extent
Soil ageSoils were classified into two age classes based on their membership in the New
Zealand Soil Classification. This describes soil age using morphological featuresassociated with soil development rather than criteria based on chronological ages. As aconsequence, soils classified as recent in dry cool environments may be much older thanrecent soils from warm, wet environments.
32
Creation of LENZ
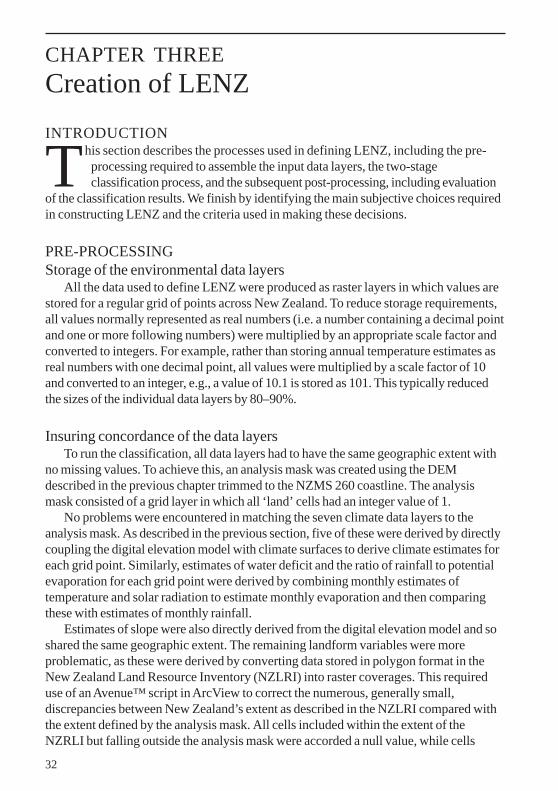
CHAPTER THREECreation of LENZINTRODUCTION
This section describes the processes used in defining LENZ, including the pre-processing required to assemble the input data layers, the two-stageclassification process, and the subsequent post-processing, including evaluation
of the classification results. We finish by identifying the main subjective choices requiredin constructing LENZ and the criteria used in making these decisions.
PRE-PROCESSINGStorage of the environmental data layers
All the data used to define LENZ were produced as raster layers in which values arestored for a regular grid of points across New Zealand. To reduce storage requirements,all values normally represented as real numbers (i.e. a number containing a decimal pointand one or more following numbers) were multiplied by an appropriate scale factor andconverted to integers. For example, rather than storing annual temperature estimates asreal numbers with one decimal point, all values were multiplied by a scale factor of 10and converted to an integer, e.g., a value of 10.1 is stored as 101. This typically reducedthe sizes of the individual data layers by 80–90%.
Insuring concordance of the data layersTo run the classification, all data layers had to have the same geographic extent with
no missing values. To achieve this, an analysis mask was created using the DEMdescribed in the previous chapter trimmed to the NZMS 260 coastline. The analysismask consisted of a grid layer in which all ‘land’ cells had an integer value of 1.
No problems were encountered in matching the seven climate data layers to theanalysis mask. As described in the previous section, five of these were derived by directlycoupling the digital elevation model with climate surfaces to derive climate estimates foreach grid point. Similarly, estimates of water deficit and the ratio of rainfall to potentialevaporation for each grid point were derived by combining monthly estimates oftemperature and solar radiation to estimate monthly evaporation and then comparingthese with estimates of monthly rainfall.
Estimates of slope were also directly derived from the digital elevation model and soshared the same geographic extent. The remaining landform variables were moreproblematic, as these were derived by converting data stored in polygon format in theNew Zealand Land Resource Inventory (NZLRI) into raster coverages. This requireduse of an Avenue™ script in ArcView to correct the numerous, generally small,discrepancies between New Zealand’s extent as described in the NZLRI compared withthe extent defined by the analysis mask. All cells included within the extent of theNZRLI but falling outside the analysis mask were accorded a null value, while cells

33
Creation of LENZ
within the mask but not within the LRI were given the same value as their closestadjacent cell using the Avenue command “nibble”.
Exporting the raster data to PATNApproximately 2.7 million data points are contained in a 100-m resolution raster
layer covering New Zealand — too many to analyse feasibly in PATN1 , the software inwhich the classification was carried out. To make the analysis more tractable, a 25%subset of the occupied data cells was used to define the classification, with these selectedby taking every second cell of every second row.
To overcome the lack of a multi-layer raster export routine in ArcView, software waswritten in C++ and linked to a library provided with Spatial Analyst that allows directaccess to the ESRI grid data structures. Using our New Zealand extent mask as atemplate, data points were systematically selected, their associated values were retrievedfrom the 15 data layers, multiplied by a scale factor where appropriate, and written to atext file consisting of one row of 15 values for each point. This file was then read intoPATN using the DATN module and summaries were produced using the HISTmodule. Finally, the summaries were compared with summaries of the source raster datalayers to insure all values had been transferred correctly.
Transformations before classificationTwo variables that have strongly skewed distributions were mathematically
transformed to prevent the effect of more extreme values dominating their contributionto the analysis outcome. Estimates of monthly water balance were transformed using alog10 transformation, while a square root transformation was used for slope. Both of thesetransformations apply greater compression to values at the higher end of the data range,so that the effect on the classification outcome of the same difference on the scale of theraw data progressively decreases as the value along that scale increases. For example,after transformation, the shift from 1 to 2 degrees on the raw data scale has the sameeffect on the classification as a shift from 15 to 19 degrees or from 30 to 36 degrees. Thisimplies that progression from 1 to 2 degrees on the raw data scale has greater ecologicalsignificance than an equivalent shift on steep slopes, e.g., from 31 to 32 degrees. The logtransformation used for the average monthly water balance estimates has a moredramatic effect in this regard than the square root transformation used for slope, withdifferences in monthly water balance on dry sites given greater weight than the samedifference on wet sites.
THE CLASSIFICATION PROCESSThe large number of grid points used in the classification analysis placed major
constraints on the type of analysis procedure that could be used. Conventionalagglomerative classification techniques operate by defining a triangular matrixdescribing multivariate distances between all possible pairs of sites. Because this results inmemory requirements increasing with the square of the number of points analysed,analyses of more than a few tens of thousands of data points quickly become intractable.

34
Creation of LENZ
To avoid such problems LENZ was defined in two stages. Initially, a non-hierarchicalclassification technique (ALOC/ALOB in PATN) in which memory requirements riseonly linearly with the number of data points, was used to group together points locatedclose to one another in environmental space. The average environmental values of thegroups produced by this procedure can then be used as input to a conventionalagglomerative classification process.
Environmental distanceThe concept of environmental distance is fundamental to the classification process
used to define LENZ. Given two data points, each of which is described by some set ofenvironmental variables, the environmental distance between these points is thedifference in environment, averaged across all environmental variables. Such measuresare widely used in a range of multivariate clustering techniques, and numerous formulaehave been proposed for their calculation.2 In defining LENZ, the environmentaldistance, D, between points j and k, described by a set of variables x1…n , is measuredusing the Gower metric,3 defined as:
In its normal formulation, the range standardisation of each variable implicit in thisdistance measure results in all variables by default having equal weight and thereforeequal influence on the analysis outcome. However, a modified weighting system wasused in defining LENZ in which all seven climate variables and the variables describingslope, drainage, soil age, and chemical limitations were given a weight of one, while thefour soil parent material variables, i.e. phosphorus, calcium, induration, and particle size,were given a weight of 0.25. Values of the metric indicate the mean environmentaldifference between sites expressed as a proportion, e.g., a value of 0.30 indicates thatenvironmental differences between two sites are 30% when averaged across thecontributing variables.
Non-hierarchical classification using ALOBBecause ALOB can define a maximum of 400 groups, the data was split into two
subsets consisting of the North Island and its surrounding inshore islands, and the SouthIsland, Stewart Island, and their surrounding inshore islands. ALOB starts bysequentially reading the data using the first point to start the first group – anysubsequent data points located at a distance greater than a pre-defined threshold distancefrom an existing group(s) are used to start a new group. Decreasing the thresholddistance gives a larger number of groups, while increasing this radius gives a smallernumber of groups. For the South Island, 393 groups were defined using a thresholddistance of 0.0775, i.e. representing an average difference across the environmentalvariables of 7.75% of their respective ranges. The North Island data set was analysedusing the same threshold distance, the slightly reduced number of groups (379) reflectingthe lower environmental diversity of the North Island compared with the South Island.
D = —1n
xij — xik
range (xi)i=1Ý
n.*

35
Creation of LENZ
The analysis for each island then proceeds with its iterative reallocation procedure inwhich each point is tested to see whether it is in the group to which it is most similar,with points moved to a different group if necessary. This process was repeated until lessthan 10 reallocations occurred in any one cycle, taking several days on a largeworkstation.
Hierarchical classificationIn the second stage of the classification, the North and South Island output data sets
from ALOB were combined to form a matrix with 772 groups, and this was classifiedusing a conventional agglomerative clustering procedure. The PATN module GASOwas used to calculate all inter-group distances as this allowed down-weighting of theinfluence of the four parent material variables in the same way as used in ALOB. Oncethe inter-group distances had been calculated, the classification was defined using theflexible UPGMA sorting strategy4 as implemented in FUSE. Following therecommendation of Belbin et al,5 a value for β of -0.1 was used which slightly dilates thedata space. This dilation accentuates inter-group distances as groups become larger,discouraging chaining and the production of large numbers of units of small area. Oneconsequence is that the maximum distance between environments shown on thedendrogram is 1.38 rather than being less than one if a space conserving strategy wasused.
Output from the classification process consisted of a set of group centroids (=averageenvironmental values for the 772 groups), a summary showing the order in which theinput groups were progressively combined to form one large group, and a dendrogramshowing inter-group relationships.
POST PROCESSINGOnce the classification had been defined, there remained the challenge of mapping
the geographic distribution of the environmental groups defined by the non-hierarchicalclassification. This was achieved using purpose written C++ code that calculatedenvironmental distances between each point on the 100 m grid across New Zealand andthe centroids for the 772 environmental groups used in phase two. Each grid point wasthen allocated to the group to which it was most similar with results written to aclassification grid layer for viewing in ArcView.
Results of the hierarchical classification were then summarised to form a table with772 rows and columns, with each row corresponding to an environmental group, andcolumn entries indicating how these groups were progressively joined to form fewer andfewer numbers of groups. This table was then joined to the classification grid layerdescribed in the previous paragraph, allowing the classification to be displayed at anylevel of detail from 772 groups down to one group.
Although such a product is useful in a research context, its continuous variation inclassification detail is less practical in a management setting where classifications aregenerally required at only one to a few standard levels of detail. To identify a standard setof levels, the classification was examined at varying levels of detail and four levels were

36
Creation of LENZ
selected to cover a range of management applications (Table 3.1). These contain 20, 100,200 and 500 groups or environments respectively, with the most general classificationintended primarily for applications at a national level and at broad spatial scales, whilethe most detailed level is more suited to local-scale applications. Names for the groups or‘environments’ identified at each level are constructed from combinations of upper andlower case letters and numbers (Table 3.1). For example, upper case letters (A-T) areused to identify the 20 environments of Level 1, while a number is added to form LevelII environment names (A1-A7). Level III and IV names are formed by adding numbersand lower case letters respectively. Each of these classification levels was then created as asingle grid data layer with an accompanying table containing summaries of theenvironmental character of each environment. Note that each of these classificationlayers contains both a single group composed of areas of land classified in the NZLRI aspermanent snow and ice (Environment T), and an additional group containingunclassified cells, mostly in rivers and lakes but also including quarries and opencastmines.
Table 3.1: Levels I-IV of the LENZ classification
I 20 Upper case letter – ‘A’ 1: 2-5,000,000 National
II 100 + Number – ‘A1’ c. 1: 1,000,000 National–Regional
III 200 + Decimal – ‘A1.1’ c. 1: 250,000 Regional
IV 500 + Letter – ‘A1.1a’ Down to 1: 50,000 Regional–District
Suggested map scaleLevel Number ofEnvironments Naming Convention Suggested geographic
extent
Production of high resolution data and classification layersTo facilitate use of Levels III and IV at finer spatial scales, all environmental data
layers were recreated at an increased resolution of 25 m. High resolution versions of theseven climate layers were produced from our existing 100-m climate layers usinginterpolation tools within ArcView rather than using the original climate surfaces toestimate values with a high resolution digital elevation model. This is because differencesin elevation between adjacent cells at this fine spatial scale are only very rarely largeenough to produce differences in climate larger than the inherent error in the surfaces. A25 m slope layer was created from a 25 m digital elevation model using the same methodas described for the 100 m slope layer in the previous section. Twenty-five metre versionsof the soil layers were recreated from the NZLRI database, reflecting the significantimprovement in spatial resolution to be gained from converting its polygonrepresentation of spatial information to a raster format.
Once these higher resolution data layers had been created, 25-m resolutionclassification layers were calculated for Levels III and IV using the same procedure asthat described above to create the 100 m classification layers.

37
Creation of LENZ
Colour schemesThe colour classification files that are used with the four classification layers were
created using an automated procedure based on results from a principal componentsanalysis (PCA)6 of the average environmental attributes for the 772 environments definedby the non-hierarchical classification. These data were standardised before performingthe PCA analysis so that each environmental variable contributed equally to the analysisoutcome. Two-thirds of the total variation in the data is explained by the first three axes,with a further 14% explained by axes four and five (Table 3.2a). Scores for theenvironments on each of the first three axes were rescaled into a range from zero to 255and used to define their colours using a red-green blue colour scheme: 7 axis one wasused to define the amount of blue coloration, axis two the red coloration and axis threethe green coloration.
Axis one (blue) is strongly correlated with particle size, slope and induration and hasmoderate correlations with temperature, solar radiation and water balance. High scores(strong blue) are associated with montane environments having steep slopes withstrongly indurated, coarse parent materials, well-drained soils and climates that are cooland wet with low solar radiation. Conversely, low scores (weak blue = yellow, thecomplimentary colour to blue) are associated with environments generally having lowslopes, weakly indurated, fine-textured parent material, more poorly drained soils andwarm, dry, high solar radiation climates.
Axis two (red) is strongly associated with solar radiation both annually and in winter,and to a lesser degree with warmer temperatures, particularly in winter. High scores(strong red) are associated with environments having high solar radiation and hightemperatures, while low scores (weak red = cyan) are associated with environmentshaving low solar radiation and cool temperatures.
Axis three (green) scores are most strongly correlated with variation in rainfall, andwere reversed so that low values (strong green) indicate environments having low annualwater deficits and October vapour pressure deficits, high monthly water balance ratiosand a predominance of poorly drained soils. High scores (weak green = magenta) areassociated with environments having dry climates and good soil drainage.
In some cases the resulting colour schemes do not differentiate contrastingenvironments. Most of these differences occur with respect to soil drainage and/or age,variables that are most strongly associated with axes four and five of the PCA analysisrespectively (right of Table 3.2) and that could not be incorporated into the three-dimensional colour space used to define the red-green-blue colour scheme.
Variation in the appearance of the colours will also occur depending on the degree towhich relief shading from an underlying digital elevation model is used to enhance theirdisplay. Using the standard relief shading options in ArcView Spatial Analyst, all coloursare adjusted to a uniform average brightness, and this substantially alters the colours ofsome environments particularly those having low values on all three axes. A differenttechnique is used to incorporate relief shading both in ESRI’s 3-D Analyst™ and inArcGIS™, and this results in greater variation in colour brightness.

38
Creation of LENZ
(a)
(b)
Variance explained 35.1 18.9 12.6 8.5 5.7
Cumulative variance explained 35.1 54.0 66.6 75.1 80.8
Axis One Axis Two Axis Three Axis Four Axis Five
Table 3.2: Results from a principal components analysis (PCA) of mean environmental valuesfor the 772 environments defined by the non-hierarchical classification. The varianceexplained by the first five axes is shown in (a), and loadings of the environmentalvariables on these axes are shown in (b).
Axis Five
Mean annual temperature -0.22 0.26 -0.04 0.04 -0.15
Mean minimum temperatureof the coldest month -0.21 0.34 -0.19 0.04 -0.26
Mean annual solar radiation -0.21 0.53 0.06 -0.11 0.11
Mean winter solar radiation -0.19 0.51 -0.08 -0.08 0.02
Annual water deficit -0.19 -0.04 0.51 0.24 0.12
Mean monthly water balanceratio 0.21 -0.09 -0.35 -0.13 -0.15
October vapour pressure deficit -0.20 0.13 0.37 0.10 0.08
Slope 0.43 0.15 -0.12 -0.05 0.22
Drainage 0.24 0.16 0.31 -0.77 0.21
Acid soluble phosphorus -0.02 -0.23 0.41 -0.08 0.03
Exchangeable calcium -0.14 -0.03 0.12 0.11 -0.02
Particle size 0.51 0.26 0.25 0.32 -0.41
Induration 0.39 0.23 0.25 0.11 -0.22
Age 0.21 0.18 -0.13 0.41 0.74
Chemical limitations to -0.01 -0.01 -0.02 0.04 -0.03plant growth
Axis One Axis Two Axis Three Axis Four

39
Creation of LENZ
OBJECTIVE VERSUS SUBJECTIVE COMPONENTSOne philosophical stance that was important in developing LENZ was the attempt to
inject as much objectivity and quantitative description into the classification process aswas possible. As the work developed, it became clear that while this was achievable inmany respects, major components of the classification remain dependent on decisionsinvolving varying degrees of subjectivity. The most significant of these are outlined inTable 3.3.
The most important subjective decision, and one which strongly determined the finalshape of LENZ, was the choice of environmental variables used. This clearly constrainsthe information available to the (objective) classification procedure, predetermining thedegree to which different geographic areas can be differentiated. Variables used werechosen on the basis of experience gained in a series of statistical analyses of thedistributions of major indigenous tree species.8 Results from these were used to identifya set of variables having both strong functional links with major plant physiologicalprocesses, and high statistical correlation with the observed distributions of most of ourmajor native tree species.
The choice of classification techniques was largely constrained by the amount of dataused as input to the analysis. However, some further decisions were required aboutweighting of variables, choice of a distance measure, and setting control parameters usedin the hierarchical phase of classification.
Making a decision on how to weight the chosen variables posed one of the moredifficult challenges. Although the potential to use comprehensive sets of data describingbiological distributions to test the discriminating power of environmental classificationsusing different weightings was explored, this did not yield the gains expected. In part,this reflects a lack of biological databases with comprehensive spatial coverage, as eventhe best of these are biased strongly, mostly towards montane environments. However, italso reflects the very large sample sizes involved and the difficulties in identifyingmeaningful statistical tests with such data. In the end, all variables were weighted equallywith the exception of the four soil nutrient variables, whose contribution was averaged soas to prevent their influence from becoming disproportionately large. This choice wasmade based on subjective comparison of classifications using both weighted and non-weighted approaches and assessed for their ability to recover major features of NewZealand’s environment known to be correlated with major features of New Zealand’sbroad scale forest pattern. Although such an emphasis on forest ecosystems might becriticised by those interested in biotic groups other than forest trees, two factors are likelyto result in this approach also having strong relevance to a wide range of other groups.First many of the variables used in defining LENZ are likely to also have strongfunctional linkages with the life processes of a wide range of other species groups.Secondly, forest was historically by far the dominant land cover of New Zealand, andvariation in the character of those forests presumably once played a major role indefining habitat availability for many other species.
Choice of a distance measure was much more straightforward. The Gower metricincorporates an inherent range standardisation, obviating the need to range standardiseall variables before analysis. In addition, its measurements of inter-site distances are not

40
Creation of LENZ
affected by their positions in relation to the range of the various attributes9 . That is, adifference of three units in a particular variable contributes the same amount to thedistance whether it is from 0 to 3 or from 97 to 100. By contrast, when using ratiomeasures such as the Bray-Curtis distance measure, the distance between two sitesreflects both their environmental difference and the magnitude of their environmentalattributes, e.g., for a variable with a total range of 100 units, two sites having values of 12and 14 are indicted as being much more different than sites having values of 92 and 94.
As indicated above, a decision on the degree of space conservation or dilation used inthe final classification phase was made on the basis both of results from publishedcomparative studies and of practical tests. For the latter, the analysis was repeated withdiffering values of the control parameter corresponding to no, slight and moderatedilation. Histograms of the resulting group sizes were then plotted, and slight spacedilation was selected given its significant reduction in numbers of groups of smallgeographic extent, and resulting improved separation of large-scale environmentaldifferences.
Choice of the numbers of groups to include in the standard classification levels(Levels I–IV) was made by progressively increasing the number of groups included inthe display of the full classification layer. The geographic distribution of groups at thevarious classification levels was then examined, along with their discrimination offeatures of New Zealand’s landscape associated with significant variation in forestpattern.
Table 3.3: Significant subjective decisions that were made in defining LENZ, and the criteriaused in making a choice.
CriteriaDecision
Choice of input variables
Classification procedure
Weighting of variables
Distance measure
Space dilation versus contraction
Post-analysis choice ofclassification levels
Variables chosen both for their correspondence withmajor physiological process of biota, and their strongstatistical correlation with the distributions of trees8
Equal weights assigned after qualitative assessment ofclassifications using varying weighting schemes
Gower metric chosen for its automatic equal-weightingof variables, and interval as opposed to ratio response
Non-hierarchical followed by hierarchical clusteringchosen because of very large sample size.
Slight space dilation chosen to minimise production oflarge numbers of groups of very small area
Qualitative decision based on feedback fromexperienced conservation and environmental managers

41
The LENZ Environments
CHAPTER FOURThe LENZ EnvironmentsLevels II – IV
While Land Environments of New Zealand provides descriptions of the 20 LevelI environments, this volume focuses on Levels II, III and IV of the LENZclassification, containing 100, 200 and 500 environments respectively. We
begin this chapter with a brief overview of the Level I environments, and then introducethe more detailed classification levels, starting with a section that provides guidance onhow to interpret the later descriptive material.
The LENZ Level I EnvironmentsIn overview, Environments A through T form a sequence from northern lowland
environments with warm temperatures and high solar radiation to the steep, coldenvironment of the South Island’s Southern Alps with its extensive permanent snow andice. Five groupings can be distinguished within these 20 environments:
• Environments A to F are widespread in the North Island and the north and east ofthe South Island and typically have warm temperatures, moderate to high solarradiation, low monthly water balance ratios, low to moderate water deficits andmoderately high vapour pressure deficits. The vast majority of soils are mature, withthe most common soil parent materials being rhyolitic rock and tephra from theTaupo volcanic zone; andesitic rock and tephra from the Tongariro and Taranakivolcanoes; and greywacke rock, mostly along the main mountain ranges withscattered outliers in western Waikato and Northland. Extensive areas of alluvium,peat and loess occur in the lowlands particularly in Waikato, Hawke’s Bay,Manawatu and Wairarapa.
• Environments G to K occur throughout the North Island and the eastern SouthIsland, and consist predominantly of recent soils of flood plains, sand dunes or recentvolcanic deposits. Although much less extensive than Environments A to F, theyshare strong similarities in climate. Alluvium from a variety of sources is the mostwidespread parent material.
• Environments L to N encompass extensive areas of outwash glacial material andalluvium in the southern and eastern South Island, with more scattered occurrenceson the South Island’s West Coast. Climates in these environments are cooler than inmore northern environments, with much lower solar radiation. Average monthlywater balance ratios and October vapour pressure deficits vary widely, with sites eastof the Southern Alps much drier than those in the west and south. The most commonparent materials are loess and alluvium from greywacke or schist, with smaller areasof alluvium from granite, basic volcanic rocks and/or younger Tertiary rocks.

42
The LENZ Environments
Mixtures of recent and older soils occur in the east and south, while recent soilspredominate in the west.
• Environments O to S occupy the higher mountain ranges and central volcanoes of theNorth Island and the extensive mountainous terrain of the South Island. Climates aregenerally cool, with only low to moderate solar radiation, low deficits of rainfall andvapour pressure, and high average monthly water balance ratios. Slopes are moderateto steep. The most widespread soil parent materials are greywacke in the mountainsof Canterbury, Marlborough and the North Island main ranges; schist in themountains of Otago and along the eastern side of the South Island’s main alpine fault;gneiss and granite on Stewart Island, in Fiordland, scattered along the South Island’sWest Coast and in Buller and Nelson; and Tertiary rocks, mostly in Buller and westNelson. Small areas of ultramafic rocks occur in Southland, southern Westland andabout Nelson.
• Environment T consists of the permanent snow and ice of the South Island’sSouthern Alps, occurring mostly at high elevations where the climate is cold and wet,and slopes are mostly steep.
Relationships between the LENZ classification levelsOne reflection of the hierarchical nature of LENZ is the relationships between
environments at different levels of classification detail. For example, the NorthernLowlands Environment (A) is progressively divided at each classification level, so that itcontains seven environments at Level II (A1–A7), 14 environments at Level III (A1.1–A7.3), and 33 environments at level IV (A1.1a–A7.3b). The hierarchical relationshipsbetween environments at different classification levels are also reflected in the namingconventions described in Chapter Three. The number of components in an environmentname indicates both the classification level it is drawn from and its relationships to otherenvironments drawn from the same level. For example, Environment A7.2 occurs atLevel III, as indicated by the three components that makes up its name. In addition, A7.2is more closely related to Environment A7.3 than to Environment A6.1, while the latteris more closely related to Environment A6.2.
A formal account of the relationships between different environments is provided bythe dendrograms presented in the latter descriptive section of this chapter. The exampledendrogram shown in Fig. 4.1 shows how the position of vertical lines joiningenvironments indicates the degree of similarity between different environments, with theposition of these lines interpreted relative to the environmental distance scale shownalong the foot of the dendrogram. Vertical lines to the left of the diagram join similarenvironments, while lines to the right join environments that are more dissimilar. In theexample shown, Environment A7.2a in the lower part of the dendrogram is most closelyrelated to Environment A7.2b, these two Level IV environments combining with A7.2c,A7.2d and A7.2e to form the Level III Environment A7.2. Environment A7.2 is in turnmost closely related to A7.3 and then to A7.1, with these three environments collectivelyforming Environment A7 at Level II. Subsequent links to the right of the dendrogramindicate more distant similarities with the other Level II environments in A, i.e. A1–A6.

43
The LENZ Environments
Figure 4.1: A typical dendrogram for a group of LENZ environments - see text for explanation.
Environmental and geographic variabilityOne consequence of the progressive increase in detail of the LENZ classification
levels is a decrease in the average extent of the individual environments in bothgeography and environment. For example, while the average geographic extent of the 20Level I environments is 1.3 million ha, the average extent of the Level IV environmentsis around 50 000 ha (Table 4.1). Similar trends also occur for environment, i.e. theenvironmental variability occurring within each environment decreases with progressionfrom the more general to the more detailed classification levels. For example, using thestandard deviation as a measure of within-environment variability in annual temperature(Table 4.1), there is a clear trend of decreasing environmental variability with progressionfrom Level I environments to Level IV environments.

44
The LENZ Environments
Level I Level II Level III Level IV(20 Groups) (100 Groups) (200 Groups) (500 Groups)
Mean environment size (ha) 1,305,292 259,851 130,353 52,216
Mean of Standard Deviations ofMean Annual Temperature (°C) 1.257 0.768 0.655 0.525
Table 4.1: Variation in the average geographic extent and environmentalvariability of environments at different levels of classification
Table 4.2: Numbers of Level-IV environments by Regional Council area.
Level I Level II Level III Level IVResults (20 Groups) (100 Groups) (200 Groups) (500 Groups)
Northland 6 15 22 43
Auckland 7 19 31 64
Waikato 14 35 59 129
Bay of Plenty 9 22 37 83
Gisborne 11 27 46 101
Hawkes Bay 12 33 63 138
Taranaki 10 28 44 77
Manawatu-Wanganui 12 26 40 94
Wellington 8 13 21 61
Tasman 17 35 51 90
Nelson City 10 17 20 27
Marlborough 16 43 65 119
West Coast 17 38 57 110
Canterbury 16 48 85 173
Otago 14 48 86 169
Southland 13 37 64 128

45
The LENZ Environments
Parallel to these changes, is a general trend of increased numbers of environmentsoccurring in each region with progression from Level I to Level IV (Table 4.2), althoughthese increases are not uniform. Rather, they reflect the degree of environmentalvariability at different spatial scales within each region. For example, Northland andAuckland, which have six and seven Level I environments respectively, differ muchmore in their number of Level IV environments, the Auckland Region having nearly50% more variability at this finer scale than Northland. The greatest numbers of LevelIV environments occur in Canterbury and Otago, reflecting their environmentalvariability, which extends from warm, dry lowlands with wide variation in topographyand soils to montane environments along the Southern Alps with very cold, wet climates.
Environment DescriptionsDescriptions of the LENZ environments form the rest of this chapter. These are
grouped by Level I environment, a description of which provides a general introductionto each group of environments at the more detailed classification levels. A dendrogram isalso provided for each group of environments, along with a table showing the averageenvironmental conditions for the respective Level II environments. This is followed bymore detailed descriptions for the Level II and III environments in which standarddescriptive terms (Appendix I) are used to provide consistent descriptions. For example,variation in mean annual temperature is described as ‘very cold’ (< 5 ºC), ‘cold’(5–7.5 ºC), ‘cool’ (7.5–10 ºC), ‘mild’ (10–12.5 ºC), ‘warm’ (12.5–15 ºC) and ‘very warm’(>15 ºC). A list of all the standard descriptors can be found in the appendix. Where nosubdivision of a Level II environment occurs at Level III, its attributes, which will beidentical to those of its Level II counterpart, are listed in tabular form for completeness.Descriptions of the Level IV environments are more limited, focusing on differencesbetween each environment and its parent Level III environment using comparativedescriptors.

46
The LENZ Environments
A - Northern Lowlands
Environment A encompasses the extensive lowlands of the northern North Islandwith the majority occurring in Northland, Auckland and Waikato. Smaller areas arescattered around the Bay of Plenty coast from northern Coromandel to East Cape, withoccasional occurrences along the east coast south to about the Mohaka River mouth inHawke’s Bay. Several tiny areas occur on the south Taranaki coast near Waverley.Climatically, Environment A is warm, with very high annual and winter solar radiation.Minimum winter temperatures are also high, with frosts occurring only infrequentlyfrom Auckland north. Although annual water deficits are low, the low monthly waterbalance ratio makes this environment susceptible to drought in years with lower thanaverage rainfall. October vapour pressure deficits are moderate. Landforms are generallyflat to gently rolling, with parent materials that include deeply weathered sandstone andgreywacke, older volcanic tephra, alluvium from various sources, peat and older basalticrocks. Most soils are poorly to moderately drained and of low natural fertility, reflectingthe intense weathering caused by the warm, moist climate.
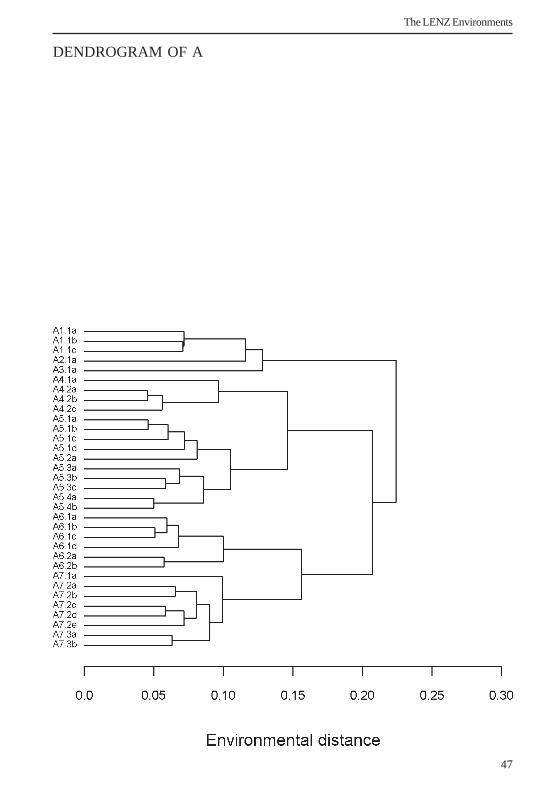
47
The LENZ Environments
DENDROGRAM OF A

48
The LENZ Environments
Envi
ronm
ent
Are
a (ha
)
Alti
tude
(m)
Mea
n an
nual
tem
pera
ture
(ºC
)
Mea
n m
inim
um te
mpe
ratu
re o
f the
cold
est m
onth
(ºC
)
Mea
n an
nual
sola
r rad
iatio
n (M
J/m2 /d
ay)
Mea
n w
inte
r sol
ar ra
diat
ion
(MJ/m
2 /day
)
Oct
ober
vap
our p
ress
ure d
efic
it (k
Pa)
Mon
thly
wat
er b
alan
ce ra
tio (r
atio
)
Mea
n an
nual
wat
er d
efic
it (m
m)
Slop
e (º)
Dra
inag
e (1=
very
poo
r to
5=go
od)
Aci
d so
lubl
e pho
spho
rus (
1=v.
low
to 5
=v. h
igh)
Exch
ange
able
calc
ium
(1=l
ow to
5=v
. hig
h)
Parti
cle s
ize (
1=cl
ay/si
lt to
5=b
ould
ers–
mas
sive)
Indu
ratio
n (1
=non
-indu
rate
d to
5=v
. stro
ngly
ind.
)
Soil
Age
(1=r
aw/re
cent
, 2=o
lder
)
Che
mic
al li
mita
tions
(1=l
ow, 2
=sal
ine,
3=u
ltram
afic
)
A1
50,39
0 56 15.7 8.4 15.3 6.9 0.4 2.0
102.6 5.5 4.1 1.8 1.0 3.4 3.8 2.0 1.0
A2
31,18
7 26
15.8 8.5 15.3 6.8 0.4 2.0
106.7 1.2 1.1 1.1 1.6 1.5 2.4 2.0 1.0
A3 81
6 20
15.8 8.4 15.3 7.1 0.3 1.9
121.3 1.8 3.0 2.0 3.0 2.0 1.0 1.0 1.0
A4 9650 9
15.3 6.9 15.1 6.4 0.4 2.5 58.9 1.4 1.9 2.0 3.0 1.0 1.0 2.0 2.0
A5
386,1
52 34
14.3 4.9 14.9 5.9 0.4 2.5 51.0 0.6 1.6 1.6 2.1 1.3 1.6 2.0 1.0
A6
894,7
43 93 14.7 6.3 15.0 6.2 0.4 2.7 40.3 6.2 3.1 1.2 1.1 2.0 3.2 2.0 1.0
A7
486,4
04 55
14.2 5.1 14.9 5.9 0.4 2.6 43.5 1.7 4.6 1.9 1.5 1.9 2.4 2.0 1.0

49
The LENZ Environments
Environment A1Environment A1 consists of the hills that extend from the Three Kings Islands to
North Cape and south to Ahipara at the base of Ninety Mile Beach, with smaller areason northern Great Barrier Island. The climate of Environment A1 is very warm, withvery high solar radiation, very low monthly water balance ratios and moderate annualwater deficits. Soil parent materials are predominantly basalt and older sand depositswith some sandstone, rhyolite and greywacke. A small area of ultramafic rocks occur onthe tip of North Cape. Soils are imperfectly drained and of low natural fertility.
Level III & IV Descriptions
Level III
Area
Elevation
Location
Climate
Landform
Soils
Level IV
A1.1 – No Subdivision at Level III
50,400 ha
55 m
North Cape, Three Kings Islands
Very warm temperatures, very high solar radiation, moderate annual waterdeficits
Undulating hills
Imperfectly drained soils of low fertility from basaltic and rhyolite
a. strongly rolling hills, well-drained, moderate fertilityb. as for A1.1c. gently undulating hills, fine-textured soils

50
The LENZ Environments
Environment A2This environment is restricted in extent, occurring only on sites with little slope and
at low elevation in the far north, often in close proximity to Environment A1. As withthe previous environment, A2’s climate is typified by very warm temperatures, very highsolar radiation and moderate annual water deficits. Sand and peat are the dominant soils,with some estuarine alluvium. Soils are very poorly-drained and of very low naturalfertility.
Level III & IV Descriptions
Level III
Area
Elevation
Location
Climate
Landform
Soils
Level IV
A2.1 – No Subdivision at Level III
31,230 ha
25 m
North Cape
Very warm temperatures, very high solar radiation, moderate annual waterdeficits
Gently undulating hills
Very poor drainage and very low fertility from peat, sand and some estuarinealluvium
a. – no subdivision at Level IV – same as A2.1
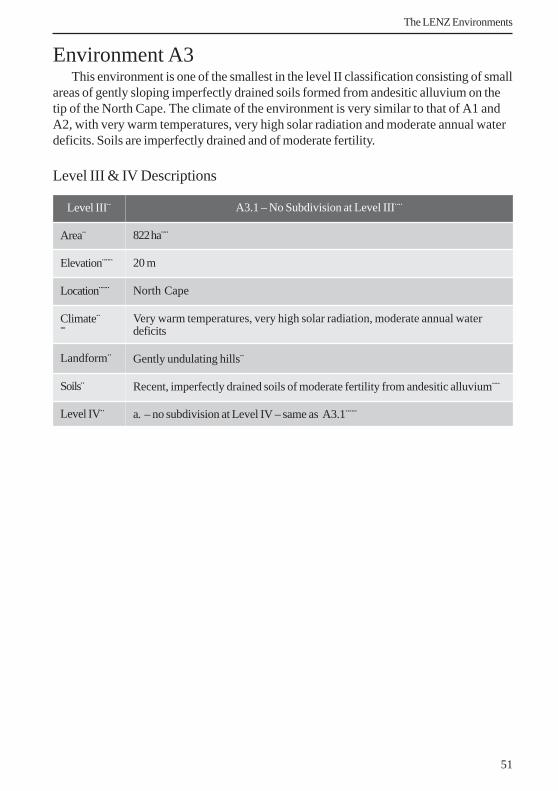
51
The LENZ Environments
Environment A3This environment is one of the smallest in the level II classification consisting of small
areas of gently sloping imperfectly drained soils formed from andesitic alluvium on thetip of the North Cape. The climate of the environment is very similar to that of A1 andA2, with very warm temperatures, very high solar radiation and moderate annual waterdeficits. Soils are imperfectly drained and of moderate fertility.
Level III & IV Descriptions
Level III¨
Area¨
Elevation¨¨¨
Location¨¨¨
Climate¨¨̈
Landform¨
Soils̈
Level IV¨
A3.1 – No Subdivision at Level III¨¨
822 ha¨̈
20 m
North Cape
Very warm temperatures, very high solar radiation, moderate annual waterdeficits
Gently undulating hills¨
Recent, imperfectly drained soils of moderate fertility from andesitic alluvium¨¨
a. – no subdivision at Level IV – same as A3.1¨¨¨

52
The LENZ Environments
Environment A4Environment A4 occurs as small pockets scattered throughout the northern North
Island in protected coastal estuaries, harbours and inlets mostly in Northland but alsoextending as far south as Marokopa and the Tauranga Harbour. Very warmtemperatures, very high solar radiation and low annual water deficits typify the climateof Environment A4. Estuarine alluvium is the sole parent material and the calcium-richsaline soils are poorly-drained and of moderate fertility.
Level III & IV Descriptions
A4.2¨̈
768 ha¨̈
10m¨̈
Tauranga Harbour, Marokopa¨¨
Very warm temperatures, very high solarradiation, low annual water deficits¨¨¨
Gently undulating hills¨¨
Very poorly-drained saline soils of moderatefertility from estuarine alluvium¨¨
a. as for A4.2b. cooler temperatures, higher annual water
deficitsc. lower solar radiation, much lower vapour
pressure deficits¨¨
Level III¨
Area¨
Elevation
Location¨
Climate
Landform
Soils̈
Level IV¨
A4.1¨
8972 ha¨
10 m¨
Northland¨
Very warm temperatures, veryhigh solar radiation, low annualwater deficits¨
Gently undulating hills
Poorly-drained saline soils ofmoderate fertility from estuarinealluvium¨
a. – no subdivision at LevelIV – same as A4.1¨

53
The LENZ Environments
Environment A5Environment A5 is widespread, consisting of flat sites at low elevation, with the most
extensive areas occurring around Kaitaia and Dargaville, on the Hauraki Plains, in theHamilton basin and on the coastal plains of the Bay of Plenty from Te Puke toWhakatane. Small patches also occur from East Cape to northern Hawke’s Bay. Climaticconditions are generally cooler than in the preceding Level II environments, with onlymoderate rainfall deficits. Alluvium from a variety of sources, including estuarinesediments and rhyolitic and andesitic ash are dominant, along with peat and some oldersands. Soils are typically poorly-drained and of low to moderate natural fertility.
Level III & IV Descriptions
Level III
Area
Elevation
Location
Climate
Landform
Soils
Level IV
A5.1
107,224 ha
40 m
Scattered aroundNorthland
Very warmtemperatures, veryhigh solarradiation, lowannual waterdeficits
Very gentlyundulating hills
Poorly-drainedpeat soils of lowfertility with somealluvium
a. warmertemperature
b. moderatefertility
c. as for A5.1d. lower winter
temperatures,higher vapourpressure deficits,lower annualwater deficits
A5.2
17,920 ha
70 m
West coast ofNorthland
Warmtemperatures, highsolar radiation, lowannual waterdeficits
Gently undulatinghills
Very poorly-drained soils of lowfertility from sandand basalticalluvium
a. – no subdivisionat Level IV –same as A5.2
A5.3
248,620 ha
30 m
Central Waikato,Hauraki Plains,East Cape
Warmtemperatures,high solarradiation, lowannual waterdeficits
Flat terraces
Poorly-drainedpeat soils of lowfertility
a. very lowfertility
b. as for A5.3c. higher solar
radiation,higher vapourpressuredeficits, lowerannual waterdeficits
A5.4
12,396 ha
50 m
Northern Hawke’sBay
Warmtemperatures, highsolar radiation, highvapour pressuredeficits, low annualwater deficits
Gently undulatinghills
Poorly-drainedsoils of low fertilityfrom rhyolitictephra and somealluvium
a. moderatefertility
b. undulating hills

54
The LENZ Environments
Level III
Area
Elevation
Location
Climate
Landform
Soils
Level IV
A6.1
831,040 ha
90 m
North of Auckland, Waiheke Island
Warm temperatures, very high solarradiation, low annual water deficits
Undulating hills
Imperfectly drained soils of very lowfertility from sandstone, mudstoneand some greywacke
a. easy rolling hills, imperfect drainageb. as for A6.1c. easy rolling hillsd. high fertility, coarse parent material
A6.2
63,088 ha
110 m
South of Auckland City to BombayHills
Warm temperatures, high solarradiation, low annual water deficits
Undulating hills
Imperfectly drained soils of very lowfertility from greywacke with someargillite
a. easy rolling hillsb. recent soils
Environment A6Environment A6 has the highest mean elevation of the Level II environments in A,
consisting of rolling hills in Northland, Auckland and northern Waikato. The largest ofthe A environments (nearly 50% of A’s total area), it has warm temperatures, very highsolar radiation and low annual water deficits. Sandstone is the most widespread soilparent material closely followed by greywacke – both are deeply weathered. Soils areimperfectly drained and are of low natural fertility.
Level III & IV Descriptions

55
The LENZ Environments
Environment A7Environment A7 is the southernmost of the Level II environments within A,
occurring on gently sloping land at low to mid-elevation in Auckland, Waikato and theBay of Plenty with smaller areas in Northland and around Mahia Peninsula. Climaticconditions are warm with high solar radiation and low annual water deficits. Rhyoliticalluvium and tephra are the dominant soil parent materials with smaller areas of youngerbasaltic rock, wind-blown sand and loess. Soils are well-drained but of moderately lownatural fertility.
Level III & IV Descriptions
Level III
Area
Elevation
Location
Climate
Landform
Soils
Level IV
A7.1
61,924 ha
110 m
Northland, AucklandCity, Rangitoto Island
Warm temperatures,very high solar radiation,low annual water deficits
Very gently undulatinghills
Well-drained soils ofhigh fertility from basalt
a. – no subdivision atLevel IV – same asA7.1
A7.3
44,396 ha
70 m
Ninety Mile Beach,Awhitu Peninsula, MahiaPeninsula
Warm temperatures,high solar radiation, lowannual water deficits
Undulating hills
Well-drained soils of verylow fertility from sand,rhyolitic tephra, somemudstone
a. as for A7.3b. higher winter
temperatures
A7.2
380,108 ha
45 m
Lower slopes of theWaitakere Ranges,south of Auckland,Hamilton, Tauranga
Warm temperatures insummer, moderate inwinter, high solarradiation, low annualwater deficits
Very gently undulatinghills
Imperfectly drained soilsof low fertility fromrhyolitic tephra andalluvium, some peat andgreywacke
a. much higher wintertemperatures
b. as for A7.2c. lower winter
temperatures, well-drained
d. lower annual waterdeficits, well-drained
e. higher annual waterdeficits, well-drained,moderate fertility

56
The LENZ Environments
B - Central Dry Lowlands˚
Environment B consists of dry hill-country and older alluvial soils in central NewZealand, mostly at low elevations. It is most extensive in the east, extending fromGisborne and Hawke’s Bay in the north to Marlborough and North Canterbury in thesouth, with smaller patches in Tasman Bay and on rolling hill-country immediatelyinland from Wanganui.
The climate of Environment B is dry and mild with high solar radiation, reflectingits protection from prevailing winds by mountain ranges to the west. Annual waterdeficits are moderate on average but may be severe in years with below-average rainfall.Vapour pressure deficits are high. The portion of Environment B located inland fromWanganui is partially protected from rain-bearing winds to the southwest and northwestby the volcanic cones of Taranaki and to a smaller extent the mountains of north-westNelson. The terrain is generally flat to moderately sloping, with soils of low to moderatenatural fertility formed on loess, alluvium, greywacke, sandstone, mudstone orlimestone.

57
The LENZ Environments
DENDROGRAM OF B

58
The LENZ Environments
Envi
ronm
ent
Are
a (ha
)
Alti
tude
(m)
Mea
n an
nual
tem
pera
ture
(ºC)
Mea
n m
inim
um te
mpe
ratu
re o
f the
cold
est m
onth
(ºC)
Mea
n an
nual
sola
r rad
iatio
n (M
J/m2 /d
ay)
Mea
n w
inte
r sol
ar ra
diat
ion
(MJ/m
2 /day
)
Oct
ober
vap
our p
ress
ure d
efic
it (k
Pa)
Mon
thly
wat
er b
alan
ce ra
tio (r
atio
)
Mea
n an
nual
wat
er d
efic
it (m
m)
Slop
e (º)
Dra
inag
e (1=
very
poo
r to
5=go
od)
Aci
d so
lubl
e pho
spho
rus (
1=v.
low
to 5
=v. h
igh)
Exch
ange
able
calc
ium
(1=l
ow to
5=v.
high
)
Parti
cle s
ize (
1=cl
ay/si
lt to
5=bo
ulde
rs–m
assiv
e)
Indu
ratio
n (1
=non
-indu
rate
d to
5=v
. stro
ngly
ind.
)
Soil
Age
(1=r
aw/re
cent
, 2=o
lder
)
Chem
ical
lim
itatio
ns (1
=low
, 2=s
alin
e, 3=
ultra
maf
ic)
B1
190,8
50 165
12.3 2.5 14.7 5.0 0.4 2.4 90.6 6.9 3.8 1.7 1.8 4.4 3.6 2.0 1.0
B2 70,15
6
313
11.8 2.0 14.5 5.1 0.5 2.4 61.8 4.0 3.7 2.0 2.0 1.1 1.1 2.0 1.0
B3
189,3
09 300
10.7 0.0 14.3 4.5 0.5 2.1
120.1 9.0 4.1 3.1 2.0 4.0 3.7 2.0 1.0
B4 2715 66
12.2 1.8 15.2 4.8 0.5 2.4 94.3 1.2 1.6 2.7 2.0 1.9 1.9 2.0 1.0
B5 50,19
8 67
13.3 3.1 14.6 5.4 0.5 1.8
168.4 1.5 3.1 2.0 2.2 1.1 1.2 2.0 1.0
B6 29,34
3
111
12.2 2.0 14.9 5.0 0.5 1.5
247.6 3.9 2.9 3.3 2.0 1.2 2.1 2.0 1.0
B7 54,54
4
129
12.7 3.1 14.8 5.4 0.5 1.7
181.3 5.5 3.1 2.1 2.1 5.0 3.9 2.0 1.0
B8 87,20
7
350
11.2 1.2 14.9 5.3 0.5 1.6
197.9 13.8 5.0 3.0 1.3 4.1 3.6 2.0 1.0
B9 18,79
1 89
12.4 2.4 14.9 5.2 0.6 1.4
261.4 2.1 4.9 4.2 2.0 3.0 3.4 1.8 1.0

59
The LENZ Environments
Level III
Area
Elevation
Location
Climate
Landform
Soils
Level IV
B1.1
63,432 ha
200 m
Nelson & Hawke’s Bay
Mild temperatures,moderate solar radiation,low annual water deficitsand low monthly waterbalance ratios
Strongly undulatingplains and hills
Well-drained soils of lowfertility from coarsegreywacke gravels andTertiary rocks
a. Tasman District, well-drained gravels
b. Hawke’s Bay, highervapour pressuredeficits, sandstone,limestone andgreywacke, very lowfertility
c. Marlborough, muchcooler wintertemperatures, soils ofimperfect drainage ongreywacke, moderatefertility
B1.2
14,788 ha
75 m
Motueka
Mild temperatures, highsolar radiation,moderately annualwater deficits
Undulating plains
Soils of imperfectdrainage and very lowfertility from gravels
a. – no subdivision atLevel IV – same asB1.2
B1.3
112,664 ha
160 m
Hawke’s Bay, Wanganui
Warm temperatures, highsolar radiation, lowannual water deficits andvery low monthly waterbalance ratios
Undulating hills
Soils of imperfectdrainage and low fertilityfrom sandstone andmudstone
a. Wanganui – dissectedsandstone hills, verylow fertility
b. southern Hawke’s Bay,much colder wintertemperature but highsolar radiation,calcareous mudstone,with some argillite
c. southern Hawke’s Bay,higher monthly waterbalance ratios, cool,moist climate,calcareous mudstone,moderate fertility
d. southern Hawke’s Bay,limestone, very high fertility
Environment B1One of the most widespread Level II environments in B, B1 is extensive on
undulating low hills in the Tasman, Wanganui and Hawke’s Bay regions, with smallerareas on the north bank of the Wairau River in Marlborough. The climate within thisenvironment is warm, with high solar radiation, moderate vapour pressure deficits andlow annual water deficits. Parent materials vary with location and include sandstone(Wanganui), sandstone, mudstone, argillite and limestone (Hawke’s Bay), deep, dissectedbeds of coarse gravels (Nelson) and greywacke (Marlborough). Soils are imperfectlydrained and of low natural fertility.
Level III & IV Descriptions

60
The LENZ Environments
Environment B2This environment occurs on inland areas of the southern Hawke’s Bay plains on
gently sloping alluvial surfaces. The climate is mild, with high solar radiation and lowannual water deficits. Soils are imperfectly drained and have low natural fertility mainlydue to the parent material consisting of ryolitic tephra, loess and mixed alluvium.
Level III & IV Descriptions
Level III
Area
Elevation
Location
Climate
Landform
Soils
Level IV
B2.1 – No Subdivision at Level III
70,188 ha
310 m
Southern Hawke’s Bay
Mild temperatures, high solar radiation, low annual water deficits and very lowmonthly water balance ratios
Gently undulating plains
Imperfectly drained soils of low fertility from a mixture of rhyolitic tephra, loessand mixed alluvium
a. higher vapour pressure deficits, mixed alluvium and loess parent materials,imperfect drainage with very low fertility
b. lower annual water deficits, finer alluvial parent materials, imperfect drainagec. cooler, lower annual water deficits, rolling slope, rhyolitic ash, imperfect
drainage and moderate fertilityd. lower annual water deficits, well-drained soils of loess and very high fertility

61
The LENZ Environments
Environment B3While extensive in area, this sub-unit is largely confined to North Canterbury, with
only small areas found in inland valleys of southern Marlborough. The climate is mild,with high solar radiation and moderate annual water deficits. This environment occupieseasy rolling land, and parent materials are mostly younger sandstone, mudstone andlimestone, with some older greywacke, some of which is overlain by loess. Soils are ofmoderate natural fertility and are imperfectly to moderately well-drained.
Level III & IV Descriptions
Level III
Area
Elevation
Location
Climate
Landform
Soils
Level IV
B3.1
103,112 ha
260 m
North Canterbury – coastal to inland
Mild temperatures, high solarradiation, high vapour pressure deficitsand moderate annual water deficits
Easy rolling hills
Imperfectly drained, moderately fertilesoils from predominantly calcareousmudstone with some greywackegravels
a. lower annual water deficits,mudstone parent material, with somecoastal gravels, imperfect drainage
b. much lower annual water deficits,mudstone parent materials with soilsof imperfect drainage
c. loess parent materials
B3.2
86,040 ha
345 m
North Canterbury – mainly inland
Mild temperatures, high solarradiation, high vapour pressuredeficits and moderate annual waterdeficits
Easy rolling hills
Well-drained and moderately fertilesoils from greywacke rock and gravelswith some limestone and Tertiarysandstone
a. cooler temperatures in winter, muchlower annual water deficits withgreywacke and basalt on undulatinghills, high fertility
b. higher annual water deficits,greywacke and limestone onstrongly rolling hills
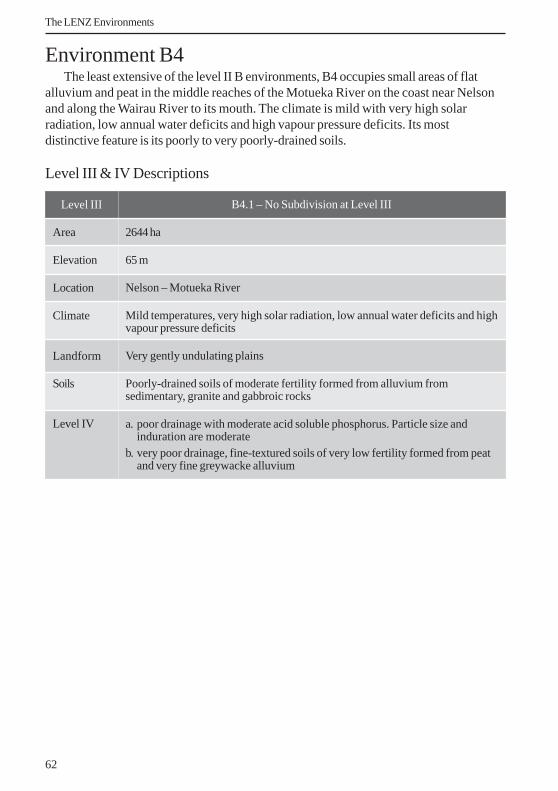
62
The LENZ Environments
Environment B4The least extensive of the level II B environments, B4 occupies small areas of flat
alluvium and peat in the middle reaches of the Motueka River on the coast near Nelsonand along the Wairau River to its mouth. The climate is mild with very high solarradiation, low annual water deficits and high vapour pressure deficits. Its mostdistinctive feature is its poorly to very poorly-drained soils.
Level III & IV Descriptions
Level III
Area
Elevation
Location
Climate
Landform
Soils
Level IV
B4.1 – No Subdivision at Level III
2644 ha
65 m
Nelson – Motueka River
Mild temperatures, very high solar radiation, low annual water deficits and highvapour pressure deficits
Very gently undulating plains
Poorly-drained soils of moderate fertility formed from alluvium fromsedimentary, granite and gabbroic rocks
a. poor drainage with moderate acid soluble phosphorus. Particle size andinduration are moderate
b. very poor drainage, fine-textured soils of very low fertility formed from peatand very fine greywacke alluvium

63
The LENZ Environments
Environment B5This environment is the most northern of the level II B environments, occurring on
gently undulating sites surrounding Gisborne and in the Hawke’s Bay region. Theclimate of this environment is warm, with high solar radiation and moderate annualwater deficits. Soils of poor to imperfect drainage and low natural fertility are formedfrom fine alluvium, loess, peat and estuarine sediments.
Level III & IV Descriptions
Level III
Area
Elevation
Location
Climate
Landform
Soils
Level IV
B5.1
16,768 ha
15 m
Gisborne, Hawke’s Bay
Warm temperatures,high solar radiation, highvapour pressure deficits,very low monthly waterbalance ratios andmoderate annual waterdeficits
Gently undulating plains
Poorly-drained soils ofmoderate fertility frommixed alluvium
a. lower annual waterdeficits, poor drainage,high fertility
b. higher annual waterdeficits, poor drainage,low fertility
B5.2
30,424 ha
100 m
Hawke’s Bay
Warm temperatures,high solar radiation,high vapour pressuredeficits, very lowmonthly water balanceratios and moderateannual water deficits
Gently undulatingplains
Imperfectly drained soilsof low fertility fromloess with small depositsof peat, argillite andsandstone
a. well-drained soilsb. imperfect drainage
B5.3
3132 ha
30 m
Gisborne
Warm temperatures,high solar radiation, highvapour pressure deficits,very low monthly waterbalance ratios andmoderate annual waterdeficits
Gently undulating plains
Imperfectly drained soilsof low fertility from sandand rhyolitic tephra
a. – no subdivision atLevel IV – same asB5.3

64
The LENZ Environments
Environment B6This environment is the first of four level II ‘B’ environments that dominate the
Marlborough lowlands. It occurs in the lower reaches of the Wairau Valley, occupyingsites with a mild climate, high solar radiation, high vapour pressure deficits and highannual water deficits. Soils of imperfect drainage and moderate natural fertility formedfrom greywacke alluvium and loess.
Level III & IV Descriptions
Level III
Area
Elevation
Location
Climate
Landform
Soils
Level IV
B6.1 – No Subdivision at Level III
29,408 ha
110 m
Wairau Valley – Blenheim
Mild temperatures, high annual water deficits, high vapour pressure deficits
Undulating plains
Soils of imperfect drainage and moderate fertility formed from greywackealluvium and loess, imperfect drainage
a. warmer temperatures in winter, lower vapour pressure deficits, imperfectdrainage
b. lower annual water deficits, imperfect drainagec. warmer temperatures in winter, higher annual water deficits, imperfect
drainage, gently undulating landformd. poor drainage, flat terraces, high fertility

65
The LENZ Environments
Environment B7This environment occurs on low elevation hill-country both in Hawke’s Bay and
southeast from the Awatere River and around Cape Campbell. The climate is typified bywarm temperatures, high solar radiation, moderate annual water deficits and highvapour pressure deficits. Soils of imperfect drainage and low fertility are formed fromsandstone and mudstone (Hawke’s Bay) and calcareous mudstones (Marlborough).
Level III & IV Descriptions
Level III
Area
Elevation
Location
Climate
Landform
Soils
Level IV
B7.1 – No Subdivision at Level III
54,548 ha
130 m
Southern Hawke’s Bay / East of the Awatere River to Cape Campbell
Warm temperatures, high solar radiation, moderate annual water deficits, highvapour pressure deficits
Undulating plains
Imperfectly drained soils of low fertility from, sometimes calcareous, sandstoneand mudstone
a. much higher annual water deficits, imperfect drainage, high fertilityb. higher annual water deficits, much higher vapour pressure deficits, imperfect
drainage, high fertility, easy rolling hillsc. much lower annual water deficits, imperfect drainage, very low fertilityd. imperfect drainage, strongly undulating hills

66
The LENZ Environments
Environment B8Environment B8 is the most extensive of the Marlborough B environments,
extending from the low coastal hills that separate the Wairau and Awatere valleys, inlandto the upper Awatere and the lower reaches of the Clarence River. The climate is mildwith high solar radiation, high vapour pressure deficits and moderate annual waterdeficits. Soils are well-drained and of moderate natural fertility and are formed fromgreywacke loess and older gravels.
Level III & IV Descriptions
Level III
Area
Elevation
Location
Climate
Landform
Soils
Level IV
B8.1 – No Subdivision at Level III
87,068 ha
350 m
Coastal hills around the Wairau, Awatere and Clarence Rivers, Marlborough
Mild temperatures, high solar radiation, high vapour pressure deficits, moderateannual water deficits
Strongly rolling hills
Well-drained soils of moderate fertility from greywacke loess and colluvium,sandstones
a. much cooler winter temperatures, steep hillsb. warmer temperatures, much lower vapour pressure deficitsc. warmer winter temperatures, higher vapour pressure deficits

67
The LENZ Environments
Environment B9This environment mostly occurs on alluvial terraces of varying ages adjacent to rivers
and streams in the northeastern South Island from the Wairau River south to Kaikoura.Temperatures within the environments are mild with high solar radiation, high vapourpressure deficits and high annual water deficits. Well-drained soils of high naturalfertility are formed from alluvial gravels, sands and greywacke rock.
Level III & IV Descriptions
Level III
Area
Elevation
Location
Climate
Landform
Soils
Level IV
B9.1
15,528 ha
75 m
Valleys of the Wairau, Awatere andClarence Rivers, Marlborough
Mild temperatures, very high solarradiation, high vapour pressuredeficits, high annual water deficits
Very gently undulating plains
Well-drained soils of high fertilityfrom greywacke alluvium with someloess
a. flat plains, strongly induratedb. higher vapour pressure deficits
B9.2
3176 ha
150 m
Valleys of the Wairau, Awatere andClarence Rivers, Marlborough
Mild temperatures, very high solarradiation, very high vapour pressuredeficits, high annual water deficits
Undulating plains
Imperfectly drained soils of highfertility from greywacke alluvium
a. – no subdivision at Level IV – sameas B9.2
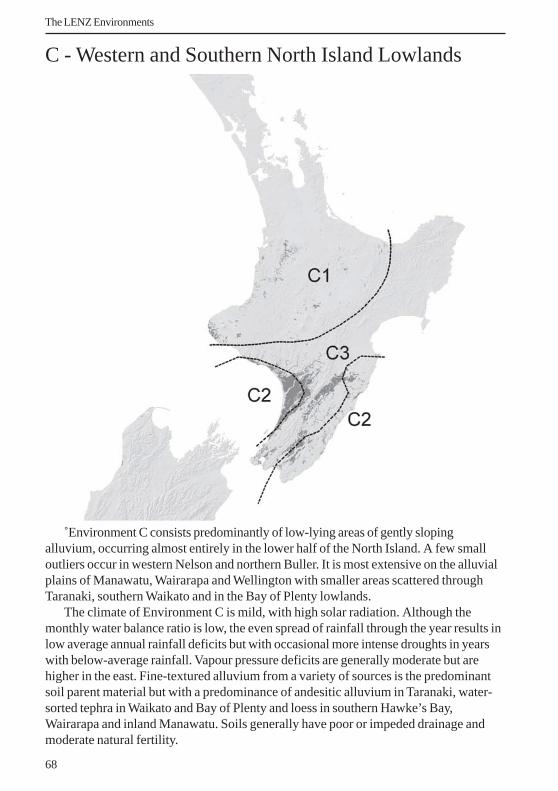
68
The LENZ Environments
C - Western and Southern North Island Lowlands
˚Environment C consists predominantly of low-lying areas of gently slopingalluvium, occurring almost entirely in the lower half of the North Island. A few smalloutliers occur in western Nelson and northern Buller. It is most extensive on the alluvialplains of Manawatu, Wairarapa and Wellington with smaller areas scattered throughTaranaki, southern Waikato and in the Bay of Plenty lowlands.
The climate of Environment C is mild, with high solar radiation. Although themonthly water balance ratio is low, the even spread of rainfall through the year results inlow average annual rainfall deficits but with occasional more intense droughts in yearswith below-average rainfall. Vapour pressure deficits are generally moderate but arehigher in the east. Fine-textured alluvium from a variety of sources is the predominantsoil parent material but with a predominance of andesitic alluvium in Taranaki, water-sorted tephra in Waikato and Bay of Plenty and loess in southern Hawke’s Bay,Wairarapa and inland Manawatu. Soils generally have poor or impeded drainage andmoderate natural fertility.

69
The LENZ Environments
DENDROGRAM OF C

70
The LENZ Environments
Envi
ronm
ent
Are
a (ha
)
Alti
tude
(m)
Mea
n an
nual
tem
pera
ture
(ºC
)
Mea
n m
inim
um te
mpe
ratu
re o
f the
cold
est m
onth
(ºC
)
Mea
n an
nual
sola
r rad
iatio
n (M
J/m2 /d
ay)
Mea
n w
inte
r sol
ar ra
diat
ion
(MJ/m
2 /day
)
Oct
ober
vap
our p
ress
ure d
efic
it (k
Pa)
Mon
thly
wat
er b
alan
ce ra
tio (r
atio
)
Mea
n an
nual
wat
er d
efic
it (m
m)
Slop
e (º)
Dra
inag
e (1=
very
poo
r to
5=go
od)
Aci
d so
lubl
e pho
spho
rus (
1=v.
low
to 5
=v. h
igh)
Exch
ange
able
calc
ium
(1=l
ow to
5=v
. hig
h)
Parti
cle s
ize (
1=cl
ay/si
lt to
5=b
ould
ers–
mas
sive)
Indu
ratio
n (1
=non
-indu
rate
d to
5=v
. stro
ngly
ind.
)
Soil
Age
(1=r
aw/re
cent
, 2=o
lder
)
Che
mic
al li
mita
tions
(1=l
ow, 2
=sal
ine,
3=u
ltram
afic
)
C1 84,25
9
166
12.8 3.6 14.5 5.2 0.3 3.4 12.7 1.6 1.8 2.3 2.0 1.3 1.6 2.0 1.0
C2
259,2
01 198
12.0 3.1 14.0 4.6 0.3 2.9 40.5 2.9 3.8 2.0 2.0 1.0 1.0 2.0 1.0
C3
295,7
30 71
12.7 3.7 14.2 4.7 0.4 2.2
106.5 0.8 2.9 2.2 2.0 1.3 1.8 2.0 1.0

71
The LENZ Environments
Environment C1Environment C1 occurs mostly as scattered small units of poorly-drained land along
rivers and streams in southern Waikato, lahar deposits in Taranaki and coastal wetlandsin western Nelson. The climate is warm, with high solar radiation and slight annualwater deficits. Fine-textured alluvium is the predominant soil parent material and soilsare poorly to very poorly-drained and of low natural fertility.
Level III & IV Descriptions
Level III
Area
Elevation
Location
Climate
Landform
Soils
Level IV
C1.1
15,272 ha
370 m
Western Nelson,Taranaki
Mild temperatures, highsolar radiation, slightannual water deficits
Very gently undulatingplains
Poorly-drained peat soilsof low fertility
a. warmer temperatures,very poor drainage
b. much coolertemperatures, verypoor drainage
c. cooler temperatures
C1.2
50,660 ha
130 m
Southern Waikato,Taranaki
Warm temperatures,high solar radiation,slight annual waterdeficits
Gently undulatingplains
Poorly-drained peatsoils of low fertility withsome alluvium
a. as for C1.2b. much cooler
temperatures, verypoor drainage, verylow fertility
c. much coolertemperatures,undulating plains,very poor drainage
C1.3
18,540 ha
100 m
Taranaki
Warm temperatures,high solar radiation,slight annual waterdeficits
Flat plains
Poorly-drained soils ofhigh fertility from MtTaranaki lahar deposits
a. – no subdivision atLevel IV – same asC1.3

72
The LENZ Environments
Environment C2Environment C2 occupies gently undulating inland plains in Manawatu, southern
Hawke’s Bay and northern Wairarapa with smaller areas in Wellington. The climate ismild, with high solar radiation, moderate vapour pressure deficits and low annual waterdeficits. Loess is the predominant parent material, along with extensive areas of finealluvium. Soils are of imperfect drainage and low natural fertility.
Level III & IV Descriptions
Level III
Area
Elevation
Location
Climate
Landform
Soils
Level IV
C2.1 – No Subdivision at Level III
259,512 ha
200 m
Inland Manawatu, southern Hawke’s Bay, northern Wairarapa and parts ofWellington
Mild temperatures, high solar radiation, moderate vapour pressure deficits andlow annual water deficits
Gently undulating plains
Imperfectly drained soils of low fertility from loess with some fine alluvium
a. higher annual water deficits, poorly-drainedb. poorly-drainedc. cooler temperatures, lower annual water deficitsd. very gently undulating, well-drainede. as for C2.1

73
The LENZ Environments
Environment C3This environment includes the dry, flat, low-lying plains of Manawatu, southern
Hawke’s Bay and Wairarapa. Warm temperatures, high solar radiation, moderatevapour pressure deficits and moderate annual water deficits typify the climate. Whileloess is the most widespread soil parent material, alluvium and old dune sands are alsocommon. Slopes are very gentle, and soils are generally imperfectly drained.
Level III & IV Descriptions
Level III
Area
Elevation
Location
Climate
Landform
Soils
Level IV
C3.1
72,060 ha
85 m
Manawatu, southern Hawke’s Bay,central Wairarapa
Warm temperatures, high solarradiation, low annual water deficits
Flat plains
Well-drained, low fertility soils of loesswith some alluvium
a. warmer winter temperatures,imperfectly drained
b. as for C3.1
C3.2
223,384 ha
65 m
Manawatu, southern Hawke’s Bay,central Wairarapa
Warm temperatures, high solarradiation, moderate annual waterdeficits
Flat plains
Imperfectly drained soils of lowfertility from loess with some dunesand and tephra
a. as for C3.2b. lower annual water deficitsc. moderate fertility, strongly
induratedd. gently undulating plainse. cooler winter temperatures, much
higher annual water deficits

74
The LENZ Environments
˚D - Northern Hill Country
Environment D encompasses hill country of low to moderate elevation in the centraland northern regions of the North Island. It occurs only sporadically at higher elevationin Northland and Auckland but is more extensive on the Coromandel Peninsula, in thewest from Port Waikato south to about Mokau and in the east from the eastern Bay ofPlenty to central Hawke’s Bay.
Environment D has a warm climate, with high annual and winter solar radiation,low monthly water balance ratios and slight annual rainfall deficits. However, year-to-year variation in rainfall results in occasional dry years, particularly on the East Coast.Vapour pressure deficits are intermediate, although higher in the east. The terrain ofEnvironment D is hilly with moderate to steep slopes. Soil parent materials are variable,with older volcanic rocks and greywacke widespread in the north, including on theCoromandel Peninsula while mixtures of greywacke and Tertiary rocks with somerhyolitic tephra predominate in the east. Soils are generally moderately drained and oflow to moderate natural fertility.

75
The LENZ Environments
DENDROGRAM FOR D

76
The LENZ Environments
Envi
ronm
ent
Are
a (ha
)
Alti
tude
(m)
Mea
n an
nual
tem
pera
ture
(ºC
)
Mea
n m
inim
um te
mpe
ratu
re o
f the
cold
est m
onth
(ºC
)
Mea
n an
nual
sola
r rad
iatio
n (M
J/m2 /d
ay)
Mea
n w
inte
r sol
ar ra
diat
ion
(MJ/m
2 /day
)
Oct
ober
vap
our p
ress
ure d
efic
it (k
Pa)
Mon
thly
wat
er b
alan
ce ra
tio (r
atio
)
Mea
n an
nual
wat
er d
efic
it (m
m)
Slop
e (º)
Dra
inag
e (1=
very
poo
r to
5=go
od)
Aci
d so
lubl
e pho
spho
rus (
1=v.
low
to 5
=v. h
igh)
Exch
ange
able
calc
ium
(1=l
ow to
5=v
. hig
h)
Parti
cle s
ize (
1=cl
ay/si
lt to
5=b
ould
ers–
mas
sive)
Indu
ratio
n (1
=non
-indu
rate
d to
5=v
. stro
ngly
ind.
)
Soil
Age
(1=r
aw/re
cent
, 2=o
lder
)
Che
mic
al li
mita
tions
(1=l
ow, 2
=sal
ine,
3=u
ltram
afic
)
D1
662,3
18 217
13.8 5.6 15.0 6.3 0.4 3.4 14.5
12.3 4.3 2.7 1.4 4.6 3.9 2.0 1.0
D2
447,4
57 187
13.1 4.3 14.5 5.5 0.3 3.6 13.8 9.4 4.0 1.9 1.6 3.7 3.4 2.0 1.0
D3
687,7
23 263
12.8 3.8 14.8 5.8 0.5 2.9 34.0
11.2 4.3 2.1 2.4 4.2 3.4 2.0 1.0
D4
306,0
70 669
10.7 2.6 14.8 5.9 0.3 4.9 0.3 18.9 4.3 1.3 1.2 4.3 3.9 2.0 1.0

77
The LENZ Environments
Environment D1Environment D1 consists of hills in Northland, Auckland, Coromandel and the
eastern Bay of Plenty. The climate is warm with very high solar radiation and slightannual water deficits. Predominant soil parent materials are deeply weathered olderbasalts (Northland), andesites and rhyolites with greywacke, argillite and sandstonelocally important. Soils are generally imperfectly drained and of moderate naturalfertility.
Level III & IV Descriptions
Level III
Area
Elevation
Location
Climate
Landform
Soils
Level IV
D1.1
412,240 ha
220 m
Northland, CoromandelPeninsula, Great BarrierIsland, East Cape,Waitakere Ranges
Warm temperatures,very high solar radiation,low monthly waterbalance ratios, slightannual water deficits
Strongly rolling hills
Well-drained soils ofmoderate fertility fromandesite or basalt
a. warmer temperaturesb. much warmer
temperatures, higherannual water deficits,low fertility
c. cooler temperatures,low fertility
d. low fertilitye. steep hills, very low
fertility
D1.2
154,564 ha
235 m
Northland, CoromandelPeninsula
Warm temperatures,very high solarradiation, low monthlywater balance ratios,slight annual waterdeficits
Easy rolling hills
Imperfectly drainedsoils of moderatefertility from andesite orbasalt
a. much coolertemperatures, lowervapour pressuredeficits
b. warmer temperaturesc. cooler temperatures,
rolling hills, lowfertility
D1.3
95,428 ha
190 m
East Cape
Warm temperatures, veryhigh solar radiation, highvapour pressure deficits,slight annual waterdeficits
Rolling hills
Imperfectly drained soilsof low fertility frommudstone, greywackeand argillite
a. undulating hills, veryfine-textured soils fromtephra and Tertiaryrocks
a. strongly rolling hills,very low fertility

78
The LENZ Environments
Environment D2This environment includes the Hunua Ranges, extensive areas of western Waikato
hill-country and the Mahia Peninsula in Hawke’s Bay. This environment has moregently sloping terrain and occurs at lower elevations than the other environments in D.This combined with the generally high westerly exposure results in warm temperatureswith high solar radiation and slight annual water deficits. Greywacke is the mostextensive soil parent material but Tertiary mudstones and rhyolitic ash are also common.Soils are moderately well-drained and of low natural fertility.
Level III & IV Descriptions
Level III
Area
Elevation
Location
Climate
Landform
Soils
Level IV
D2.1
223,004 ha
145 m
Hunua Ranges,Auckland region
Warm temperatures,high solar radiation, lowannual water deficits
Easy rolling hills
Imperfectly drained soilsof low fertility fromcalcareous mudstone orgreywacke with argillite
a. strongly rolling hills,very low fertility
b. moderate fertility
D2.2
10,944 ha
155 m
Western Waikato
Warm temperatures,high solar radiation, lowannual water deficits
Strongly rolling hills
Imperfectly drainedsoils of moderatefertility from mudstone
a. – no subdivision atLevel IV – same asD2.2
D2.3
213,428 ha
235 m
Mahia Peninsula,Hawke’s Bay
Warm temperatures,high solar radiation,slight annual waterdeficits
Easy rolling hills
Imperfectly drained soilsof low fertility fromtephra, mudstone orgreywacke
a. as for D2.3b. cooler temperatures,
steep hills, very lowfertility
c. poorly-drained, verylow fertility

79
The LENZ Environments
Environment D3Environment D3 is extensive in the eastern hills from about East Cape south to
central Hawke’s Bay. The climate is warm with high solar radiation and low annualwater deficits. Soft calcareous mudstones and sandstones are the most widespread parentmaterials with harder sandstones forming local massifs. Rhyolitic ash is widespread inthe west. Soils are generally well-drained and of low natural fertility.
Level III & IV Descriptions
Level III
Area
Elevation
Location
Climate
Landform
Soils
Level IV
D3.1
256,888 ha
185 m
Gisborne region,northern Hawke’s Bay
Warm temperatures,high solar radiation, highvapour pressure deficits,low annual water deficits
Rolling hills
Imperfectly drained soilsof moderate fertilityfrom sometimescalcareous sandstone andmudstone
a. high fertilityb. as for D3.1c. higher annual water
deficits, lower drainage,high fertility
d. much higher annualwater deficits
D3.2
195,812 ha
395 m
Gisborne region
Mild temperatures, highsolar radiation, highvapour pressure deficits,slight annual waterdeficits
Strongly rolling hills
Imperfectly drainedsoils of moderatefertility from sometimescalcareous sandstoneand mudstone
a. as for D3.2b. warmer winter
temperatures, steephills, low fertility
D3.3
235,116 ha
235 m
Northern Hawke’s Bay
Warm temperatures,high solar radiation, highvapour pressure deficits,low annual water deficits
Easy rolling hills
Well-drained soils of lowfertility from rhyolitictephra, sandstone andmudstone
a. strongly weathered,very fine-textured soils
b. weathered, very fine-textured soils
c. very coarse-texturedsoils
d. warmer summer andwinter temperatures,higher annual waterdeficits, low fertility,coarse-textured soils

80
The LENZ Environments
Environment D4Environment D4 encompasses an extensive area of steep hills and mountains from
the East Cape through the Urewera National Park, following the Raukumara andHuiarau Ranges, south though the North Island to the Maungaharuru Range. Theclimate is mild with high solar radiation, no annual water deficits and intermediatemonthly water balance ratios. Greywacke with some argillite is the predominant parentmaterial. Soils are generally well-drained and of very low natural fertility.
Level III & IV Descriptions
Level III
Area
Elevation
Location
Climate
Landform
Soils
Level IV
D4.1 – No Subdivision at Level III
305,924 ha
670 m
Raukumara Range – East Cape and the Huiarau Range– Urewera NationalPark
Mild temperatures, high solar radiation, moderate vapour pressure deficits, noannual water deficits
Steep mountains and hills
Imperfectly drained soils of very low fertility from greywacke with someargillite, including small areas of mudstone in the Urewera National Park
a. much warmer temperatures in both summer and winter, higher vapourpressure deficits
b. as for D4.1c. much lower temperatures, lower vapour pressure deficits, much higher
monthly water balance ratios, no annual water deficits, very steep mountainsd. much lower temperatures, no annual water deficits, low fertilitye. low fertility

81
The LENZ Environments
Environment E consists of dry foothills and basin floors at mid-elevations in theeastern parts of both main islands, with the largest areas occurring in the South Island. Itis most extensive in inland parts of Canterbury and Marlborough, with smaller areas inTasman Bay. In the North Island it occurs only in inland Hawke’s Bay. Environment Ehas a cool climate with high annual solar radiation and low average annual water deficitbut high October vapour pressure deficits. The latter reflects its protection fromprevailing westerly winds by mountain ranges - the Southern Alps, Kaikoura Ranges,and the mountains of northwest Nelson in the South Island, and the Tongariro volcanoesand Kaimanawa and Kaweka Ranges in the North Island. Slopes are generally rolling tomoderate. Sedimentary rocks are the predominant soil parent material, with greywackethe most widespread followed by schist and softer Tertiary rocks. Gravels and/or loessfrom greywacke are widespread in Canterbury and Nelson, and andesitic tephra occursin Hawke’s Bay. Soils are generally well drained and of moderate natural fertility.
E - Central Dry Foothills

82
The LENZ Environments
DENDROGRAM OF E

83
The LENZ Environments
Envi
ronm
ent
Are
a (ha
)
Alti
tude
(m)
Mea
n an
nual
tem
pera
ture
(ºC
)
Mea
n m
inim
um te
mpe
ratu
re o
f the
cold
est m
onth
(ºC
)
Mea
n an
nual
sola
r rad
iatio
n (M
J/m2 /d
ay)
Mea
n w
inte
r sol
ar ra
diat
ion
(MJ/m
2 /day
)
Oct
ober
vap
our p
ress
ure d
efic
it (k
Pa)
Mon
thly
wat
er b
alan
ce ra
tio (r
atio
)
Mea
n an
nual
wat
er d
efic
it (m
m)
Slop
e (º)
Dra
inag
e (1=
very
poo
r to
5=go
od)
Aci
d so
lubl
e pho
spho
rus (
1=v.
low
to 5
=v. h
igh)
Exch
ange
able
calc
ium
(1=l
ow to
5=v
. hig
h)
Parti
cle s
ize (
1=cl
ay/si
lt to
5=b
ould
ers–
mas
sive)
Indu
ratio
n (1
=non
-indu
rate
d to
5=v
. stro
ngly
ind.
)
Soil
Age
(1=r
aw/re
cent
, 2=o
lder
)
Che
mic
al li
mita
tions
(1=l
ow, 2
=sal
ine,
3=u
ltram
afic
)
E1
921,7
70 638 9.3 -0.9
14.5 4.9 0.5 2.8 42.2
19.1 5.0 2.7 1.2 3.9 3.8 2.0 1.0
E2 16,45
6
539 9.5 -1.4
14.7 4.5 0.3 3.9 6.0 7.4 2.2 2.6 1.5 3.7 2.1 2.0 1.0
E3 68,45
5
466 9.6 -0.9
13.6 4.5 0.4 2.4 19.8 6.4 3.5 3.1 2.0 1.4 2.3 2.0 1.0
E4
320,6
16 746 8.4 -2.2
14.1 4.6 0.4 2.7 64.2 6.5 5.0 3.9 1.1 3.0 2.1 2.0 1.0

84
The LENZ Environments
Environment E1Environment E1 has a large geographic range occurring from inland Hawke’s Bay to
Nelson, Marlborough and Canterbury. The climate is cool with high solar radiation, highvapour pressure deficits and low annual water deficits. Slopes are higher than in theother Level II environments in E, reflecting the dominance of dissected hill landformsmostly with sedimentary rock parent materials but with small amounts of rhyolitic,basaltic and andesitic rock and/or ash, granite, and marble. Steep, dissected beds of coarsegravel (Moutere Gravels) are extensive in Nelson. Soils are well-drained and of moderatenatural fertility.
Level III & IV DescriptionsLevel III
Area
Elevation
Location
Climate
Landform
Soils
Level IV
E1.1
202,168 ha
435 m
Hawke’s Bay,Golden Bay,Blenheim plains
Mildtemperatures,very high solarradiation, lowannual waterdeficits
Strongly rollingfoothills
Well-drained, lowfertility soils fromMoutere /Pleistocene gravels
a. lower vapourpressure deficits,very lowfertility
b. warmertemperatures
c. higher annualwater deficits,moderatefertility
d. steep foothills
E1.2
93,068 ha
620 m
Hills south ofBlenheim
Cooltemperatures,high solarradiation,moderate annualwater deficits
Steep foothills
Well-drained,moderate fertilitysoils fromgreywacke
a. as for E1.2b. warmer winter
temperatures,coarse-texturedsoils
E1.3
64,816 ha
295 m
Coastal hillsnorth and southof Kaikoura
Mildtemperatures,warm solarradiation, highvapour pressuredeficits, lowannual waterdeficits
Steep foothills
Well-drained,moderate fertilitysoils fromgreywacke
a. lower annualwater deficits,very steepfoothills
b. higher annualwater deficits
E1.4
562,572 ha
755 m
Inland hills fromMarlboroughsouth to mid-Canterbury
Cooltemperatures,high solarradiation, lowannual waterdeficits
Steep foothills
Well-drained,moderate fertilitysoils fromgreywacke
a. very high solarradiation
b. much colderwintertemperatures,much higherannual waterdeficits
c. as for E1.4d. higher
temperatures,higher annualwater deficits
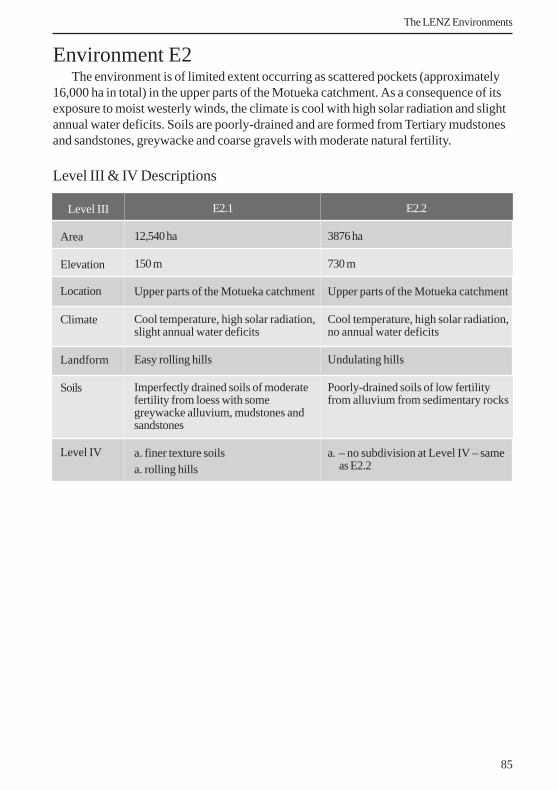
85
The LENZ Environments
Environment E2The environment is of limited extent occurring as scattered pockets (approximately
16,000 ha in total) in the upper parts of the Motueka catchment. As a consequence of itsexposure to moist westerly winds, the climate is cool with high solar radiation and slightannual water deficits. Soils are poorly-drained and are formed from Tertiary mudstonesand sandstones, greywacke and coarse gravels with moderate natural fertility.
Level III & IV Descriptions
Level III
Area
Elevation
Location
Climate
Landform
Soils
Level IV
E2.1
12,540 ha
150 m
Upper parts of the Motueka catchment
Cool temperature, high solar radiation,slight annual water deficits
Easy rolling hills
Imperfectly drained soils of moderatefertility from loess with somegreywacke alluvium, mudstones andsandstones
a. finer texture soilsa. rolling hills
E2.2
3876 ha
730 m
Upper parts of the Motueka catchment
Cool temperature, high solar radiation,no annual water deficits
Undulating hills
Poorly-drained soils of low fertilityfrom alluvium from sedimentary rocks
a. – no subdivision at Level IV – sameas E2.2

86
The LENZ Environments
Level III
Area
Elevation
Location
Climate
Landform
Soils
Level IV
Environment E3Environment E3 occurs on gently sloping sites along the inland foothills bordering
the Canterbury Plains. Climatically this environment has cool temperatures, moderatesolar radiation, very low monthly water balance ratios and slight annual water deficits.Loess is the predominant soil parent material, with smaller areas of gravel formed fromgreywacke and quartz. Soils are moderately fertile but are imperfectly drained.
Level III & IV Descriptions
E3.2
32,232 ha
380 m
Mid-and Southern Canterbury
Mild temperatures, moderate solarradiation, high vapour pressuredeficits, low annual water deficits
Undulating foothills
Imperfectly drained soils of moderatefertility from loess from greywackeand schist
a. same as E3.2b. lower elevation foothills, warmer
temperatures
E3.1
30,100 ha
570 m
Northern and Mid-Canterbury
Cool temperatures, moderate solarradiation, moderate vapour pressuredeficits, slight annual water deficits
Easy rolling foothills
Imperfectly drained soils of moderatefertility from loess from greywacke andschist
a. – no subdivision at Level IV – sameas E3.1

87
The LENZ Environments
Environment E4This environment is quite widespread, occurring in inland valleys throughout
Canterbury. The climate is generally cool with high solar radiation, moderate vapourpressure deficits and low annual water deficits. Parent materials for Environment E4consist of greywacke alluvium with some loess, colluvium and till. Soils are generallywell-drained and have high natural fertility.
Level III & IV Descriptions
Level III
Area
Elevation
Location
Climate
Landform
Soils
Level IV
E4.1
151,320 ha
700 m
Central South Island, east of theSouthern Alps
Cool temperatures, high solarradiation, high vapour pressure deficits,very low monthly water balance ratios,moderate annual water deficits
Gently undulating foothills
Well-drained, high fertility soils fromgreywacke alluvium with some loess,colluvium and till
a. much higher annual water deficitsb. as for E4.1
E4.2
169,336 ha
785 m
Central South Island, east of theSouthern Alps, closer to the coast
Cool temperatures, high solarradiation, moderate vapour pressuredeficits, low monthly water balanceratios, slight annual water deficits
Easy rolling foothills
Well-drained, high fertility soils fromgreywacke alluvium with some loess,colluvium and till
a. as for E4.2b. higher temperatures, lower monthly
water balance ratios, higher annualwater deficits

88
The LENZ Environments
˚Environment F extends across large areas of low to mid-elevation hill country incentral and southern North Island, extending along the western flanks of the RaukumaraRange in the northeast to Taranaki in the west and to Wellington and Wairarapa in thesouth. In the South Island it occurs on the northern coastal hills of northwest Nelson, in theMarlborough Sounds, around Kaikoura and on Banks Peninsula.
The climate of Environment F is mild, with high levels of annual solar radiation andmoderate winter solar radiation. Although it has a low monthly water balance ratio, theeven spread of rainfall throughout the year means that rainfall deficits are slight on averagebut with droughts in years with below-average rainfall, particularly in the east. A diverserange of soil parent materials include older Mesozoic greywacke and granite, youngerTertiary sandstones and mudstones, and a range of volcanic tephra, mostly rhyolitic in thecentral North Island but with more fertile andesitic tephra around the Tongariro volcanoesand Taranaki. Loess dominates on Banks Peninsula but with some protruding basalticrock. Soils are generally well-drained and many are of low natural fertility.
F - Central Hill Country and Volcanic Plateau

89
The LENZ Environments
DENDROGRAM OF F

90
The LENZ Environments
Envi
ronm
ent
Are
a (ha
)
Alti
tude
(m)
Mea
n an
nual
tem
pera
ture
(ºC
)
Mea
n m
inim
um te
mpe
ratu
re o
f the
cold
est m
onth
(ºC
)
Mea
n an
nual
sola
r rad
iatio
n (M
J/m2 /d
ay)
Mea
n w
inte
r sol
ar ra
diat
ion
(MJ/m
2 /day
)
Oct
ober
vap
our p
ress
ure d
efic
it (k
Pa)
Mon
thly
wat
er b
alan
ce ra
tio (r
atio
)
Mea
n an
nual
wat
er d
efic
it (m
m)
Slop
e (º)
Dra
inag
e (1=
very
poo
r to
5=go
od)
Aci
d so
lubl
e pho
spho
rus (
1=v.
low
to 5
=v. h
igh)
Exch
ange
able
calc
ium
(1=l
ow to
5=v
. hig
h)
Parti
cle s
ize (
1=cl
ay/si
lt to
5=b
ould
ers–
mas
sive)
Indu
ratio
n (1
=non
-indu
rate
d to
5=v
. stro
ngly
ind.
)
Soil
Age
(1=r
aw/re
cent
, 2=o
lder
)
Che
mic
al li
mita
tions
(1=l
ow, 2
=sal
ine,
3=u
ltram
afic
)
F1
1,826
,616
312
11.5 2.7 14.2 4.8 0.3 3.6 20.6
13.6 4.6 1.5 1.3 4.7 3.8 2.0 1.0
F2 13,39
3
216
11.7 2.3 15.0 4.7 0.4 3.8 3.2 13.0 3.0 1.7 1.9 4.9 3.9 2.0 1.0
F3 96,13
0
272
11.0 3.2 13.7 4.5 0.4 2.8
104.0 16.6 4.1 3.5 2.0 2.1 2.6 2.0 1.0
F4
386,4
68 176
12.2 3.5 14.0 4.7 0.4 2.8 93.3 7.9 4.3 2.4 2.0 4.8 3.2 2.0 1.0
F5
302,1
41 168
12.5 4.4 14.7 5.0 0.3 4.0 16.3 2.2 4.9 4.6 1.9 1.3 2.2 2.0 1.0
F6
1,196
,632
355
12.1 2.6 14.8 5.7 0.3 3.7 5.2 10.6 5.0 2.0 1.9 1.1 2.1 2.0 1.0
F7
1,431
,198
507
10.9 1.5 14.4 5.1 0.3 3.5 6.8 5.7 4.9 1.8 1.3 1.6 2.5 2.0 1.0

91
The LENZ Environments
F1.3
394,452 ha
370 m
SouthernTaranaki andManawatu
Mildtemperatures,high solarradiation,moderate vapourpressure deficits,low annual waterdeficits
Strongly rollinghills
Well-drained,low fertility soilsfrom mudstoneand sandstone
F1.4
290,292 ha
305 m
Wellington andWairarapa
Mildtemperatures,high solarradiation,moderate vapourpressure deficits,low annual waterdeficits
Strongly rollinghills
Imperfectlydrained soils ofvery low fertilityfrom mudstonesandstone,greywacke andargillite
F1.1
845,824 ha
325 m
NorthernTaranaki andsouth Waikatovolcanic cones
Mildtemperatures,high solarradiation,moderate vapourpressure deficits,slight annualwater deficits
Strongly rollinghills
Well-drained, lowfertility soils frommudstone andsandstone
F1.2
296,024 ha
200 m
Coastal Wairarapaand MarlboroughSounds
Mildtemperatures,high solarradiation,moderate vapourpressure deficits,low annual waterdeficits
Steep hills
Well-drained, lowfertility soils fromgreywacke andargillite
Environment F1Environment F1 is the largest and most geographically diverse of the Level II
environments. It is most extensive in the North Island where it includes old volcaniccones of southern Waikato, extensive dissected Tertiary hills of inland Taranaki andnorthern Manawatu, and low to mid-elevation hills in Wellington and Wairarapa.Smaller areas in the northern South Island include dissected low elevation hills in theMarlborough Sounds and in Golden Bay. The climate is mild with high solar radiationand slight annual water deficits. Predominant parent materials include Tertiarysandstones, mudstones and argillites with some volcanic material in the north andgreywacke in Wellington and Wairarapa. Soils are well-drained and of low naturalfertility.
Level III & IV Descriptions
Level III
Area
Elevation
Location
Climate
Landform
Soils

92
The LENZ Environments
Level III
Level IV
F1.3
a. steep hills,imperfectlydrained
b. warmertemperatures,steep hills, verylow fertility
c. very lowfertility
d. coolertemperatures,higher annualwater deficits.
F1.4
a. easy rolling hillsb. much warmer
wintertemperatures
c. lower annualwater deficits,steep hills
d. low fertility
F1.1
a. higher monthlywater balanceratios, no annualwater deficits
b. much warmertemperatures,steep hills
c. moderatefertility,moderateinduration
d. steep hills, verylow fertility
e. much highervapour pressuredeficits, easyrolling hills
f. higher annualwater deficits,easy rolling hills
g. much coolertemperatures,very highfertility
F1.2
a. lower annualwater deficits
b. moderatefertility
c. higher annualwater deficits,very low fertility
d. strongly rollinghills, very lowfertility

93
The LENZ Environments
Environment F2Environment F2 consists of a very small pocket of low elevation hill-country in the
Abel Tasman National Park. The climate is mild but receives very high amounts of solarradiation and has almost no annual water deficits. Soils generally have imperfectdrainage and are formed predominantly on granite but with some calcareous mudstoneand marble.
Level III & IV Descriptions
Level III
Area
Elevation
Location
Climate
Landform
Soils
Level IV
F2.1 – No Subdivision at Level III
13,308 ha
215 m
Abel Tasman National Park
Mild temperatures, very high solar radiation, negligible annual water deficits
Strongly rolling hills
Imperfectly drained soils of low fertility from granite and mudstone
a. lower vapour pressure deficits, very low fertilityb. much higher vapour pressure deficits, high fertility

94
The LENZ Environments
Level III
Area
Elevation
Location
Climate
Landform
Soils
Level IV
Environment F3Environment F3 is located on Banks Peninsula and has a mild climate with moderate
solar radiation and moderate annual water deficits. It encompasses the eroded remnantsof old basaltic volcanoes whose steep slopes are now largely mantled with loess. Soilshave moderate to high natural fertility, particularly where loess deposits are thin enoughto expose the underlying basalt.
Level III & IV Descriptions
F3.1
54,900 ha
185 m
Banks Peninsula
Mild temperatures,moderate solar radiation,moderate vapourpressure deficits,moderate annual waterdeficits
Strongly rolling hills
Imperfectly drained soilsof moderate fertility fromloess derived fromgreywacke and schist
a. higher annual waterdeficits
b. much lower annualwater deficits, steephills
F3.2
10,936 ha
200 m
Banks Peninsula
Mild temperatures,moderate solarradiation, moderatevapour pressuredeficits, moderateannual water deficits
Strongly rolling hills
Well-drained, very highfertility soils fromweathered basalt
a. – no subdivision atLevel IV – same asF3.2
F3.3
30,256 ha
455 m
Banks Peninsula
Mild temperatures,moderate solar radiation,moderate vapour pressuredeficits, low annual waterdeficits
Steep hills
Well-drained, highfertility soils from acombination of loessderived from greywackeand schist and weatheredbasalt
a. very high fertility, well-drained, coarse-texturedsoils
b. moderate fertility, well-drained, fine-texturedsoils

95
The LENZ Environments
Level III
Area
Elevation
Location
Climate
Landform
Soils
Level IV
Environment F4This environment consists of the southeastern coastal hills of Hawke’s Bay,
Wairarapa, and Wellington. The climate is mild with high solar radiation, moderatevapour pressure deficits and low annual water deficits. Soils are generally moderately towell-drained and are formed from easily weathered Tertiary mudstones with someargillite, limestone and sandstone with small amounts of older greywacke.
Level III & IV Descriptions
F4.1 – No Subdivision at Level III
386,468 ha
175 m
Hawke’s Bay, Wairapa, and Wellington
Mild temperatures, high solar radiation, moderate vapour pressure deficits, lowannual water deficits
Easy rolling hills
Imperfectly drained soils of low fertility from mudstone, sandstone and argillite
a. moderate fertilityb. warmer temperatures, higher annual water deficits, well-drained, moderate
fertilityc. lower annual water deficits, rolling hills, moderate fertilityd. rolling hills, moderate fertilitye. very low fertilityf. higher annual water deficits, rolling hills, imperfect drainage

96
The LENZ Environments
Environment F5Environment F5 encompasses the rolling lower slopes of the Taranaki ringplain with
smaller areas at low elevation in Golden Bay and the inner Marlborough Sounds. Thisenvironment has a warm climate with high solar radiation. The annual water deficit isslight, mainly because of exposure to rain-bearing westerly winds. Soils are generallywell-drained and of high natural fertility and are formed from either andesitic ash andlahar deposits (Taranaki) or alluvium from granite and sedimentary rocks (northernSouth Island).
Level III & IV Descriptions
Level III
Area
Elevation
Location
Climate
Landform
Soils
Level IV
F5.1
30,928 ha
50 m
Golden Bay,Marlborough Sounds
Mild temperatures, highsolar radiation, moderatevapour pressure deficits,low monthly waterbalance ratios, slightannual water deficits
Gently undulating plains
Imperfectly drained soilsof moderate fertilityfrom sedimentaryalluvium
a. imperfect drainageb. well-drained
F5.2
250,028 ha
160 m
Taranaki plains
Warm temperatureshigh solar radiation,moderate vapourpressure deficits, lowmonthly water balanceratios, slight annualwater deficits
Gently undulatingringplain
Well-drained, very highfertility soils fromTaranaki andesitictephra
a. higher monthly waterbalance ratios
b. warmer temperaturesc. lower monthly water
balance ratios, higherannual water deficits
F5.3
21,064 ha
470 m
Lower slopes of MtTaranaki
Mild temperatures highsolar radiation, lowvapour pressure deficits,intermediate monthlywater balance ratios, noannual water deficits
Undulating low slopes ofthe Mt Taranakiringplain
Well-drained, very highfertility soils fromTaranaki andesitictephra
a. lower wintertemperatures,imperfect drainage
b. well-drained

97
The LENZ Environments
Environment F6This environment extends from the Waikato across southeastern parts of the
Coromandel Peninsula through coastal Bay of Plenty and down through the Ureweraranges to inland Gisborne and Hawke’s Bay. The climate is generally mild with highsolar radiation and slight annual water deficits. Soils are mostly formed from olderrhyolitic ash and are well-drained but of low natural fertility.
Level III & IV Descriptions
Level III
Area
Elevation
Location
Climate
Landform
Soils
Level IV
F6.1
879,336 ha
315 m
Waikato, southeastern CoromandelPeninsula, coastal Bay of Plenty, inlandGisborne and Hawke’s Bay
Mild temperatures, high solarradiation, low monthly water balanceratios, slight annual water deficits
Undulating hills
Well-drained, low fertility soils frommid-age rhyolitic tephra
a. warmer temperaturesb. cooler temperaturesc. cooler temperaturesd. warmer temperatures, higher annual
water deficitsf. cooler temperatures, lower vapour
pressure deficits
F6.2
317,624 ha
470 m
Urewera ranges, small vein runningsouthern end of the CoromandelPeninsula, western side of East Cape
Mild temperatures, high solarradiation, no annual water deficits
Steep mountains
Well-drained, low fertility soils frommid age rhyolitic tephra
a. – no subdivision at Level IV – sameas F6.2

98
The LENZ Environments
Environment F7Environment F7 encompasses undulating landforms of the central volcanic plateau
and has the highest mean elevation (~500 m average) of all the F-group environments.The climate is mild with winter minimum temperatures often lowered by severeinversion frosts. Solar radiation is high. The distinctive, well-drained but relativelyinfertile soils are formed from rhyolitic ash, much of it deposited in a major eruptionapproximately 1800 years ago. More fertile soils formed from andesitic ash from theTongariro volcanoes occur in the south.
Level III & IV Descriptions
Level III
Area
Elevation
Location
Climate
Landform
Soils
Level IV
F7.1
546,480 ha
520 m
Northeastern volcanicplateau, surroundingLake Taupo
Mild temperatures, highsolar radiation, slightannual water deficits
Undulating volcanicplateau
Well-drained, very lowfertility soils fromrhyolitic flow tephra
a. warmer temperaturesb. as for F7.1c. lower temperatures, flat
volcanic plateau
F7.2
599,512 ha
390 m
Northwestern volcanicplateau
Mild temperatures, highsolar radiation, slightannual water deficits
Easy rolling volcanicplateau
Well-drained, lowfertility soils fromrhyolitic and andesitictephra some of which iswater sorted
a. strongly rollingvolcanic plateau,moderate fertility
b. cooler temperatures,undulating volcanicplateau
F7.3
284,768 ha
730 m
Southern volcanicplateau
Mild temperatures, highsolar radiation, slightannual water deficits
Undulating volcanicplateau
Well-drained, lowfertility soils fromandesitic tephra
a. cooler temperaturesb. cooler temperatures,
higher vapour pressuredeficits
c. warmer temperatures,easy rolling volcanicplateau, imperfectdrainage
d. higher annual waterdeficits, rolling volcanicplateau

99
The LENZ Environments
˚Environment G consists of recent soils in the lowlands of the northern two-thirds ofthe North Island and is dominated by two contrasting landforms. The first consists ofnarrow alluvial floodplains along rivers and larger streams distributed throughoutNorthland, Auckland, Waikato, Bay of Plenty and Gisborne, and extending intonorthern Hawke’s Bay in the east and to coastal Taranaki in the west. The secondincludes coastal sand dunes that are most extensive along the west coast of the northernNorth Island. Environment G also includes smaller areas of land in which soils areformed from erosion debris from greywacke and argillite, soft Tertiary rocks, estuarinealluvium and peat. Environment G has a warm climate with very high annual andwinter solar radiation, reflecting its northern location. Average water deficits are low andvapour pressure deficits are moderate, but the low monthly water balance ratio results indroughts in years with below-average rainfall, particularly in the east. The terrain isgenerally flat to gently sloping. Soils are typically well-drained but of low to moderatefertility.
G - Northern Recent Soils

100
The LENZ Environments
DENDROGRAM OF G

101
The LENZ Environments
Envi
ronm
ent
Are
a (ha
)
Alti
tude
(m)
Mea
n an
nual
tem
pera
ture
(ºC
)
Mea
n m
inim
um te
mpe
ratu
re o
f the
cold
est m
onth
(ºC
)
Mea
n an
nual
sola
r rad
iatio
n (M
J/m2 /d
ay)
Mea
n w
inte
r sol
ar ra
diat
ion
(MJ/m
2 /day
)
Oct
ober
vap
our p
ress
ure d
efic
it (k
Pa)
Mon
thly
wat
er b
alan
ce ra
tio (r
atio
)
Mea
n an
nual
wat
er d
efic
it (m
m)
Slop
e (º)
Dra
inag
e (1=
very
poo
r to
5=go
od)
Aci
d so
lubl
e pho
spho
rus (
1=v.
low
to 5
=v. h
igh)
Exch
ange
able
calc
ium
(1=l
ow to
5=v
. hig
h)
Parti
cle s
ize (
1=cl
ay/si
lt to
5=b
ould
ers–
mas
sive)
Indu
ratio
n (1
=non
-indu
rate
d to
5=v
. stro
ngly
ind.
)
Soil
Age
(1=r
aw/re
cent
, 2=o
lder
)
Che
mic
al li
mita
tions
(1=l
ow, 2
=sal
ine,
3=u
ltram
afic
)
G1
105,0
92 49
15.0 7.2 15.1 6.4 0.4 2.2 85.4 2.5 5.0 1.0 1.0 2.0 4.0 1.0 1.0
G2 8363 91
14.2 5.2 15.1 6.3 0.5 3.9 6.9 4.3 5.0 1.0 1.0 3.7 4.0 1.0 1.0
G3
151,6
04 47 14.5 5.2 14.9 6.0 0.4 2.8 37.7 1.7 4.1 2.0 2.2 1.2 1.2 1.0 1.0
G4
57,12
9 24
14.2 4.5 14.9 5.8 0.4 2.6 45.9 0.6 1.8 2.0 2.1 1.2 1.0 1.0 1.0
G5 35
3 16
13.9 5.8 14.4 5.2 0.3 3.3 10.3 2.3 1.0 2.0 3.0 1.0 1.0 1.0 2.0
G6
21,53
5
1840 13.2 3.9 14.8 5.9 0.5 2.6 57.4 8.2 3.4 2.4 2.5 3.2 2.4 1.0 1.0

102
The LENZ Environments
Environment G1Environment G1 consists of coastal sands occurring from Cape Egmont to North
Cape along the North Island’s west coast and from Auckland City north in the east. It ismost extensive about the Kaipara Peninsulas and along Ninety Mile Beach. Climaticconditions are very warm, with very high levels of solar radiation, moderate vapourpressure deficits, low monthly water balance ratios and low annual water deficits. Dunessands are by far the most extensive soil parent material, but small areas of argillite andgreywacke with recent soils also occur on Motutapu Island in the Hauraki Gulf. Soils arewell-drained but of low natural fertility.
Level III & IV Descriptions
Level III
Area
Elevation
Location
Climate
Landform
Soils
Level IV
G1.1 – No Subdivision at Level III
105,224 ha
50 m
West coast of northern North Island, some islands in the Hauraki Gulf
Very warm temperatures, very high solar radiation, moderate vapour pressuredeficits, low monthly water balance ratios, low annual water deficits
Gently undulating coastal dunes
Recent, well-drained soils of very low fertility from dune sands
a. warmer temperatures, higher annual water deficits, North Capeb. higher annual water deficits, easy rolling coastal dunes, west coast south of
Ninety Mile beachc. cooler winter temperatures, Hauraki Gulf islandsd. much cooler temperatures, much lower annual water deficits, Port Waikato
south to Cape Egmont

103
The LENZ Environments
Environment G2Environment G2 occurs predominantly along the coastal rivers and streams at the
northern end of the Raukamara Range, but a small area also occurs to the west ofTauranga Harbour. The climate is warm, with very high levels of solar radiation, highvapour pressure deficits (reflecting the more eastern location) and slight annual waterdeficits. Soil parent materials in the east consist of coarse erosion debris from greywackeand argillite while dune sands predominate on the Tauranga coast. The natural soilfertility is low and drainage is moderate.
Level III & IV Descriptions
Level III
Area
Elevation
Location
Climate
Landform
Soils
Level IV
G2.1 – No Subdivision at Level III
8308 ha
95 m
East Cape, Tauranga
Warm temperatures, very high levels of solar radiation, high vapour pressuredeficits, slight annual water deficits
Undulating coastal and river plains
Recent, well-drained soils of very low fertility from greywacke, argillite andsand
a. lower temperatures, easy rolling floodplainsb. as for G2.1

104
The LENZ Environments
Environment G3Environment G3 is widely distributed along gently sloping flood-plains of rivers and
larger streams throughout the northern half of the North Island, occurring in Northland,Waikato, the Bay of Plenty, the more coastal parts of Gisborne, and northern and centralHawke’s Bay. The climate is warm with high solar radiation, high vapour pressuredeficits and low annual water deficits. Soil parent materials are mostly fine-texturedalluvium with some rhyolitic ash, dune sand and loess. Drainage is moderate and thenatural soil fertility is moderate to low.
Level III & IV Descriptions
G3.2
34,332 ha
45 m
Port Waikatoarea, coastal EastCape
Warmtemperatures,high solarradiation, highvapour pressuredeficits, lowannual waterdeficits
Gently undulatingflood plains
Recent,imperfectlydrained soils oflow fertility frommixed alluvium
a. much warmertemperatures,lower annualwater deficits
b. higher vapourpressure deficits
c. imperfectdrainage
d. high fertility
G3.3
38,952 ha
45 m
Bay of Plenty,Whakatane,Waikato
Warmtemperatures,high solarradiation,moderate vapourpressure deficits,low annual waterdeficits
Very gentlyundulating floodplains
Recent, well-drained soils oflow fertility frommixed alluvium
a. as for G3.3b. moderately
indurated
G3.4
7348 ha
50 m
NorthernHawke’s Bay
Warmtemperatures,high solarradiation, highvapour pressuredeficits, lowannual waterdeficits
Gentlyundulating floodplains
Recent, well-drained soils oflow fertility frommixed alluvium
a. higher annualwater deficits,very lowfertility, wellindurated
b. as for G3.4
G3.1
71,080 ha
50 m
Northland
Very warmtemperatures,high solarradiation,moderate vapourpressure deficits,low annual waterdeficits
Very gentlyundulating floodplains
Recent,imperfectlydrained soils oflow fertility frommixed alluvium
a. well-drainedsoils, moderatefertility
b. as for G3.1
Level III
Area
Elevation
Location
Climate
Landform
Soils
Level IV

105
The LENZ Environments
Environment G4Environment G4 is much less extensive than the previous environment, occurring on
flat terrain from Auckland and northern Coromandel to the Bay of Plenty. The climateis warm, with high levels of solar radiation, moderate vapour pressure deficits and lowannual water deficits. Alluvium from a variety of sources is the dominant parent materialwith some peat and estuarine alluvium. Soils are poorly-drained and of moderate to lownatural fertility.
Level III & IV Descriptions
Level III
Area
Elevation
Location
Climate
Landform
Soils
Level IV
G4.1 – No Subdivision at Level III
57,048 ha
25 m
Auckland, Coromandel, Bay of Plenty
Warm temperatures, high solar radiation, moderate vapour pressure deficits, lowannual water deficits
Very gently undulating flood plains
Recent, poorly-drained soils of low fertility from mixed alluvium
a. much warmer winter temperatures, lower annual water deficitsb. much cooler winter temperaturesc. as for G4.1d. saline soils

106
The LENZ Environments
Environment G5Environment G5 is of very limited extent, consisting of three coastal wetlands on the
north Taranaki coast at Mokau and Waitoetoe. The climate is warm, with high solarradiation, low vapour pressure deficits and slight annual water deficits. These wetlandshave very poorly-drained, saline soils formed from fine estuarine alluvium.
Level III & IV Descriptions
Level III
Area
Elevation
Location
Climate
Landform
Soils
Level IV
G5.1 – No Subdivision at Level III
348 ha
15 m
North Taranaki
Warm temperatures, high solar radiation, low vapour pressure deficits, slightannual water deficits
Very gently undulating wetlands
Recent, very poorly-drained, saline soils of moderate fertility from estuarinealluvium
a. – no subdivision at Level IV – same as G5.1

107
The LENZ Environments
Environment G6Environment G6 occurs on gently sloping but highly erodable hills in the Gisborne
District. Climatically this environment is warm, with high solar radiation, high vapourpressure deficits and slight annual water deficits. Parent materials are mainly calcareousmudstone and sandstone with some argillite. Soils are recent, imperfectly drained and ofmoderate natural fertility
Level III & IV Descriptions
Level III
Area
Elevation
Location
Climate
Landform
Soils
Level IV
G6.1 – No Subdivision at Level III
21,560 ha
190 m
East Cape
Warm temperatures, high solar radiation, high vapour pressure deficits, slightannual water deficits
Easy rolling hills
Recent, imperfectly drained soils of moderate fertility from calcareousmudstone, sandstone and some argillite
a. low fertilityb. lower annual water deficits, high fertilityc. higher annual water deficits, high fertilityd. much higher annual water deficits, low fertility

108
The LENZ Environments
Environment H consists of scattered areas of recent soils formed generally on sandyparent materials in the central and southern North Island and the northern South Island.The two largest areas occur on the Taranaki ring-plain and in the zone affected by theTarawera eruption of 1886. Environment H has a mild climate with high solar radiation,moderate vapour pressure deficits and slight annual water deficits. The majority of theparent materials are sandy but come from a variety of sources, including Rotomahanamud and basaltic lapilli from the Tarawera eruption, rhyolitic and andesitic tephra,weakly indurated sandstone and alluvium from granite, greywacke and softer Tertiaryrocks. Soils are mostly moderately to well drained but small areas have impeded or poordrainage. Soil fertility varies widely depending on the soil parent material, with highestfertility occurring on andesitic tephra in contrast to the low fertility on alluvial depositsof rhyolitic tephra.
H - Central Sandy Recent Soils

109
The LENZ Environments
DENDROGRAM OF H

110
The LENZ Environments
Envi
ronm
ent
Are
a (ha
)
Alti
tude
(m)
Mea
n an
nual
tem
pera
ture
(ºC
)
Mea
n m
inim
um te
mpe
ratu
re o
f the
cold
est m
onth
(ºC
)
Mea
n an
nual
sola
r rad
iatio
n (M
J/m2 /d
ay)
Mea
n w
inte
r sol
ar ra
diat
ion
(MJ/m
2 /day
)
Oct
ober
vap
our p
ress
ure d
efic
it (k
Pa)
Mon
thly
wat
er b
alan
ce ra
tio (r
atio
)
Mea
n an
nual
wat
er d
efic
it (m
m)
Slop
e (º)
Dra
inag
e (1=
very
poo
r to
5=go
od)
Aci
d so
lubl
e pho
spho
rus (
1=v.
low
to 5
=v. h
igh)
Exch
ange
able
calc
ium
(1=l
ow to
5=v
. hig
h)
Parti
cle s
ize (
1=cl
ay/si
lt to
5=b
ould
ers–
mas
sive)
Indu
ratio
n (1
=non
-indu
rate
d to
5=v
. stro
ngly
ind.
)
Soil
Age
(1=r
aw/re
cent
, 2=o
lder
)
Che
mic
al li
mita
tions
(1=l
ow, 2
=sal
ine,
3=u
ltram
afic
)
H1
53,72
3
171
12.3 3.4 14.5 4.9 0.3 4.5 4.8 3.1 4.8 1.7 1.8 1.7 1.3 1.0 1.0
H2
61,27
8 431
11.5 1.4 15.0 5.6 0.3 3.6 4.5 6.9 4.8 2.8 1.5 2.1 2.7 1.0 1.0
H3 8370 129
12.2 2.6 14.7 4.7 0.3 4.4 1.3 3.4 2.4 2.9 2.5 2.4 2.1 1.0 1.0
H4
13,91
2 669 9.6 2.0 14.6 5.0 0.2 8.7 0.0 5.1 3.4 4.3 2.2 1.2 1.8 1.0 1.0

111
The LENZ Environments
Environment H1Environment H1 occurs widely at low to moderate elevations throughout the central
and southern North Island and along the north coast of the northern South Island. Theclimate is mild with high solar radiation, moderate vapour pressure deficits and slightannual water deficits. It includes lower elevation, well-drained soils of low naturalfertility formed from water sorted pumice (Taupo basin), greywacke alluvium (southernNorth Island), andesitic ash (Taranaki) and granite (South Island).
Level III & IV Descriptions
Level III
Area
Elevation
Location
Climate
Landform
Soils
Level IV
H1.1
17,036 ha
92 m
North-west South Island
Mild temperatures, highsolar radiation, slightannual water deficits
Gently undulating hills
Recent, well-drainedsoils of very low fertilityfrom granite andalluvium from granite
a. as for H1.1b. lower temperatures,
higher monthly waterbalance ratios, nilannual water deficits
H1.2
20,288 ha
220 m
Taupo, Wairarapa
Mild temperatures, highsolar radiation, slightannual water deficits
Undulating hills
Recent, well-drainedsoils of low fertilityfrom mixed alluvium
a. much lower wintertemperatures
b. as for H1.2c. higher temperatures,
easy rolling landd. much higher winter
temperatures, stronglyindurated parentmaterials
H1.3
16,436 ha
200 m
Taranaki
Warm temperatures,high solar radiation,slight annual waterdeficits
Very gently undulatinghills
Recent, well-drained soilsof moderate fertility fromandesitic alluvium
a. as for H1.3b. lower temperatures,
higher monthly waterbalance ratios

112
The LENZ Environments
Environment H2Environment H2 is concentrated primarily in central and eastern Bay of Plenty with
small areas in inland parts of Gisborne and northern Hawke’s Bay. Climatically thisenvironment is varied, with mild temperatures, very high solar radiation and slightannual water deficits. Dominant soil parent materials are Tarawera lapilli, rhyolitic ash,and alluvium from greywacke, but it also includes a small area of weakly induratedsandstone just east of Whakatane. Soils are well-drained and of moderate naturalfertility.
Level III & IV Descriptions
Level III
Area
Elevation
Location
Climate
Landform
Soils
Level IV
H2.2
48,388 ha
440 m
Rotorua District
Mild temperatures,very high solarradiation, slight annualwater deficits
Easy rolling hills
Recent, well-drainedsoils of moderatefertility from Taraweralapilli and rhyolitictephra
a. rolling hills, lowfertility
b. high fertility, stronglyindurated
H2.1
11,956 ha
380 m
Rotorua District
Mild temperatures, highsolar radiation, slightannual water deficits
Gently undulating hills
Recent, imperfectlydrained soils of lowfertility fromRotomahana mud andmixed alluvium
a. warmer temperatures,imperfect drainage
b. much warmer wintertemperatures
c. moderate fertility
H2.3
980 ha
670 m
Urewera National Park
Mild temperatures, highsolar radiation, slightannual water deficits
Steep hills
Recent, imperfectlydrained soils of moderatefertility from calcareoussandstone and a smallamount of rhyolitictephra
a. – no subdivision atLevel IV – same asH2.3

113
The LENZ Environments
Environment H3Environment H3 occurs in three locations: eastern Taranaki primarily along the
Mangehu River; northwestern Marlborough along the Pelorus and Whangamoa Rivers;and northern Buller on the lower flood-plain of the Karamea River. The climate is mild,with high solar radiation and slight annual water deficits. Soil parent materials areandesitic alluvium (Taranaki), greywacke gravels (Marlborough) and mixed alluvium.Soils mostly have poor or imperfect drainage and are moderately fertile.
Level III & IV Descriptions
Level III
Area
Elevation
Location
Climate
Landform
Soils
Level IV
H3.1
5216 ha
175 m
Taranaki
Mild temperatures, high solarradiation, high vapour pressuredeficits, slight annual water deficits
Gently undulating flood plains
Recent, poorly-drained soils of highfertility from andesitic alluvium
a. warmer winter temperatures, highfertility
b. as for H3.1
H3.2
3124 ha
60 m
Marlborough and Buller
Mild temperatures, very high solarradiation, high vapour pressuredeficits, slight annual water deficits
Undulating flood plains
Recent, imperfectly drained soils ofhigh fertility from greywacke gravelswith some loess
a. – no subdivision at Level IV – sameas H3.2

114
The LENZ Environments
Level III¨
Area¨
Elevation¨
Location¨
Climate¨
Landform¨
Soils̈
Level IV¨
Environment H4Environment H4 occurs on upper parts of the Taranaki ring-plain and consequently
is one of the higher elevation environments in H. The climate is cool, with high solarradiation, low vapour pressure deficits, high monthly water balance ratios and nil annualwater deficits. Soils, formed from fine-textured andesitic tephra and alluvium, have highnatural fertility but imperfect drainage.
Level III & IV Descriptions
H4.1 – No Subdivision at Level III
13,872 ha
670 m
Mt Taranaki
Cool temperatures, high solar radiation, low vapour pressure deficits, highmonthly water balance ratios, nil annual water deficits
Undulating ring plain
Recent, imperfectly drained soils of high fertility from andesitic tephra andalluvium
a. warmer temperatures, very high fertilityb. moderate fertilityc. much lower temperatures, higher monthly water balance ratios, easy rolling
ring plain, very high fertility

115
The LENZ Environments
˚Environment I consists of scattered pockets of poorly drained recent soils that occurmostly on coastal plains and river valleys in eastern New Zealand from Gisborne to mid-Canterbury. The climate is typified by warm temperatures, high annual solar radiation,moderate annual water deficits and high vapour pressure deficits. The terrain isgenerally flat and soils are very poorly to imperfectly drained. Recent alluvium from avariety of sources is the dominant soil parent material with some loess. Soil fertility ismoderate, with some saline soils, particularly on coastal sites.
I - Central Poorly Drained Recent Soils

116
The LENZ Environments
DENDROGRAM OF I

117
The LENZ Environments
Envi
ronm
ent
Are
a (ha
)
Alti
tude
(m)
Mea
n an
nual
tem
pera
ture
(ºC
)
Mea
n m
inim
um te
mpe
ratu
re o
f the
cold
est m
onth
(ºC
)
Mea
n an
nual
sola
r rad
iatio
n (M
J/m2 /d
ay)
Mea
n w
inte
r sol
ar ra
diat
ion
(MJ/m
2 /day
)
Oct
ober
vap
our p
ress
ure d
efic
it (k
Pa)
Mon
thly
wat
er b
alan
ce ra
tio (r
atio
)
Mea
n an
nual
wat
er d
efic
it (m
m)
Slop
e (º)
Dra
inag
e (1=
very
poo
r to
5=go
od)
Aci
d so
lubl
e pho
spho
rus (
1=v.
low
to 5
=v. h
igh)
Exch
ange
able
calc
ium
(1=l
ow to
5=v
. hig
h)
Parti
cle s
ize (
1=cl
ay/si
lt to
5=b
ould
ers–
mas
sive)
Indu
ratio
n (1
=non
-indu
rate
d to
5=v
. stro
ngly
ind.
)
Soil
Age
(1=r
aw/re
cent
, 2=o
lder
)
Che
mic
al li
mita
tions
(1=l
ow, 2
=sal
ine,
3=u
ltram
afic
)
I1 1776 10
12.5 2.8 15.1 4.7 0.4 3.5 34.1 0.8 2.0 4.0 2.0 1.0 1.0 1.0 2.0
I2
48,89
1 70
12.6 3.4 14.1 4.6 0.4 2.4
106.9 0.6 2.0 2.0 2.1 1.0 1.0 1.0 1.1
I3
27,99
1 35
11.9 1.6 14.2 4.4 0.5 1.7
221.3 0.2 2.5 4.0 2.0 1.0 1.5 1.0 1.5
I4 427 62
12.5 3.6 14.8 5.2 0.6 1.5
225.1 2.9 2.0 4.0 2.0 1.0 2.0 1.1 1.0
I5
39,19
4 24
13.6 3.3 14.7 5.4 0.5 1.7
183.1 0.3 3.8 2.3 2.3 1.1 1.0 1.0 1.0
I6 4363 6
13.8 4.0 14.8 5.5 0.5 1.7
181.8 0.4 1.2 2.0 3.0 1.0 1.0 1.0 1.9

118
The LENZ Environments
Level III¨
Area¨
Elevation¨
Location¨
Climate¨
Landform¨
Soils̈
Level IV¨
Environment I1Environment I1 consists of several small areas of poorly-drained coastal alluvium in
the northern South Island, occurring from the base of Farewell Spit to the innerMarlborough Sounds. It is distinguished by its combination of mild temperatures, veryhigh solar radiation, low annual water deficits and saline soils that are of high naturalfertility.
Level III & IV Descriptions
I1.1 – No Subdivision at Level III
1760 ha
10 m
Marlborough Sounds, Farewell Spit
Mild temperatures, very high solar radiation, low monthly water balance ratios,low annual water deficits
Very gently undulating plains
Poorly-drained soils of high fertility from saline coastal alluvium
a. lower annual water deficitsb. lower monthly water balance ratios, much higher annual water deficits, flat
plains

119
The LENZ Environments
Environment I2Environment I2 is the largest of the Level II environments in I, accounting for 40% of
the total area. It occurs in three distinct locations in the North Island: southern Hawke’sBay, Manawatu and Wairarapa. The climate is typified by warm temperatures, highsolar radiation and moderate annual water deficits. Fine-textured, recent alluvium froma variety of sources is the dominant soil parent material along with some loess. Soils arepoorly-drained and of low natural fertility.
Level III & IV Descriptions
Level III
Area
Elevation
Location
Climate
Landform
Soils
Level IV
I2.1
46,404 ha
75 m
Southern Wairarapa, southernHawke’s Bay, Palmerston North area
Warm temperatures, high solarradiation, moderate annual waterdeficits
Flat plains
Poorly-drained recent soils of lowfertility from fine alluvium
a. much cooler winter temperaturesb. as for I2.1c. higher monthly water balance ratios,
much lower annual water deficits,gently undulating plains
I2.2
2712 ha
10 m
Palmerston North area, southernWairarapa
Warm temperatures, high solarradiation, moderate annual waterdeficits
Flat plains
Poorly-drained saline soils of moderatefertility from estuarine alluvium
a. – no subdivision at Level IV – sameas I2.2

120
The LENZ Environments
Environment I3Environment I3 occurs in the east of the South Island from coastal Marlborough to
Canterbury. Climatic conditions are mild with high solar radiation, high vapour pressuredeficits and high annual water deficits. Parent materials are predominantly salinealluvium or fine greywacke alluvium with some loess. Soils are imperfectly drained andof high natural fertility. Saline soils around Lake Ellesmere and the Wairau Rivermouth.
Level III & IV Descriptions
Level III
Area
Elevation
Location
Climate
Landform
Soils
Level IV
I3.1
7412 ha
5 m
Marlborough
Warm temperatures, veryhigh solar radiation, highvapour pressure deficits,high annual waterdeficits
Flat plains
Recent, poorly-drained,saline soils of highfertility from saline andmixed alluvium
a. non-saline soilsb. saline soils
I3.2
10,436 ha
85 m
Mid Canterbury
Mild temperatures, highsolar radiation, highvapour pressure deficits,moderate annual waterdeficits
Flat plains
Imperfectly drainedrecent soils of highfertility from finegreywacke alluvium
a. lower wintertemperatures, highervapour pressuredeficits
b. higher wintertemperatures, higherannual water deficits
c. lower temperatures,much lower annualwater deficits
I3.3
10,188 ha
5 m
Lake Ellesmere
Mild temperatures,moderate solar radiation,high vapour pressuredeficits, high annualwater deficits
Flat plains
Imperfectly drained,recent saline soils of highfertility from salinealluvium
a. – no subdivision atLevel IV – same as I3.3

121
The LENZ Environments
Environment I4Environment I4 comprises several very small, gently sloping units in southern
Marlborough and coastal north Canterbury. Climatically Environment I4 has mildtemperatures, high solar radiation, very high vapour pressure deficits and high annualwater deficits. Soils are formed from fine greywacke alluvium with some loess and arepoorly-drained but of high natural fertility.
Level III & IV Descriptions
Level III
Area
Elevation
Location
Climate
Landform
Soils
Level IV
I4.1
384 ha
25 m
North Canterbury coast
Warm temperatures, high solarradiation, very high vapour pressuredeficits, high annual water deficits
Gently undulating
Poorly-drained soils of high fertilityfrom fine greywacke alluvium
a. – no subdivision at Level IV – sameas I4.1
I4.2
52 ha
395 m
Middle reaches of the Awatere River
Mild temperatures, very high solarradiation, high vapour pressuredeficits, moderate annual waterdeficits
Undulating plains
Very poorly-drained soils of very highfertility from fine greywacke alluvium
a. – no subdivision at Level IV – sameas I4.2

122
The LENZ Environments
Level III
Area
Elevation
Location
Climate
Landform
Soils
Level IV
Environment I5Environment I5 is the second most extensive Level II unit in I, occurring in two
North Island locations: along the flood plain of the Waipaoa River near Gisborne andaround Hastings. The climate is warm with high solar radiation and moderate annualwater deficits. Parent materials are mostly fine alluvium, some of it rhyolitic, with someloess. Soils are recent and are imperfectly drained but are of only moderate naturalfertility.
Level III & IV Descriptions
I5.1
27,864 ha
25 m
Gisborne, Napier/Hastings
Warm temperatures, high solarradiation, high vapour pressure deficits,moderate annual water deficits
Flat flood plains
Imperfectly drained recent soils of lowfertility from mixed alluvium
a. warmer winter temperatures, lowannual water deficits, high fertility
b. well-drained
I5.2
11,260 ha
25 m
Napier/Hastings
Warm temperatures, high solarradiation, high vapour pressuredeficits, high annual water deficits
Flat flood plains
Imperfectly drained recent soils of lowfertility from alluvium and loess
a. – no subdivision at Level IV – sameas I5.2

123
The LENZ Environments
Level III
Area
Elevation
Location
Climate
Landform
Soils
Level IV
Environment I6Environment I6 is located mainly on the Napier/Hastings plains, with a small area
also found on the Gisborne plains. The climate within this small environment is warm,with high solar radiation, high vapour pressure deficits and moderate annual waterdeficits. The predominant parent material across the whole environment is estuarinealluvium, and the resulting saline soils have very poor drainage and moderate fertility.
Level III & IV Descriptions
I6.1 – No Subdivision at Level III
4328 ha
5 m
Napier/Hastings, Gisborne
Warm temperatures, high solar radiation, high vapour pressure deficits,moderate annual water deficits
Flat flood plains
Recent, saline soils of poor drainage and moderate fertility from estuarinealluvium
a. lower annual water deficits, non-saline soilsb. saline soils

124
The LENZ Environments
Level III
Area
Elevation
Location
Climate
Landform
Soils
Level IV
Environment I5Environment I5 is the second most extensive Level II unit in I, occurring in two
North Island locations: along the flood plain of the Waipaoa River near Gisborne andaround Hastings. The climate is warm with high solar radiation and moderate annualwater deficits. Parent materials are mostly fine alluvium, some of it rhyolitic, with someloess. Soils are recent and are imperfectly drained but are of only moderate naturalfertility.
Level III & IV Descriptions
I5.1
27,864 ha
25 m
Gisborne, Napier/Hastings
Warm temperatures, high solarradiation, high vapour pressure deficits,moderate annual water deficits
Flat flood plains
Imperfectly drained recent soils of lowfertility from mixed alluvium
a. warmer winter temperatures, lowannual water deficits, high fertility
b. well-drained
I5.2
11,260 ha
25 m
Napier/Hastings
Warm temperatures, high solarradiation, high vapour pressuredeficits, high annual water deficits
Flat flood plains
Imperfectly drained recent soils of lowfertility from alluvium and loess
a. – no subdivision at Level IV – sameas I5.2

125
The LENZ Environments
Level III
Area
Elevation
Location
Climate
Landform
Soils
Level IV
Environment I6Environment I6 is located mainly on the Napier/Hastings plains, with a small area
also found on the Gisborne plains. The climate within this small environment is warm,with high solar radiation, high vapour pressure deficits and moderate annual waterdeficits. The predominant parent material across the whole environment is estuarinealluvium, and the resulting saline soils have very poor drainage and moderate fertility.
Level III & IV Descriptions
I6.1 – No Subdivision at Level III
4328 ha
5 m
Napier/Hastings, Gisborne
Warm temperatures, high solar radiation, high vapour pressure deficits,moderate annual water deficits
Flat flood plains
Recent, saline soils of poor drainage and moderate fertility from estuarinealluvium
a. lower annual water deficits, non-saline soilsb. saline soils

126
The LENZ Environments
Envi
ronm
ent
Are
a (ha
)
Alti
tude
(m)
Mea
n an
nual
tem
pera
ture
(ºC
)
Mea
n m
inim
um te
mpe
ratu
re o
f the
cold
est m
onth
(ºC
)
Mea
n an
nual
sola
r rad
iatio
n (M
J/m2 /d
ay)
Mea
n w
inte
r sol
ar ra
diat
ion
(MJ/m
2 /day
)
Oct
ober
vap
our p
ress
ure d
efic
it (k
Pa)
Mon
thly
wat
er b
alan
ce ra
tio (r
atio
)
Mea
n an
nual
wat
er d
efic
it (m
m)
Slop
e (º)
Dra
inag
e (1=
very
poo
r to
5=go
od)
Aci
d so
lubl
e pho
spho
rus (
1=v.
low
to 5
=v. h
igh)
Exch
ange
able
calc
ium
(1=l
ow to
5=v
. hig
h)
Parti
cle s
ize (
1=cl
ay/si
lt to
5=b
ould
ers–
mas
sive)
Indu
ratio
n (1
=non
-indu
rate
d to
5=v
. stro
ngly
ind.
)
Soil
Age
(1=r
aw/re
cent
, 2=o
lder
)
Che
mic
al li
mita
tions
(1=l
ow, 2
=sal
ine,
3=u
ltram
afic
)
J1
53,96
6
119
12.0 1.5 15.3 5.0 0.5 2.4
109.7 1.8 4.9 3.3 1.9 2.5 2.9 1.3 1.0
J2
116,7
22 136
11.3 0.6 14.1 4.4 0.5 1.8
182.3 0.6 5.0 3.9 2.0 2.5 3.5 1.0 1.0
J3
15,27
8 82
12.2 3.6 14.6 4.8 0.6 2.1
130.1 2.1 4.7 3.9 2.0 3.1 3.9 1.5 1.0
J4
111,2
41 78
12.7 3.6 14.2 4.7 0.4 2.3 96.5 0.9 4.7 2.2 2.0 1.3 1.9 1.0 1.0

127
The LENZ Environments
Environment J1Environment J1 occurs along the middle and upper reaches of the Wairau River in
Marlborough and along the Waimea and Motueka Rivers in Nelson. The climate withinthis environment is mild, with very high solar radiation, high vapour pressure deficitsand moderate annual water deficits. Soils are formed mostly from greywacke gravels(Marlborough) or sandy alluvium from sedimentary rocks, granite and/or gabbro(Nelson). Soils are well-drained and of moderate natural fertility.
Level III & IV Descriptions
Level III
Area
Elevation
Location
Climate
Landform
Soils
Level IV
J1.1
29,920 ha
85 m
Waimea, Motueka Rivers, Nelson
Mild temperatures, very high solarradiation, high vapour pressure deficits,low annual water deficits
Gently undulating flood plains
Well-drained soils of moderate fertilityfrom sedimentary alluvium
a. cooler temperatures, lower annualwater deficits
b. as for J1.1c. undulating flood plains, low fertilityd. higher annual water deficits,
imperfect drainage
J1.2
23,980 ha
165 m
Wairau River, Blenheim
Mild temperatures, very high solarradiation, high vapour pressuredeficits, moderate annual waterdeficits
Very gently undulating flood plains
Well-drained soils of high fertilityfrom greywacke gravels with someloess
a. older soilsb. recent soils

128
The LENZ Environments
Environment J2Environment J2 occurs along the lower reaches of the Wairau River in Marlborough
and the larger river and streams of Canterbury to the upper headwaters of the WaitakiRiver. The climate is mild, with high solar radiation, high vapour pressure deficits andmoderate annual water deficits. Parent materials are mostly greywacke gravels but withsome finer alluvium and loess. Soils are well-drained and have high natural fertility.
Level III & IV Descriptions
Level III
Area
Elevation
Location
Climate
Landform
Soils
Level IV
J2.1
77,760 ha
55 m
Marlborough, around Christchurch
Mild temperatures, high solarradiation, high vapour pressuredeficits, high annual water deficits
Flat flood plains
Recent, well-drained soils of highfertility from greywacke gravels andalluvium
a. warmer temperatures, much highersolar radiation
b. as for J2.1c. cooler winter temperatures, higher
vapour pressure deficitsd. gently undulating flood plains,
moderate fertility
J2.2
39,060 ha
300 m
Inland mid Canterbury
Mild temperatures, high solarradiation, high vapour pressuredeficits, moderate annual water deficits
Very gently undulating flood plains
Recent, well-drained soils of highfertility from greywacke gravels
a. much cooler temperatures, lowerannual water deficits
b. warmer temperaturesc. undulating floodplains

129
The LENZ Environments
Level III
Area
Elevation
Location
Climate
Landform
Soils
Level IV
Environment J3Environment J3 is the most restricted in extent of the J environments, extending
north from the lower reaches of the Conway River along the Kaikoura coast to the lowerreaches of the Clarence River. Of the three South Island environments in J this is thewarmest, having a mild climate with high solar radiation, very high vapour pressuredeficits and moderate annual water deficits. Greywacke gravels are the dominant soilparent material but with small areas of adjacent greywacke. Soils are well-drained andhave high natural fertility.
Level III & IV Descriptions
J3.1
7152 ha
70 m
Kaikoura region
Mild temperatures, high solarradiation, very high vapour pressuredeficits, moderate annual water deficits
Gently undulating plains
Well-drained soils of high fertility fromgreywacke gravels with some loess
a. – no subdivision at Level IV – sameas J3.1
J3.2
8072 ha
55 m
Kaikoura region
Mild temperatures, high solarradiation, very high vapour pressuredeficits, moderate annual waterdeficits
Very gently undulating floodplains
Well-drained soils of high fertilityfrom greywacke gravels with someloess
a. cooler winter temperatures, muchlower annual water deficits,
b. higher annual water deficits

130
The LENZ Environments
Environment J4Environment J4 occurs in the lower North Island mainly forming narrow ribbons
along the major rivers of southern Hawke’s Bay, Manawatu and the Wairarapa. It alsoincludes extensive coastal dunes in Manawatu and coastal terraces in southernWellington and Wairarapa. The climate is typified by warm temperatures, high solarradiation, moderate vapour pressure deficits and low annual water deficits. Mixedalluvium and dune sands are the most widespread soil parent materials with somevolcanic ash and loess. The well-drained soils are the least fertile of the J environments,with relatively low levels of available phosphorus.
Level III & IV Descriptions
Level III
Area
Elevation
Location
Climate
Landform
Soils
Level IV
J4.1
70,424 ha
110 m
River terraces alongcoastal Manawatu
Warm temperatures,high solar radiation,low annual waterdeficits
Flat flood plains
Recent, well-drainedsoils of low fertilityfrom mixed alluvium
a. much coolertemperatures, lowerannual water deficits,undulating floodplains
b. undulating floodplains, imperfectlydrained
c. higher annual waterdeficits
d. much lower annualwater deficits
J4.2
34,228 ha
20 m
Coastal Manawatu,Wanganui
Warm temperatures,high solar radiation,moderate annual waterdeficits
Flat coastal sandplains
Recent, well-drainedsoils of moderatefertility from sand, withsmall pockets of Taupotephra
a. much warmer wintertemperatures, lowerannual water deficits,low fertility
b. as for J4.2c. very low fertilityd. higher annual water
deficits, imperfectdrainage
J4.3
6520 ha
50 m
Southern Wairarapacoastline
Warm temperatures,high solar radiation,moderate annual waterdeficits
Undulating coastalfloodplains
Recent, well-drainedsoils of low fertility frommixed alluvium
a. warmer wintertemperatures, easyrolling coastal plains,strongly induratedparent materials
b. as for J4.3

131
The LENZ Environments
Environment K comprises areas of recent soils at moderate to high elevation ininland parts of both main islands where it generally occurs on flood plains along majorriver valleys. It is most extensive in inland parts of the eastern South Island. In the NorthIsland it is restricted to high elevation sites on the ringplain surrounding the Tongarirovolcanoes.
The climate of Environment K is cool but with high solar radiation. Althoughannual water deficits are low on average, more eastern sites in the South Island receivesubstantially less rainfall than those exposed to the west or located close to the SouthernAlps. Vapour pressure deficits are moderate. Alluvium, mostly from greywacke but somefrom schist, is the main soil parent material with varying mixes of gravel and finermaterial. Andesitic tephra is the dominant parent material around the Tongarirovolcanoes. Slopes are generally gentle, and most soils are well-drained. Natural soilfertility is moderately high.
K - Central Upland Recent Soils

132
The LENZ Environments
DENDROGRAM OF K

133
The LENZ Environments
Envi
ronm
ent
Are
a (ha
)
Alti
tude
(m)
Mea
n an
nual
tem
pera
ture
(ºC
)
Mea
n m
inim
um te
mpe
ratu
re o
f the
cold
est m
onth
(ºC
)
Mea
n an
nual
sola
r rad
iatio
n (M
J/m2 /d
ay)
Mea
n w
inte
r sol
ar ra
diat
ion
(MJ/m
2 /day
)
Oct
ober
vap
our p
ress
ure d
efic
it (k
Pa)
Mon
thly
wat
er b
alan
ce ra
tio (r
atio
)
Mea
n an
nual
wat
er d
efic
it (m
m)
Slop
e (º)
Dra
inag
e (1=
very
poo
r to
5=go
od)
Aci
d so
lubl
e pho
spho
rus (
1=v.
low
to 5
=v. h
igh)
Exch
ange
able
calc
ium
(1=l
ow to
5=v
. hig
h)
Parti
cle s
ize (
1=cl
ay/si
lt to
5=b
ould
ers–
mas
sive)
Indu
ratio
n (1
=non
-indu
rate
d to
5=v
. stro
ngly
ind.
)
Soil
Age
(1=r
aw/re
cent
, 2=o
lder
)
Che
mic
al li
mita
tions
(1=l
ow, 2
=sal
ine,
3=u
ltram
afic
)
K1
98,04
4
747 8.7 -1.1
14.1 4.8 0.4 4.2 9.3 4.3 5.0 3.6 1.7 2.4 3.5 1.0 1.0
K2
11,39
5
790 8.5 -2.4
14.7 5.0 0.5 1.7
170.4 8.4 5.0 3.8 1.8 3.2 4.0 1.0 1.0
K3
32,48
1
533 9.0 -2.1
13.8 3.9 0.4 2.0
107.9 4.5 4.5 3.5 2.0 2.8 2.9 1.0 1.0
K4
16,61
2
604 9.0 -1.9
14.0 4.5 0.5 2.4 62.0 1.2 1.0 4.0 2.0 1.0 2.0 1.0 1.0
K5 4894 626 7.7 -3.3
13.1 3.8 0.4 1.8 81.4 1.4 2.1 3.2 2.0 1.8 1.2 1.0 1.0

134
The LENZ Environments
Environment K1Environment K1 comprises the greatest area (60%) and has the highest mean
elevation of the Level II environments in K. It occurs along the upper headwaters ofmajor rivers draining the eastern slopes of the Southern Alps, and on Mt Ruapehu. It isdistinguished by its cool, wet climate with high solar radiation and slight annual waterdeficits. Well-drained soils are formed from greywacke gravels with andesitic tephra inthe North Island and some loess in the South Island.
Level III & IV Descriptions
Level III
Area
Elevation
Location
Climate
Landform
Soils
Level IV
K1.1
65,260 ha
610 m
Southern Alps
Cool temperatures, high solarradiation, moderate vapour pressuredeficits, slight annual water deficits
Undulating floodplains
Recent, well-drained soils of highfertility from greywacke gravels withsome loess
a. much higher monthly water balanceratios
b. as for K1.1c. much lower vapour pressure deficitsd. much cooler temperaturese. much warmer temperatures, higher
solar radiation
K1.2
32,616 ha
1020 m
Mt Ruapehu
Cool temperatures, high solarradiation, low vapour pressure deficits,slight annual water deficits
Undulating ringplain
Recent, well-drained soils of moderatefertility from andesitic tephra
a. as for K1.2b. very gently undulating ringplain,
high fertility, strongly induratedparent materials

135
The LENZ Environments
Environment K2Environment K2 is much smaller in area and is restricted to high, intermontane
valleys in inland parts of southern Marlborough and south Canterbury. Thisenvironment has a cool climate, with high solar radiation, high vapour pressure deficitsand moderate annual water deficits. This environment has gently sloping soils formedfrom greywacke gravels and consequently the environment is well-drained and of highfertility.
Level III & IV Descriptions
Level III
Area
Elevation
Location
Climate
Landform
Soils
Level IV
K2.1
8804 ha
845 m
Southern Marlborough and southCanterbury
Cool temperatures, high solarradiation, high vapour pressure deficits,very low monthly water balance ratiosand moderate annual water deficits
Undulating hills
Recent, well-drained soils of highfertility from greywacke gravels withsome loess
a. higher annual water deficitsb. lower annual water deficits, easy
rolling hills
K2.2
2520 ha
625 m
Southern Marlborough
Cool temperatures, high solarradiation, high vapour pressuredeficits, very low monthly waterbalance ratios and moderate annualwater deficits
Steep hills
Recent, well-drained soils of moderatefertility from greywacke
a. – no subdivision at Level IV – sameas K2.2

136
The LENZ Environments
Environment K3Environment K3 has the lowest mean elevations in K and consists of narrow ribbons
of recent soils along rivers and streams in the eastern ranges of south Canterbury andnorthern and central Otago. Climatically this environment is cool, with moderate solarradiation, moderate vapour pressure deficits and moderate annual water deficits. Soilsare mostly formed from sands and gravels derived from greywacke and schist with someloess. They are well-drained, with moderate natural fertility.
Level III & IV Descriptions
Level III
Area
Elevation
Location
Climate
Landform
Soils
Level IV
K3.1
17,640 ha
605 m
South Canterbury,Central Otago
Cool temperatures,moderate solar radiation,low annual water deficits
Undulating floodplains
Recent, well-drained,soils of high fertility fromgreywacke gravels withsome loess
a. higher annual waterdeficits
b. lower annual waterdeficits
K3.2
3344 ha
765 m
Central Otago
Cool temperatures,moderate solarradiation, low annualwater deficits
Undulating floodplains
Recent, imperfectlydrained soils ofmoderate fertility fromfine schist alluvium
a. – no subdivision atLevel IV – same asK3.2
K3.3
11,516 ha
365 m
Central Otago
Mild temperatures, highsolar radiation, moderateannual water deficits
Gently undulatingfloodplains
Recent, imperfectlydrained soils of moderatefertility from schistalluvium and colluvium
a. as for K3.3b. cooler temperatures,
easy rolling floodplains

137
The LENZ Environments
Environment K4Environment K4 is scattered through the intermontaine basins of inland Canterbury
with minor occurrences in Otago. The climate is cool, with high solar radiation, highvapour pressure deficits and low annual water deficits. Environment K4 occurspredominantly on areas of fine greywacke alluvium with minimal slope, and theresulting soils are very poorly-drained although highly fertile.
Level III & IV Descriptions
Level III
Area
Elevation
Location
Climate
Landform
Soils
Level IV
K4.1
16,540 ha
600 m
Mid to southern Canterbury
Cool temperatures, high solarradiation, moderate vapour pressuredeficits, low annual water deficits
Gently undulating inland basins
Recent, poorly-drained soils of highfertility from fine greywacke alluviumwith some loess
a. much cooler temperatures, lowerannual water deficits
b. warmer winter temperatures, lowerannual water deficits
c. much higher annual water deficitsd. cooler winter temperatures
K4.2
80 ha
985 m
North Canterbury, inland fromKaikoura
Cold temperatures, high solarradiation, high vapour pressuredeficits, low annual water deficits
Rolling inland basins
Recent, imperfectly drained soils ofhigh fertility from fine greywackealluvium with some loess
a. – no subdivision at Level IV – sameas K4.2

138
The LENZ Environments
Environment K5Environment K5 is the smallest Level II environment in K and occurs along river
valleys in southern Canterbury and Central Otago. The climate is cool, with moderatesolar radiation, moderate vapour pressure deficits and slight annual water deficits. Parentmaterials consist of either greywacke or schist alluvium with some loess. Soils aregenerally poorly-drained and have moderate natural fertility.
Level III & IV Descriptions
Level III¨
Area¨
Elevation¨
Location¨
Climate¨
Landform¨
Soils̈
Level IV¨
K5.1 – No Subdivision at Level III
4836 ha
625 m
Southern Canterbury, Central Otago
Cool temperatures, moderate solar radiation, moderate vapour pressure deficits,slight annual water deficits
Gently undulating floodplains
Recent, poorly-drained soils of moderate fertility from a combination ofgreywacke or schist alluvium
a. fine greywacke alluvium with loess, South Canterburyb. fine schist alluvium with loess, Central Otago

139
The LENZ Environments
L - Southern Lowlands
Environment L consists of extensive areas of alluvial and loess soils of varying age inthe lowlands of Southland, with smaller areas in South Canterbury, coastal Otago and onStewart Island. Environment L has a cool climate, with low solar radiation. There is astrong gradient in annual rainfall deficits, while low overall, vary from very low in thesouth and south-west to moderate in the northeast. Landforms are generally flat togently sloping with a range of soil parent materials including extensive areas of fine-textured alluvium from schist and greywacke, loess, peat and dune sands. Soils varywidely in their drainage - some are of moderately high natural fertility.

140
The LENZ Environments
DENDROGRAM OF L

141
The LENZ Environments
Envi
ronm
ent
Are
a (ha
)
Alti
tude
(m)
Mea
n an
nual
tem
pera
ture
(ºC
)
Mea
n m
inim
um te
mpe
ratu
re o
f the
cold
est m
onth
(ºC
)
Mea
n an
nual
sola
r rad
iatio
n (M
J/m2 /d
ay)
Mea
n w
inte
r sol
ar ra
diat
ion
(MJ/m
2 /day
)
Oct
ober
vap
our p
ress
ure d
efic
it (k
Pa)
Mon
thly
wat
er b
alan
ce ra
tio (r
atio
)
Mea
n an
nual
wat
er d
efic
it (m
m)
Slop
e (º)
Dra
inag
e (1=
very
poo
r to
5=go
od)
Aci
d so
lubl
e pho
spho
rus (
1=v.
low
to 5
=v. h
igh)
Exch
ange
able
calc
ium
(1=l
ow to
5=v
. hig
h)
Parti
cle s
ize (
1=cl
ay/si
lt to
5=b
ould
ers–
mas
sive)
Indu
ratio
n (1
=non
-indu
rate
d to
5=v
. stro
ngly
ind.
)
Soil
Age
(1=r
aw/re
cent
, 2=o
lder
)
Che
mic
al li
mita
tions
(1=l
ow, 2
=sal
ine,
3=u
ltram
afic
)
L1
207,6
72 152 9.9 0.1 12.7 3.5 0.4 2.4 68.1 0.9 5.0 3.6 2.2 1.9 2.5 1.0 1.0
L2 9903 19
10.5 0.5 12.6 3.7 0.4 1.7
114.4 0.4 2.7 3.5 1.9 1.5 1.2 1.0 1.3
L3
112,6
29 104 9.6 1.2 12.3 3.1 0.3 3.6 10.4 0.9 1.3 1.5 1.6 1.9 1.7 2.0 1.0
L4
408,1
30 139 9.8 0.4 12.4 3.3 0.4 2.4 54.3 2.8 2.8 3.1 2.0 1.3 2.0 2.0 1.0
L5 61,22
7 97 9.8 0.6 12.5 3.2 0.4 3.2 24.5 0.7 3.0 3.2 2.8 1.8 2.0 1.0 1.0
L6 12,50
6 47 9.6 2.4 11.8 2.8 0.2 5.2 0.0 3.7 3.3 1.6 1.0 2.4 3.0 1.0 1.0

142
The LENZ Environments
Environment L1This environment occurs along the floodplains of the Rangitata and Waitaki Rivers
in south Canterbury and throughout the Southland plains. The climate of L1 is cold,with low solar radiation, moderate vapour pressure deficits and low annual waterdeficits. Parent materials are alluvial sands and gravels predominantly derived fromgreywacke but also from schist, basic volcanic rocks and loess. The recent, well-drainedsoils are of high natural fertility.
Level III & IV Descriptions
Level III
Area
Elevation
Location
Climate
Landform
Soils
Level IV
L1.1
142,380 ha
150 m
Southland
Cool temperatures, lowsolar radiation, moderatevapour pressure deficits,low monthly waterbalance ratios, low annualwater deficits
Very gently undulatingfloodplains
Recent, well-drained soilsof high fertility from finegreywacke alluvium,alluvium from tuffaceousgreywacke and dune sand
a. as for L1.1b. much cooler winter
temperatures, highervapour pressure deficits,higher annual waterdeficits
c. lower annual waterdeficits
d. warmer wintertemperatures, lowerannual water deficits
e. higher annual waterdeficits, moderatefertility
L1.2
39,364 ha
85 m
South Canterbury
Mild temperatures,moderate solarradiation, moderatevapour pressure deficits,very low monthly waterbalance ratios, moderateannual water deficits
Flat floodplains
Recent, well-drainedsoils of high fertilityfrom greywacke gravelswith some loess
a. much lower annualwater deficits
b. higher annual waterdeficits
L1.3
25,808 ha
270 m
Dunedin
Cool temperatures, lowsolar radiation, moderatevapour pressure deficits,very low monthly waterbalance ratios, moderateannual water deficits
Gently undulatingfloodplains
Recent, well-drainedsoils of moderate fertilityfrom schist rock,colluvium and alluvium
a. lower annual waterdeficits, imperfectdrainage
b. warmer temperaturesc. higher annual water
deficits, stronglyindurated, moderatelycoarse-textured soils

143
The LENZ Environments
Environment L2Environment L2 consists of scattered pockets of low-lying, poorly-drained land,
including coastal areas near Timaru and the Otago Peninsula, more inland sites in thelower Taieri Plains around Mosgiel and small scattered patches further south near LakeWaihola and around Balclutha. Environment L2 is mild, with low solar radiation,moderate vapour pressure deficits, very low monthly water balance ratios and moderateannual water deficits. Soils are highly fertile but imperfectly drained and are derivedmostly from sandy alluvium from greywacke and schist. Saline soils occur near the coast.
Level III & IV Descriptions
Level III
Area
Elevation
Location
Climate
Landform
Soils
Level IV
L2.1
7,332 ha
20 m
Coastal Otago, South Canterbury
Mild temperatures, low solar radiation,moderate vapour pressure deficits, verylow monthly water balance ratios,moderate annual water deficits
Flat plains and terraces
Older, very poorly-drained soils ofmoderate fertility from fine schist andgreywacke alluvium
a. higher annual water deficits, highfertility
b. as for L2.1
L2.2
2,512 ha
10 m
Coastal Otago
Mild temperatures, low solar radiation,moderate vapour pressure deficits, verylow monthly water balance ratios,moderate annual water deficits
Very gently undulating plains andterraces
Older, poorly-drained soils of highfertility from saline alluvium frommixed quartzo-feldspathic rocks
a. very poorly-drained, saline soils ofhigh fertility
b. as for L2.2

144
The LENZ Environments
Environment L3Environment L3 includes high elevation wetlands on the Rock and Pillar Range,
wetlands around Lake Te Anau, poorly-drained terraces in southwestern Fiordland andextensive wetlands around Invercargill and Balcutha and on Stewart Island. Climaticallythis environment is cool, with low solar radiation, low vapour pressure deficits and slightannual water deficits. Parent materials consist of extensive areas of alluvium from theFiordland complex, tuffaceous greywacke, and loess from greywacke and schist. Thecombination of high rainfall and very poor drainage has resulted in extensive areas ofpeat. Soils are generally of low fertility.
Level III & IV Descriptions
Level III
Area
Elevation
Location
Climate
Landform
Soils
Level IV
L3.1
69,188 ha
125 m
Central Otago and Southlandparticularly around Invercargill
Cool temperatures, low solar radiation,moderate vapour pressure deficits, lowmonthly water balance ratios, slightannual water deficits
Flat floodplains
Recent, imperfectly drained soils ofmoderate fertility from alluvium fromthe Fiordland complex with extensivepeat
a. warmer winter temperaturesb. much cooler temperatures
L3.2
46,544 ha
70 m
South-western Southland, Invercargill,northern Stewart Island
Cool temperatures, low solar radiation,moderate vapour pressure deficits, lowmonthly water balance ratios, slightannual water deficits
Very gently undulating floodplains
Recent, poorly-drained soils of highfertility from Tertiary sandstones andalluvium from the Fiordland complex
a. as for L3.2b. much warmer temperatures, weakly
indurated, fine-textured parentmaterials

145
The LENZ Environments
Environment L4Environment L4 is widely spread on the gently sloping Southland Plains (Awatua,
Waimea, Tokomairiro) around Dunedin and on the Otago Peninsula. The climate iscool, with low solar radiation, moderate vapour pressure deficits, very low monthlywater balance ratios and low annual water deficits. Most sites have little or no slope withimperfectly drained soils of clays and silt derived largely from greywacke, schist, basalticalluvium and loess with some peat.
Level III & IV Descriptions
Level III¨
Area¨
Elevation¨
Location¨
Climate¨
Landform¨
Soils̈
Level IV¨
L4.1 – No Subdivision at Level III
408,208 ha
140 m
Southland
Cool temperatures, low solar radiation, moderate vapour pressure deficits, verylow monthly water balance ratios, low annual water deficits
Gently undulating plains
Older, imperfectly drained soils of moderate fertility from greywacke loess andschist and loess from tuffaceous greywacke
a. as for L4.1b. flat plainsc. higher annual water deficits
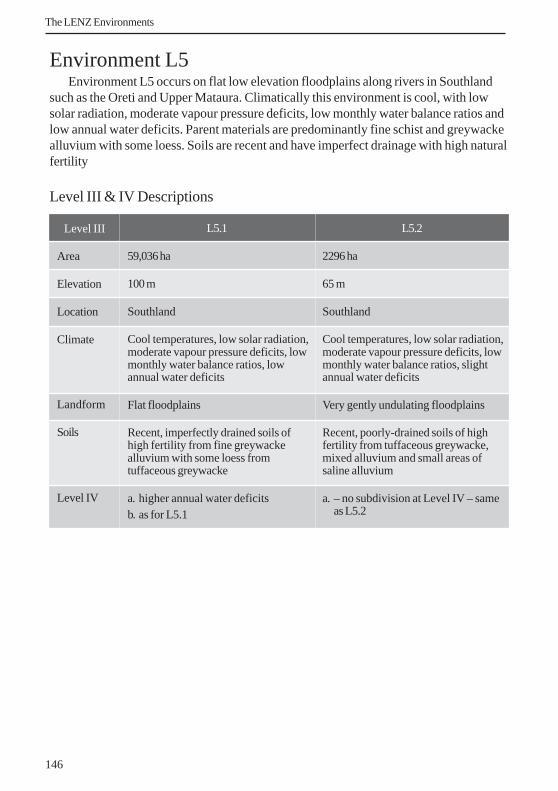
146
The LENZ Environments
Environment L5Environment L5 occurs on flat low elevation floodplains along rivers in Southland
such as the Oreti and Upper Mataura. Climatically this environment is cool, with lowsolar radiation, moderate vapour pressure deficits, low monthly water balance ratios andlow annual water deficits. Parent materials are predominantly fine schist and greywackealluvium with some loess. Soils are recent and have imperfect drainage with high naturalfertility
Level III & IV Descriptions
Level III
Area
Elevation
Location
Climate
Landform
Soils
Level IV
L5.1
59,036 ha
100 m
Southland
Cool temperatures, low solar radiation,moderate vapour pressure deficits, lowmonthly water balance ratios, lowannual water deficits
Flat floodplains
Recent, imperfectly drained soils ofhigh fertility from fine greywackealluvium with some loess fromtuffaceous greywacke
a. higher annual water deficitsb. as for L5.1
L5.2
2296 ha
65 m
Southland
Cool temperatures, low solar radiation,moderate vapour pressure deficits, lowmonthly water balance ratios, slightannual water deficits
Very gently undulating floodplains
Recent, poorly-drained soils of highfertility from tuffaceous greywacke,mixed alluvium and small areas ofsaline alluvium
a. – no subdivision at Level IV – sameas L5.2

147
The LENZ Environments
Environment L6Environment L6 consists of areas of gently sloping, recent soils on Stewart Island.
The environment is differentiated from the other L environments by its maritimeclimate, which is cool with very low solar radiation, low vapour pressure deficits,intermediate monthly water balance ratios and no annual water deficits. Parent materialsare dune sands and alluvium and colluvium derived from granite, diorite, and rocks ofthe Fiordland complex. Soils are imperfectly drained and of low natural fertility
Level III & IV Descriptions
Level III
Area
Elevation
Location
Climate
Landform
Soils
Level IV
L6.1
9396 ha
55 m
Stewart Island
Cold temperatures, very low solarradiation, low vapour pressure deficits,intermediate monthly water balanceratios, no annual water deficits
Undulating floodplains
Recent, imperfectly drained soils of lowfertility from dune sands and sandyalluvium
a. – no subdivision at Level IV – sameas L6.1
L6.2
3100 ha
25 m
Stewart Island
Cold temperatures, very low solarradiation, low vapour pressure deficits,intermediate monthly water balanceratios, no annual water deficits
Very gently undulating floodplains
Recent, very poorly-drained soils ofvery low fertility from alluvium fromthe Fiordland complex
a. – no subdivision at Level IV – sameas L6.2

148
The LENZ Environments
Environment L5Environment L5 occurs on flat low elevation floodplains along rivers in Southland
such as the Oreti and Upper Mataura. Climatically this environment is cool, with lowsolar radiation, moderate vapour pressure deficits, low monthly water balance ratios andlow annual water deficits. Parent materials are predominantly fine schist and greywackealluvium with some loess. Soils are recent and have imperfect drainage with high naturalfertility
Level III & IV Descriptions
Level III
Area
Elevation
Location
Climate
Landform
Soils
Level IV
L5.1
59,036 ha
100 m
Southland
Cool temperatures, low solar radiation,moderate vapour pressure deficits, lowmonthly water balance ratios, lowannual water deficits
Flat floodplains
Recent, imperfectly drained soils ofhigh fertility from fine greywackealluvium with some loess fromtuffaceous greywacke
a. higher annual water deficitsb. as for L5.1
L5.2
2296 ha
65 m
Southland
Cool temperatures, low solar radiation,moderate vapour pressure deficits, lowmonthly water balance ratios, slightannual water deficits
Very gently undulating floodplains
Recent, poorly-drained soils of highfertility from tuffaceous greywacke,mixed alluvium and small areas ofsaline alluvium
a. – no subdivision at Level IV – sameas L5.2

149
The LENZ Environments
Environment L6Environment L6 consists of areas of gently sloping, recent soils on Stewart Island.
The environment is differentiated from the other L environments by its maritimeclimate, which is cool with very low solar radiation, low vapour pressure deficits,intermediate monthly water balance ratios and no annual water deficits. Parent materialsare dune sands and alluvium and colluvium derived from granite, diorite, and rocks ofthe Fiordland complex. Soils are imperfectly drained and of low natural fertility
Level III & IV Descriptions
Level III
Area
Elevation
Location
Climate
Landform
Soils
Level IV
L6.1
9396 ha
55 m
Stewart Island
Cold temperatures, very low solarradiation, low vapour pressure deficits,intermediate monthly water balanceratios, no annual water deficits
Undulating floodplains
Recent, imperfectly drained soils of lowfertility from dune sands and sandyalluvium
a. – no subdivision at Level IV – sameas L6.1
L6.2
3100 ha
25 m
Stewart Island
Cold temperatures, very low solarradiation, low vapour pressure deficits,intermediate monthly water balanceratios, no annual water deficits
Very gently undulating floodplains
Recent, very poorly-drained soils ofvery low fertility from alluvium fromthe Fiordland complex
a. – no subdivision at Level IV – sameas L6.2

150
The LENZ Environments
Envi
ronm
ent
Are
a (ha
)
Alti
tude
(m)
Mea
n an
nual
tem
pera
ture
(ºC
)
Mea
n m
inim
um te
mpe
ratu
re o
f the
cold
est m
onth
(ºC
)
Mea
n an
nual
sola
r rad
iatio
n (M
J/m2 /d
ay)
Mea
n w
inte
r sol
ar ra
diat
ion
(MJ/m
2 /day
)
Oct
ober
vap
our p
ress
ure d
efic
it (k
Pa)
Mon
thly
wat
er b
alan
ce ra
tio (r
atio
)
Mea
n an
nual
wat
er d
efic
it (m
m)
Slop
e (º)
Dra
inag
e (1=
very
poo
r to
5=go
od)
Aci
d so
lubl
e pho
spho
rus (
1=v.
low
to 5
=v. h
igh)
Exch
ange
able
calc
ium
(1=l
ow to
5=v
. hig
h)
Parti
cle s
ize (
1=cl
ay/si
lt to
5=b
ould
ers–
mas
sive)
Indu
ratio
n (1
=non
-indu
rate
d to
5=v
. stro
ngly
ind.
)
Soil
Age
(1=r
aw/re
cent
, 2=o
lder
)
Che
mic
al li
mita
tions
(1=l
ow, 2
=sal
ine,
3=u
ltram
afic
)
M1
92,99
2 49
11.2 1.8 12.9 3.9 0.3 9.5 0.0 0.9 2.6 4.0 1.0 2.0 1.0 1.0 1.0
M2
77,78
4
229
10.5 0.7 13.2 3.9 0.3 7.5 0.4 2.6 4.8 3.7 1.4 3.0 2.3 1.0 1.0
M3 45
2
704 7.8 -1.5
13.4 3.6 0.3 4.8 2.0 7.8 1.5 3.5 2.0 1.5 1.5 1.0 1.0
M4
57,51
0
256 9.0 1.0 12.3 3.2 0.2 11.0 0.0 10.7 5.0 1.0 1.0 3.0 2.0 1.0 1.0

151
The LENZ Environments
Environment M1Environment M1 is a very extensive unit along the west coast of the South Island
occuring as far north as Westport. It generally occurs on river flats such as those adjacentto the Wanganui, Whataroa, Cook and Karangarua Rivers with smaller patchessurrounding water bodies such as Lake Brunner. Further south it occurs on thefloodplains of the Arawata and Cascade Rivers also extending into inland areas. Theclimate of this environment is mild, with low solar radiation, low vapour pressuredeficits, high monthly water balance ratios and no annual water deficits. Parent materialsconsist of mixed alluvium from schist, greywacke and granite. Soils are imperfectlydrained and of high natural fertility.
Level III & IV Descriptions
Level III¨
Area¨
Elevation¨
Location¨
Climate¨
Landform¨
Soils̈
Level IV¨
M1.1 – No Subdivision at Level III
92,812 ha
50 m
West Coast of the South Island
Mild temperatures, low solar radiation, low vapour pressure deficits, highmonthly water balance ratios, no annual water deficits
Very gently undulating floodplains
Recent, imperfectly drained soils of high fertility from mixed alluvium derivedfrom schist, greywacke and granite alluvium
a. as for M1.1b. higher monthly water balance ratios, undulating plainsc. warmer winter temperatures, higher solar radiation, higher vapour pressure
deficits

152
The LENZ Environments
Environment M2This environment occurs north of Westport, around Murchison and down the west
coast of the South Island. It generally occupies well-drained river terraces along the Greyand Cook Rivers and inland around the Haast River. Smaller areas occur east of theSouthern Alps on the floodplains of the Makarora, Matukiuki, Dart and Eglinton Rivers.The most southern outlier occurs on the Oreti River in Southland. The climate is mild,with moderate solar radiation, high monthly water balance ratios and very slight annualwater deficits. Parent materials are varied, consisting of greywacke gravels with someloess, schist alluvium and greywacke and granite alluvium. Soils are generally well-drained and of very low natural fertility.
Level III & IV Descriptions
Level III
Area
Elevation
Location
Climate
Landform
Soils
Level IV
M2.1
46,624 ha
90 m
West Coast
Mild temperatures,moderate solar radiation,low vapour pressuredeficits, high monthlywater balance ratios, noannual water deficits
Very gently undulatingfloodplains
Recent, well-drained soilsof high fertility fromgreywacke and granitealluvium
a. – no subdivision atLevel IV – same asM2.1
M2.2
16,856 ha
360 m
Northern and southernWest Coast
Cool temperatures,moderate solarradiation, moderatevapour pressure deficits,low monthly waterbalance ratios, slightannual water deficits
Gently undulatingfloodplains
Recent, imperfectlydrained soils ofmoderate fertility fromgreywacke gravels withsome loess, schistalluvium
a. cooler wintertemperatures, well-drained, high fertility
b. as for M2.2
M2.3
14,388 ha
545 m
Southern and InlandWest Coast, Otago andSouthland
Cool temperatures,moderate solar radiation,low vapour pressuredeficits, moderatemonthly water balanceratios, slight annual waterdeficits
Easy rolling floodplains
Recent, well-drained soilsof moderate fertility fromgreywacke gravels withsome loess, schistalluvium
a. much higher monthlywater balance ratios,imperfectly drained,moderate fertility
b. undulating riverterraces

153
The LENZ Environments
Environment M3Environment M3 is a small environment found in the mountain valleys of the
Thomson and Eyre Mountains just south of Lake Wakatipu. Climatically thisenvironment is cool, with moderate solar radiation, moderate vapour pressure deficits,low monthly water balance ratios and slight annual water deficits. Parent materialsinclude fine schist alluvium, loess and fine greywacke alluvium. Soils are poorly-drainedand of low natural fertility.
Level III & IV Descriptions
Level III
Area
Elevation
Location
Climate
Landform
Soils
Level IV
M3.1
48 ha
695 m
Central Otago, Fiordland
Cool temperatures, moderate solarradiation, low vapour pressure deficits,very high monthly water balanceratios, no annual water deficits
Easy rolling floodplains
Recent, poorly-drained soils of highfertility from fine greywacke alluviumwith some loess
a. – no subdivision at Level IV – sameas M3.1
M3.2
408 ha
700 m
Central Otago, Fiordland
Cool temperatures, moderate solarradiation, moderate vapour pressuredeficits, low monthly water balanceratios, slight annual water deficits
Easy rolling floodplains
Recent, poorly-drained soils ofmoderate fertility from fine schist andgreywacke alluvium with some loess
a. – no subdivision at Level IV – sameas M3.2
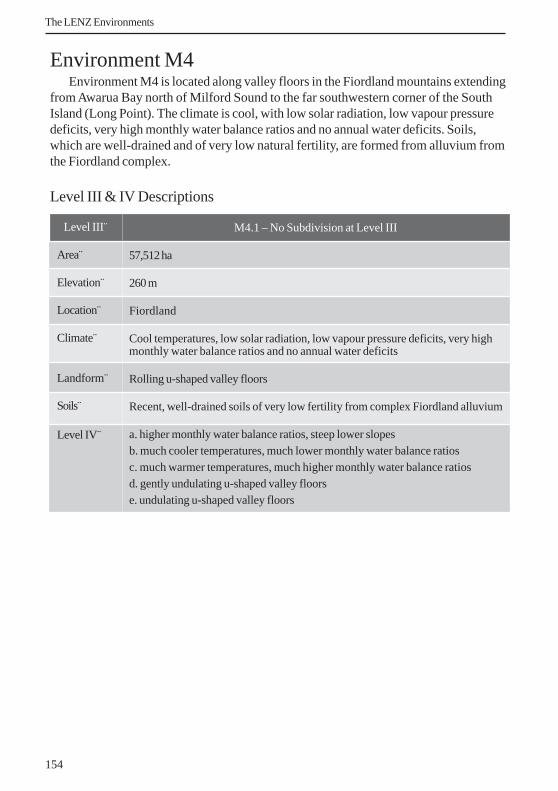
154
The LENZ Environments
Environment M4Environment M4 is located along valley floors in the Fiordland mountains extending
from Awarua Bay north of Milford Sound to the far southwestern corner of the SouthIsland (Long Point). The climate is cool, with low solar radiation, low vapour pressuredeficits, very high monthly water balance ratios and no annual water deficits. Soils,which are well-drained and of very low natural fertility, are formed from alluvium fromthe Fiordland complex.
Level III & IV Descriptions
Level III¨
Area¨
Elevation¨
Location¨
Climate¨
Landform¨
Soils̈
Level IV¨
M4.1 – No Subdivision at Level III
57,512 ha
260 m
Fiordland
Cool temperatures, low solar radiation, low vapour pressure deficits, very highmonthly water balance ratios and no annual water deficits
Rolling u-shaped valley floors
Recent, well-drained soils of very low fertility from complex Fiordland alluvium
a. higher monthly water balance ratios, steep lower slopesb. much cooler temperatures, much lower monthly water balance ratiosc. much warmer temperatures, much higher monthly water balance ratiosd. gently undulating u-shaped valley floorse. undulating u-shaped valley floors

155
The LENZ Environments
Environment N encompasses the extensive plains and inter-montane basin floors ofCanterbury, Otago and Southland. In the north this includes both the Canterbury plainsand the floor of the Waitaki Basin. In Otago, N extends from coastal areas north ofDunedin west to the Upper Taieri Plains and inland to the foot of the Southern Alps.Environment N has a cool climate with moderate solar radiation and moderate waterand vapour pressure deficits. The terrain is generally flat to very gently sloping. Soils aremostly formed on alluvial sands and gravels derived from greywacke and schist, some ofwhich are overlain with loess. They are generally moderately drained and of moderatenatural fertility.
N - Eastern South Island Plains

156
The LENZ Environments
DENDROGRAM OF N

157
The LENZ Environments
N1
404,7
83 97.3
11.3 0.6 14.0 4.4 0.5 1.7
183.2 0.7 3.7 3.6 2.0 2.1 2.9 2.0 1.0
Envi
ronm
ent
Are
a (ha
)
Alti
tude
(m)
Mea
n an
nual
tem
pera
ture
(ºC
)
Mea
n m
inim
um te
mpe
ratu
re o
f the
cold
est m
onth
(ºC
)
Mea
n an
nual
sola
r rad
iatio
n (M
J/m2 /d
ay)
Mea
n w
inte
r sol
ar ra
diat
ion
(MJ/m
2 /day
)
Oct
ober
vap
our p
ress
ure d
efic
it (k
Pa)
Mon
thly
wat
er b
alan
ce ra
tio (r
atio
)
Mea
n an
nual
wat
er d
efic
it (m
m)
Slop
e (º)
Dra
inag
e (1=
very
poo
r to
5=go
od)
Aci
d so
lubl
e pho
spho
rus (
1=v.
low
to 5
=v. h
igh)
Exch
ange
able
calc
ium
(1=l
ow to
5=v
. hig
h)
Parti
cle s
ize (
1=cl
ay/si
lt to
5=b
ould
ers–
mas
sive)
Indu
ratio
n (1
=non
-indu
rate
d to
5=v
. stro
ngly
ind.
)
Soil
Age
(1=r
aw/re
cent
, 2=o
lder
)
Che
mic
al li
mita
tions
(1=l
ow, 2
=sal
ine,
3=u
ltram
afic
)
N2
487,8
25
214.8 10.5
-0.1
13.6 4.3 0.4 1.9 82.4 0.3 4.7 3.9 2.0 2.8 3.7 2.0 1.0
N3
605,1
48
293.7 9.5 -1.0
13.0 4.0 0.4 1.6
112.5 4.2 3.7 3.0 2.0 1.7 2.3 2.0 1.0
N4
243,0
15
492.2 8.8 -3.2
13.6 3.7 0.4 1.4
192.7 11.2 4.6 3.0 1.7 3.9 3.8 2.0 1.0
N5
166,3
41
422.0 9.1 -2.9
13.6 3.8 0.4 1.2
210.8 1.6 4.0 3.2 2.2 2.9 2.5 2.0 1.2
N6
94,93
3
489.4 9.1 -3.1
13.8 4.1 0.5 1.3
193.6 0.8 4.9 3.9 1.4 2.7 2.3 1.6 1.0
N7
12,37
6
411.5 9.2 -3.1
13.6 3.9 0.5 1.1
238.1 0.2 1.7 3.4 2.0 1.6 1.4 1.0 1.0
N8
39,14
1
243.4 10.2
-2.4
13.9 3.6 0.5 1.0
306.9 2.3 4.5 3.0 2.1 2.9 2.1 1.9 1.1

158
The LENZ Environments
Environment N1Most of Environment N1 is located on the Canterbury Plains extending from the
Conway to the Rangitata River with some small areas occurring in Central Otago. Theclimate is mild, with high solar radiation, high vapour pressure deficits (mainly becauseof the föhn winds) and moderate annual water deficits. Parent materials arepredominantly greywacke gravels with some loess and fine alluvium. Soils areimperfectly drained and of high natural fertility.
Level III & IV Descriptions
Level III
Area
Elevation
Location
Climate
Landform
Soils
Level IV
N1.1
227,196 ha
105 m
Canterbury Plains
Mild temperatures, high solarradiation, high vapour pressure deficits,moderate annual water deficits
Flat plains
Well-drained soils of high fertility fromloess derived from greywacke andgreywacke gravels
a. as for N1.1b. cooler winter temperatures, higher
vapour pressure deficits, moderatefertility
c. higher vapour pressure deficits,higher annual water deficits
N1.2
177,684 ha
85 m
Canterbury Plains
Mild temperatures, high solarradiation, high vapour pressuredeficits, moderate annual water deficit
Very gently undulating plains
Fine-textured soils of imperfectdrainage with high fertility from finegreywacke alluvium
a. gently undulating plains, moderatefertility
b. lower annual water deficitsc. higher annual water deficits

159
The LENZ Environments
Environment N2Environment N2 occurs on the inland Canterbury Plains, around Hamner Springs
and the Waitaki River mouth and in inland Southland. The climate is mild, withmoderate levels of solar radiation, moderate vapour pressure deficits and low annualwater deficits. Parent materials include greywacke gravels, loess and schist. Soils arewell-drained and of high natural fertility.
Level III & IV Descriptions
Level III
Area
Elevation
Location
Climate
Landform
Soils
Level IV
N2.1
367,908 ha
250 m
North of Timaru to Christchurch
Mild temperatures, moderate solarradiation, high vapour pressure deficits,low annual water deficits
Flat plains
Well-drained soils of high fertility fromgreywacke gravels with some loess
a. higher annual water deficitsb. warmer winter temperatures,
moderate fertility, weak induration,fine-textured soils
c. much lower annual water deficitsd. cooler winter temperatures, lower
annual water deficits
N2.2
119,944 ha
110 m
South of Timaru, northern Southland
Mild temperatures, low solar radiation,moderate vapour pressure deficits,moderate annual water deficits
Flat plains
Imperfectly drained soils of highfertility from greywacke gravels withsome loess
a. higher annual water deficitsb. much lower annual water deficits

160
The LENZ Environments
Environment N3Environment N3 occurs in south Canterbury, the eastern Otago plains and around
the upper Taieiri River. The climate is cool with moderate solar radiation, moderatevapour pressure deficits and low annual water deficits. Parent materials includegreywacke alluvium with some loess, schist and Tertiary mudstones and sandstones. Soilsare imperfectly drained and of moderate natural fertility.
Level III & IV Descriptions
Level III
Area
Elevation
Location
Climate
Landform
Soils
Level IV
N3.1
463,824 ha
300 m
Timaru, Oamaru, Otago
Cool temperatures,moderate solar radiation,moderate vapourpressure deficits,moderate annual waterdeficits
Undulating plains
Imperfectly drained soilsof moderate fertility fromgreywacke alluvium withsome loess
a. lower annual waterdeficits
b. much warmertemperatures, higherannual water deficits
c. much warmertemperatures, higherannual water deficits
d. much coolertemperatures
e. much coolertemperatures, lowerannual water deficits,undulating plains
f. cooler temperatures
N3.2
16,944 ha
535 m
Inland Otago
Cool temperatures,moderate solarradiation, moderatevapour pressure deficits,moderate annual waterdeficits
Undulating plains
Imperfectly drainedsoils of moderatefertility from Tertiarymudstones andsandstone with gravels
a. – no subdivision atLevel IV – same asN3.2
N3.3
124,660 ha
245 m
Lower Waitaki,Oamaru, coastal Otagosouth of Moeraki
Cool temperatures, lowsolar radiation, moderatevapour pressure deficits,moderate annual waterdeficits
Undulating plains
Well-drained soils ofmoderate fertility fromloess derived from schistand greywacke, andschist
a. as for N3.3b. cooler winter
temperatures, higherannual water deficits

161
The LENZ Environments
Environment N4Environment N4 occurs around Alexandra, along the Raggedy Range and around
the lower slopes of the Dunstan and the Garvie Mountains. It is also extensive in themiddle reaches of the Waitaki River. Climatically this environment is cool with moderatesolar radiation, moderate vapour pressure deficits and moderate annual water deficits.Parent materials consist of schist (around Alexandra) and greywacke (around LakeWaitaki). Soils are well-drained and of moderate natural fertility
Level III & IV Descriptions
Level III¨
Area¨
Elevation¨
Location¨
Climate¨
Landform¨
Soils̈
Level IV¨
N4.1 – No Subdivision at Level III
242,952 ha
495 m
Central Otago, Alexandra, Lake Waitaki
Cool temperatures, moderate solar radiation, moderate vapour pressure deficits,very low monthly water balance ratios, moderate annual water deficits
Rolling lower hillslopes and basin floors
Well-drained soils of moderate fertility from schist and greywacke
a. warmer winter temperatures, undulating plainsb. much cooler temperatures, undulating plainsc. lower annual water deficits, steep hillsd. warmer winter temperatures, steep hillse. warmer temperatures, much higher annual water deficits

162
The LENZ Environments
Environment N5Environment N5 is located on the plains near Ranfurly and Wanaka and north east
of Alexandra. Scattered occurrences are found in the middle reaches of the WaitakiRiver. The climate is cool with moderate solar radiation, moderate vapour pressuredeficits and high annual water deficits. Parent materials consist of colluvium and loessfrom greywacke and schist, and small pockets of calcareous mudstone. Soils areimperfectly drained and of moderate fertility. This environment includes small areas ofsaline soils.
Level III & IV Descriptions
Level III
Area
Elevation
Location
Climate
Landform
Soils
Level IV
N5.1
141,436 ha
425 m
Around Ranfurly and Wanaka, alsooccurs around the Shotover River andaround Queenstown’s suburbs
Cool temperatures, moderate solarradiation, high vapour pressure deficits,high annual water deficits
Very gently undulating plains
Imperfectly drained soils of moderatefertility from a mixture of colluviumand loess from greywacke and schist
a. as for N5.1b. cooler winter temperatures, imperfect
drainagec. warmer temperatures
N5.2
25,112 ha
415 m
Ranfurly and north east of Alexandra
Cool temperatures, moderate solarradiation, moderate vapour pressuredeficits, high annual water deficits
Very gently undulating plains
Imperfectly drained, saline soils ofhigh fertility from calcareousmudstone
a. – no subdivision at Level IV – sameas N5.2

163
The LENZ Environments
Environment N6Environment N6 consists of extensive glacial outwash material in the Waitaki Basin
and alluvium exending downstream to Lake Benmore. Smaller areas occur in CentralOtago. Climatically this environment is cool, with moderate solar radiation, high vapourpressure deficits and moderate annual water deficits. Parent materials consist of till,alluvium and loess derived from both greywacke and schist. Soils are well-drained and ofhigh natural fertility
Level III & IV Descriptions
Level III
Area
Elevation
Location
Climate
Landform
Soils
Level IV
N6.1
75,952 ha
500 m
Plains between Twizel and LakeTekapo
Cool temperatures, moderate levels ofsolar radiation, high vapour pressuredeficits, moderate annual water deficits
Gently undulating plains
Well-drained soils of high fertilityfrom greywacke gravels, loess andcolluvium
a. recent soilsb. older soils
N6.2
18,972 ha
445 m
Omarama, Nevis Crossing, throughoutCentral Otago
Cool temperatures, moderate levels ofsolar radiation, high vapour pressuredeficits, high annual water deficits
Gently undulating plains
Recent, imperfectly drained soils ofhigh fertility from fine schist andgreywacke alluvium
a. – no subdivision at Level IV – sameas N6.2

164
The LENZ Environments
Environment N7Environment N7 consists of small areas of wetlands in the Upper Waitaki Plains and
eastern parts of Central Otago. Climatically this environment is cool, with moderate solarradiation, high vapour pressure deficits and high annual water deficits. Parent materialsconsist of fine schist and greywacke alluvium with some small areas of loess. Soils aregenerally poorly-drained and of moderate natural fertility
Level III & IV Descriptions
Level III¨
Area¨
Elevation¨
Location¨
Climate¨
Landform¨
Soils̈
Level IV¨
N7.1 – No Subdivision at Level III
12,272 ha
410 m
Central Otago
Cool temperatures, moderate solar radiation, high vapour pressure deficits, highannual water deficits
Flat plains
Recent, poorly-drained soils of moderate fertility from fine schist and greywackealluvium with some loess
a. high fertilityb. as for N7.1

165
The LENZ Environments
Environment N8Environment N8 occurs on the Clutha plains surrounding Alexandra and from
Cromwell to Luggate. The climate of this environment is dry, with mild temperatures,moderate solar radiation, high vapour pressure deficits and very high annual waterdeficits. Parent materials are varied consisting of schist alluvium, greywacke, andalluvium from Tertiary rocks. Soils are well-drained and have moderate natural fertility– some are saline.
Level III & IV Descriptions
Level III
Area
Elevation
Location
Climate
Landform
Soils
Level IV
N8.1
34,888 ha
245 m
Mostly adjacent to the Clutha Riverfrom Luggate through to Alexandra
Mild temperatures, moderate solarradiation, high vapour pressuredeficits, very high annual water deficits
Gently undulating floodplains
Older, well-drained soils of moderatefertility from schist alluvium andcolluvium, saline alluvium andgreywacke gravels with some loess
a. saline soilsb. as for N8.1
N8.2
4384 ha
230 m
Clutha River valley around Alexandraand from Cromwell through toLuggate
Mild temperatures, moderate solarradiation, high vapour pressuredeficits, very high annual water deficits
Gently undulating floodplains
Recent, imperfectly drained soils ofmoderate fertility from fine schistalluvium and colluvium with someloess
a. – no subdivision at Level IV – sameas N8.2

166
The LENZ Environments
Environment O is most extensive at low to middle elevations in Westland, westernSouthland and on Stewart Island. The climate of Environment O reflects its generallyhigh exposure to westerly winds and is typified by cool temperatures, low solar radiation,high monthly water balance ratios and low vapour pressure deficits. Landforms arediverse, consisting of older outwash materials of glacial origin, low rolling hill-countryand the lower slopes of larger mountain ranges. A wide range of parent material includesgranite, greywacke, schist, diorite, gabbro, alluvium from a variety of sources, Tertiarysandstone, mudstone, limestone, dune sands and peat. Soils range from very poorly towell drained and are of moderate to low natural fertility.
O - Western South Island Foothills and Stewart Island

167
The LENZ Environments
DENDROGRAM OF O

168
The LENZ Environments
Envi
ronm
ent
Are
a (ha
)
Alti
tude
(m)
Mea
n an
nual
tem
pera
ture
(ºC
)
Mea
n m
inim
um te
mpe
ratu
re o
f the
cold
est m
onth
(ºC
)
Mea
n an
nual
sola
r rad
iatio
n (M
J/m2 /d
ay)
Mea
n w
inte
r sol
ar ra
diat
ion
(MJ/m
2 /day
)
Oct
ober
vap
our p
ress
ure d
efic
it (k
Pa)
Mon
thly
wat
er b
alan
ce ra
tio (r
atio
)
Mea
n an
nual
wat
er d
efic
it (m
m)
Slop
e (º)
Dra
inag
e (1=
very
poo
r to
5=go
od)
Aci
d so
lubl
e pho
spho
rus (
1=v.
low
to 5
=v. h
igh)
Exch
ange
able
calc
ium
(1=l
ow to
5=v
. hig
h)
Parti
cle s
ize (
1=cl
ay/si
lt to
5=b
ould
ers–
mas
sive)
Indu
ratio
n (1
=non
-indu
rate
d to
5=v
. stro
ngly
ind.
)
Soil
Age
(1=r
aw/re
cent
, 2=o
lder
)
Che
mic
al li
mita
tions
(1=l
ow, 2
=sal
ine,
3=u
ltram
afic
)
O1
505,4
44 131
10.9 1.3 13.2 4.0 0.3 7.9 0.0 6.6 4.8 2.6 1.2 3.4 2.3 2.0 1.0
O2
472,6
61 232 9.3 0.3 12.8 3.8 0.2 13.3 0.0 23.3 4.5 2.8 1.6 3.6 3.4 2.0 1.0
O3
89,08
2
118
11.1 1.9 13.1 4.0 0.3 8.3 0.0 2.1 1.7 2.7 1.2 2.7 1.9 2.0 1.0
O4
143,9
39 205 8.0 0.0 12.4 3.1 0.3 5.5 0.1 16.9 3.9 1.9 1.8 3.2 3.4 2.0 1.0
O5
211,4
22 147 8.8 2.0 11.8 2.8 0.2 7.1 0.0 9.1 2.6 1.5 1.2 4.5 4.4 2.0 1.0

169
The LENZ Environments
Environment O1Environment O1 is a found along the entire West Coast, with smaller areas on inland
sites around Haast. This environment has a wet climate with mild temperatures,moderate solar radiation and high monthly water balance ratios. Parent materials aredominated by mixed alluvium and gravels, with smaller amounts of Tertiary mudstonesand sandstones, weathered granite, and limestone. Soils are well-drained and generally ofmoderate natural fertility.
Level III & IV Descriptions
Level III
Area
Elevation
Location
Climate
Landform
Soils
Level IV
O1.1
104,744 ha
220 m
Northern WestCoast, North ofWestport
Mildtemperatures,moderate solarradiation, lowvapour pressuredeficits, moderatemonthly waterbalance ratios, noannual waterdeficits
Rolling hills
Well-drainedsoils of moderatefertility fromTertiarymudstones andsandstones
a. – no subdivisionat Level IV –same as O1.1
O1.2
33,716 ha
230 m
AroundPunakaiki andGreymouth
Mildtemperatures,moderate solarradiation, lowvapour pressuredeficits, highmonthly waterbalance ratios, noannual waterdeficits
Rolling hills
Imperfectlydrained soils ofvery high fertilityfrom limestone,siltstone andmudstone
a. warmer wintertemperatures,high fertility
b. steep hills, veryhigh fertility
O1.3
20,988 ha
15 m
West Coastcoastline
Mildtemperatures,moderate solarradiation, lowvapour pressuredeficits, moderatemonthly waterbalance ratios, noannual waterdeficits
Flat coastal plains
Imperfectlydrained soils ofmoderate fertilityfrom parentmaterial of dunesand with smallpockets ofgreywacke
a. – no subdivisionat Level IV –same as O1.3
O1.4
346,308 ha
180 m
West Coast plains,aroundGreymouth butstretching toHaast
Mildtemperatures,moderate solarradiation, lowvapour pressuredeficits, highmonthly waterbalance ratios, noannual waterdeficits
Undulating plains
Well-drained soilsof moderatefertility fromgreywacke andgranite alluvium
a. gentlyundulatingplains

170
The LENZ Environments
Level III
Area
Elevation
Location
Climate
Landform
Soils
Level IV
Environment O2Environment O2 occupies the coastal terraces and hill-country and intermontane
valleys of the West Coast. Climatically this environment, like O1, is wet with cooltemperatures, low solar radiation, low vapour pressure deficits and extremely highmonthly water balance ratios. Dominant parent materials are alluvium derived fromgranite and greywacke, schist. Soils are generally well-drained and of moderate naturalfertility.
Level III & IV Descriptions
O2.1
161,044 ha
270 m
West of the Alpine Fault
Mild temperatures, lowsolar radiation, lowvapour pressure deficits,very high monthly waterbalance ratios, no annualwater deficits
Steep hills
Well-drained soils ofmoderate fertility fromTertiary mudstones andsandstones andgreywacke and granitealluvium
a. steep hillsb. easy rolling hills,
imperfectly drained
O2.2
17,380 ha
390 m
South Westland
Cool temperatures, lowsolar radiation, very lowvapour pressure deficits,extremely high monthlywater balance ratios, noannual water deficits
Easy rolling hills
Well-drained soils oflow fertility from basicigneous rocks, Tertiarymudstones andsandstones, and quartzconglomerates
a. – no subdivision atLevel IV – same asO2.2
O2.3
294,456 ha
575 m
Predominatly east of theAlpine Fault
Cool temperatures, lowsolar radiation, lowvapour pressure deficits,very high monthly waterbalance ratios, no annualwater deficits
Very steep mountainousterrain
Imperfectly drained soilsof moderate fertilityfrom schist withgreywacke west of theAlpine Fault
a. higher monthly waterbalance ratios
b. much lower monthlywater balance ratios

171
The LENZ Environments
Environment O3Environment O3 consists of areas of poorly-drained soils scattered along the coastal
plains of the West Coast. The climate of Environment O3 is mild, with moderate solarradiation, low vapour pressure deficits and high monthly water balance ratios. Parentmaterials are dominated by old deposits of granite and greywacke alluvium, Tertiarymudstones, sandstones and peat. Soils are generally poorly-drained and of very lownatural fertility.
Level III & IV Descriptions
Level III
Area
Elevation
Location
Climate
Landform
Soils
Level IV
O3.1
70,920 ha
135 m
West Coast
Mild temperatures,moderate solar radiation,low vapour pressuredeficits, high monthlywater balance ratios, noannual water deficits
Gently undulating plains
Imperfectly drained soilsof moderate fertility fromgranite and greywackealluvium
a. lower monthly waterbalance ratios
b. as for O3.1c. cooler winter
temperaturesd. warmer winter
temperatures
O3.2
5276 ha
45 m
South Westland
Mild temperatures, lowsolar radiation, lowvapour pressure deficits,very high monthlywater balance ratios, noannual water deficits
Undulating plains
Imperfectly drainedsoils of low fertility fromthe Fiordland complex,granite and greywacke
a. – no subdivision atLevel IV – same asO3.2
O3.3
12,800 ha
25 m
West Coast
Mild temperatures, lowsolar radiation, lowvapour pressure deficits,high monthly waterbalance ratios, no annualwater deficits
Flat plains
Very poorly-drained peatsoils of very low fertility
a. – no subdivision atLevel IV – same asO3.3

172
The LENZ Environments
Environment O4Environment O4 has the most southerly distribution of the Level II O environments,
occuring mainly along the eastern margins of the Fiordland mountains. Climatically thisenvironment is the coldest O environment as a result of its high average elevation. This,along with its low solar radiation, low vapour pressure deficits, and moderate monthlywater balance ratios, distinguishes it from the other O environments. The steep slopes ofO4 are covered with soils of imperfect drainage including Tertiary mudstones andsandstones, granites and old granite and greywacke alluvium. Soils are imperfectlydrained and of moderate natural fertility.
Level III & IV Descriptions
Level III
Area
Elevation
Location
Climate
Landform
Soils
Level IV
O4.1
94,764 ha
540 m
Inland parts of western Southland
Cool temperatures, low solar radiation,low vapour pressure deficits,intermediate monthly water balanceratios, no annual water deficits
Steep hills
Well-drained soils of low fertility fromTertiary sandstones, gravels and granite
a. as for O4.1b. extremely steep hills, strongly
weathered, coarse-textured soils
O4.2
49,316 ha
310 m
Coastal parts of western Southland
Cool temperatures, low solar radiation,low vapour pressure deficits,intermediate monthly water balanceratios, slight annual water deficits
Rolling hills
Imperfectly drained soils of lowfertility from Tertiary sandstones andgravels, and basic igneous rocks
a. as for O4.2b. cooler temperatures, very poor
drainage, very low fertility

173
The LENZ Environments
Environment O5Environment O5 occurs on the southwestern flanks of the Fiordland mountains,
around Puysegur Point, and over most of Stewart Island. Climatically this environmentis cool, with very low solar radiation, low vapour pressure deficits, and intermediatemonthly water balance ratios. The parent materials are diverse, with extensive areas ofgranite, igneous rocks, andesites, alluvium from Fiordland mountains, some Tertiarysandstones and peat. Soils are of poor to imperfect drainage and of low natural fertility.
Level III & IV Descriptions
Level III
Area
Elevation
Location
Climate
Landform
Soils
Level IV
O5.1
30,748 ha
280 m
Fiordland
Cool temperatures, very low solarradiation, low vapour pressure deficits,high monthly water balance ratios, noannual water deficits
Easy rolling hills
Imperfectly drained peaty soils of verylow fertility
a. as for O5.1b. much lower monthly water balance
ratios, rolling hills, very poorly-drained, very weakly indurated, veryfine-textured soils, peaty soils
O5.2
180,804 ha
175 m
Fiordland, Stewart Island
Cool temperatures, very low solarradiation, low vapour pressuredeficits, intermediate monthly waterbalance ratios, no annual water deficits
Easy rolling hills
Imperfectly drained soils of lowfertility from fresh granite andintermediate igneous rocks
a. as for O5.2b. strongly rolling hills, high fertilityc. very poor drainage, very low fertilityd. strongly rolling hills, slightly
imperfectly drained soils, very lowfertility

174
The LENZ Environments
Environment P is one of the most extensive and widely occurring Level I landenvironment, including the mountains of the central and southern North Island and thenorthern and eastern South Island. The climate of Environment P reflects both its highelevation and, in the south, its partial sheltering from prevailing southwesterly winds bythe Southern Alps. Temperatures are cold, with high annual and moderate winter solarradiation. Rainfall deficits are only slight, the average monthly water balance ratio ismoderate, and vapour pressure deficits are low. Landforms in Environment P mostlyconsist of mountains and steep, lower-elevation hills, along with the andesitic volcaniccones of Taranaki and the Tongariro National Park. Greywacke is by far thepredominant soil parent material, but granite, schist, Tertiary mudstones and sandstonesand gravels are also locally important. Extensive areas in the North Island are mantledwith andesitic or rhyolitic tephra, and andesitic rocks are dominant on the volcanoes.Soils are mostly well-drained and of low natural fertility.
P - Central Mountains

175
The LENZ Environments
DENDROGRAM OF P

176
The LENZ Environments
Envi
ronm
ent
Are
a (ha
)
Alti
tude
(m)
Mea
n an
nual
tem
pera
ture
(ºC
)
Mea
n m
inim
um te
mpe
ratu
re o
f the
cold
est m
onth
(ºC
)
Mea
n an
nual
sola
r rad
iatio
n (M
J/m2 /d
ay)
Mea
n w
inte
r sol
ar ra
diat
ion
(MJ/m
2 /day
)
Oct
ober
vap
our p
ress
ure d
efic
it (k
Pa)
Mon
thly
wat
er b
alan
ce ra
tio (r
atio
)
Mea
n an
nual
wat
er d
efic
it (m
m)
Slop
e (º)
Dra
inag
e (1=
very
poo
r to
5=go
od)
Aci
d so
lubl
e pho
spho
rus (
1=v.
low
to 5
=v. h
igh)
Exch
ange
able
calc
ium
(1=l
ow to
5=v
. hig
h)
Parti
cle s
ize (
1=cl
ay/si
lt to
5=b
ould
ers–
mas
sive)
Indu
ratio
n (1
=non
-indu
rate
d to
5=v
. stro
ngly
ind.
)
Soil
Age
(1=r
aw/re
cent
, 2=o
lder
)
Che
mic
al li
mita
tions
(1=l
ow, 2
=sal
ine,
3=u
ltram
afic
)
P1
1,156
,252
1281 5.8 -3.2
14.1 4.7 0.3 5.3 1.4 27.1 5.0 2.9 1.0 4.0 4.0 2.0 1.0
P2
171,5
87
1469 4.7 -4.2
13.9 4.6 0.2 7.8 0.0 28.2 3.0 3.0 1.0 4.0 4.0 2.0 1.0
P3
359,2
92 859 7.8 -1.6
13.5 4.2 0.1 9.9 0.0 24.9 5.0 1.2 1.0 4.9 4.8 2.0 1.0
P4
46,55
9
1414 5.7 -1.4
14.1 5.0 0.1 7.8 0.0 14.3 4.9 3.5 1.5 3.0 3.4 2.0 1.0
P5
491,7
72 577 9.2 -1.2
14.0 4.2 0.3 5.8 0.7 18.6 5.0 23.9 1.3 3.7 3.3 2.0 1.0
P6
401,8
97 536 9.8 0.1 15.0 4.7 0.3 4.9 2.1 23.6 4.9 2.5 1.4 4.2 4.0 2.0 1.0
P7
432,1
00 961 8.5 0.3 14.5 5.2 0.3 4.3 0.5 18.1 5.0 1.7 1.5 1.9 2.6 2.0 1.0
P8
192,9
11 746 8.6 1.2 13.9 4.5 0.2 5.8 0.1 23.2 4.0 1.0 1.0 4.0 4.0 2.0 1.0
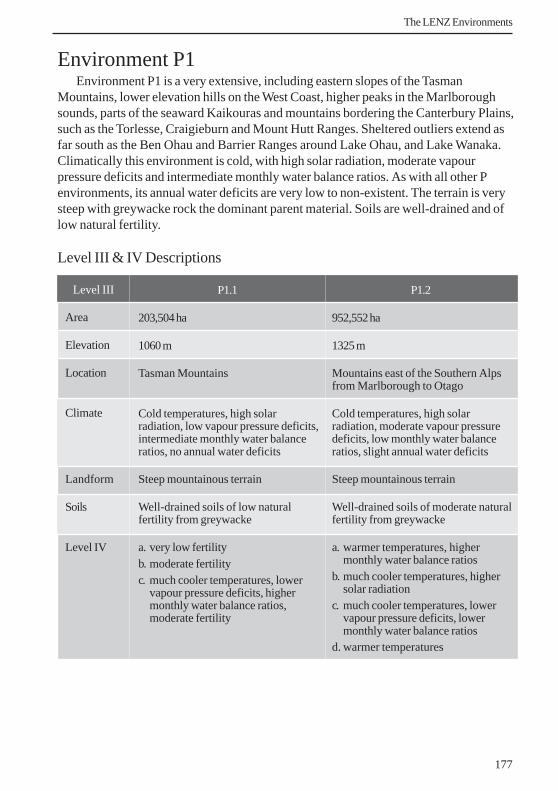
177
The LENZ Environments
Level III
Area
Elevation
Location
Climate
Landform
Soils
Level IV
Environment P1Environment P1 is a very extensive, including eastern slopes of the Tasman
Mountains, lower elevation hills on the West Coast, higher peaks in the Marlboroughsounds, parts of the seaward Kaikouras and mountains bordering the Canterbury Plains,such as the Torlesse, Craigieburn and Mount Hutt Ranges. Sheltered outliers extend asfar south as the Ben Ohau and Barrier Ranges around Lake Ohau, and Lake Wanaka.Climatically this environment is cold, with high solar radiation, moderate vapourpressure deficits and intermediate monthly water balance ratios. As with all other Penvironments, its annual water deficits are very low to non-existent. The terrain is verysteep with greywacke rock the dominant parent material. Soils are well-drained and oflow natural fertility.
Level III & IV Descriptions
P1.1
203,504 ha
1060 m
Tasman Mountains
Cold temperatures, high solarradiation, low vapour pressure deficits,intermediate monthly water balanceratios, no annual water deficits
Steep mountainous terrain
Well-drained soils of low naturalfertility from greywacke
a. very low fertilityb. moderate fertilityc. much cooler temperatures, lower
vapour pressure deficits, highermonthly water balance ratios,moderate fertility
P1.2
952,552 ha
1325 m
Mountains east of the Southern Alpsfrom Marlborough to Otago
Cold temperatures, high solarradiation, moderate vapour pressuredeficits, low monthly water balanceratios, slight annual water deficits
Steep mountainous terrain
Well-drained soils of moderate naturalfertility from greywacke
a. warmer temperatures, highermonthly water balance ratios
b. much cooler temperatures, highersolar radiation
c. much cooler temperatures, lowervapour pressure deficits, lowermonthly water balance ratios
d. warmer temperatures

178
The LENZ Environments
Environment P2Environment P2 occurs at very high elevations on the eastern side of the Southern
Alps from Nelson Lakes National Park to the Rakaia headwaters and in mountainvalleys as far south as the Upper Waitaki Basin. The climate is very cold and solarradiation is moderate. Vapour pressure deficits are low and high monthly water balanceratios are common. The very steep slopes of P2 are predominatly greywacke with somegranite. Soils, where present, are imperfectly drained and of low natural fertility.
Level III & IV Descriptions
Level III
Area
Elevation
Location
Climate
Landform
Soils
Level IV
P2.1 – No Subdivision at Level III
171,432 ha
1465 m
Eastern side of the Main Divide, closely associated with Environment P1
Very cold temperatures, moderate solar radiation, low vapour pressure deficits,high monthly water balance ratios, no annual water deficits
Steep mountains
Imperfectly drained soils of moderate natural fertility from greywacke, with somegranite
a. higher monthly water balance ratiosb. lower monthly water balance ratios

179
The LENZ Environments
Level III
Area
Elevation
Location
Climate
Landform
Soils
Level IV
Environment P3Environment P3 is located in both the western Tasman Mountains and northern
West Coast ranges such as the Paparoa and Victoria Ranges. The climate of thisenvironment is strongly influenced by its exposure to moisture laden westerly winds,with cool temperatures, moderate solar radiation, very low vapour pressure deficits andhigh monthly water balance ratios. Granite, Tertiary mudstones and sandstones are thedominant parent materials. Soils are well-drained but of very low fertility due toleaching.
Level III & IV Descriptions
P3.1
322,864 ha
875 m
Paparoa and Victoria Ranges, westernTasman Mountains
Cool temperatures, moderate solarradiation, very low vapour pressuredeficits, very high monthly waterbalance ratios, no annual water deficits
Steep mountains
Well-drained soils of very low naturalfertility from fresh granite
a. higher solar radiation, lowermonthly water balance ratios
b. as for P3.1
P3.2
36,072 ha
740 m
Behind Westport, Matiri and HopeRanges
Cool temperatures, high solarradiation, very low vapour pressuredeficits, high monthly water balanceratios, no annual water deficits
Easy rolling plateau
Well-drained soils of very low naturalfertility from quartz gravels,conglomerates, sandstones and coalmeasures
a. lower monthly water balance ratiosb. higher monthly water balance ratios
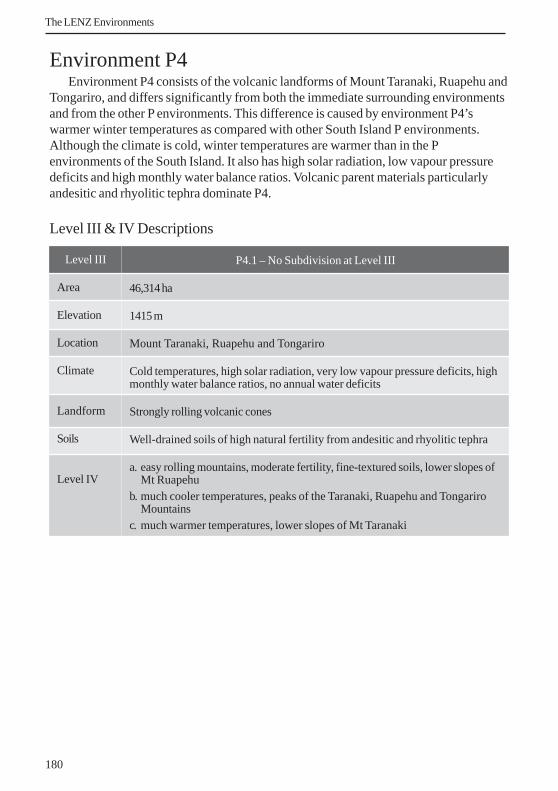
180
The LENZ Environments
Level III
Area
Elevation
Location
Climate
Landform
Soils
Level IV
Environment P4Environment P4 consists of the volcanic landforms of Mount Taranaki, Ruapehu and
Tongariro, and differs significantly from both the immediate surrounding environmentsand from the other P environments. This difference is caused by environment P4’swarmer winter temperatures as compared with other South Island P environments.Although the climate is cold, winter temperatures are warmer than in the Penvironments of the South Island. It also has high solar radiation, low vapour pressuredeficits and high monthly water balance ratios. Volcanic parent materials particularlyandesitic and rhyolitic tephra dominate P4.
Level III & IV Descriptions
P4.1 – No Subdivision at Level III
46,314 ha
1415 m
Mount Taranaki, Ruapehu and Tongariro
Cold temperatures, high solar radiation, very low vapour pressure deficits, highmonthly water balance ratios, no annual water deficits
Strongly rolling volcanic cones
Well-drained soils of high natural fertility from andesitic and rhyolitic tephra
a. easy rolling mountains, moderate fertility, fine-textured soils, lower slopes ofMt Ruapehu
b. much cooler temperatures, peaks of the Taranaki, Ruapehu and TongariroMountains
c. much warmer temperatures, lower slopes of Mt Taranaki

181
The LENZ Environments
Environment P5Environment P5 occurs at lower elevations than the other P environments, extending
from coastal sites on the western slopes of the Tasman Mountains to the extensive rollingcountry in the upper reaches of the Maruia, Grey and Buller Rivers. Small areas alsooccur in western Otago along rivers such as the Hunter, Makarora and Matukituki.Climatically P5 is cool, with high solar radiation, moderate vapour pressure deficits andmoderate monthly water balance ratios. Landforms in P5 are generally strongly rollingto steep, include greywacke, granite, schist, alluvium, and the Moutere gravels of inlandNelson. Soils are well-drained and very low natural fertility.
Level III & IV Descriptions
Level III
Area
Elevation
Location
Climate
Landform
Soils
Level IV
P5.1
303,368 ha
610 m
Western Tasman Mountains, upperreaches of the Maruia, Grey and BullerRivers, western Otago
Cool temperatures, moderate solarradiation, low vapour pressure deficits,intermediate monthly water balanceratios, slight annual water deficits
Steep mountains
Well-drained soils of moderate naturalfertility from granite and greywackealluvium, schist and mixed alluvium,Tertiary mudstones and andesite
a. warmer temperatures, very lowfertility
b. cooler winter temperatures, lowermonthly water balance ratios
c. cooler temperatures, weaklyindurated, fine-textured soils
d. higher monthly water balance ratiose. as for P5.1
P5.2
188,380 ha
525 m
Inland Nelson and Buller
Cool temperatures, high solarradiation, moderate vapour pressuredeficits, low monthly water balanceratios, slight annual water deficits
Strongly rolling mountains
Well-drained soils of low naturalfertility from Moutere gravels, Tertiarymudstones, sandstones and greywackealluvium
a. moderate fertilityb. very low fertility

182
The LENZ Environments
Environment P6Environment P6 is most extensive on the hills of the Abel Tasman National Park and
along the lower flanks of the Tasman Mountains in the Marlborough Sounds and on theRichmond and Bryant Ranges. Climatically this environment is cool, with very highsolar radiation, low vapour pressure deficits and moderate monthly water balance ratios.Parent materials are predominatly greywacke but significant areas of schist, weatheredgranite, marble and limestone also occur. Soils are well-drained and of moderate naturalfertility.
Level III & IV Descriptions
Level III
Area
Elevation
Location
Climate
Landform
Soils
Level IV
P6.1
38,160 ha
660 m
Abel Tasman National Park
Cool temperatures, very high solarradiation, moderate vapour pressuredeficits, intermediate monthly waterbalance ratios, slight annual waterdeficits
Steep mountains
Imperfectly drained soils of very lownatural fertility from limestone, graniteand andesite
a. cooler temperatures, rollingmountains, low fertility
b. very steep mountains
P6.2
363,732 ha
525 m
Lower flanks of the TasmanMountains, Bryant and RichmondRanges, Marlborough Sounds
Cool temperatures, very high solarradiation, moderate vapour pressuredeficits, low monthly water balanceratios, slight annual water deficits
Steep mountains
Well-drained soils of moderate naturalfertility from greywacke
a. warmer temperaturesb. much cooler temperatures, moderate
fertilityc. warmer temperatures
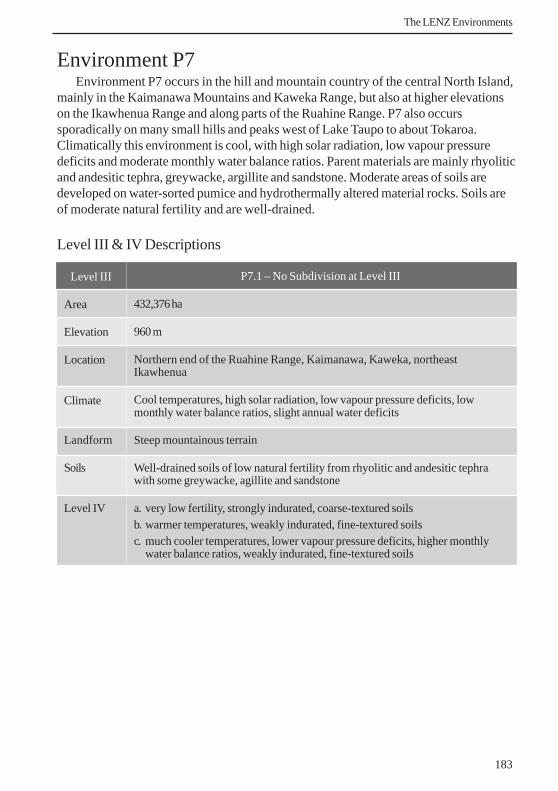
183
The LENZ Environments
Environment P7Environment P7 occurs in the hill and mountain country of the central North Island,
mainly in the Kaimanawa Mountains and Kaweka Range, but also at higher elevationson the Ikawhenua Range and along parts of the Ruahine Range. P7 also occurssporadically on many small hills and peaks west of Lake Taupo to about Tokaroa.Climatically this environment is cool, with high solar radiation, low vapour pressuredeficits and moderate monthly water balance ratios. Parent materials are mainly rhyoliticand andesitic tephra, greywacke, argillite and sandstone. Moderate areas of soils aredeveloped on water-sorted pumice and hydrothermally altered material rocks. Soils areof moderate natural fertility and are well-drained.
Level III & IV Descriptions
Level III
Area
Elevation
Location
Climate
Landform
Soils
Level IV
P7.1 – No Subdivision at Level III
432,376 ha
960 m
Northern end of the Ruahine Range, Kaimanawa, Kaweka, northeastIkawhenua
Cool temperatures, high solar radiation, low vapour pressure deficits, lowmonthly water balance ratios, slight annual water deficits
Steep mountainous terrain
Well-drained soils of low natural fertility from rhyolitic and andesitic tephrawith some greywacke, agillite and sandstone
a. very low fertility, strongly indurated, coarse-textured soilsb. warmer temperatures, weakly indurated, fine-textured soilsc. much cooler temperatures, lower vapour pressure deficits, higher monthly
water balance ratios, weakly indurated, fine-textured soils

184
The LENZ Environments
Level III
Area
Elevation
Location
Climate
Landform
Soils
Level IV
Environment P8Environment P8 encompasses the Tararua Range and the southern portion of the
Ruahine Range. Climatically this environment is cool, with moderate solar radiation, lowvapour pressure deficits and moderate monthly water balance ratios. Parent materialsconsist of greywacke with some areas of andesite, old basalts and areas of significant peatdevelopment. Soils are imperfectly drained and of low natural fertility.
Level III & IV Descriptions
P8.1
4228 ha
1115 m
Crests of the Ruahine Range
Cold temperatures, moderate solarradiation, low vapour pressure deficits,low monthly water balance ratios, noannual water deficits
Steep mountainous terrain
Imperfectly drained peat soils of verylow natural fertility – some greywacke
a. – no subdivision at Level IV – sameas P8.1
P8.2
188,760 ha
735 m
Middle parts of the Ruahine Range,Tararua and Rimutaka Ranges
Cool temperatures, moderate solarradiation, low vapour pressure deficits,intermediate monthly water balanceratios, slight annual water deficits
Steep mountainous terrain
Imperfectly drained soils of very lownatural fertility from greywacke withsome argillite
a. much cooler temperaturesb. much warmer temperatures

185
The LENZ Environments
Q is the dominant environment of the mountains and hill-country of the south-eastern South Island, extending from the Rangitata River in South Canterbury throughOtago to the Catlins in eastern Southland and westwards to the eastern fringes ofFiordland. The climate of Environment Q is cool with low annual and winter solarradiation, reflecting its southern latitude. The climate is also strongly influenced by thesheltering effects of the Southern Alps, particularly in the north, resulting in low waterdeficits and moderate vapour pressure deficits - drier conditions than occur in most ofNew Zealand’s other montane environments. Landforms consist mainly of rolling tosteep hills and mountains, but extensive areas of rolling downlands occur in the south.Parent materials are mainly schist, greywacke, and Tertiary rocks, extensive areas ofwhich are loess mantled. Substantial areas of alluvium from these rocks occur in thesouth, while other locally important parent materials include older basaltic and andesiticrocks and glacial till. The soils are generally moderately well-drained and are the mostfertile of any montane environment.
Q- Southeastern Hill Country and Mountains

186
The LENZ Environments
DENDROGRAM OF Q

187
The LENZ Environments
Envi
ronm
ent
Are
a (ha
)
Alti
tude
(m)
Mea
n an
nual
tem
pera
ture
(ºC
)
Mea
n m
inim
um te
mpe
ratu
re o
f the
cold
est m
onth
(ºC
)
Mea
n an
nual
sola
r rad
iatio
n (M
J/m2 /d
ay)
Mea
n w
inte
r sol
ar ra
diat
ion
(MJ/m
2 /day
)
Oct
ober
vap
our p
ress
ure d
efic
it (k
Pa)
Mon
thly
wat
er b
alan
ce ra
tio (r
atio
)
Mea
n an
nual
wat
er d
efic
it (m
m)
Slop
e (º)
Dra
inag
e (1=
very
poo
r to
5=go
od)
Aci
d so
lubl
e pho
spho
rus (
1=v.
low
to 5
=v. h
igh)
Exch
ange
able
calc
ium
(1=l
ow to
5=v
. hig
h)
Parti
cle s
ize (
1=cl
ay/si
lt to
5=b
ould
ers–
mas
sive)
Indu
ratio
n (1
=non
-indu
rate
d to
5=v
. stro
ngly
ind.
)
Soil
Age
(1=r
aw/re
cent
, 2=o
lder
)
Che
mic
al li
mita
tions
(1=l
ow, 2
=sal
ine,
3=u
ltram
afic
)
Q1
908,4
56
1154 5.6 -3.3
13.3 3.7 0.3 4.4 2.0 22.1 4.8 3.0 1.4 4.0 4.0 1.0 1.0
Q2
643,4
00 672 8.1 -2.4
13.4 3.9 0.4 2.4 51.3
17.3 4.6 3.0 1.4 4.0 3.9 1.0 1.0
Q3
426,9
27 860 6.5 -3.1
13.0 3.6 0.3 3.2 22.5 9.5 3.5 3.0 1.8 4.0 4.0 1.0 1.0
Q4
1,296
,995
264 9.1 0.4 12.4 3.3 0.3 3.2 20.6 7.0 4.4 3.1 1.8 3.2 3.2 1.0 1.0

188
The LENZ Environments
Environment Q1Environment Q1 consists of cold, high elevation mountain tops and range crests
including the tops of the Eyre and Harris Mountains of inland Otago, Hawkdun Range,Grampian Mountains and Hunter Hills of South Canterbury. Climatically EnvironmentQ1 is cold, with moderate solar radiation, moderate vapour pressure deficits, lowmonthly water balance ratios and slight annual water deficits. Parent materials arepredominately greywacke and schist with some areas of greywacke alluvium and loess.Typical steep mountain landforms are dominant and the well-drained soils are of low tomoderate natural fertility.
Level III & IV Descriptions
Level III
Area
Elevation
Location
Climate
Landform
Soils
Level IV
Q1.1
654,932 ha
1095 m
Hawkdun Range, GrampianMountains and Hunter Hills, SouthCanterbury, lower elevation slopes ofthe Eyre and Harris Mountains, rangesof inland Otago
Cold temperatures, moderate solarradiation, low vapour pressure deficits,low monthly water balance ratios, andslight annual water deficits
Steep mountains
Well-drained soils of moderate fertilityfrom greywacke, schist
a. much cooler temperatures, lowervapour pressure deficits, stronglyrolling mountainous terrain
b. as for Q1.1c. very steep mountainous terraind. warmer temperatures
Q1.2
253,352 ha
1305 m
Eyre and Harris Mountains, ranges ofinland Otago, Takitimu Mountains
Very cold temperatures, moderatesolar radiation, low vapour pressuredeficits, intermediate monthly waterbalance ratios, no annual water deficits
Very steep mountains
Well-drained soils of moderate fertilityfrom greywacke rock, colluvium andbasalt
a. as for Q1.2b. much warmer summer temperatures,
high fertility

189
The LENZ Environments
Level III
Area
Elevation
Location
Climate
Landform
Soils
Level IV
Environment Q2Environment Q2 is usually found in close proximity to Q1 but at lower elevations.
The climate for this environment is cool, with moderate solar radiation, moderatevapour pressure deficits, very low monthly water balance ratios and low annual waterdeficits. Parent materials are generally greywacke, schist and loess but with extensivegravelly alluvium and colluvium, and smaller areas of basic volcanic rocks, limestone andmudstone. Soils are well-drained and of moderate natural fertility.
Level III & IV Descriptions
Q2.1
407,532 ha
640 m
Eyre and Harris Mountains, ranges ofinland Otago
Cool temperatures, moderate solarradiation, moderate vapour pressuredeficits, very low monthly waterbalance ratios, low annual waterdeficits
Steep mountains
Well-drained soils of moderate fertilityfrom greywacke
a. lower annual water deficitsb. much cooler temperatures, higher
annual water deficitsc. warmer temperatures, higher annual
water deficits
Q2.2
235,740 ha
730 m
Hawkdun Range, GrampianMountains and Hunter Hills in SouthCanterbury, Takitimu Mountains,southern end of the Two ThumbRange
Cool temperatures, moderate solarradiation, moderate vapour pressuredeficits, low monthly water balanceratios, low annual water deficits
Steep mountains
Imperfectly drained soils of moderatefertility from schist
a. as for Q2.2b. much warmer temperatures,
strongly rolling mountainous terrain,moderately indurated

190
The LENZ Environments
Environment Q3Environment Q3 is dominant on the mountains and ranges of southern Otago and
northern Southland, including the Garvie Mountains, and the Rough Ridge, Rock andPillar and Lammermoor Ranges. Climatically this environment is similar to the previousQ environments, with cold temperatures, moderate solar radiation, moderate vapourpressure deficits and slight annual water deficits. Parent materials are predominantlygreywacke and schist with some loess, mudstone, and quartz gravels, conglomerates andsandstones. Soils are of moderate natural fertility and are imperfectly drained.
Level III & IV Descriptions
Level III
Area
Elevation
Location
Climate
Landform
Soils
Q3.1
84,900 ha
690 m
Eyre, ThompsonMountains and thesouthern end of theGarvie Mountains
Cool temperatures,moderate solar radiation,moderate vapourpressure deficits, lowmonthly water balanceratios, slight annualwater deficits
Steep mountains
Imperfectly drained soilsof moderate naturalfertility from greywacke
Q3.2
53,008 ha
415 m
Northern side of theTakitimu Mountainsand the Taringatura hills
Cool temperatures, lowsolar radiation,moderate vapourpressure deficits, lowmonthly water balanceratios, slight annualwater deficits
Undulating hills
Imperfectly drained soilsof moderate naturalfertility from schist,calcareous mudstone,quartz gravels andgreywacke
Q3.3
289,156 ha
990 m
Garvie Mountains andthe North Rough,Knobby, Lammerlawand Rock and PillarRanges
Cold temperatures,moderate solar radiation,moderate vapourpressure deficits, lowmonthly water balanceratios, low annual waterdeficits
Undulating mountains
Imperfectly drained soilsof moderate naturalfertility from schist

191
The LENZ Environments
Q3.3
a. much cooler annualtemperatures, lowervapour pressuredeficits, highermonthly water balanceratios, much lowerannual water deficits
b. warmer annualtemperatures, coolerwinter temperatures,higher vapour pressuredeficits, lower monthlywater balance ratios,much higher annualwater deficits
c. much lower annualwater deficits
Q3.2
a. cooler temperaturesb. warmer temperatures
Q3.1
a. cooler temperaturesb. much warmer
temperatures
Level III
Level IV

192
The LENZ Environments
Environment Q4Environment Q4 consists of low rolling hills that extend from Dunedin to the Catlins
and through much of Southland to the eastern margins of the Fiordland mountains.Climatically this environment is cool, with low solar radiation (due to its more southerlylocation and generally close proximity to the coast), moderate vapour pressure deficitsand low annual water deficits. The soils of Q4 are mostly derived from tuffaceousgreywacke and schist but with extensive areas of alluvium and loess. There are alsosmaller areas of soft Tertiary rocks and scattered areas of andesite and basalt. Soils aremoderate to well-drained and of moderate natural fertility.
Level III & IV Descriptions
Level III
Area
Elevation
Location
Climate
Landform
Soils
Level IV
Q4.1
477,280 ha
265 m
Most of the Catlins, northof Te Waewae Bay up toTe Anau
Cool temperatures, lowsolar radiation, moderatevapour pressure deficits,low monthly waterbalance ratios, slightannual water deficits
Easy rolling hills
Well-drained soils ofmoderate fertility fromtuffaceous greywacke,Tertiary mudstones andgravels and andesite
a. imperfectly drainedb. weakly induratedc. much cooler
temperaturesd. very gently undulating
hills
Q4.2
464,636 ha
215 m
Around Invercargill,east of Lake Te Anauand valleys in theCatlins
Cool temperatures, lowsolar radiation,moderate vapourpressure deficits, lowmonthly water balanceratios, slight annualwater deficits
Gently undulating hills
Well-drained soils ofmoderate fertility fromloess and alluvium fromtuffaceous greywacke
a. cooler temperatures,high fertility
b. warmer wintertemperatures, highfertility
c. warmer annualtemperatures, flatterrain, imperfectlydrained, high fertility
Q4.3
354,804 ha
330 m
Eastern Otago includingthe Otago Peninsula
Cool temperatures, lowsolar radiation, moderatevapour pressure deficits,very low monthly waterbalance ratios, lowannual water deficits
Rolling hills
Imperfectly drained soilsof moderate fertilityfrom schist and quartzgravels
a. lower annual waterdeficits
b. much higher annualwater deficits, stronglyrolling hills
c. warmer temperatures,low fertility
d. much warmertemperatures, stronglyrolling hills, well-drained

193
The LENZ Environments
Environment R extends along the main divide of the South Island from the SpencerMountains of inland Nelson south along the Southern Alps to the Fiordland Mountains.It also includes small areas on the crests of ranges both to the east and west of the maindivide. The climate of Environment R is cold with amongst the lowest temperatures ofany Level I land environments, reflecting its average elevation of nearly 1100 m. Thishigh elevation, coupled with its exposure to rain-bearing westerly winds, results in lowsolar radiation, very low water and vapour pressure deficits and very high monthly waterbalance ratios. Average slopes are steeper in Environment R than in any other Level Iland environment, with mountain landforms predominating. Dominant soil parentmaterials in Environment R are granite, greywacke and schist with smaller areas of oldervolcanic rocks and gneiss. Soils vary in character depending on the parent material butare generally very thin (skeletal) and sometimes peaty.
R - Southern Alps

194
The LENZ Environments
DENDROGRAM OF R

195
The LENZ Environments
Envi
ronm
ent
Are
a (ha
)
Alti
tude
(m)
Mea
n an
nual
tem
pera
ture
(ºC
)
Mea
n m
inim
um te
mpe
ratu
re o
f the
cold
est m
onth
(ºC
)
Mea
n an
nual
sola
r rad
iatio
n (M
J/m2 /d
ay)
Mea
n w
inte
r sol
ar ra
diat
ion
(MJ/m
2 /day
)
Oct
ober
vap
our p
ress
ure d
efic
it (k
Pa)
Mon
thly
wat
er b
alan
ce ra
tio (r
atio
)
Mea
n an
nual
wat
er d
efic
it (m
m)
Slop
e (º)
Dra
inag
e (1=
very
poo
r to
5=go
od)
Aci
d so
lubl
e pho
spho
rus (
1=v.
low
to 5
=v. h
igh)
Exch
ange
able
calc
ium
(1=l
ow to
5=v
. hig
h)
Parti
cle s
ize (
1=cl
ay/si
lt to
5=b
ould
ers–
mas
sive)
Indu
ratio
n (1
=non
-indu
rate
d to
5=v
. stro
ngly
ind.
)
Soil
Age
(1=r
aw/re
cent
, 2=o
lder
)
Che
mic
al li
mita
tions
(1=l
ow, 2
=sal
ine,
3=u
ltram
afic
)
R1
974,4
62
1343 5.1 -3.2
13.0 4.0 0.1 15.1 0.0 31.2 4.8 3.0 1.6 4.0 4.0 2.0 1.0
R2
956,3
44 777 6.5 -0.7
12.1 3.1 0.1 14.3 0.0 30.9 3.5 1.3 1.0 5.0 4.9 2.0 1.0

196
The LENZ Environments
Environment R1Environment R1 encompasses the Southern Alps north of Fiordland, stretching from
Nelson Lakes National Park in the north to the Livingstone Mountains west of LakeWakatipu in the south. It also occurs sporadically on the Paparoa and Victoria Ranges.The climate of this environment is cold, reflecting its very high average elevation. Solarradiation is moderate, with very low vapour pressure deficits and very high monthlywater balance ratios. The degree of soil development in R1 is highly variable and thosesoils that do occur are rocky, well-drained and of low fertility. The parent materials ofR1 are mainly schist and greywacke rocks and derived colluvium.
Level III & IV Descriptions
Level III
Area
Elevation
Location
Climate
Landform
Soils
Level IV
R1.1
649,852 ha
1320 m
Southeastern and northwestern parts ofthe Southern Alps
Cold temperatures, moderate solarradiation, very low vapour pressuredeficits, very high monthly waterbalance ratios, no annual water deficits
Steep mountains
Well-drained soils of moderate fertilityfrom schist and greywacke
a. much warmer temperatures, highervapour pressure deficits, much lowermonthly water balance ratios
b. much cooler temperatures, lowervapour pressure deficits, much lowermonthly water balance ratios
c. much cooler temperatures, highermonthly water balance ratios
d. cooler winter temperatures, muchhigher monthly water balance ratios
e. much warmer temperatures, muchhigher monthly water balance ratios
R1.2
346,180 ha
1415 m
Western parts of the Southern Alpsfrom Hokitika south
Very cold temperatures, low solarradiation, very low vapour pressuredeficits, very high monthly waterbalance ratios, no annual water deficits
Steep mountains
Well-drained soils of moderate fertilityfrom schist
a. much lower temperatures, muchhigher monthly water balance ratios
b. warmer annual temperatures

197
The LENZ Environments
Level III
Area
Elevation
Location
Climate
Landform
Soils
Level IV
Environment R2Environment R2 is restricted to the Fiordland mountains. R2 is warmer then R1
reflecting its lower elevation. R2 has low solar radiation, very low vapour pressuredeficits and very high monthly water balance ratios. Environment R2 has more extensivesoil development than Environment R1 with imperfectly drained soils of poor fertility.Parent materials are predominatly hard granite with some areas of old basalt and gneiss.
Level III & IV Descriptions
R2.1
405,048 ha
1110 m
Higher elevation and eastern parts ofFiordland
Cold temperatures, low solar radiation,very low vapour pressure deficits, veryhigh monthly water balance ratios, noannual water deficits
Steep mountains
Imperfectly drained soils of low fertilityfrom granite and basalt
a. much warmer temperatures, muchhigher monthly water balance ratios,high fertility
b. cooler temperatures, much highermonthly water balance ratios, verysteep mountainous terrain, well-drained, very low fertility
c. very low fertilityd. cooler winter temperatures, much
lower monthly water balance ratios,moderate fertility
e. warmer temperatures, higher vapourpressure deficits, much lowermonthly water balance ratios, verylow fertility
f. higher vapour pressure deficits, muchlower monthly water balance ratios,well-drained
R2.2
551,484 ha
530 m
Lower elevation and western parts ofFiordland
Cool temperatures, low solar radiation,very low vapour pressure deficits, veryhigh monthly water balance ratios, noannual water deficits
Steep mountains
Imperfectly drained soils of very lowfertility from granite, older basalt andgneiss
a. cooler annual temperatures , highermonthly water balance ratios
b. much warmer temperatures, highervapour pressure deficits, lowermonthly water balance ratios
c. cooler winter temperatures, highervapour pressure deficits, much lowermonthly water balance ratios, lowfertility

198
The LENZ Environments
Environment S with its highly distinctive ultramafic rocks occurs in several locationsscattered through the western South Island, mainly in Nelson, Marlborough, SouthWestland, and inland Southland. The only other area of ultramafic rocks in NewZealand occurs near North Cape and is included in Environment A1.
The defining feature of Environment S is its ultramafic parent material, i.e. igneousrock, generally coarse grained, low in silica, and with unusually high concentrations ofiron and magnesium minerals. Soils formed on these rocks are generally of very lowfertility with concentrations of minerals such as nickel and magnesium that are toxic toplants. They also tend to be shallow and have low amounts of clay-size particles andorganic matter, resulting in low water and nutrient holding capacity but good drainage.The climate of Environment S is cold, with high monthly water balance ratios and onlyslight water deficits, reflecting its mean elevation of around 900 metres. Solar radiationis moderate and vapour pressure deficits are low. Landforms are generally steep andmountainous.
S - Ultramafic Soils

199
The LENZ Environments
DENDROGRAM OF S

200
The LENZ Environments
Envi
ronm
ent
Are
a (ha
)
Alti
tude
(m)
Mea
n an
nual
tem
pera
ture
(ºC
)
Mea
n m
inim
um te
mpe
ratu
re o
f the
cold
est m
onth
(ºC
)
Mea
n an
nual
sola
r rad
iatio
n (M
J/m2 /d
ay)
Mea
n w
inte
r sol
ar ra
diat
ion
(MJ/m
2 /day
)
Oct
ober
vap
our p
ress
ure d
efic
it (k
Pa)
Mon
thly
wat
er b
alan
ce ra
tio (r
atio
)
Mea
n an
nual
wat
er d
efic
it (m
m)
Slop
e (º)
Dra
inag
e (1=
very
poo
r to
5=go
od)
Aci
d so
lubl
e pho
spho
rus (
1=v.
low
to 5
=v. h
igh)
Exch
ange
able
calc
ium
(1=l
ow to
5=v
. hig
h)
Parti
cle s
ize (
1=cl
ay/si
lt to
5=b
ould
ers–
mas
sive)
Indu
ratio
n (1
=non
-indu
rate
d to
5=v
. stro
ngly
ind.
)
Soil
Age
(1=r
aw/re
cent
, 2=o
lder
)
Che
mic
al li
mita
tions
(1=l
ow, 2
=sal
ine,
3=u
ltram
afic
)
S1 3778 390
10.6 2.1 14.8 4.7 0.3 3.6 15.6
16.1 5.0 1.0 1.0 5.0 4.0 2.0 3.0
S2
16,98
9
1120 6.3 -3.2
14.2 4.3 0.2 5.0 0.0 22.3 5.0 1.0 1.0 5.0 4.0 2.0 3.0
S3
12,75
2
797 7.2 -0.7
12.4 3.6 0.1 17.0 0.0 23.9 5.0 1.0 1.0 5.0 4.0 2.0 3.0

201
The LENZ Environments
Level III¨
Area¨
Elevation¨
Location¨
Climate¨
Landform¨
Soils̈
Level IV¨
Environment S1Environment S1 occurs as small patches throughout Nelson and Marlborough: just
east of Nelson city, on D’Urville Island, on the Bryant Range and on the lower flanks ofthe Red Hills. The climate of this environment is mild, with high solar radiation,moderate vapour pressure deficits, low monthly water balance ratios and slight annualwater deficits. Ultrabasic and extremely basic igneous rocks are the sole parent material,with soils having higher levels of elements such as nickel and magnesium that inhibit thegrowth of plants. Soils are well-drained and of very low natural fertility.
Level III & IV Descriptions
S1.1 – No Subdivision at Level III
3756 ha
385 m
Nelson and Marlborough – just east of Nelson city, D’Urville Island, BryantRange, lower flanks of the Red Hills
Mild temperatures, high solar radiation, moderate vapour pressure deficits, lowmonthly water balance ratios and slight annual water deficits
Strongly rolling hills
Patchy, well-drained soils of very low natural fertility from ultrabasic andextremely basic igneous rocks. High levels of nickel and magnesium
a. much warmer temperaturesb. much cooler temperatures

202
The LENZ Environments
Environment S2Environment S2 occurs in three distinct locations: the inland Red Hills of
Marlborough, the Lockett Range of west Nelson and near the Livingstone Fault inwestern Southland. Climatically this environment is cold, with high levels of solarradiation, low vapour pressure deficits, intermediate monthly water balance ratios andno annual water deficits. As in the other S environments, parent materials consist ofsolely ultrabasic and extremely basic igneous rocks with soils that are well-drained and ofvery low natural fertility.
Level III & IV Descriptions
Level III
Area
Elevation
Location
Climate
Landform
Soils
Level IV
S2.2
4840 ha
990 m
Lockett Range and along theLivingstone Fault
Cold temperatures, low solarradiation, low vapour pressure deficits,intermediate monthly water balanceratios, no annual water deficits
Steep hills
Patchy, well-drained soils of very lownatural fertility from ultrabasic andextremely basic igneous rocks
a. – no subdivision at Level IV – sameas S2.2
S2.1
12,144 ha
1170 m
Inland Red Hills around Marlborough
Cold temperatures, high solarradiation, low vapour pressure deficits,intermediate monthly water balanceratios, no annual water deficits
Steep hills
Patchy, well-drained soils of very lownatural fertility from ultrabasic andextremely basic igneous rocks
a. – no subdivision at Level IV – sameas S2.1

203
The LENZ Environments
Level III
Area
Elevation
Location
Climate
Landform
Soils
Level IV
Environment S3Environment S3 encompasses areas of ultramafic rocks near the Livingstone Fault, in
the northern Fiordland mountains, near the Cascade River in the Olivine Range, and theadjacent Red Mountain on the Red Hills Range. Small areas also occur from MilfordSound to Sutherland Sound. Climatically this environment is cold, with low solarradiation, very low vapour pressure deficits, very high monthly water balance ratios andno annual water deficits. The sole parent material is ultrabasic and extremely basicigneous rocks. Soil development is patchy and those that do occur are well-drained, withvery low natural fertility.
Level III & IV Descriptions
S3.1 – No Subdivision at Level III
12,784 ha
805 m
Northern Fiordland mountains near Milford Sound, the Cascade River in theOlivine Range and the adjacent Red Mountain on the Red Hills Range
Cold temperatures, low solar radiation, very low vapour pressure deficits, veryhigh monthly water balance ratios and no annual water deficits
Steep hills
Patchy, well-drained soils of very low natural fertility from ultrabasic andextremely basic igneous rocks
a. much warmer temperatures, lower elevationsb. much cooler temperatures, higher elevations

204
The LENZ Environments
Environment T consists of the ice caps and permanent snowfields of the SouthernAlps. Although it has the highest mean elevation (1800 m) of any Level I landenvironment, it includes features such as the Franz and Fox glaciers, which extend tolower elevations. The climate is typified by very cold temperatures, very highprecipitation, much of it as snow, very low vapour pressure deficits and low levels ofannual and winter solar radiation, particularly in the south. Slopes vary from undulatingto very steep. No subdivision of Environment T has been made beyond Level I.
T - Permanent Snow and Ice

205
The LENZ Environments
DENDROGRAM OF T
DENDROGRAM NOT REQUIREDNO SUBDIVISION BEYOND LEVEL I

206
The LENZ Environments
Envi
ronm
ent
Are
a (ha
)
Alti
tude
(m)
Mea
n an
nual
tem
pera
ture
(ºC
)
Mea
n m
inim
um te
mpe
ratu
re o
f the
cold
est m
onth
(ºC
)
Mea
n an
nual
sola
r rad
iatio
n (M
J/m2 /d
ay)
Mea
n w
inte
r sol
ar ra
diat
ion
(MJ/m
2 /day
)
Oct
ober
vap
our p
ress
ure d
efic
it (k
Pa)
Mon
thly
wat
er b
alan
ce ra
tio (r
atio
)
Mea
n an
nual
wat
er d
efic
it (m
m)
Slop
e (º)
Dra
inag
e (1=
very
poo
r to
5=go
od)
Aci
d so
lubl
e pho
spho
rus (
1=v.
low
to 5
=v. h
igh)
Exch
ange
able
calc
ium
(1=l
ow to
5=v
. hig
h)
Parti
cle s
ize (
1=cl
ay/si
lt to
5=b
ould
ers–
mas
sive)
Indu
ratio
n (1
=non
-indu
rate
d to
5=v
. stro
ngly
ind.
)
Soil
Age
(1=r
aw/re
cent
, 2=o
lder
)
Che
mic
al li
mita
tions
(1=l
ow, 2
=sal
ine,
3=u
ltram
afic
)
T1
157,0
15
1855 2.5 -4
.4
12.8 4.0 0.0 21.8 0.0 26.6 0.0 0.0 0.0 0.0 0.0 0.0 0.0

207
The LENZ Environments
Level III¨
Area¨
Elevation¨
Location¨
Climate¨
Landform¨
Soils̈
Level IV¨
Environment T1Environment T1 is a large environment that includes all the permanent ice and snow
peaks of the Southern Alps. The climate is very cold, with low solar radiation, very lowvapour pressure deficits, very high monthly water balance ratios and no annual waterdeficits.
Level III & IV Descriptions
T1.1 – No Subdivision at Level III
148,005 ha
1780 m
Peaks of the Southern Alps with permanent ice cover
Very cold temperatures, low solar radiation, very low vapour pressure deficits,very high monthly water balance ratios, no annual water deficits
Steep ice nevees and glaciers
Not applicable
a. – no subdivision at Level IV – same as T1.1
208
Using LENZ
CHAPTER FIVEUsing LENZINTRODUCTION
This chapter provides general guidelines for use of LENZ and technical details ofthe methods used in the case studies presented in Chapter Five of LandEnvironments of New Zealand. Guidelines for the use of LENZ include
discussion of both conceptual issues related to the relationship between LENZenvironments and ecosystems, and more practical questions related to the use of LENZas a management tool. Our presentation of the case studies is designed to complementthat in Land Environments of New Zealand, which focuses primarily on rationales andresults. Here we concentrate more on the data used for each case study and how theanalyses were carried out. Each case study is described using a one-page summary of theinput data, followed by an outline of the key steps used in the analysis and descriptions ofthe resulting outputs, together forming a ‘how-to’ guide that will help users adapt LENZto their particular needs.
GUIDELINES FOR APPLYING LENZ
Conceptual issues – the dynamic nature of ecosystemsAs discussed in Chapter One of Land Environments of New Zealand, ecosystems are
typified by dynamic relationships between species (biotic) and their environment(abiotic). Predicting the ecosystem character at any site is complicated by the manner inwhich these components change at different rates over time. Abiotic components such asaverage climate conditions tend to change more slowly over broad time scales than bioticcomponents. The latter may show much greater short-term variability, reflecting theeffects of different types of disturbance such as storms, landslides, fires, etc. By focusingon the more stable abiotic ecosystem components as a basis for classification, LENZprovides a framework to characterise the broad potential biological conditions at a site.For example, when used in combination with knowledge from historic sources1 and/orsurviving indigenous ecosystems, it provides a powerful tool that allows reconstruction ofNew Zealand’s general pre-human or potential ecosystem character, includingenvironments where only a few small fragments of native vegetation now survive.
When combined with information describing local disturbance history and its effects,the predictive ability of LENZ can be extended to provide a more detailed picture ofactual biological character. However, little data are available describing geographicvariation in disturbance regimes across New Zealand, reflecting the difficulty inmeasuring events that vary markedly in their extent, frequency and patchiness ofoccurrence. For example, volcanic eruptions may drastically affect vast areas and altervegetation composition so that the changes may still be discernable centuries after theevent.2 By contrast, although local tree falls caused by a gale or heavy snowfall may

209
Using LENZ
individually affect only a few or perhaps tens of square metres, in aggregate they mayfavour a shift in vegetation composition at a landscape scale towards tree species withfaster growing but more light demanding seedlings3 or trigger a cascade of eventsleading to widespread forest decline4 . Alternatively, landslides induced by an earthquakemay initiate primary successions that, while of only limited extent, allow the persistenceof pioneering species in a landscape otherwise dominated by species characteristic ofstable growing conditions.
The dynamic nature of New Zealand’s ecosystems, in common with those in mostother parts of the world, is further accentuated by disturbance related to human activity.This includes both the clearance of former native land cover and the introduction of newspecies. A major period of modification of New Zealand’s vegetation by fire began withthe arrival of Maori, with the most extensive changes occurring in dry climates,particularly those with flat terrain that facilitated the spread of fire.5 European settlerscontinued clearing and modifying native vegetation and also introduced large numbersof alien species that included competitors,6 browsers,7 and predators.8 Some wereintroduced deliberately as a source of food or fibre (e.g., many agricultural andhorticultural species, goats, pigs, possums, and rabbits), while others were introduced forsport (e.g., several species of deer, chamois, thar, pheasants and trout) or to controlpreviously introduced species (e.g., mustelids introduced to control rabbits). Otherintroductions were accidental, such as rats brought by boat or weeds transported withgrain seed.9
Finally, while LENZ does not explicitly consider the local disturbance regimes ofindigenous ecosystems, in many cases the underlying data layers indicate the broadcharacter of natural physical disturbances prevailing in particular landscapes. Forexample, data describing soil parent materials indirectly delineate that part of the centralNorth Island that is periodically affected by devastating volcanic eruptions. Similarly,environments along the Southern Alps that are subject to frequent landslides areidentified by their combination of very high rainfall, steep slopes and hard but shatteredparent rock. In many of these disturbance-prone environments existing process-orientedstudies10 indicate the relationship between disturbance and local scale variation inecosystem character.
Conceptual issues – the biological scope of LENZAlthough the underlying variables used to define LENZ were chosen because of their
relevance to the physiological processes of trees as outlined in Chapter Two of LandEnvironments of New Zealand, we also expect them to summarise geographic patternsadequately for many other species groups. However, although variables such astemperature are likely to have strong mechanistic links with practically all biota, othervariables used in defining LENZ may be important for only some groups of species. Forexample, variation in vapour pressure deficits would most likely affect plant distributionsbut would be less likely to be useful for predicting assemblages of soil invertebrates.Where LENZ applications are developed for species groups that are relatively insensitive

210
Using LENZ
to one or more such variables, it may be sensible to amalgamate environments that differonly in less relevant variables.
The degree to which LENZ can predict individual species distributions also requiresclarification. The classification is designed to indicate areas having similar ecosystemcharacter at a community level, with emphasis on functional groups rather than definingthe distributions of individual species. In this regard, LENZ contrasts with historic,species-oriented classifications of New Zealand’s land cover11 that define unitsgeographically, based on distributions of structurally dominant species. Correspondencebetween LENZ and species distributions are likely to be lowest for species with poordispersal ability, such as Nothofagus or beech species or our native snails, and where wewould expect correspondingly weaker sorting in relation to environment than in specieswith strong dispersal ability. As already indicated above, where weakly dispersing speciesplay a dominant role in determining ecosystem structure, inclusion of data layersdescribing their distributions will be required to adequately predict ecosystemcharacter.12
Analytical issues – environmental versus geographic classificationThe most fundamental difference between LENZ and traditional land classifications
such as New Zealand’s Ecological Regions and Districts13 revolves around theirrespective treatment of geographic and environmental space. In the latter, theclassification units form discrete units in geographic space but, as a consequence, theyvary widely in their within-unit environmental variability. By contrast, LENZ definesdiscrete and relatively uniform areas in environmental space but many of these showwide geographic dispersion. Although some may form one or two discrete geographicpatches, many occur as small patches, often scattered over a considerable area. In thisregard, LENZ represents more accurately the true character of environmental variationacross New Zealand’s landscapes.
In practical terms, physically locating all the scattered patches of a LENZenvironment in the field may present a challenge, although the increasing availability ofhand held geographic positioning devices (GPS) considerably reduces this difficulty. Forsome applications, users may set a minimum threshold area below which they mergepatches of one environment with a surrounding more extensive environment. However,small, isolated patches of environments may have considerable value, for example, inidentifying potential locations for rare or threatened species that have specificenvironmental requirements.
Analytical issues – limitations of scale
Geographic ScaleOne of the most important factors affecting the ability of LENZ to predict biological
components of ecosystems is the geographic scale limitations of the underlying datalayers. In general, as the scale of application becomes progressively finer, the limitationsof the underlying data layers will become progressively more important. Moreover, these

211
Using LENZ
vary from layer to layer, reflecting differences in both the manner in which the differentlayers were created and how they vary across New Zealand’s landscapes. The sevenclimate variables generally show continuous variation, with changes in solar radiationand rainfall occurring at broad geographic scales mostly reflecting variation in latitudeand exposure to westerly winds. By contrast, temperatures decline at only a moderaterate with increasing latitude but show strong and consistent variation in relation toaltitude at more intermediate to local scales. As a consequence, when working at finespatial scales involving distances of less than a few hundred metres, geographic variationin climate is likely to be muted except in steep terrain. However, much more markedlocal-scale variation is shown by landform and soil variables, often in association withabrupt changes in topographic position or parent material. Data describing theseattributes were derived from the New Zealand Land Resource Inventory, stored at anominal scale of 1:50 000, and this effectively sets the finest scales at which LENZ shouldbe used.
For work at finer spatial scales, improvements in LENZ’s resolution could be gainedthrough use of a layer describing topographic position, as this would allow muchimproved differentiation of local variation in factors such as drainage, nutrient supplyand minimum temperatures during inversion frosts. However, processing nationalcoverage digital elevation data with high enough resolution to define a suitabledescriptive data layer to include in LENZ is beyond our current capacity. Use ofestablished methods to correct our flat surface estimates of solar radiation to account forthe effects of slope and aspect14 is more feasible and would allow estimation of local scalevariation in water deficits that in dry climates typically increase with progression fromsouth to north facing slopes.
Temporal scale limitationsAs described in Chapter Two, most of the underlying data used to define LENZ’s
climate layers were collected over the period from 1950 to 1980, while soil data werecollected over approximately the last 40 years. LENZ therefore represents one snapshotin time of New Zealand’s environment that, although relatively stable in terms of humanlife spans, has been typified by major, ongoing changes in geological time15 . We expectthat applications of LENZ within contemporary New Zealand are unlikely to raisemajor discrepancies between recorded and actual conditions, given the relatively limitedeffects of global warming to date. However, there is considerable uncertainty over thelikely magnitude of changes in climate over the next decade or so, and use of more recentdata may be desirable here, particularly for climate-critical applications. Using LENZ asa framework for predicting ecosystem character back in time involves less uncertainty inthat variation, at least in temperature, has been reconstructed in some detail from varioussources.
Analytical issues – use of the classification versus use of underlying dataIn developing LENZ, one of our goals has been to make it easier for conservation and
resource managers to capitalise on the benefits to be gained from recent advances in

212
Using LENZ
information technology. In particular, our hope is that LENZ will encourage users toexplore the use of geographic information systems (GIS), reflecting our view that theseoffer much wider possibilities for problem solving than the relative static options offeredby conventional paper-based classifications.
As part of our promotion of these increasingly available tools such as desktop GIS, weare keen to promote the use not only of LENZ but also of its underlying data layers. Weanticipate that many LENZ applications in conservation and resource management willcentre on its use as a generic environment-based land classification that can provide acommon currency for description of land across a range of applications. Examples ofdirect LENZ applications are presented in the first three case studies described both inLand Environments of New Zealand and later in this chapter.
By contrast, we view the underlying data layers more as a toolbox that enables usersto produce custom analyses that can be used to identify sites having particularenvironmental attributes. For example, a scientist who has a particular interest in thesubalpine flora of limestone and marble substrates could perform a spatial query usingthe environmental data layers describing annual temperature and exchangeable calciumto identify sites that provide such habitat either nationally or regionally. A similar querymight be used by a conservation manager to identify the likely historic distribution oflowland wetland sites using the LENZ drainage data layer perhaps in conjunction withthe annual temperature and/or elevation layers. More complex examples of the use ofunderlying data layers are contained in the case studies and include calculation ofenvironmental distances as a measure of similarity both within New Zealand andglobally (restoration, biosecurity and crop suitability case studies), and use of a populationgrowth model for predicting geographic variation in climatic suitability for disease-carrying mosquitoes.
Analytical issues – use of other geographic dataThe increasing availability of geographic data in digital form provides a wide range
of opportunities for more extended applications in which additional data is used tosupplement LENZ’s underlying data layers. For example, in the first case study we refineour reconstruction of New Zealand’s likely pre-human vegetation patterns using a layerdescribing average daily temperatures of the warmest month to better define the upperaltitudinal limit of forest. We then compare our reconstructed vegetation pattern withNew Zealand’s current land cover as described in the Land Cover Database, a geographiclayer based on recent satellite imagery. This analysis could be further extended to assessthe adequacy of protection of indigenous vegetation for conservation using a digital layerdescribing the extent of land set aside for conservation purposes.
Similar uses of more extended climate layers are contained in our last three casestudies. In two of these analyses we use climate data drawn from a global databaseassembled for use by scientists assessing the likely impacts of global warming. In ourfourth case study we use these to compare Auckland’s climate with the rest of the globe,while in the sixth case study we compare the climate of the Bordeaux Region in Francewith that in the Wellington region. In both of these we also use growing degree day

213
Using LENZ
estimates that allow more robust comparison of the effects of temperature on plantgrowth and productivity. Finally, in assessing the suitability of New Zealand climates forthe southern saltmarsh mosquito, we use monthly temperature estimates to calculatelikely rates of population growth.
Although these examples focus on use of climate and land-cover descriptions, a widerange of other geographic data could be used with LENZ, including descriptions of landuse, data describing individual species distributions, census data, or layers describing thedistribution of cultural features such as roads, railway lines, high-voltage power lines, etc.The key requirements are that all layers share a common system of geographiccoordinates, typically the New Zealand Map Grid, and have both spatial resolution andpositional accuracy consistent with the scale used in the analysis.
Analytical issues – data representationIn contrast to the New Zealand Land Resource Inventory in which data are stored
within polygon-based layers, LENZ was developed exclusively from raster data. That is,data are stored in grids of fixed resolution with data values varying from grid cell to gridcell. This data format is more suited to storing information about factors that varycontinuously across a landscape, such as LENZ’s underlying climate layers. It alsofacilitated the classification process, providing us with discrete spatial units for whichdata could be extracted from the GIS and classified, with results returned to the GIS fordisplay. One disadvantage of raster storage, however, is that maps become aestheticallyunappealing where layers are shown at a scale where their inherent granularity becomesapparent.
All four LENZ classification levels are available at grid resolutions of either 100-m or25-m. Two factors require consideration when choosing which grid resolution to use.First, the 25-m resolution layers are capable of display at map scales as fine as 1: 50 000,whereas the 100-m resolution layers become excessively grainy at map scales finer than1: 250 000. The main drawback in using the finer resolution layers is their size, which isapproximately 16 times greater than for their 100-m resolution counterparts. As aconsequence, the finer resolution layers are much slower to display because substantiallylarger amounts of information have to be read into memory to display a map for a givengeographic area. As a general rule we recommend use of the lowest resolution layerconsistent with adequate display quality and anticipate that 100-m resolution layers willbe most used for classification Levels I and II, while 25-m resolution classification layerswill be required for many applications using Levels III and IV.
Conversion to vector representationUsers who have only limited access to raster analysis capability may be tempted to
convert LENZ from its raster representation into polygon-based layers. However, thisconversion is not recommended because the quality of the resulting line work will bestrongly influenced by the grid structure of the raster data, and this will compromisedisplay except at the coarsest display scales. If such conversion is unavoidable, priorprocessing of the classification layer with one or two passes of a majority filter wouldprobably be advisable before conversion, depending on the intended application. This

214
Using LENZ
would reclassify isolated cells having a value differing from surroundings cells, andwould substantially reduce the size and complexity of the resulting polygon file.
Analytical issues – defining a context when calculating statisticsIn keeping with the national context of both Land Environments of New Zealand and
this volume, all summaries of the underlying environmental attributes for differentenvironments are calculated using data from the whole of New Zealand. However, werecognise that many LENZ applications will operate within some more limited context,for example, a regional or district council jurisdiction or some other geographic unit suchas a research study area. In this case, use of summary statistics calculated within anational context may provide a misleading picture of environmental variation within thestudy area, particularly where it contains small pieces of otherwise extensiveenvironments. More locally relevant statistics are easily produced by clipping a relevantpiece(s) of a LENZ classification layer and calculating summaries for the underlying datalayers for each environment in the clipped area. However, it is important that relevantmetadata are also generated as part of this process to record clearly the geographiccontext within which these summaries were produced.

215
Using LENZ
IntroductionGovernment agencies involved with the management of New Zealand’s landscapes
require understanding of the changes in the extent of natural ecosystems that have takenplace since the arrival of humans. This requires comparison of New Zealand’s likely pre-human vegetation pattern with information describing the current extent of naturalvegetation. An historical reconstruction is therefore required if mangers are toadequately assess the magnitude of changes to New Zealand’s natural ecosystems and thesignificance of those remnants that remain .
MethodsCover classes from the Land Cover Database (LCDB)16 that correspond to indigenous
vegetation were used to reconstruct the likely pre-human vegetation to allow comparisonwith the present land cover. Each Level II environment was assigned a land-cover classcorresponding to the indigenous vegetation most likely to occur in that environment inthe absence of human influence (Table 5.1). Most Level II environments originallysupported indigenous forest and were assigned that cover class. Environments havingpeat soils, poor drainage and/or saline soils were assigned wetland cover classes, whilerecent sand dune soils and areas of ultramafic soils were assigned tussock and scrub coverclasses, respectively. Those environments having very dry climates (N4–N6, N8) wereassigned a land cover of scrub.
These initial land-cover assignments were refined further using an additional climatelayer describing mean daily temperatures in the warmest month to define the upper
Objective To estimate the extent of indigenous ecosystem loss across New Zealand.
Approach Compare a LENZ-based reconstruction of New Zealand’s likely pre-humanvegetation cover with current land cover to determine percentage loss ofindigenous ecosystems by Level II environment.
Assumptions Land-cover classes can be used to describe the extent of indigenousecosystems.
Inputs LENZ Level II classification (raster GIS coverage)New Zealand Land Cover Database (LCDB) (converted from polygon toraster GIS coverage).
Methods 1. Assign likely pre-human land cover to LENZ Level IIenvironments;
2. Analyse changes in the extent of indigenous land cover bycomparing likely pre-human cover with current land cover byenvironment.
Outputs Raster GIS coverage describing % loss of indigenous land cover by LENZLevel II environment.
CASE STUDY ONE — LOSS OF INDIGENOUS ECOSYSTEMS

216
Using LENZ
Figure 5.1: Areas of New Zealand with a mean daily temperature in February less than a) 11°C, b) 8.5°C
a)
b)
altitudinal limit of forest cover or treeline. Based on studies of the correlation betweensummer temperatures and treeline, areas with mean daily temperatures in February ofless then 11°C (Fig. 5.1) were assigned a land cover of scrub/tussock. The upper elevationlimit for scrub/tussock was defined as corresponding with a mean daily temperature inFebruary of 8.5°C, typically occurring at elevations approximately 500 m higher than thetreeline. Sites with temperatures cooler than 8.5°C were assigned a dominant land coverof bare ground.

217
Using LENZ
Table 5.1: Summary of final land-cover assignments to Level II environments. Numbers withoutbrackets show the predominant land cover for each Level II environment. Bracketednumbers indicate where the land cover allocated to part of an environment wassubsequently re-classified because of, for example, the presence of peat (allocated towetlands), or because summer temperatures were below 11 ºC (scrub/tussock) or8.5 ºC (bare ground)
Forest Scrub/tussockInland
wetlandsCoastal
wetlands Coastal dunes Bare ground
A 1–7 (2)
B 1–9
C 1–3 (1)
D 1–4
E 1–3 (1, 2), 4
F 1–7 (7)
G 3 4 5 1 2
H 1–4
I 2, 5 3, 4 1, 6
J 1–4
K 1–3 4, 5
L 1, 2, 4, 5 3 6
M 1, 2, 4 3
N 1–3 4–6, 8 7 (4)
O 1, 2, 4, 5 (1, 2, 4, 5) 3
P 1–8 (1–8) (1, 2, 4)
Q 1–4 (1–4) (1, 3)
R 1–2 (1, 2) (1, 2)
S 1–3
T 1

218
Using LENZ
Present land cover and estimation of indigenous vegetation lossThe polygon-format Land Cover Database was first converted into a raster format
data layer at the same grid resolution as the reconstructed pre-human vegetation cover,i.e. 100 m. Both the predicted pre-human and current land-cover grids were thenoverlaid on the LENZ Level II environment layer to calculate areas of pre-human andsurviving indigenous vegetation in each Level II environment. Results were thenimported into a spreadsheet and percentage changes in indigenous vegetation coverwere calculated for each environment. The estimated percent loss of indigenous landcover was then mapped by level II environment (Fig. 5.2).
Figure 5.2: Estimated percent loss of indigenous vegetation cover since human settlement byLevel II environment.

219
Using LENZ
CASE STUDY TWO — LOSS AND FRAGMENTATION OFECOSYSTEMS
Objective To analyse forest loss and fragmentation as an indicator of indigenousbiodiversity status in the Tasman District.
Approach Use LENZ environments as framework for assessment of indigenous forestfragmentation.
Assumptions Land cover can be used to describe the extent of indigenous ecosystems.
Inputs LENZ Level I (raster GIS coverage)New Zealand Land Cover Database (converted from polygon to raster GIScoverage).
Methods 1. Estimate forest patch sizes, inter-patch distances, and edge to core ratiosfor pre-human and current land cover;
2. Compare pre-human and current forest patch statistics to assess changessince human settlement.
Outputs Statistics describing changes in the extent and fragmentation of indigenousforest cover by environment, including mean and maximum patch sizes,mean inter-patch distances and edge to core ratios.
Secondary Examine the potential of non-forest land cover classes to reduce the impactsof forest fragmentation.
IntroductionIn this case study LENZ is used as a geographic framework within which to develop
indicators of the state of biodiversity at a regional scale. Here it performs an importantrole by dividing a landscape into units likely to have similar ecosystem character,regardless of their geographic location.
MethodsThis analysis required the assembly of three data layers: LENZ Level I, the
reconstructed pre-human land cover from the first case study, and a polygon version ofthe Land Cover Database (LCDB). All data layers were clipped to the geographic extentof the Tasman District (Fig. 5.3).

220
Using LENZ
a) b)
Figure 5.3: Forest distribution in the Tasman District: a) reconstructed pre-human forestextent; b) current forest extent as recorded in the Land Cover Database.
Calculation of forest extent and patch sizeTo calculate maximum forest patch sizes by environment we separately clipped the
LENZ Level I classification layer to both our reconstructed forest layer from Case StudyOne and the current extent of forest as recorded in the Land Cover Database. Both of theresulting layers were then converted into polygon layers in ArcView during which eachcontiguous block of cells having the same environment label was formed into a polygonwith a unique numeric identifier (Fig. 5.4). We then used X-tools, a freeware ArcViewextension,17 to add information to both polygon layers describing the area of eachpolygon. The data tables associated with the two polygon themes were then exported to aspreadsheet where the polygon area data for each environment were summarised.
Figure 5.4: Forest areas on the west Neslon coast subdividedby LENZ Level I environment.

221
Using LENZ
Calculation of edge to core ratiosCalculating ratios of forest edge to forest core can provide valuable insight into the
effects of fragmentation on the long-term viability of surviving areas of native forest. Ingeneral, microclimates of forest margins are markedly different from those of extensiveforests, with elevated temperatures and much lower humidity reducing the regenerationof native species and encouraging invasion by weeds.
Edge to core ratios were calculated using the buffer wizard in ArcView, specifying a40-m buffer size, 18 with buffers restricted to the inside of polygons and results written toa new shape file. X-tools was then used to calculate the area of each buffer and, oncepolygon identifiers had been copied to the buffer layers, the data tables were exported toa spreadsheet where buffer to core ratios were calculated for each polygon.
High ratios of edge to core habitat are associated either with small forest patches orwith larger patches where an irregular shape leads to a very large perimeter relative tothe total (Fig. 5.5). For example, a circular forest patch with a diameter of 80-m would allbe classified as edge habitat when using a 40-m buffer as a basis for calculation. A muchlarger forest remnant would have a low ratio of edge to core habitat if its shape iscircular, but a high edge to core ratio if it has an elongated shape, as is common forexample in many forest patches on riparian sites.
Figure 5.5: Forest patches showing the 40m internal buffer(light grey) and the area of core forest (in black)
Inter-Patch DistancesThe geographic or spatial arrangement of forest patches across a landscape can also
profoundly affect their long-term viability, with isolated patches often lacking mobilebird species. This in turn can alter forest dynamics through selectively affecting theability of different bird-dispersed plant species to colonise. These effects are furthercomplicated by the nature of the vegetation matrix within which surviving forest patchesare embedded. For example, forest fragments surrounded by pasture may be moreeffectively isolated from neighbouring forest patches than those fragments surroundedby scrub or exotic forest. As well as ameliorating the drier, warmer climatic conditions

222
Using LENZ
typical of open pasture, scrub and exotic forest are capable of providing at least some ofthe habitat requirements of many forest species, and facilitate movement of thoseunwilling to venture across open pasture.
Patch Analysis 2.2 extension for ArcView19 was used with three different vegetationpatch layers to calculate inter-patch distances, that is the minimum distance from eachforest fragment to its closest neighbour regardless of environment. Input data layers usedfor these calculations were derived from the Land Cover Database polygon coverage andcontained patches consisting of (1) indigenous forest alone, (2) indigenous forest andscrub, (3) indigenous forest, scrub, and exotic forest. Polygon layers for the latter two setsof calculations were derived using the generalisation function in ArcView. Where forestpatches were broken at environment boundaries, inter-patch distances were assigned avalue of zero. Finally, each set of inter-patch distances were summarised by environment.

223
Using LENZ
IntroductionPublic agencies and private organisations are showing increased interest in the
restoration of degraded ecosystems, usually with the aim of enhancing the biodiversity orconservation values of a site. One prerequisite for the successful implementation of theseprojects is a clear understanding of the restoration goals. Usually this requires knowledgeof the vegetation cover that would have been present before modification of the site byhuman activity, along with understanding of the natural sequence of vegetation changethat would lead to re-establishment of vegetation of similar character. Suitable locationsmust also be selected from which to collect material for the propagation of seedlings.While geographic criteria are often proposed for this process, environmental criteria arealso important to insure that ecotypes suited to the environment of the restoration site areselected.
In this case study we demonstrate the ability of LENZ to address such issues at threelevels. Firstly, the LENZ classification layers are used to indicate broad environmental
CASE STUDY THREE — RESTORATION OF A DEGRADED ECOSYSTEM
Objective To set realistic goals for the restoration of a degraded forest remnant.
Approach 1. Use LENZ and its underlying data layers to identify areas of intact forestin similar environments that can be used to assist in setting restorationgoals and as sites for seed collection;
2. Use underlying data layers in conjunction with regressions relating speciesdistributions to environment to predict potential forest composition.
Assumptions Similar environmental conditions are likely to support similar vegetation inthe absence of human interference.
Inputs 1. LENZ Level IV (raster GIS coverage);2. Underlying data layers (raster GIS coverage);3. Regressions relating underlying data layers to tree species distributions.
Methods 1. Use LENZ Level IV to identify parts of the surrounding landscape thatare in the same or closely related environments;
2. Use the underlying layers to provide a more refined analysis of similaritiesbetween the restoration site and the surrounding landscape;
3. Use average environmental conditions in conjunction with regressionsrelating tree species distributions to underlying environmental data layersto predict the abundance of tree species.
Outputs 1. Layer showing the distribution of Level IV environments in thesurrounding landscape, classified according to their similarity to theenvironment of the restoration site;
2. Layer showing continuous variation in environmental similarity betweenthe restoration site and the surrounding landscape.
3. Predicted forest composition for the restoration site.

224
Using LENZ
similarities between the restoration site and the surrounding landscape. Areas of similarenvironment can then be searched for intact forest remnants suitable for use as areference in setting restoration goals. A more refined analysis of environmentalsimilarities in the surrounding landscape can be achieved using the underlying datalayers to calculate a layer showing continuous variation in environmental distance fromthe restoration site. In our third and most complex analysis, we demonstrate use of theunderlying data layers in conjunction with regressions relating tree distribution toenvironment to predict the expected forest composition for the restoration site.
Methods
Restoration Sites and LENZThe hypothetical restoration site used in this case study is located in a steep gully on
the northern slopes of Mt Kaukau, north of Wellington City. Using the LENZ Level IVclassification layer, we mapped the distribution of both the environment in which therestoration site falls (F1.4c), and of other closely related Level IV environments, asidentified from the dendrogram for Environment F (see Chapter Four). The resultingmap (Fig. 5.6) can then be used in conjunction with land-cover data such as the LandCover Database or aerial photographs to identify intact forest remnants that could beused as a reference in setting restoration goals, and as sites for collection of material forpropagation.
In our second analysis, we selected a representative point at the restoration site andcalculated a layer that shows continuous variation in environmental distance from thispoint to all other points on the surrounding landscape. These distances were calculatedusing the Gower Metric distance measure, the same metric as used to define the LENZclassification (see box 5.1). The resulting data layer (Fig. 5.7) provides a continuousmeasure of environmental distance from the selected reference point, giving a moredetailed picture than the previous analysis in which distances are stepped because of theloss of information inherent in use of the LENZ classification.

225
Using LENZ
Figure 5.6: Level IV environments and theirsimilarity to the environment ofthe restoration site.
Figure 5.7: Environmental distances betweenthe restoration site and thesurrounding landscape.
In our third analysis we use regressions relating the distribution of major tree speciesto environment as fitted from an extensive set of plot data describing the composition ofNew Zealand’s forests.20 These were combined with estimates of the averageenvironmental conditions at the restoration site to predict the expected forestcomposition expressed as numbers of trees per hectare. Given the lack of consistent datadescribing the topographic position at the plots used to fit the regressions, thesepredictions do not take account of the topographic preferences of different species.However, inspection of nearby forested sites or expert knowledge could be used toidentify the specific planting sites required by the different species.
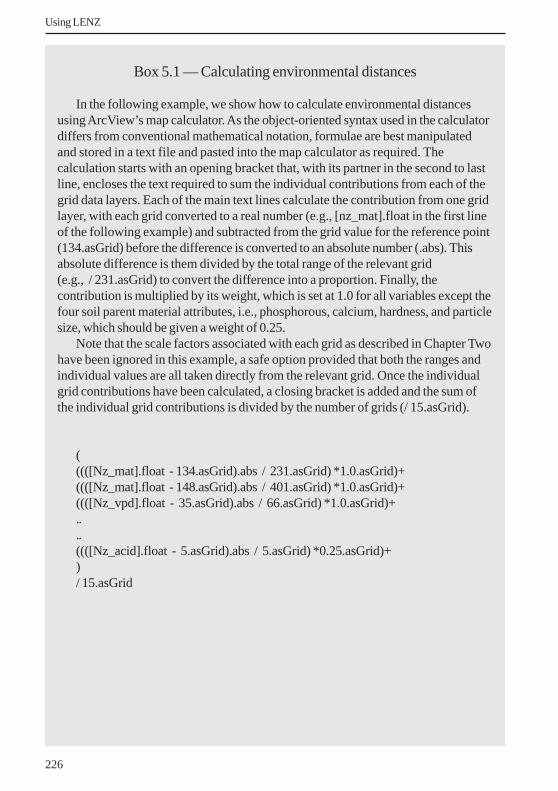
226
Using LENZ
Box 5.1 — Calculating environmental distances
In the following example, we show how to calculate environmental distancesusing ArcView’s map calculator. As the object-oriented syntax used in the calculatordiffers from conventional mathematical notation, formulae are best manipulatedand stored in a text file and pasted into the map calculator as required. Thecalculation starts with an opening bracket that, with its partner in the second to lastline, encloses the text required to sum the individual contributions from each of thegrid data layers. Each of the main text lines calculate the contribution from one gridlayer, with each grid converted to a real number (e.g., [nz_mat].float in the first lineof the following example) and subtracted from the grid value for the reference point(134.asGrid) before the difference is converted to an absolute number (.abs). Thisabsolute difference is them divided by the total range of the relevant grid(e.g., / 231.asGrid) to convert the difference into a proportion. Finally, thecontribution is multiplied by its weight, which is set at 1.0 for all variables except thefour soil parent material attributes, i.e., phosphorous, calcium, hardness, and particlesize, which should be given a weight of 0.25.
Note that the scale factors associated with each grid as described in Chapter Twohave been ignored in this example, a safe option provided that both the ranges andindividual values are all taken directly from the relevant grid. Once the individualgrid contributions have been calculated, a closing bracket is added and the sum ofthe individual grid contributions is divided by the number of grids (/ 15.asGrid).
(((([Nz_mat].float - 134.asGrid).abs / 231.asGrid) *1.0.asGrid)+((([Nz_mat].float - 148.asGrid).abs / 401.asGrid) *1.0.asGrid)+((([Nz_vpd].float - 35.asGrid).abs / 66.asGrid) *1.0.asGrid)+....((([Nz_acid].float - 5.asGrid).abs / 5.asGrid) *0.25.asGrid)+)/ 15.asGrid

227
Using LENZ
CASE STUDY FOUR — SETTING PRIORITIES FORINTERNATIONAL BIOSECURITYSCREENING
Objective To prevent harmful or undesirable organisms from entering New Zealand.
Approach Calculate environmental distances from a New Zealand port of entry to therest of the globe.
Assumptions The likelihood of alien organisms establishing in New Zealand increaseswith the environmental similarity between their place of origin and point ofentry.
Inputs 1. Climate data for the port of entry, i.e., Auckland, derived from theunderlying data layers;
2. Equivalent global climate data to that used to define LENZ (regular gridof points at a half-degree spacing).
Methods Calculate environmental distances from the port of entry to different globalenvironments.
Outputs Raster GIS coverage describing climatic similarity between Auckland and therest of the globe.
IntroductionNew Zealand’s border control authorities are charged with preventing the entry of
unwanted organisms into New Zealand. A number of factors are used to prioritise thesearching of cargo and baggage from vessels and aircraft coming from differentlocations. One factor that can contribute to this priority setting is knowledge of theenvironmental similarity between the place of origin of a vessel or aircraft and its point ofentry into New Zealand. In general, global environments that have a close similarity toNew Zealand environments are more likely to be a source of potential pest organismsthan those with markedly different environmental conditions. In this example wecompare the climate of Auckland International Airport with global climates, carryingout this analysis with data describing climates both annually and seasonally.
MethodsClimate data from the environment around Auckland International Airport were
derived from the underlying LENZ climate layers, while equivalent global climate datawere derived from a regular grid of points at a half-degree spacing, assembled for use instudies of likely global change impacts. Climatic differences between Auckland and therest of the globe were first calculated using the Gower Metric (see Box 5.1) with datadescribing average annual conditions (Fig. 5.8a). Distances were then calculated usingdata describing both the southern hemisphere spring (October — Fig. 5.8b), whenconditions between sites of equivalent latitude in the northern and southern hemispheres

228
Using LENZ
are least pronounced, and the southern hemisphere summer (January — Fig. 5.8c) whendifferences between the northern and southern hemisphere are at their maximum.
Use of growing degree day indicesIn making comparisons on a global scale use of mean annual temperature becomes
problematic because of the effects of site-to-site differences in seasonal temperatureranges. In particular, sites with the same mean annual temperature may vary markedlyin their summer temperatures and length of growing season. Such differences canprofoundly affect the relationship between mean annual temperature and plant growth.Use of growing degree day indices largely overcome this problem, as these sum thenumber of days when temperatures exceed some threshold required for growth,multiplied by the amount by which temperatures exceed that threshold. This indicatesthe thermal conditions at a site in a way that much more closely corresponds with likelyrates of crop growth, all other factors being equal.
More formally, the relationship between growing degree-days (GDD) andtemperature (T) is calculated by summing daily contributions through one year asfollows:
where Ti is the temperature on day i, and Tbase is the threshold temperature required forthe commencement of plant growth, assumed here to be 5ºC. The GDD index remainsunchanged where the daily temperature fails to reach the threshold temperature, but ondays where it is reached, it rises by the difference between the actual daily temperatureand threshold temperature. Temperatures were estimated for each day through the yearfrom monthly temperature estimates from a five-parameter multiple regression usingtrigonometric terms.21 The resulting regression fits a generalised curve to the 12 monthlytemperature estimates using trigonometric terms, allowing the average temperature to beestimated for any day through the year. While this gives only a small to moderateimprovement in precision in winter and summer when between-month temperaturedifferences are small, it gives a substantial improvement in spring and autumn whenchanges in temperature over time are more marked.
GDD = max(Ti – Tbase,0),i=1Ý365

229
Using LENZ
Figure 5.8: Climatic distances between Auckland and the rest of the globe calculated using a)annual climate statistics, b) climate statistics for January, and c) climate statistics forOctober.
a) Annual
b) January
c) October

230
Using LENZ
CASE STUDY FIVE — PREDICTING PEST DISTRIBUTIONSWITHIN NEW ZEALAND
Objective Develop surveillance priorities to monitor potential pest spread
Approach Combine knowledge of the environmental relations of pest species (thesouthern saltmarsh mosquito) with climate and soil variables to indicatepotential range.
Assumptions 1. A model that uses monthly temperatures to predict population growthpotential will indicate climatic suitability;
2. Soil drainage and salinity layers will identify suitable breeding habitat.
Inputs 1. Monthly estimates of mean daily temperatures (raster GIS coverages);2. Layers describing soil drainage and chemical limitations to plant growth
(raster GIS coverages);3. Population growth model for the southern saltmarsh mosquito.
Methods 1. Use population growth model with monthly temperature estimates toanalyse geographic variation in climatic suitability for the southernsaltmarsh mosquito;
2. Combine layer describing climatic suitability with layers identifyingpoorly drained and/or saline soils for locations of suitable breeding habitat.
Outputs Map showing climatic and soil suitability for breeding by the southernsaltmarsh mosquito.
IntroductionManaging invasive species once they have established in New Zealand is an
important responsibility for national, regional and local authorities. Monitoring the statusand predicting the potential spread of an invasive species is an essential component of anappropriate management programme. When combined with information about thedistribution of other factors contributing to risk, this enables the development ofsurveillance programmes to monitor both the long-term spread of a species and short-term population fluctuations that might pose a risk to human health.
Methods n the absence of specific information about the climatic relations of the southern
salt-marsh mosquito, we used a model (Table 5.1) describing the relationship betweenmonthly temperature and rates of population growth for the closely related Asian tigermosquito (Aedes albopictus). Population growth is assumed to be zero at temperaturesbelow 12ºC, increasing linearly with temperatures above this threshold untiltemperatures exceed 20ºC when population growth rates remain high but stable.

231
Using LENZ
Table 5.2: Details of the relationship between climate and the mosquito population growthindex
Average Monthly temperature Growth Index
< 12 °C 0
12–20 °C temperature – 11
> 20 °C 10
Twelve raster layers describing monthly mean daily temperatures were generatedfrom a mathematical surface fitted to monthly temperature data from approximately 300meteorological stations throughout out New Zealand. These were then used to calculatean annual population growth index22 for the southern salt marsh mosquito using themap calculator function of ArcView’s Spatial Analyst with the resulting growth indexcontained in a single output layer (Fig. 5.9).
The other key information required for predicting habitat suitability is theavailability of saline pools of water, which are most likely to be found in very poorly orpoorly drained estuarine sites. Such sites were identified using the LENZ drainage layerto identify very poorly drained and poorly drained soils and the LENZ layer describingchemical limitations to plant growth to identify saline soils. The intersection of these twolayers shows the extent of poorly drained saline soils likely to provide breeding habitatfor the southern saltmarsh mosquito.
Combining the two layers describing climatic and soil suitability with additional datadescribing the current distribution of the southern saltmarsh mosquito and thedistribution of major human population centres would allow the development of asurveillance plan to minimise impacts on humans.

232
Using LENZ
Figure 5.9: Climatic suitability for the southern saltmarsh mosquito

233
Using LENZ
CASE STUDY SIX — FINDING SITES SUITABLE FOR CROPS
Objective To identify areas in the southern North Island suitable for grapes.
Approach Use knowledge of the climate of a high-quality grape-growing region(Bordeaux, France) to identify new areas with similar climates.
Assumptions Macro-climatic parameters can be used to give a broad indication of climaticsuitability for grape growing.
Inputs 1. Description of climate from a known high-quality wine-producing region;
2. LENZ climate layers supplemented by a raster layer describing growingdegree days with a 5ºC threshold.
Methods Use climate layers to calculate climatic distances between the reference regionand the southern North Island.
Outputs A raster layer showing climatic suitability of southern North Island sites forwine production.
IntroductionAlthough developed primarily for biodiversity and environmental management
applications, LENZ can also be used for a range of other land management applications.This is because the factors that control indigenous biodiversity patterns also constrainhuman land uses such as agriculture, horticulture and forestry. In this case study wedemonstrate use of LENZ’s underlying data layers to identify sites having high climaticsimilarity to a known high-quality wine-producing region in France.
MethodsA broad description of the climate of the Bordeaux region in southern France was
taken from the global climate data set used in Case Study Four. In this case study, we alsosubstituted an index of growing degree days for estimates of mean annual temperature toenable more robust comparison with Bordeaux’s more seasonal climate. We then usedthe Gower Metric (see Box 5.1) to calculate climatic distances between Bordeaux and thesouthern North Island using the following climate layers: growing degree days, meanminimum temperature of the coldest month, mean solar radiation, winter solarradiation, annual water deficit, mean monthly water balance ratio, and spring vapourpressure deficit as measured in October (Wellington) or April (Bordeaux). The resultinggrid layer (Fig. 5.10) shows the proportional difference in climate between Bordeaux andthe southern North Island, averaged across these variables. Further refinement of thisanalysis could be achieved using climate variables more specifically relevant to particularcrops or cultivars. This might include information about the average length of the frost-free growing season, or year to year variation in rainfall as influenced by variation in the

234
Using LENZ
Figure 5.9: Climate similarities between the Bordeaux wine-growing region of France and the southern NorthIsland of New Zealand.
El Niño - Southern Oscillation or ENSO cycle, a large scale pattern of ocean atmospherecirculation variation across the Pacific Ocean that produces sometimes marked year toyear climatic variation across New Zealand.

235
Endnotes
ENDNOTES
Chapter Two: The underlying data layers1 Hutchinson, M.F., Gessler, P.E., 1994. Splines – more than just a smooth interpolator.
Geoderma 62: 45–67.2 Hutchinson, M.F. 2000. Anusplin Version 4.1 User Guide. Centre for Resource and
Environmental Studies, Australian National University, Canberra.3 New Zealand Meteorological Service, undated: Summaries of Climatological
Observations to 1980. New Zealand Meteorological Service Miscellaneous Publication 177;New Zealand Meteorological Service, undated: Temperature Normals for NewZealand 1951–1980. New Zealand Meteorological Service Miscellaneous Publication 183;New Zealand Meteorological Service, undated: Rainfall Normals for New Zealand1951–1980. New Zealand Meteorological Service Miscellaneous Publication 185.
4 Hutchinson, M.F., Booth, T.H., McMahon, J.P., Nix, H.A. 1984. Estimating monthlymean values of daily total solar radiation for Australia. Solar Energy 32: 277–290.
5 See Fitzpatrick, E.A., Nix, H.A. 1970. The climatic factor in Australian grasslandecology. In: Moore, R. M. ed. Australian Grasslands. ANU Press, Canberra. Chapter 1.
6 Goudriaan, J., van Laar, H.H.1994. Modelling crop growth. Kluwer, Amsterdam.7 See pages 109–112 of Jones, H.G. 1994. Plants and microclimate: a quantitative approach
to environmental plant physiology. 2nd. Edition. Cambridge University Press, Cambridge.8 See Leathwick, J.R., Whitehead, D., McLeod, M. 1996. Predicting changes in the
composition of New Zealand’s indigenous forests in response to global warming: amodeling approach. Environmental Software 11: 81–90.
9 For example, Leathwick, J.R.,Whitehead, D. 2001. Soil and atmospheric water deficitsand the distributions of New Zealand’s indigenous tree species. Functional Ecology15:233–242.
10 Ministry of Works 1974. Land use capability survey handbook: A New Zealand handbookfor the classification of land. Ministry of Works, Wellington; National Water and SoilConservation Organisation 1979. Our Land Resources. National Water and SoilConservation Organisation, Wellington.
11 Hewitt, A.E. 1998. New Zealand Soil Classification. 2nd edition. Landcare ResearchScience Series No.1. Manaaki Whenua Press, Lincoln.
12 See for example, the thematic issue Airborne magnetic and radiometric surveys.AGSO Journal of Australian Geology and Geophysics 17(2).
13 Taylor, N.H., Pohlen, I.J. 1970. Soil Survey Method. Soil Bureau Bulletin 25. NewZealand Soil Bureau, Wellington.
14 Hewitt, A.E. 1993. Methods and rationale of the New Zealand Soil Classification.Landcare Research Science Series No. 2. Landcare Research, Lincoln.

236
Endnotes
Chapter Three: Creation of LENZ1 Belbin, L. 1995. PATN Analysis Package. Distributed by Division of Sustainable
Ecosystems, CSIRO, Canberra.2 For example, Sneath, P.H.A., Sokal. R.R. 1973. Numerical Taxonomy. W. H. Freeman
and Company, San Francisco;Faith, D.P., Minchin, P.R., Belbin, L. 1987 Compositional dissimilarity as a robustmeasure of ecological distance: A theoretical model and computer simulations.Vegetatio 69: 57–68.
3 Gower, J.C. 1971. A general coefficient of similarity and some of its properties.Biometrics 27: 857–871.
4 Sneath & Sokal op.cit. reference 2.5 Belbin, L., Faith, D.P., Milligan, G.W., 1992. A comparison of two approaches to
β – flexible clustering. Multivariate Behavioural Research 27: 417–433.6 Sneath & Sokal op.cit. reference 2.7 Hargrove, W.W., Hoffman, F.M. 1999. Using multivariate clustering to characterize
ecoregion borders. Computers in Science and Engineering 1: 18–25.8 See, for example, Leathwick, J.R., Whitehead, D. 2001. Soil and atmospheric water
deficits, and the distributions of New Zealand’s indigenous tree species. FunctionalEcology 15: 233–242;Leathwick, J.R. 2001. New Zealand’s potential forest pattern as predicted from currentspecies:environment relationships. New Zealand Journal of Botany 39: 447–464.
9 Belbin, op. cit. reference 1.
Chapter Five: Using LENZ1 See for example, Stevens, G., McGlone, M.S., McCulloch, B. 1988. Prehistoric New
Zealand. Heinemann Reed, Auckland; Holdaway, R.N. 1989. New Zealand’s pre-human avifauna and its vulnerability. New Zealand Journal of Ecology 12 (Supplement):11–25.
2 See for example, McKelvey, P.J. 1963. The synecology of the West Taupo indigenousforest. New Zealand Forest Service Bulletin 14. New Zealand Forest Service,Wellington; Leathwick, J.R., Mitchell, N.D. 1992. Forest pattern, climate, andvolcanism in central North Island, New Zealand. Journal of Vegetation Science 3: 603–614.
3 Stewart, G.H., Rose, A.B. 1990. The significance of life history strategies in thedevelopmental history of mixed beech (Nothofagus) forests, New Zealand. Vegetatio 87:101–114.
4 Wardle, J. 1984. The New Zealand beeches: ecology, utilisation, and management. NewZealand Forest Service, Wellington.
5 McGlone, M.S. 1989. The Polynesian settlement of New Zealand in relation toenvironmental and biotic changes. New Zealand Journal of Ecology 12 (Supplement):115–129.

237
Endnotes
6 See for example, Beggs, J. 2001. The ecological consequences of social wasps (Vespulaspp.) invading an ecosystem that has an abundant carbohydrate resource. BiologicalConservation 99: 17–28.
7 See for example, Wardle, op. cit. reference 4.8 See for example, King, C.M. 1984. Immigrant killers: introduced predators and the
conservation of birds in New Zealand. Oxford University Press, Auckland.9 See for example McKinnon, M. 1997. New Zealand Historical Atlas. David Bateman,
Auckland.10 See for example, Stewart, G.H., Harrison, J.B.J. 1987. Plant communities, landforms,
and soils of a geomorphically active drainage basin, Southern Alps, New Zealand. NewZealand Journal of Botany 25: 385–399; Mark, A.F., Dickinson, K.M., Fife, A.J., 1989.Forest succession on landslides in the Fiord Ecological Region. New Zealand Journal ofBotany 27: 369–390; Leathwick, J.R., Rogers, G.M. 1996. Modelling relationshipsbetween environment and canopy composition in secondary vegetation in centralNorth Island, New Zealand. New Zealand Journal of Ecology 20: 147–161.
11 See for example, Nicholls, J.L. 1976. A revised classification of the North Islandindigenous forests. New Zealand Journal of Forestry 21: 105–132.
12 See for example, Leathwick, J.R. 2001. New Zealand’s potential forest pattern aspredicted from current species:environment relationships. New Zealand Journal ofBotany 39: 447–464.
13 McEwan, W.M. (ed.) 1987. Ecological Districts and Regions of New Zealand. Thirdrevised edition in four 1: 500 000 maps. New Zealand Biological Resources CentrePublication no. 5. Wellington, Department of Conservation.
14 See for example, Revfeim, K.J.A. 1982. Estimating global radiation on sloping surfaces.New Zealand Journal of Agricultural Research 25: 281–283.
15 Stevens et al., op. cit. reference 1.16 http://www.environment.govt.nz/biodiversity/landcover.html17 http://gis.esri.com/arcscripts/18 Davies-Colley, R.J., Payne, G.W., van Elswijk, M. 2000. Microclimate gradients across
a forest edge. New Zealand Journal of Ecology 24: 111–121.19 http://flash.lakeheadu.ca/~rrenpel/patch/20 See for example, Leathwick, op. cit. reference 12.21 Coops, N., Loughhead, A., Ryan, P., Hutton, R. 2001. Development of daily spatial
heat unit mapping from monthly climatic surfaces for the Australian continent.International Journal of Geographical Information Science 15: 345–361.
22 Hales, S., Hearnden, M. 1999. Modelling the potential distribution of disease vectors inNew Zealand: A case study of Aedes camptorhnchus. Proceedings of the 11th AnnualColloquium of the Spatial Information Research Centre. University of Otago, Dunedin,New Zealand, December 13–15th 1999.