land supply and demand analysis - sa.gov.au · pdf filebuckland park urban area land supply...
TRANSCRIPT
BUCKLAND PARK URBAN AREA
LAND SUPPLY AND DEMAND ANALYSIS
Prepared for WALKER CORPORATION
& DAYCORP
March 2009

Disclaimer The opinions, estimates and information given herein or otherwise in relation hereto are made by Connor Holmes in their best judgement, in good faith and as far as possible based on data or sources which are believed to be reliable. With the exception of the party to whom this document is specifically addressed, Connor Holmes, its directors, employees and agents expressly disclaim any liability and responsibility to any person whether a reader of this document or not in respect of anything and of the consequences of anything done or omitted to be done by any such person in reliance whether wholly or partially upon the whole or any part of the contents of this document. All information contained within this document is confidential. Unauthorised reproduction of this document without consent may warrant legal action. Copyright © Connor Holmes 2009. All rights reserved. No part of this work may be reproduced or copied in any form or by any means (graphic, electronic or mechanical, including photocopying, recording, recording taping, or information retrieval systems) without the prior written permission of Connor Holmes.

BUCKLAND PARK URBAN AREA – LAND SUPPLY / DEMAND ANALYSIS TABLE OF CONTENTS 992-153
CONTENTS 1. INTRODUCTION
1.1 The Site 1 1.2 Proposal 3 1.3 The Study Purpose 5
2. SUPPLY AND DEMAND CONTEXT 6
2.1 State, Metropolitan and Regional Growth Context 6 2.2 Land and Housing Prices 10
3. DEMAND FOR BUCKLAND PARK’S RESIDENTIAL LAND 15
3.1 Context 15 3.2 Demand for New Residential Land 15 3.3 Regional Demand Analysis 17 3.4 Impact on Blakeview, Playford North and Penfield 19 3.5 Impact on Virginia and Angle Vale 19
4. HOUSING SUPPLY FROM BUCKLAND PARK 20
4.1 Yield 20 4.2 Staging of Construction and Occupation 20 4.3 Housing Types 21 4.4 Affordable Housing 25 4.5 Delivery of Affordable Housing 26 4.6 Staging 27 4.7 Non-Residential Facilities 27
5. CONCLUSION 30 6. REFERENCES 32 7. GLOSSARY 33 FIGURES Figure 1.1: Buckland Park Locality Map Figure 1.2: Buckland Park in Metropolitan Adelaide Figure 1.3: Buckland Park in Metropolitan Adelaide’s Northern Region Figure 1.4: The Greater Metropolitan Area Figure 1.5: Buckland Park Master plan Figure 1.6: Proposal Staging Figure 2.1: SA Population Annual Growth, 1983-2008 Figure 2.2: Australian Net Overseas Migration, 1982-2008 Figure 2.3: SA Total Net Migration, Net Overseas Migration and Net Interstate Migration,
1982-2008 Figure 2.4: City of Salisbury Land Sales Figure 2.5: Salisbury House Sales Figure 2.6: Town of Gawler Land Sales Figure 2.7: Gawler House Sales Figure 2.8: City of Playford Land Sales Figure 2.9: Playford 1 (Munno Para) House Sales Figure 2.10: Playford 2 (Elizabeth) House Sales

BUCKLAND PARK URBAN AREA – LAND SUPPLY / DEMAND ANALYSIS TABLE OF CONTENTS 992-153
TABLES Table 1: SA Population and Migration Table 2: Population Projections for South Australia, 2006 to 2031 Table 3: Greater Adelaide’s Forecast Population, 2006 to 2036 Table 4: Forecast Population of Metropolitan Adelaide’s northern region and Barossa LGA,
2007-2021 Table 5: Dwelling Approvals by LGA Table 6: Demand for New Dwellings in Greater Metropolitan Adelaide 2006-2036 Table 7: Demand for New Dwellings in Metropolitan Adelaide’s Northern and Southern
Regions 2006-2036 Table 8: Dwelling Types and Yields Table 9: Dwelling Numbers at Buckland Park over the Life of the Project Table 10: Housing Type by Household Type Table 11: Detached and Attached Housing Table 12: Definitions of Allotment and Dwelling Types Table 13: Household Income Levels for Selected Areas Table 14: Affordable Housing Mix Table 15: Anticipated Affordable Housing Recipients

BUCKLAND PARK URBAN AREA – LAND SUPPLY / DEMAND ANALYSIS PAGE 1 992-153
1. INTRODUCTION
1.1 The Site
This report considers the demand for housing in Adelaide, and the way Buckland Park will supply that housing. The proposal is a joint venture of Walker Corporation and Daycorp. Buckland Park is located on Port Wakefield Road within the City of Playford, west of Virginia. It is around 32 kilometres north of the Adelaide CBD and 14 kilometres west of Elizabeth. Figure 1.1: Buckland Park Locality Map
Buckland Park is located within Metropolitan Adelaide’s northern region, as defined in the Planning Strategy (SA Government 2007).

BUCKLAND PARK URBAN AREA – LAND SUPPLY / DEMAND ANALYSIS PAGE 2 992-153
Figure 1.2: Buckland Park in Metropolitan Adelaide
Figure 1.3: Buckland Park in Metropolitan Adelaide’s Northern Region

BUCKLAND PARK URBAN AREA – LAND SUPPLY / DEMAND ANALYSIS PAGE 3 992-153
Greater Metropolitan Adelaide includes Metropolitan Adelaide, and Outer Metropolitan Adelaide. Figure 1.4: The Greater Metropolitan Area
1.2 The Proposal Buckland Park is planned to accommodate residential areas, supported by open space,
recreation and biodiversity areas, employment precincts and centres. The arrangement of land uses is described in the Masterplan.

BUCKLAND PARK URBAN AREA – LAND SUPPLY / DEMAND ANALYSIS PAGE 4 992-153
Figure 1.5: Buckland Park Master plan
The proposal will be implemented in stages over a period of 25 years, Stage 1 is planned for 2010 to 2016, as illustrated in the staging plan. The first residents are expected in 2013. It is anticipated Buckland Park will be fully constructed and occupied by 2036, when it will accommodate 12,000 residential allotments, with an average size of 500m2, supported with multiple purpose open space, and commercial, retail, community and employment uses. By 2036, a total population of 33,000 is anticipated, with a workforce of 10,687 people. (Connor Holmes, 2008).
BUCKLAND PARK URBAN AREA – LAND SUPPLY / DEMAND ANALYSIS PAGE 5 992-153
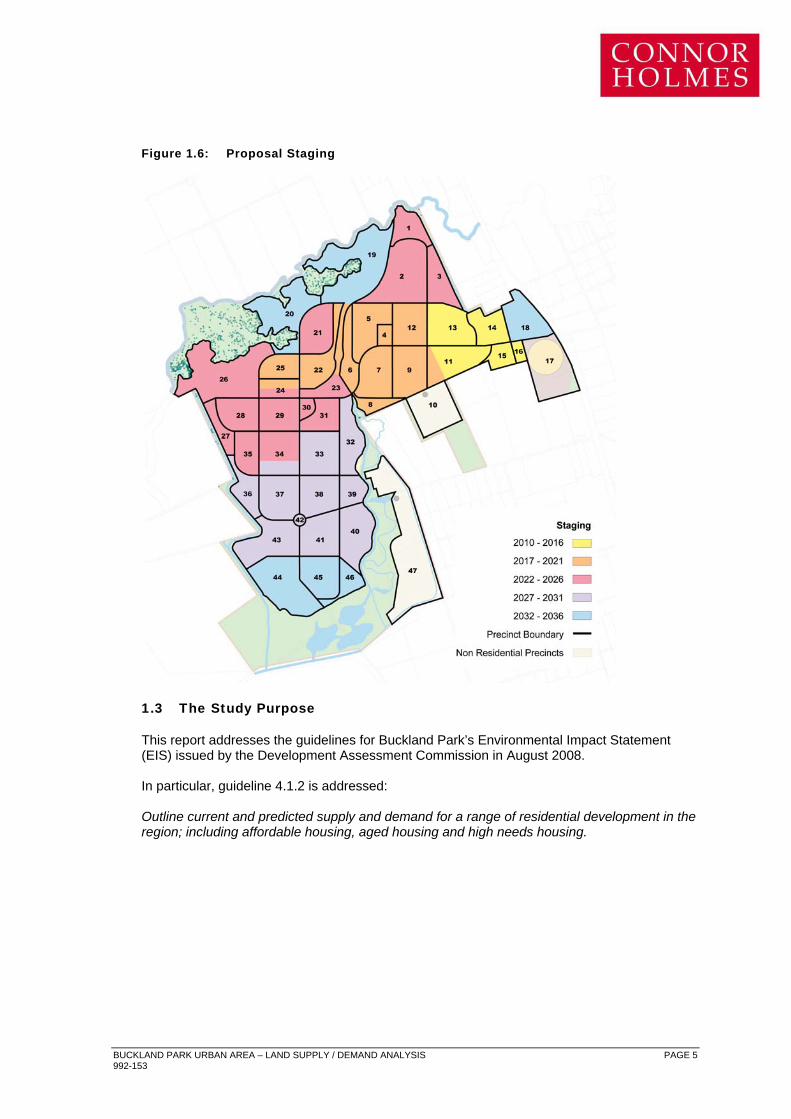
Figure 1.6: Proposal Staging
1.3 The Study Purpose
This report addresses the guidelines for Buckland Park’s Environmental Impact Statement (EIS) issued by the Development Assessment Commission in August 2008.
In particular, guideline 4.1.2 is addressed:
Outline current and predicted supply and demand for a range of residential development in the region; including affordable housing, aged housing and high needs housing.

BUCKLAND PARK URBAN AREA – LAND SUPPLY / DEMAND ANALYSIS PAGE 6 992-153
2. SUPPLY AND DEMAND ANALYSIS
2.1 State, Metropolitan and Regional Growth Context
Since emerging from the early-mid 1990s’ recession, demand for housing in Adelaide has steadily increased. Today, demand has reached a point where it cannot be met by the development industry, which is limited by a lack of available, suitably zoned land, and limits on the ability to construct housing.
Some short term relief to land supply is expected from Land Management Corporation (LMC) releases, and in the medium term from the recent inclusion of an additional 2,000 hectares within the Urban Growth Boundary (UGB), which will, over time, be rezoned and developed for urban purposes. However, the process of creating new suburbs on this land will be complicated, and for some areas, appears highly problematic. For example, some areas are highly fragmented in ownership (Hackham), some areas are politically sensitive (Bowering Hill) and some face environmental remediation (Highbury). In this context, the delivery of Buckland Park in a timely manner remains crucial to the uninterrupted supply of residential land to the Adelaide market. Constraints on the construction of housing are likely to remain, even if land supply issues can be overcome. South Australia’s labour shortages in key trades will continue as there is strong competing demand for skilled labour from a range of expanding industries. The following statistics show historical trends in housing construction, immigration levels and population growth. These statistics provide an important reference point for the prediction of future growth levels in Metropolitan Adelaide and, indeed, Greater Metropolitan Adelaide.
Table 1: SA Population and Migration
June Quarter
Estimated Resident
Population
Overseas Migration
Interstate Migration
Net Migration Overall Population
Change 1997 1,481,357 3,106 -3,318 -212 7,104 1998 1,489,552 3,160 -1,996 1,164 8,195 1999 1,497,819 2,682 -1,631 1,051 8,267 2000 1,505,038 3,829 -3,531 298 7,219 2001 1,511,728 2,765 -2,418 347 6,690 2002 1,521,119 2,798 -1,335 1,463 9,391 2003 1,531,259 3,904 -1,218 2,686 10,140 2004 1,540,399 4,305 -2,936 1,369 9,140 2005 1,552,523 7,020 -3,250 3,770 12,124 2006 1,568,204 9,813 -2,591 7,222 15,681 2007 1,584,513 13,146 -3,563 9,583 16,309 2008 1,601,821 14,186 -4,355 9,831 17,308
Source: ABS Catalogue No. 3101.0

BUCKLAND PARK URBAN AREA – LAND SUPPLY / DEMAND ANALYSIS PAGE 7 992-153
Figure 2.1: SA Population Annual Growth, 1983-2008
0.00%
0.20%
0.40%
0.60%
0.80%
1.00%
1.20%
1983
1984
1985
1986
1987
1988
1989
1990
1991
1992
1993
1994
1995
1996
1997
1998
1999
2000
2001
2002
2003
2004
2005
2006
2007
2008
Year ending June
Cha
nge
in E
RP
Population Growth SA
Figure 2.2: Australian Net Overseas Migration, 1982-2008
0
50,000
100,000
150,000
200,000
250,000
1982
1983
1984
1985
1986
1987
1988
1989
1990
1991
1992
1993
1994
1995
1996
1997
1998
1999
2000
2001
2002
2003
2004
2005
2006
2007
2008
Year ending June
Net Overseas Migration Australia

BUCKLAND PARK URBAN AREA – LAND SUPPLY / DEMAND ANALYSIS PAGE 8 992-153
Figure 2.3: SA Total Net Migration, Net Overseas Migration and Net Interstate Migration, 1982-2008
-10,000
-5,000
0
5,000
10,000
15,000
20,000
1982
1983
1984
1985
1986
1987
1988
1989
1990
1991
1992
1993
1994
1995
1996
1997
1998
1999
2000
2001
2002
2003
2004
2005
2006
2007
2008
Year Ending June
Net Overseas Migration SA Net Interstate Migration SA Net Migration SA
As illustrated above, overseas immigration to South Australia has substantially increased over the last few years. With fairly stable interstate migration and natural increase, this has resulted in an increase in the State’s rate of population growth from 0.2% per annum in the 1990s, to 1.1% per annum in 2008. In 2008, population was growing at a rate 2-3 times faster than in the 1990s. While the long term continuation of growth at these levels cannot be assumed, the anticipated performance of the State in terms of the mining, defence and education sectors, suggests that growth levels could actually rise in the medium term. The State Government has recently endorsed population and dwelling projections for South Australia and Greater Metropolitan Adelaide to inform 30 year state plans currently being prepared. (DPLG, 2008; Minister for Urban Development and Planning, 2008). These growth projections anticipate the State's population will grow from 1.6 million in 2008, to 2 million by 2027. Greater Metropolitan Adelaide is projected to grow by 547,000 people and 255,000 dwellings in the 30 years from 2006 to 2036, excluding Murray Bridge. To support this level of population growth, an average of 8,500 additional dwellings will be required in Greater Metropolitan Adelaide each year, for the next 30 years. The Government endorsed projections for South Australia’s population growth to 2031 are given in Table 2. Table 3 shows Greater Metropolitan Adelaide’s population and dwelling projections to 2036, excluding Murray Bridge.

BUCKLAND PARK URBAN AREA – LAND SUPPLY / DEMAND ANALYSIS PAGE 9 992-153
Table 2: Population Projections for South Australia, 2006 to 2031
Year High 2006 1,568,204 2011 1,662,609 2016 1,764,609 2021 1,873,917 2026 1,985,875 2031 2,095,806
Table 3: Greater Adelaide’s Forecast Population, 2006 to 2036
Year Estimated Resident Population
Dwellings Occupancy Rate
2006 1,270,592 535,861 2.37 2011 1,347,251 575,677 2.34 2016 1,435,083 617,728 2.32 2021 1,529,480 661,208 2.31 2026 1,626,688 704,322 2.31 2031 1,722,888 747,547 2.30 2036 1,817,007 791,155 2.30
In a regional context, growth in Metropolitan Adelaide’s northern region and the Barossa LGA are expected to be strong and substantially above Greater Metropolitan Adelaide’s overall growth rates.
While the Government endorsed population projections have not yet been disaggregated into regions, the Department of Planning and Local Government (DPLG) have prepared population forecasts for the Metropolitan Adelaide’s northern region and the Barossa LGA for 2007-2021. These are shown in Table 4.
Table 4: Forecast Population of Metropolitan Adelaide’s Northern Region and Barossa LGA,
2007-2021
Year Northern Adelaide Barossa LGA 2007 350,857 63,167 2011 371,807 71,625 2016 400,490 83,793 2021 429,967 96,771
These projections show increasing growth in the absolute size of the population in each of these regions over the period of projection, reflecting their future role providing land for housing.
The following table records dwelling approvals in LGAs within the Metropolitan Adelaide’s northern region and the Barossa LGA over the last 7 years. Significant growth is evident, with total activity levels rising by some 50% over the 4 years from 2003-2004 to 2007-2008.
BUCKLAND PARK URBAN AREA – LAND SUPPLY / DEMAND ANALYSIS PAGE 10 992-153
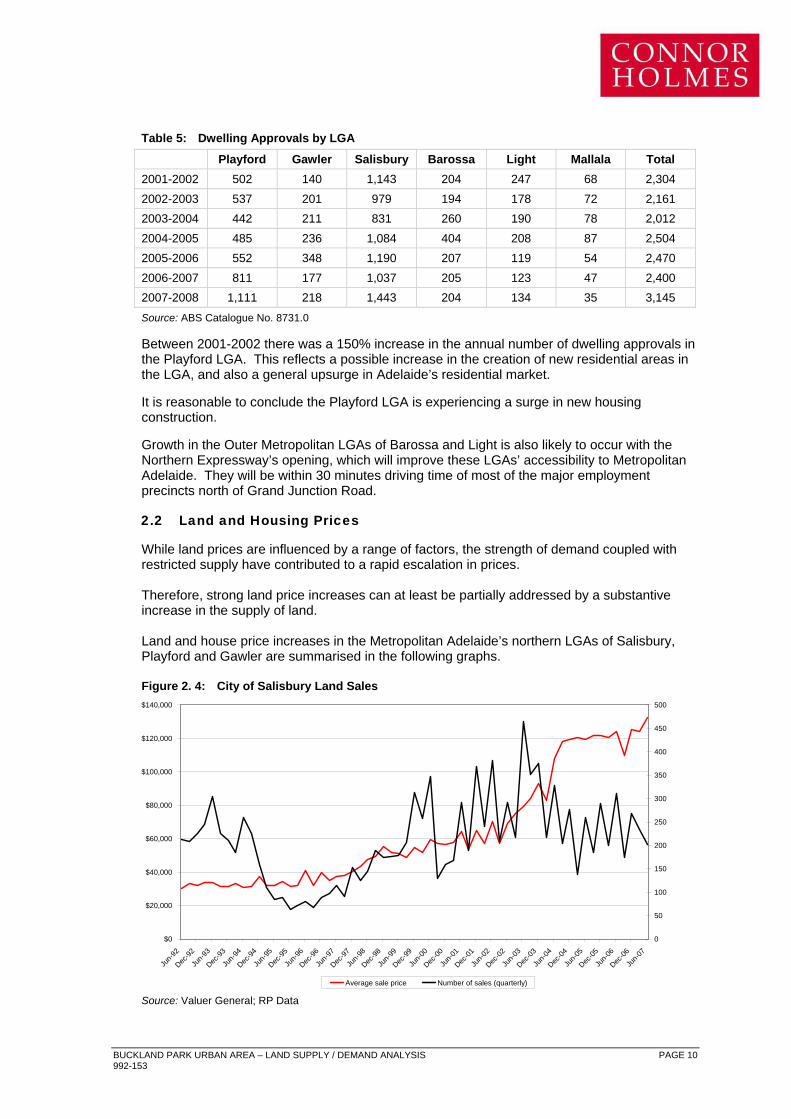
Table 5: Dwelling Approvals by LGA
Playford Gawler Salisbury Barossa Light Mallala Total 2001-2002 502 140 1,143 204 247 68 2,304 2002-2003 537 201 979 194 178 72 2,161 2003-2004 442 211 831 260 190 78 2,012 2004-2005 485 236 1,084 404 208 87 2,504 2005-2006 552 348 1,190 207 119 54 2,470 2006-2007 811 177 1,037 205 123 47 2,400 2007-2008 1,111 218 1,443 204 134 35 3,145
Source: ABS Catalogue No. 8731.0
Between 2001-2002 there was a 150% increase in the annual number of dwelling approvals in the Playford LGA. This reflects a possible increase in the creation of new residential areas in the LGA, and also a general upsurge in Adelaide’s residential market.
It is reasonable to conclude the Playford LGA is experiencing a surge in new housing construction.
Growth in the Outer Metropolitan LGAs of Barossa and Light is also likely to occur with the Northern Expressway’s opening, which will improve these LGAs’ accessibility to Metropolitan Adelaide. They will be within 30 minutes driving time of most of the major employment precincts north of Grand Junction Road.
2.2 Land and Housing Prices
While land prices are influenced by a range of factors, the strength of demand coupled with restricted supply have contributed to a rapid escalation in prices. Therefore, strong land price increases can at least be partially addressed by a substantive increase in the supply of land.
Land and house price increases in the Metropolitan Adelaide’s northern LGAs of Salisbury, Playford and Gawler are summarised in the following graphs.
Figure 2. 4: City of Salisbury Land Sales
$0
$20,000
$40,000
$60,000
$80,000
$100,000
$120,000
$140,000
Jun-9
2
Dec-92
Jun-9
3
Dec-93
Jun-9
4
Dec-94
Jun-9
5
Dec-95
Jun-9
6
Dec-96
Jun-9
7
Dec-97
Jun-9
8
Dec-98
Jun-9
9
Dec-99
Jun-0
0
Dec-00
Jun-0
1
Dec-01
Jun-0
2
Dec-02
Jun-0
3
Dec-03
Jun-0
4
Dec-04
Jun-0
5
Dec-05
Jun-0
6
Dec-06
Jun-0
7
0
50
100
150
200
250
300
350
400
450
500
Average sale price Number of sales (quarterly)
Source: Valuer General; RP Data

BUCKLAND PARK URBAN AREA – LAND SUPPLY / DEMAND ANALYSIS PAGE 11 992-153
Figure 2.5: Salisbury House Sales
$0
$50,000
$100,000
$150,000
$200,000
$250,000
$300,000
Jun-9
2
Dec-92
Jun-9
3
Dec-93
Jun-9
4
Dec-94
Jun-9
5
Dec-95
Jun-9
6
Dec-96
Jun-9
7
Dec-97
Jun-9
8
Dec-98
Jun-9
9
Dec-99
Jun-0
0
Dec-00
Jun-0
1
Dec-01
Jun-0
2
Dec-02
Jun-0
3
Dec-03
Jun-0
4
Dec-04
Jun-0
5
Dec-05
Jun-0
6
Dec-06
Jun-0
7
0
100
200
300
400
500
600
700
800
Median Established House Price Number of Sales (Quarterly)
Source: Valuer General; RP Data Figure 2.6: Town of Gawler Land Sales
$0
$20,000
$40,000
$60,000
$80,000
$100,000
$120,000
Jun-9
2
Dec-92
Jun-9
3
Dec-93
Jun-9
4
Dec-94
Jun-9
5
Dec-95
Jun-9
6
Dec-96
Jun-9
7
Dec-97
Jun-9
8
Dec-98
Jun-9
9
Dec-99
Jun-0
0
Dec-00
Jun-0
1
Dec-01
Jun-0
2
Dec-02
Jun-0
3
Dec-03
Jun-0
4
Dec-04
Jun-0
5
Dec-05
Jun-0
6
Dec-06
Jun-0
7
0
20
40
60
80
100
120
140
Average sale price Number of sales (quarterly)
Source: Valuer General; RP Data

BUCKLAND PARK URBAN AREA – LAND SUPPLY / DEMAND ANALYSIS PAGE 12 992-153
Figure 2.7: Gawler House Sales
$0
$50,000
$100,000
$150,000
$200,000
$250,000
$300,000
Jun-9
2
Dec-92
Jun-9
3
Dec-93
Jun-9
4
Dec-94
Jun-9
5
Dec-95
Jun-9
6
Dec-96
Jun-9
7
Dec-97
Jun-9
8
Dec-98
Jun-9
9
Dec-99
Jun-0
0
Dec-00
Jun-0
1
Dec-01
Jun-0
2
Dec-02
Jun-0
3
Dec-03
Jun-0
4
Dec-04
Jun-0
5
Dec-05
Jun-0
6
Dec-06
Jun-0
7
0
20
40
60
80
100
120
140
160
Median Established House Price Number of Sales (quarterly)
Source: Valuer General; RP Data Figure 2.8: City of Playford Land Sales
$0
$10,000
$20,000
$30,000
$40,000
$50,000
$60,000
$70,000
$80,000
$90,000
$100,000
Jun-9
2
Dec-92
Jun-9
3
Dec-93
Jun-9
4
Dec-94
Jun-9
5
Dec-95
Jun-9
6
Dec-96
Jun-9
7
Dec-97
Jun-9
8
Dec-98
Jun-9
9
Dec-99
Jun-0
0
Dec-00
Jun-0
1
Dec-01
Jun-0
2
Dec-02
Jun-0
3
Dec-03
Jun-0
4
Dec-04
Jun-0
5
Dec-05
Jun-0
6
Dec-06
Jun-0
7
0
50
100
150
200
250
300
Average sale price Number of sales (quarterly)
Source: Valuer General; RP Data

BUCKLAND PARK URBAN AREA – LAND SUPPLY / DEMAND ANALYSIS PAGE 13 992-153
Figure 2.9: Playford 1 (Munno Para) House Sales
$0
$50,000
$100,000
$150,000
$200,000
$250,000
Jun-9
2
Dec-92
Jun-9
3
Dec-93
Jun-9
4
Dec-94
Jun-9
5
Dec-95
Jun-9
6
Dec-96
Jun-9
7
Dec-97
Jun-9
8
Dec-98
Jun-9
9
Dec-99
Jun-0
0
Dec-00
Jun-0
1
Dec-01
Jun-0
2
Dec-02
Jun-0
3
Dec-03
Jun-0
4
Dec-04
Jun-0
5
Dec-05
Jun-0
6
Dec-06
Jun-0
7
0
50
100
150
200
250
300
350
400
450
Median Established House Price Number of Sales (quarterly)
Source: Valuer General; RP Data
Figure 2.10: Playford 2 (Elizabeth) House Sales
$0
$20,000
$40,000
$60,000
$80,000
$100,000
$120,000
$140,000
$160,000
$180,000
$200,000
Jun-9
2
Dec-92
Jun-9
3
Dec-93
Jun-9
4
Dec-94
Jun-9
5
Dec-95
Jun-9
6
Dec-96
Jun-9
7
Dec-97
Jun-9
8
Dec-98
Jun-9
9
Dec-99
Jun-0
0
Dec-00
Jun-0
1
Dec-01
Jun-0
2
Dec-02
Jun-0
3
Dec-03
Jun-0
4
Dec-04
Jun-0
5
Dec-05
Jun-0
6
Dec-06
Jun-0
7
0
50
100
150
200
250
Median Established House Price Number of Sales (quarterly)
Source: Valuer General; RP Data These figures demonstrate a strong consistency across these LGAs, with all having: • Fairly stable prices during the 1990s;
• A rise in prices commencing in 1999;
• Rapid price rises between 2002 and 2004;
• A tapering off in price rises during 2005-2006;
• A recommencement of accelerated price rises in 2007.
BUCKLAND PARK URBAN AREA – LAND SUPPLY / DEMAND ANALYSIS PAGE 14 992-153
While many factors contribute to price rises, it can be expected increased land supply and competition between new residential areas will assist in avoiding supply induced price escalation. The supply of housing land and competition in the residential market provided by Buckland Park will therefore contribute to restraining house prices in Adelaide.

BUCKLAND PARK URBAN AREA – LAND SUPPLY / DEMAND ANALYSIS PAGE 15 992-153
3. DEMAND FOR BUCKLAND PARK’S RESIDENTIAL LAND
3.1 Context
DPLG’s population and dwelling projections for Greater Metropolitan Adelaide and South Australia form the basis for predicting the demand for Buckland Park’s residential land. As discussed above, these projections do not reflect the Government’s endorsed 30 Year planning projections. The SA Government has identified locations within Metropolitan and Outer Metropolitan Adelaide for consideration as potential urban growth areas in its Planning Review reference? Buckland Park’s role in supplying land and satisfying demand is considered within this framework. 3.2 Demand For Residential Land As previously discussed, DPLG predicts an average of 8,500 additional dwellings per annum will be required between 2006-2036 to supply the houses needed to accommodate Greater Metropolitan Adelaide’s population growth in the same period. Based on continuation of the levels of construction activity recorded in Outer Metropolitan LGAs over the last decade, it is assumed approximately 1,350 dwellings per annum will be provided in towns located in Outer Metropolitan Adelaide, (eg. Mt Barker, Barossa towns, Strathalbyn, Victor Harbor, Goolwa etc.) There will therefore be a demand for approximately 7,150 dwellings per annum in Metropolitan Adelaide. As an outcome of the Planning Review, the SA Government wants 70% of the new housing needed by 2036 to be provided in infill sites in established suburbs, with 30% provided in new suburbs. The ratio of growth accommodated in new suburbs, and growth accommodated in Adelaide’s established suburbs has varied over Adelaide’s history. Up until the 1990s, new suburbs accommodated most of Adelaide’s growth. Between the 1990s and 2003/04, infill and brownfield sites in Adelaide’s central region have emerged as a substantial supplier of new residential land. Adelaide’s changing demographic, lifestyle aspirations and industrial sector have facilitated this trend. Since 2003/04, Adelaide’s central region has waned slightly relative to new suburbs, possibly as a result of a dwindling number of sites, rapidly escalating prices, increased complexity of planning policies, particularly in character areas, and increasing community resistance. It is doubtful Adelaide’s central sector can continue to supply sites as in the past. There is a lack of sites with potential equivalent to Northfield, Cheltenham and Port Adelaide. The Planning Review predicates achievement of the 70:30 ratio of infill to new suburbs on the creation of Transit Oriented Development (TOD), which will see increases in residential densities around upgraded fixed transport nodes. Nevertheless, it is considered 70% of new housing in established suburbs is an ambitious target. However, it may be possible to maintain the level of supply from infill sites in established areas at 50%, given there will be some supply of medium to high housing land from antiquated centrally located industrial sites.

BUCKLAND PARK URBAN AREA – LAND SUPPLY / DEMAND ANALYSIS PAGE 16 992-153
The proportion of supply from infill sites in established suburbs could be raised to 60% if renewal of antiquated industrial sites continues, combined with the creation of TODs. Renewal of infill sites is likely to be focused in Adelaide’s northern established suburbs as this area has better access to employment and services. It is likely the 30% of housing to be provided in new suburbs will be focused in Metropolitan Adelaide’s northern region rather than the southern region. The northern region has more suitable, available land and considerably better access to employment, infrastructure, and future infrastructure (Connor Holmes 2008a) As new suburbs are established in the northern region, they will draw in more infrastructure, employment and services, providing a catalyst for the creation of additional suburbs. Towns in Outer Metropolitan Adelaide’s south and south east will continue to expand, facilitated by the following factors: • Accessibility to central Adelaide provided by the South Eastern Freeway;
• The limited availability and cost of land in Metropolitan Adelaide’s southern and central regions;
• The growing number of retiring baby boomers seeking a lifestyle change. It is predicted the direction of Greater Metropolitan Adelaide’s growth to 2036 will be influenced by the following: • Growth from infill areas increasing to 60% - 70%, depending on the success of
Government policy, and availability of sites;
• An increasing role for Metropolitan Adelaide’s northern region in supplying land for the new suburbs accommodating 30%-40% of predicted growth. This may also include some locations contiguous to existing suburbs, but located in Outer Metropolitan Adelaide, for example, Barossa LGA;
• Declining availability of land in Metropolitan Adelaide’s southern region;
• Moderate growth in towns within Outer Metropolitan Adelaide’s south eastern region, for example, Mt Barker, Littlehampton, Nairne, Callington or Murray Bridge;
• Continuing town growth in Outer Metropolitan Adelaide and further a field in the state.
Clearly, the land needed to support the 30% of Adelaide’s growth to be provided in new suburbs is not available within the current Urban Growth Boundary (UGB). Locations for new suburbs must be identified and the current UGB adjusted to facilitate planning for those areas. Therefore, the rate of land supply from Buckland Park identified later in this report assumes the current UGB is adjusted and locations for new suburbs identified. If this does not occur, the rate of demand for Buckland Park would be increased, as land supply from within the current UGB would be inadequate to satisfy demand generated from Adelaide’s projected growth. This affect would be more pronounced at the end of Buckland Park’s construction and occupation programme, as other land supply locations become exhausted.

BUCKLAND PARK URBAN AREA – LAND SUPPLY / DEMAND ANALYSIS PAGE 17 992-153
3.3 Regional Demand Analysis
Table 6 shows predicted demand for dwellings in Greater Metropolitan Adelaide’s infill and new suburbs. Table 7 shows predicted demand for dwellings in Metropolitan Adelaide’s northern and southern regions, and at Buckland Park within that context. The figures for the northern region also include the Barossa LGA.
Table 6: Demand for New Dwellings in Greater Metropolitan Adelaide 2006-2036
Year Ratio of Infill to New
Suburbs
Infill New Suburbs Towns Total
2006 50:50 3575 3575 1350 8500 2007 50:50 3575 3575 1350 8500 2008 51:49 3645 3505 1350 8500 2009 52:48 3720 3430 1350 8500 2010 52:48 3720 3430 1350 8500 2011 53:47 3790 3360 1350 8500 2012 54:46 3860 3290 1350 8500 2013 54:46 3860 3290 1350 8500 2014 55:45 3930 3220 1350 8500 2015 56:44 4005 3145 1350 8500 2016 56:44 4005 3145 1350 8500 2017 57:43 4075 3075 1350 8500 2018 58:42 4145 3005 1350 8500 2019 58:42 4145 3005 1350 8500 2020 59:41 4220 2930 1350 8500 2021 60:40 4290 2860 1350 8500 2022 60:40 4290 2860 1350 8500 2023 61:39 4360 2790 1350 8500 2024 62:38 4435 2715 1350 8500 2025 62:38 4435 2715 1350 8500 2026 63:37 4505 2645 1350 8500 2027 64:36 4575 2575 1350 8500 2028 64:36 4575 2575 1350 8500 2029 65:35 4645 2505 1350 8500 2030 66:34 4720 2430 1350 8500 2031 66:34 4720 2430 1350 8500 2032 67:33 4790 2360 1350 8500 2033 68:32 4860 2290 1350 8500 2034 68:32 4860 2290 1350 8500 2035 69:31 4935 2215 1350 8500 2036 70:30 5005 2145 1350 8500

BUCKLAND PARK URBAN AREA – LAND SUPPLY / DEMAND ANALYSIS PAGE 18 992-153
Table 7: Demand for New Dwellings in Metropolitan Adelaide’s Northern and Southern
Regions 2006-2036
Location Year Buckland Park Northern Region
(excl. Buckland Park & incl. Barossa LGA)
Southern Region
Total
2006 - 2475 1100 3575 2007 - 2475 1100 3575 2008 - 2505 1000 3505 2009 - 2430 1000 3430 2010 - 2430 1000 3430 2011 - 2460 900 3360 2012 120 2270 900 3290 2013 160 2330 800 3290 2014 200 2220 800 3220 2015 300 2145 700 3145 2016 400 2045 700 3145 2017 480 1995 600 3075 2018 600 1805 600 3005 2019 600 1905 500 3005 2020 600 1830 500 2930 2021 640 1820 400 2860 2022 640 1820 400 2860 2023 640 1850 300 2790 2024 640 1775 300 2715 2025 640 1875 200 2715 2026 640 1855 200 2645 2027 640 1835 100 2575 2028 640 1835 100 2575 2029 640 1865 - 2505 2030 640 1790 - 2430 2031 640 1790 - 2430 2032 640 1720 - 2360 2033 640 1650 - 2290 2034 220 2070 - 2290 2035 - 2215 - 2215 2036 - 2145 - 2145
For the period 2006-2036, demand for housing at Buckland Park is predicted to be approximately 13% of total dwellings required in the northern region and Barossa LGA, with a peak demand of approximately 25% per annum. Golden Grove is the only new residential area in Adelaide’s history of a similar scale to Buckland Park. Significantly, the demand predicted for dwellings at Buckland is smaller than actually experienced at Golden Grove. At Golden Grove’s peak, nearly 1,100 lots were produced in a single year, and approximately 1,000 lots per annum were produced over a number of years. This was 30-40% of the lots demanded by the northern region’s market. Demand for lots at Buckland Park is expected to be only 13% of the lots required by the northern region’s market.

BUCKLAND PARK URBAN AREA – LAND SUPPLY / DEMAND ANALYSIS PAGE 19 992-153
Therefore it is not expected Buckland Park will artificially distort the residential land market by providing more lots than the market demands.
3.4 Impact on Blakeview, Playford North and Penfield
The government is planning for residential growth in Blakeview, Playford North and Penfield, including the provision of services and infrastructure. A slowing of growth in those areas, to levels below the planned levels, could result in unused infrastructure and services, or delays in their provision, potentially wasting government resources, or leaving residents without services. However, given the high demand for new housing anticipated in Metropolitan Adelaide’s northern region, it is considered Buckland Park can be absorbed into the residential land market without impacting on the demand for residential land in Blakeview, Playford North and Penfield. These projects can therefore be expected to proceed as planned. 3.5 Impact on Virginia and Angle Vale As the nearest town, Virginia will be most influenced by Buckland Park. In its early stages, Buckland Park’s new residents may draw on Virginia’s services and facilities. The availability of residential land may impact on Virginia’s residential market. Connor Holmes’ centres and social analyses considered the influence Buckland Park may Virginia’s Neighbourhood Centre and human services (Connor Holmes 2008b and 2008c). Land within Virginia’s town boundary is held in relatively small allotments, by many different owners. This restricts the ability to subdivide the land to create new residential properties, and limits the viability of small scale residential projects. Site amalgamations would be required to create sites suitable for housing projects. This is a difficult process, made harder by the need to coordinate several owners. Residential growth in Virginia is therefore likely to be slow, irrespective of Buckland Park. Angle Vale originally comprised large farming sections, which could be feasibly divided into large residential allotments, of generally 1,800 m2. Only a few farming sections of a scale suitable for division into residential allotments remain. Accordingly, it is concluded Buckland Park will not slow or hamper the creation of new residential land at Angle Vale. Furthermore, Angle Vale’s residential character is created by its large residential lots. Buckland Park will have a totally different character, therefore the two markets will be independent of each other, and one will not impinge on the other.

BUCKLAND PARK URBAN AREA – LAND SUPPLY / DEMAND ANALYSIS PAGE 20 992-153
4. HOUSING SUPPLY FROM BUCKLAND PARK
4.1 Yield
Buckland Park has an area of 1,340 hectares. Excluding land needed for roads, non-residential uses and environmental constraints, there will be approximately 600 hectares of residential land, capable of accommodating 12,000 dwellings. Detailed planning of future stages will confirm yields, but at this stage in the design process, these figures have been adopted for planning purposes. This yield is generated from the neighbourhood types and densities described in Table 8. Table 8: Dwelling Types and Yields
Location Net Area (hectares)
Net Residential Density
(dwellings per hectare)
Total Dwellings
Low Density Residential Neighbourhoods
77 10 700
Residential Neighbourhoods
449 20 8,580
Medium Density Neighbourhoods
61 40 2,320
Mixed Use Precincts 13 40 400 Total Dwelling Yield 600 12,000
Source: Connor Holmes 2008
4.2 Staging of Construction and Occupation This proposal does not include construction of dwellings, but only production of allotments. It is anticipated construction and occupation of the allotments and dwellings will occur over a 25 year time frame. There will be a two year lag between commencing construction of the allotment and occupation of the dwelling. An average of 480 dwellings are expected to be constructed per annum, and this figure has been used to inform transport, centres and services planning. However, the actual rate achieved will be influenced by a combination of factors including:
• The strength of demand Metropolitan Adelaide’s northern region’s residential market • The suitability of Buckland Park’s allotments to that market, in respect of timing and
housing types available. It is expected Buckland Park will be able to provide a range of housing types simultaneously because of its large scale.
• The timing and scale of competing residential land releases in the northern region. • The time delay between commencement of subdivision construction and building houses.
This rate of production is considered reasonable, but will be subject to variation over time as a
result of market conditions for example. Also production tends to be slower in the early years as an area becomes established, faster
in the middle years as production and marketing are in full swing, and slower in the later years as the availability of allotments shrinks.

BUCKLAND PARK URBAN AREA – LAND SUPPLY / DEMAND ANALYSIS PAGE 21 992-153
This affect is likely to be seen over the proposal’s 25-year construction and occupation time frame, and on a smaller scale, within each of the proposal’s stages.
It is considered however, a figure of 480 dwellings per year is a reasonable average for planning purposes.
Table 9: Dwelling Numbers at Buckland Park over the Life of the Project
Number of Dwellings Year Occupied During
Year Cumulative Total
2010 0 0 2011 0 0 2012 0 0 2013 120 120 2014 160 280 2015 200 480 2016 300 780 2017 400 1,180 2018 480 1,660 2019 600 2,260 2020 600 2,860 2021 600 3,460 2022 640 4,100 2023 640 4,740 2024 640 5,380 2025 640 6,020 2026 640 6,660 2027 640 7,300 2028 640 7,940 2029 640 8,580 2030 640 9,220 2031 640 9,860 2032 640 10,500 2033 640 11,140 2034 640 11,780 2035 220 12,000
Source: Connor Holmes These figures differ from those contained in the tables in Table 7 by one year, reflecting the time between dwelling commencement and dwelling occupation. 4.3 Housing Types
With a planned yield of 12,000 dwellings, accommodating 33,000 residents, Buckland Park will comprise approximately 3% of Metropolitan Adelaide’s population. Buckland Park therefore needs provide housing which suits a range of people and households in different age and income brackets.

BUCKLAND PARK URBAN AREA – LAND SUPPLY / DEMAND ANALYSIS PAGE 22 992-153
The housing mix planned for Buckland Park is summarised in Table 10. This mix has been prepared to assist planning. Detailed design of future stages will undoubtedly include changes and refinements, but will be guided by the Masterplan.
Table 10: Housing Type by Household Type
Size Land and Housing Package Site Area Frontage
Component of total yield
Household Type
Acreage 2000 m2+ 40 m+ <1% Families Premium 800-1000 m2 22 m+ 5% Families Traditional 540-700 m2 18-22 m 25% Families Courtyard 420-480 m2 14-16 m 20% Families, Older Couples Four Packs 360-450 m2 12-15 m 2% Families, Older Couples Villa - large 375 m2 12.5 m 10% Families, Older Couples,
Older Singles, Couples, Single Parent Families, Low Income Groups
Villa - small 300-330 m2 10-11 m 10% Families, Older Couples, Older Singles, Couples, Single Parent Families, Low Income Groups
Cottage 300-350 m2 14-15 m 5% Families, Older Couples, Older Singles, Couples, Single Parent Families, Low Income Groups
Gatehouse 150-300 m2 10-14 m 5% Older Couples, Older Singles, Couples, Single Parent Families, Low Income Groups
Terraces / Row Dwellings
125-300 m2 5-10 m 5% Singles, Couples, Older Couples
Rear Loaded Dwellings
125-200 m2 5-8 m 5% Singles, Couples Older Couples
Mews Dwelling 25-40 m2 na 1% Singles, Couples, Low Income Groups
Apartments 70-100 m2 na 3% Singles, Couples, Low Income Groups
Mansions 200-300 m2 18-22 m <1% Singles, Couples, Small Families
Shop Top / Soho 70-100 m2 na <1% Singles, Couples Retirement - lifestyle
300-400 m2 na 2% Active Retirees
Retirement - aged care
250-350 m2 na 2% Supported, Retirees, Low Income Groups
Source: Connor Holmes
The above mix includes 87% (10,440) of dwellings provided as allotments, and 13% (1,560) as part of future residential projects, for example medium density housing. There will be a similar breakdown between detached, and attached dwellings.
Table 11 compares Buckland Park’s mix of housing types, to the mix in other parts of the Adelaide Metropolitan area.

BUCKLAND PARK URBAN AREA – LAND SUPPLY / DEMAND ANALYSIS PAGE 23 992-153
Table 11: Detached and Attached Housing
Location % Detached % Attached Metropolitan Adelaide 77% 23% Metropolitan Adelaide’s northern region
86% 14%
Playford LGA 81% 19% Buckland Park 87% 13%
Source: ABS Catalogue No. 2001.0 / Connor Holmes
The allotment and dwelling types planned for Buckland Park are defined in Table 12.
Table 12: Definitions of Allotment and Dwelling Types
Allotment or Dwelling Type
Definition Location
Acreage Large allotments greater than 2,000m2 but including allotments of up to 2 hectares
Areas incorporating significant natural vegetation, stormwater channels or buffers to adjoining land uses
Premium Large suburban allotments providing scope for grand residences
Adjacent to woodland areas and in exclusive culs-de-sac precincts separated from other neighbourhoods.
Traditional Standard suburban allotments providing scope for most project home designs including 'triple fronted dwellings'
Throughout the site.
Courtyard Allotments providing dimensions suitable for specific courtyard products and most 'double fronted dwellings'
Throughout the site.
Four Packs Sites for four dwellings served by a common central driveway, typically of courtyard dimensions
On main road frontages and on reserve frontages where no road access is provided to the lots fronting the main road or reserve
Villa - large Allotments providing dimensions suitable for large villa homes, typically single fronted plus double garage
Throughout the e site.
Villa - small Allotments providing dimensions suitable for compact villa homes, typically single fronted plus single garage
Throughout the site.
Cottage Shallow allotments that provide for a smaller, more affordable housing product
Throughout the site.
Gatehouse Small lots, often at the rear of larger properties providing an affordable housing product
Facing onto laneways and minor streets
Terraces / Row Dwellings Attached dwellings built in rows of three or more which take advantage of zero side setbacks
Mixed use precincts, centres, near centres and where definition of the street environment is required. Corner sites permit vehicular access to the rear of the site
BUCKLAND PARK URBAN AREA – LAND SUPPLY / DEMAND ANALYSIS PAGE 24 992-153
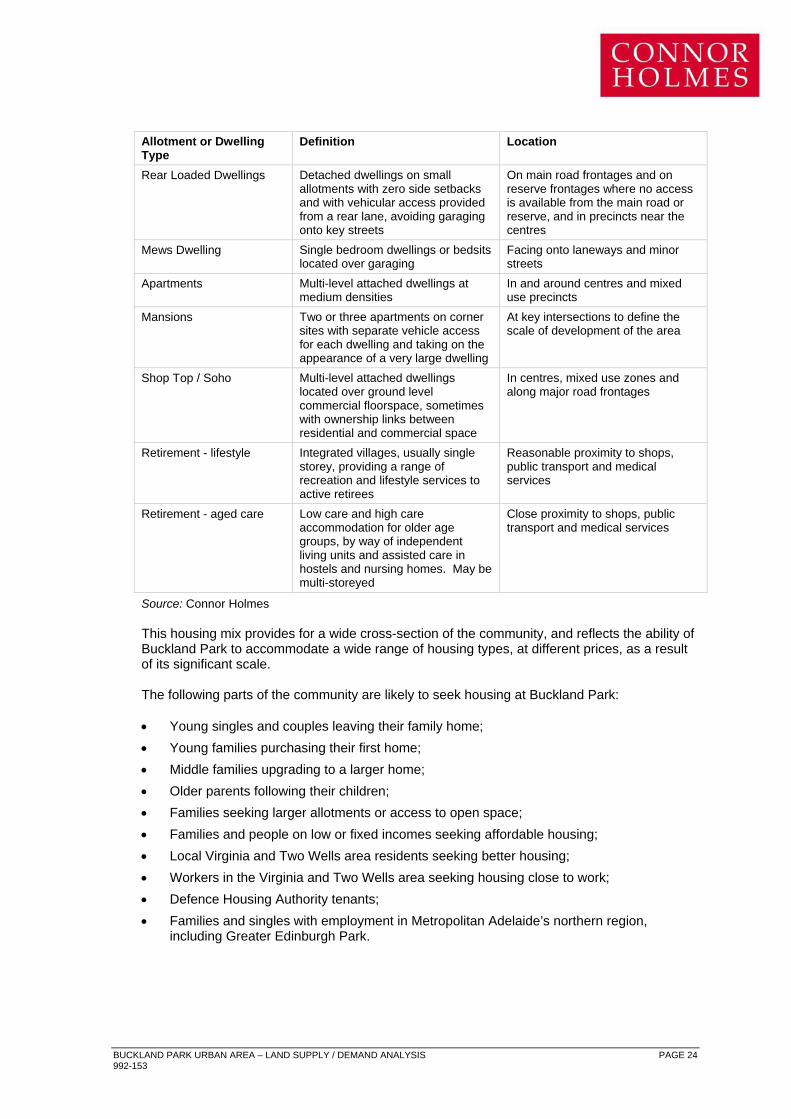
Allotment or Dwelling Type
Definition Location
Rear Loaded Dwellings Detached dwellings on small allotments with zero side setbacks and with vehicular access provided from a rear lane, avoiding garaging onto key streets
On main road frontages and on reserve frontages where no access is available from the main road or reserve, and in precincts near the centres
Mews Dwelling Single bedroom dwellings or bedsits located over garaging
Facing onto laneways and minor streets
Apartments Multi-level attached dwellings at medium densities
In and around centres and mixed use precincts
Mansions Two or three apartments on corner sites with separate vehicle access for each dwelling and taking on the appearance of a very large dwelling
At key intersections to define the scale of development of the area
Shop Top / Soho Multi-level attached dwellings located over ground level commercial floorspace, sometimes with ownership links between residential and commercial space
In centres, mixed use zones and along major road frontages
Retirement - lifestyle Integrated villages, usually single storey, providing a range of recreation and lifestyle services to active retirees
Reasonable proximity to shops, public transport and medical services
Retirement - aged care Low care and high care accommodation for older age groups, by way of independent living units and assisted care in hostels and nursing homes. May be multi-storeyed
Close proximity to shops, public transport and medical services
Source: Connor Holmes
This housing mix provides for a wide cross-section of the community, and reflects the ability of Buckland Park to accommodate a wide range of housing types, at different prices, as a result of its significant scale. The following parts of the community are likely to seek housing at Buckland Park:
• Young singles and couples leaving their family home; • Young families purchasing their first home; • Middle families upgrading to a larger home; • Older parents following their children; • Families seeking larger allotments or access to open space; • Families and people on low or fixed incomes seeking affordable housing; • Local Virginia and Two Wells area residents seeking better housing; • Workers in the Virginia and Two Wells area seeking housing close to work; • Defence Housing Authority tenants; • Families and singles with employment in Metropolitan Adelaide’s northern region,
including Greater Edinburgh Park.

BUCKLAND PARK URBAN AREA – LAND SUPPLY / DEMAND ANALYSIS PAGE 25 992-153
This cross-section of the community is likely to be drawn predominantly from the second, third and fourth income quintiles, but very often including double income families with moderate to high capacity for mortgage repayments. It is expected to include some professionals and managers, a large administrative and clerical base and substantial numbers of tradespersons and skilled workers.
Table 13 shows household incomes in locations where the majority of Buckland Park’s new residents are expected to be drawn from, and which provide an indication of the household incomes expected in Buckland Park.
Table 13: Household Income Levels for Selected Areas
Locality Median Annual Household Income (2006)
Metropolitan Adelaide $48,048 Playford LGA $37,388 Salisbury LGA $45,500 Gawler LGA $43,368 Tea Tree Gully LGA $55,900 Hewett (suburb) $78,000 Blakeview (suburb) $52,472 Andrews Farm (suburb) $55,224 Burton (suburb) $51,792 Craigmore (suburb) $55,276 Angle Vale (township) $65,572
Source: ABS Catalogue No. 2001.0 / Connor Holmes
The median annual household incomes in the Playford LGA are particularly low. However within Playford LGA, the new suburbs of Blakeview, Andrews Farm and Craigmore, have median household incomes which are 9-15% higher than the metropolitan median, as there are many double income families in those suburbs. Hewett, which is a new large lot estate, is attracting higher income households to Metropolitan Adelaide’s northern region. Its median income is 62% higher than Metropolitan Adelaide. Angle Vale, which has also has large lot estates, has a median household income approximately 36% higher than Metropolitan Adelaide. These figures are sourced from the 2006 Census, it is expected the incomes listed would have increased since the census.
4.4 Affordable Housing 15% of Buckland Park’s housing is planned as Affordable Housing. These dwellings include a
cross-section of housing types and locations, and will include sites suitable for not for profit housing providers, investment housing for affordable rental, and low cost allotments and housing types.

BUCKLAND PARK URBAN AREA – LAND SUPPLY / DEMAND ANALYSIS PAGE 26 992-153
The breakdown of affordable land and housing types is anticipated as follows: Table 14: Affordable Housing Mix
Component Number of Units % of Total Yield % of House Or Allotment Types
Acreage - - - Premium - - - Traditional - - - Courtyard - - - Four Packs - - - Villa - large 12 <0.1% 1% Villa - small 470 4.0% 40% Cottage 360 3.0% 60% Gatehouse 610 5.0% 100% Terraces / Row Dwellings
- - -
Rear Loaded Dwellings - - - Mews Dwelling 120 1.0% 100% Apartments 180 1.5% 50% Mansions - - - Shop Top / Soho - - - Retirement - lifestyle - - - Retirement - aged care 48 0.5% 25% Total 1800 15.0% 15%
Source: Connor Holmes Allotments will be made available on commercial terms to various affordable housing providers
as shown in Table 15.: Table 15: Anticipated Affordable Housing Recipients
Affordable Housing Recipient Number of Units % of Total Supply Government Welfare providers 607 4.0% Community housing groups 152 1.0% Not for Profit Aged Care providers
76 0.5%
Low income purchasers 1137 7.5% Investors (providing affordable rental housing)
303 2.0%
Total 2275 15.0% Source: Connor Holmes 4.5 Delivery of Affordable Housing The strategy for delivery of Affordable Housing is considered in a separate report (Connor
Holmes 2008d).

BUCKLAND PARK URBAN AREA – LAND SUPPLY / DEMAND ANALYSIS PAGE 27 992-153
4.6 Staging
The provision of various housing and allotment types will not be uniform over the 25 year construction and occupation period. In the early stages, it is likely there will be a larger proportion of traditional low density allotments, suitable for accommodating detached dwellings. As Buckland Park’s centres and services become more established, more medium density housing, and high needs housing, such as aged care, will be provided. The mix of each stage will be established during its detailed planning and design, however this process will be guided by the Masterplan.
4.7 Non-Residential Facilities
The availability of non-residential facilities will improve Buckland Park’s attractiveness to potential residents. Buckland Park will provide a wide range of facilities and services to provide for the social and employment needs of its new residents. These may include the following:
• Education > Pre-school > Primary education > Secondary education > Private and Government schools > TAFE or University Campus (single discipline) • Community Services > Child Care Centres > Library > Neighbourhood House > Meeting Rooms > Worship Centres > Aged Care Facilities • Retailing > Local Centres > Neighbourhood Centres > District Centre > Bulky Goods Precinct > Growers Market • Commercial Services > Sales Office / Display Centre (with community services / meetings capability) > Professional Services > Post Offices > Banks / Financial Institutions > Offices > Motel / short stay accommodation • Recreation Facilities > Sports Clubs > Gymnasiums > Bowling > Squash > Recreation Centre
BUCKLAND PARK URBAN AREA – LAND SUPPLY / DEMAND ANALYSIS PAGE 28 992-153
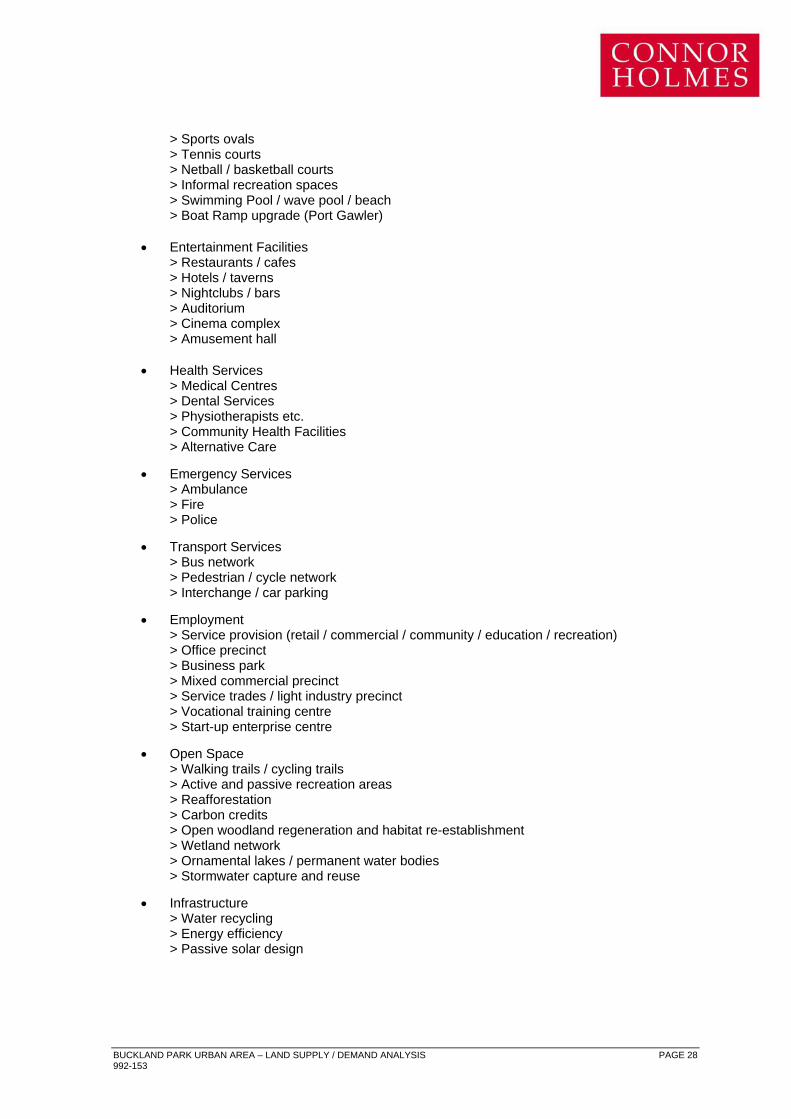
> Sports ovals > Tennis courts > Netball / basketball courts > Informal recreation spaces > Swimming Pool / wave pool / beach > Boat Ramp upgrade (Port Gawler) • Entertainment Facilities > Restaurants / cafes > Hotels / taverns > Nightclubs / bars > Auditorium > Cinema complex > Amusement hall • Health Services > Medical Centres > Dental Services > Physiotherapists etc. > Community Health Facilities > Alternative Care • Emergency Services > Ambulance > Fire > Police • Transport Services > Bus network > Pedestrian / cycle network > Interchange / car parking • Employment > Service provision (retail / commercial / community / education / recreation) > Office precinct > Business park > Mixed commercial precinct > Service trades / light industry precinct > Vocational training centre > Start-up enterprise centre • Open Space > Walking trails / cycling trails > Active and passive recreation areas > Reafforestation > Carbon credits > Open woodland regeneration and habitat re-establishment > Wetland network > Ornamental lakes / permanent water bodies > Stormwater capture and reuse • Infrastructure > Water recycling > Energy efficiency > Passive solar design
BUCKLAND PARK URBAN AREA – LAND SUPPLY / DEMAND ANALYSIS PAGE 29 992-153
Some of these facilities will be provided in Stage 1, including:
• A small supermarket for convenience shopping. The proponent will negotiate suitable
lease agreements with potential tenants, in the event a supermarket is not financially viable at opening;
• A community space equipped with office and meeting facilities – a community worker will be based in the space;
• Six specialty shops suitable for a café, private medical and dental surgeries and other small businesses;
• A sales and display centre;
• Landscaping, including an entry statement and children’s playground. The second phase will be constructed when demand for additional facilities is generated by new residents occupying Stage 1, or during later phases. It will include additional community space, additional supermarket space and four additional specialty shops. Within the neighbourhood centre, an “extension area” has been included for other private facilities, for example, a childcare centre, recreation facilities, a hotel, offices, or housing.

BUCKLAND PARK URBAN AREA – LAND SUPPLY / DEMAND ANALYSIS PAGE 30 992-153
5. CONCLUSION
Demand for housing in Adelaide has steadily increased, while the supply of suitable zoned land has been limited. Demand has been fuelled by a steadily increasing growth rate. In 2008, population was growing at a rate 2-3 times faster than in the 1990s. It is anticipated the State's population will grow from 1.6 million in 2008, to 2 million by 2027. Greater Metropolitan Adelaide is projected to grow by 547,000 people and 255,000 dwellings in the 30 years from 2006 to 2036. To support this level of population growth, an average of 8,500 additional dwellings will be required in Greater Metropolitan Adelaide each year, for the next 30 years. In a regional context, growth in the Metropolitan Adelaide’s northern region and the Barossa Region are expected to be strong and substantially above Greater Metropolitan Adelaide’s overall growth rates.
These areas have already seen a rise in housing approvals, and improvements to infrastructure will make the region more attractive. While land prices are influenced by a range of factors, the strength of demand coupled with restricted supply have contributed to a rapid escalation in prices. Therefore, strong land price increases can at least be partially addressed by a substantive increase in the supply of land.
The supply of housing land and competition in the residential market provided by Buckland Park will therefore contribute to restraining house prices in Adelaide. Buckland Park’s role in supplying land and satisfying demand must be considered within the context of strategic growth in the Greater Adelaide Region. As an outcome of the Planning Review, the SA Government is targeting 70% of the new housing needed by 2036 to be provided in infill sites in established suburbs, with 30% provided in new suburbs. It is considered 70% of new housing in established suburbs is an ambitious target. However, it may be possible to improve the land supply from infill sites in established areas to beyond 60%, if appropriate renewal sites are found, and the creation of TODs is successful. It is likely the 30% - 40% of housing to be provided in new suburbs will be focused in Metropolitan Adelaide’s northern region, which has more suitable, available land and considerably better access to employment, infrastructure, and future infrastructure. As new suburbs are established in the northern region, they will draw in more infrastructure, employment and services, providing a catalyst for the creation of additional suburbs. For the period 2006-2036, demand for housing at Buckland Park is predicted to be approximately 13% of total dwellings required in the Northern Adelaide and Barossa Regions, with a peak demand of approximately 25% per annum. At its peak, Golden Grove provided 30-40% of the lots demanded by the northern region’s market. Therefore it is not expected Buckland Park will artificially distort the residential land market by providing more lots than the market demands.

BUCKLAND PARK URBAN AREA – LAND SUPPLY / DEMAND ANALYSIS PAGE 31 992-153
Given the high demand for new housing anticipated in Metropolitan Adelaide’s northern region, it is considered Buckland Park can be absorbed into the residential land market without impacting on the demand for residential land in Blakeview, Playford North and Penfield. Given its existing limited potential and the difficulties of creating new residential areas in Virginia, is anticipated residential growth in Virginia will be slow, irrespective of Buckland Park. Angle Vale also has limited growth potential, but in any case as a predominately large lot residential area, it will not compete with Buckland Park, and vice versa. Buckland Park has an area of 1,308 hectares. Excluding land needed for roads, non-residential uses and environmental constraints, there will be approximately 600 hectares of residential land, capable of accommodating 12,000 dwellings. Detailed planning of future stages will confirm yields, but at this stage in the design process, these figures have been adopted for planning purposes. Buckland Park will accommodate a range of neighbourhood and dwelling types, at different densities
An average of 480 dwellings are expected to be constructed per annum at Buckland Park, and this figure has been used to inform transport, centres and services planning. However, the actual rate achieved will be influenced by a combination of factors, including the strength of demand and the creation of other new suburbs.
Buckland Park will provide housing which suits a range of people and households in different age and income brackets, so a range of housing types is planned. Detailed design of future stages will undoubtedly include changes and refinements, however, will be guided by the Masterplan. Housing and allotment types range from large detached housing, to attached housing, apartments and shop top housing. The proportion of detached to attached housing is similar to the mix achieved over Metropolitan Adelaide, with a slightly higher emphasis on detached housing.
The desired character of new neighbourhoods, and the accessibility to centres and public transport will inform the final mix of housing within each stage, however, this processes will be guided by the Masterplan. The housing mix provides for a wide cross-section of the community, and reflects the ability of Buckland Park to accommodate a wide range of housing types, at different prices, as a result of its significant scale. Medium density housing is more likely to be provided in later stages when Buckland Park’s centres and services are more established. In summary, Adelaide’s Greater Metropolitan Area requires substantial quantities of new housing over the next 30 years. 30%- 40% will be provided in new suburbs. Buckland Park will make a major contribution to the provision of the required housing.

BUCKLAND PARK URBAN AREA – LAND SUPPLY / DEMAND ANALYSIS PAGE 32 992-153
6. REFERENCES
Connor Holmes Buckland Park Demographics Report 2008 Connor Holmes Buckland Park Planning Report 2008a Connor Holmes Buckland Park Centres Planning 2008b Connor Holmes Buckland Park Social Analysis 2008c Connor Holmes Buckland Park Affordable Housing 2008d South Australia Government Planning Strategy for Metropolitan Adelaide December 2007 Department of Planning and Local Government (DPLG) Forecast Dwellings in Greater Adelaide by Statistical Local Area and State Government Region, 2007 to 2021 Department of Planning and Local Government (DPLG) Forecast Population and Dwellings for Greater Adelaide, 2006 to 2036 Minister for Urban Development and Planning, Directions for Creating a New Plan for Greater Adelaide, 2008 RP Data – Valuer General, Residential and Vacant Allotment Sales

BUCKLAND PARK URBAN AREA – LAND SUPPLY / DEMAND ANALYSIS PAGE 33 992-153
7. GLOSSARY ERP Estimated Resident Population LGA: Local Government Area