land surface verification toolkit (lvt) - nasa · land surface verification toolkit (lvt)!! lvt...
TRANSCRIPT

Land surface Verification Toolkit (LVT)!
! LVT is a framework developed to provide an automated, consolidated environment for systematic land surface model evaluation!
! Includes support for a range of in-situ, remote-sensing and other model and reanalysis products. !
! Supports the analysis of outputs from various LIS subsystems, including LIS-DA, LIS-OPT, LIS-UE!
Kumar et al. (2012), Land surface Verification Toolkit (LVT) – A generalized framework for land surface model evaluation, Geosci. Model. Dev. !
https://ntrs.nasa.gov/search.jsp?R=20170005517 2018-05-30T23:43:23+00:00Z
Design of LVT!
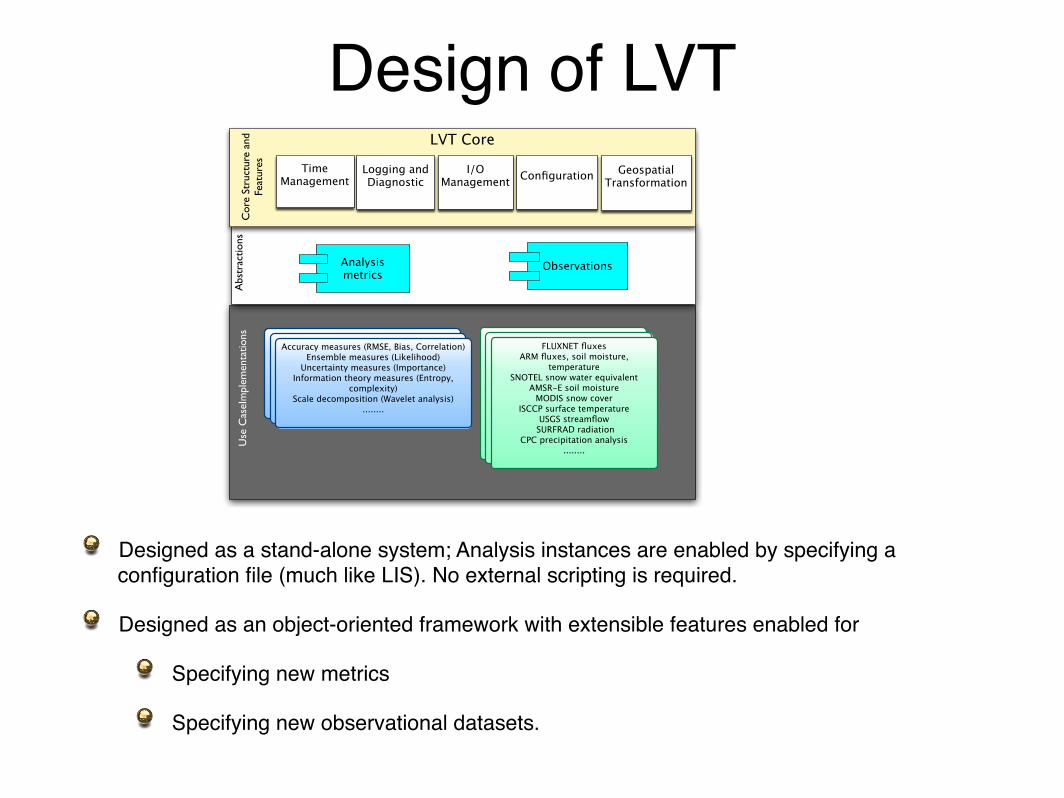
! Designed as a stand-alone system; Analysis instances are enabled by specifying a configuration file (much like LIS). No external scripting is required. !
! Designed as an object-oriented framework with extensible features enabled for !
! Specifying new metrics!
! Specifying new observational datasets. !
872 S. V. Kumar et al.: Land surface Verification Toolkit
LVT Core
Time Management
Logging andDiagnostic Configuration Geospatial
TransformationI/O
Management
Cor
e St
ruct
ure
and
Feat
ures
Abs
trac
tions
Use
Cas
eIm
plem
enta
tions FLUXNET fluxes
ARM fluxes, soil moisture, temperature
SNOTEL snow water equivalentAMSR-E soil moisture
MODIS snow coverISCCP surface temperature
USGS streamflow SURFRAD radiation
CPC precipitation analysis........
FLUXNET fluxesARM fluxes, soil moisture,
temperatureSNOTEL snow water equivalent
AMSR-E soil moistureMODIS snow cover
ISCCP surface temperature USGS streamflow
SURFRAD radiationCPC precipitation analysis
........
FLUXNET fluxesARM fluxes, soil moisture,
temperatureSNOTEL snow water equivalent
AMSR-E soil moistureMODIS snow cover
ISCCP surface temperature USGS streamflow
SURFRAD radiationCPC precipitation analysis
........
Accuracy measures (RMSE, Bias, Correlation)Ensemble measures (Likelihood)
Uncertainty measures (Importance)Information theory measures (Entropy,
complexity)Scale decomposition (Wavelet analysis)
........
Accuracy measures (RMSE, Bias, Correlation)Ensemble measures (Likelihood)
Uncertainty measures (Importance)Information theory measures (Entropy,
complexity)Scale decomposition (Wavelet analysis)
........
Accuracy measures (RMSE, Bias, Correlation)Ensemble measures (Likelihood)
Uncertainty measures (Importance)Information theory measures (Entropy,
complexity)Scale decomposition (Wavelet analysis)
........
Analysis metrics
Observations
Fig. 2. Three-layer software architecture of Land surface Verification Toolkit (LVT)
27
Fig. 2. Three-layer software architecture of Land surface Verification Toolkit (LVT).
in-situ and remote sensing measurements are presented inRodell et al. (2004a) and Kato et al. (2007). The LandFlux-EVAL project, a more recent initiative, evaluated evapotran-spiration estimates from a number of LSMs against in-situdata based estimates (Jiminez et al., 2011). Approaches todefine a minimum acceptable performance benchmark ofLSMs by comparing them to calibrated noncausal (statisti-cal/correlational) models are explored in Abramowitz et al.(2008). Though these efforts cover a wide spectrum of modelevaluation and benchmarking of model process advance-ments, the evaluation criteria and the performance metricstend to be specific to each application. LVT consolidates therequirements identified in these efforts within a single frame-work.A number of software environments for conducting model
verification has been reported in the literature. The Ensem-ble Verification System (EVS; Brown et al., 2010) developedat the US National Oceanic and Atmospheric Administra-tion’s (NOAA) Office of Hydrologic Development (OHD)provides an environment to verify ensemble forecasts ofhydrologic and atmospheric variables such as precipitation,temperature and streamflow, and is used by forecasters at theUS River Forecast Centers (RFCs). Protocol for the Anal-ysis of Land Surface models (PALS) is a web-based appli-cation for evaluating land surface models against observeddatasets and calibrated statistical models (Abramowitz et al.,2008). LVT and PALS will continue to be developed con-currently to address community goals for benchmarking andMDF. Model Evaluation Toolkit (MET; Brown et al., 2009)
is a system developed by the Developmental Testbed Cen-ter (DTC) for the numerical weather prediction community toevaluate model performance. MET includes several methodsfor the diagnostic and spatial verification of NWPmodel out-puts. However, MET requires that the input datasets (modeloutput and the observational data) be reformatted to certainpredefined file formats. LVT shares many features with theseexisting environments, but focuses on the native use of obser-vational and model data sets, since the interpretation of thedata formats and reporting procedures is a critical and timeconsuming step in the evaluation process. LVT is designedas a framework that can be directly used and extended by theindividual users and also includes a number of advanced fea-tures such as the evaluation of data assimilation diagnostics,standardized land surface diagnostics and uncertainty and in-formation theory based analysis features. The following sec-tions describe the design and capabilities of LVT.
3 Design of the LVT framework
LVT is implemented using object oriented framework de-sign principles as a modular, extensible and reusable system.The software architecture of the system follows a three layerstructure, as shown in Fig. 2. LVT core, the top layer, encom-passes generic modeling features, such as the managementof time, I/O, configuration, logging and geospatial transfor-mations. The middle layer, called “Abstractions” representsthe extensible interfaces defined for incorporating additionalfunctionalities into LVT. These include plugin interfaces for
Geosci. Model Dev., 5, 869–886, 2012 www.geosci-model-dev.net/5/869/2012/

Observational data support – A growing list!874 S. V. Kumar et al.: Land surface Verification Toolkit
Table 1. List of datasets supported in LVT.
Dataset Measurementvariables
Model/reanalysis outputs
Agricultural Meteorology Water and energy fluxes,Model (AGRMET) from the Soil moisture, soil temperature,Air Force Weather Agency (AFWA) Snow conditions, meteorology
NLDAS model outputs Water and energy fluxesMitchell et al. (2004) Soil moisture, soil temperature,
snow conditions, meteorology
GLDAS model outputs Water and energy fluxes,Rodell et al. (2004b) Soil moisture, soil temperature,
snow conditions, meteorology
Canadian Meteorological Center Snow depth(CMC) snow depth analysisBrown and Brasnett (2010)
Snow Data Assimilation System Snow depth, snow waterSNODAS; Barrett (2003) equivalent
In-situ measurements
AMMA Water and energy fluxes,(database.amma-international.org/) soil moisture, soil temperature
Atmospheric Radiation Water and energy fluxes,Measurement (ARM) Soil moisture, soil temperature,(www.arm.gov) meteorology
Ameriflux Water and energy fluxes(public.ornl.gov/ameriflux/)
Coordinated Energy and water cycle Water and energy fluxes,Observations Project (CEOP) soil moisture, soil temperature,(www.ceop.net/) meteorology
National Weather Service Snow depth, precipitation,Cooperative Observer Program (COOP) land surface temperature(www.nws.noaa.gov/om/coop/)
NOAA CPC unified PrecipitationHiggins et al. (1996)
Gridded FLUXNET Water and energy fluxesJung et al. (2009)
Finnish Meteorological Institute Snow water equivalentFMI/SYKE; www.environment.fi/syke
Global Summary of the Day (GSOD) Snow depth
International Soil Moisture Network Soil moisture(www.ipf.tuwien.ac.at/insitu/)
Soil Climate Analysis Network Soil moisture(SCAN; www.wcc.nrcs.usda.gov/scan/) Soil temperature
Geosci. Model Dev., 5, 869–886, 2012 www.geosci-model-dev.net/5/869/2012/
S. V. Kumar et al.: Land surface Verification Toolkit 875
Table 1. Continued.
WMO synoptic observations Snow depth
NRCS SNOwpack TELemetry network Snow water equivalent(SNOTEL; www.wcc.nrcs.usda.gov/snow/)
Surface Radiation Network (SURFRAD) Downwelling shortwave,(www.srrb.noaa.gov/surfrad/) downwelling longwave
Southwest Watershed Research Center Soil moisture,(SWRC; www.tucson.ars.ag.gov/dap/) soil temperature
USGS water data Streamflow(waterdata.usgs.gov/nwis)
AMSR-E radiances Brightness temperature for(mrain.atmos.colostate.edu/LEVEL1C/) different channels
Satellite and remote sensing data
AFWA NASA Snow Algorithm Snow cover, snow depth,ANSA; Foster et al., 2011 snow water equivalent
GlobSnow; Pulliainen (2006) Snow cover,(www.globsnow.info/) snow water equivalent
International Satellite Cloud Climatology Land surface temperatureProject; ISCCP; Rossow and Schiffer (1991)(isccp.nasa.gov)
MODIS/Terra Snow cover 500m Snow coverMOD10A1; Hall et al. (2006)
MODIS Evapotranspiration product EvapotranspirationMOD16; Mu et al. (2007)
NASA Level-3, soil moisture Soil moistureretrieval from AMSR-E (AE�Land3)Njoku et al. (2003)
Land Parameter Retrieval Model (LPRM) Soil moisturefrom NASA GSFC and VU AmsterdamOwe et al. (2008)
may also differ significantly based on the targeted applica-tion (Gupta et al., 2009). Model evaluation studies quite of-ten use accuracy-based metrics that quantify model perfor-mance using residual-based measures. These metrics, how-ever, may not provide further insights on the robustness ofthe model under future or unobserved scenarios (Pachepskyet al., 2006). They are also inadequate in capturing estimatesof associated uncertainties (Gulden et al., 2008), relative im-portance and sensitivity of model parameters to the overallaccuracy and uncertainty, tradeoffs in performance due tospatial scales and the tradeoffs between actual informationcontent and variabilities introduced by random noise. Guptaet al. (2008) emphasize the need for sophisticated diagnosticevaluation methods that help in isolating the limitations ofthe model representations.A number of analysis metric types is supported in
LVT including (1) statistical accuracy measures that are
conventionally used for model evaluation by comparing themodel simulation against independent measurements and ob-servations (e.g., RMSE, Bias), (2) ensemble measures thatprovide assessments of the accuracy of probabilistic modeloutputs against observations, (3) metrics that help in quan-tifying the apportionment of uncertainty and sensitivity ofmodel simulations to model parameters, (4) informationtheory-based measures that provide estimates of informationcontent and complexity associated with model simulationsand measurements, (5) spatial similarity and scale decompo-sition methods that assist in quantifying the impact of spatialscales in model improvements and errors and (6) standarddiagnostics to evaluate the efficiency of computational algo-rithms such as data assimilation. Table 2 presents a list ofsupported metric implementations within LVT. The details ofthe metric implementations are discussed in Sect. 5 through anumber of illustrative examples. The availability of this suite
www.geosci-model-dev.net/5/869/2012/ Geosci. Model Dev., 5, 869–886, 2012
874 S. V. Kumar et al.: Land surface Verification Toolkit
Table 1. List of datasets supported in LVT.
Dataset Measurementvariables
Model/reanalysis outputs
Agricultural Meteorology Water and energy fluxes,Model (AGRMET) from the Soil moisture, soil temperature,Air Force Weather Agency (AFWA) Snow conditions, meteorology
NLDAS model outputs Water and energy fluxesMitchell et al. (2004) Soil moisture, soil temperature,
snow conditions, meteorology
GLDAS model outputs Water and energy fluxes,Rodell et al. (2004b) Soil moisture, soil temperature,
snow conditions, meteorology
Canadian Meteorological Center Snow depth(CMC) snow depth analysisBrown and Brasnett (2010)
Snow Data Assimilation System Snow depth, snow waterSNODAS; Barrett (2003) equivalent
In-situ measurements
AMMA Water and energy fluxes,(database.amma-international.org/) soil moisture, soil temperature
Atmospheric Radiation Water and energy fluxes,Measurement (ARM) Soil moisture, soil temperature,(www.arm.gov) meteorology
Ameriflux Water and energy fluxes(public.ornl.gov/ameriflux/)
Coordinated Energy and water cycle Water and energy fluxes,Observations Project (CEOP) soil moisture, soil temperature,(www.ceop.net/) meteorology
National Weather Service Snow depth, precipitation,Cooperative Observer Program (COOP) land surface temperature(www.nws.noaa.gov/om/coop/)
NOAA CPC unified PrecipitationHiggins et al. (1996)
Gridded FLUXNET Water and energy fluxesJung et al. (2009)
Finnish Meteorological Institute Snow water equivalentFMI/SYKE; www.environment.fi/syke
Global Summary of the Day (GSOD) Snow depth
International Soil Moisture Network Soil moisture(www.ipf.tuwien.ac.at/insitu/)
Soil Climate Analysis Network Soil moisture(SCAN; www.wcc.nrcs.usda.gov/scan/) Soil temperature
Geosci. Model Dev., 5, 869–886, 2012 www.geosci-model-dev.net/5/869/2012/
S. V. Kumar et al.: Land surface Verification Toolkit 875
Table 1. Continued.
WMO synoptic observations Snow depth
NRCS SNOwpack TELemetry network Snow water equivalent(SNOTEL; www.wcc.nrcs.usda.gov/snow/)
Surface Radiation Network (SURFRAD) Downwelling shortwave,(www.srrb.noaa.gov/surfrad/) downwelling longwave
Southwest Watershed Research Center Soil moisture,(SWRC; www.tucson.ars.ag.gov/dap/) soil temperature
USGS water data Streamflow(waterdata.usgs.gov/nwis)
AMSR-E radiances Brightness temperature for(mrain.atmos.colostate.edu/LEVEL1C/) different channels
Satellite and remote sensing data
AFWA NASA Snow Algorithm Snow cover, snow depth,ANSA; Foster et al., 2011 snow water equivalent
GlobSnow; Pulliainen (2006) Snow cover,(www.globsnow.info/) snow water equivalent
International Satellite Cloud Climatology Land surface temperatureProject; ISCCP; Rossow and Schiffer (1991)(isccp.nasa.gov)
MODIS/Terra Snow cover 500m Snow coverMOD10A1; Hall et al. (2006)
MODIS Evapotranspiration product EvapotranspirationMOD16; Mu et al. (2007)
NASA Level-3, soil moisture Soil moistureretrieval from AMSR-E (AE�Land3)Njoku et al. (2003)
Land Parameter Retrieval Model (LPRM) Soil moisturefrom NASA GSFC and VU AmsterdamOwe et al. (2008)
may also differ significantly based on the targeted applica-tion (Gupta et al., 2009). Model evaluation studies quite of-ten use accuracy-based metrics that quantify model perfor-mance using residual-based measures. These metrics, how-ever, may not provide further insights on the robustness ofthe model under future or unobserved scenarios (Pachepskyet al., 2006). They are also inadequate in capturing estimatesof associated uncertainties (Gulden et al., 2008), relative im-portance and sensitivity of model parameters to the overallaccuracy and uncertainty, tradeoffs in performance due tospatial scales and the tradeoffs between actual informationcontent and variabilities introduced by random noise. Guptaet al. (2008) emphasize the need for sophisticated diagnosticevaluation methods that help in isolating the limitations ofthe model representations.A number of analysis metric types is supported in
LVT including (1) statistical accuracy measures that are
conventionally used for model evaluation by comparing themodel simulation against independent measurements and ob-servations (e.g., RMSE, Bias), (2) ensemble measures thatprovide assessments of the accuracy of probabilistic modeloutputs against observations, (3) metrics that help in quan-tifying the apportionment of uncertainty and sensitivity ofmodel simulations to model parameters, (4) informationtheory-based measures that provide estimates of informationcontent and complexity associated with model simulationsand measurements, (5) spatial similarity and scale decompo-sition methods that assist in quantifying the impact of spatialscales in model improvements and errors and (6) standarddiagnostics to evaluate the efficiency of computational algo-rithms such as data assimilation. Table 2 presents a list ofsupported metric implementations within LVT. The details ofthe metric implementations are discussed in Sect. 5 through anumber of illustrative examples. The availability of this suite
www.geosci-model-dev.net/5/869/2012/ Geosci. Model Dev., 5, 869–886, 2012

Metrics development in LVT!! A large suite of analysis metrics, including accuracy-
based metrics, ensemble and uncertainty measures, information theory metrics and similarity measures has been built into LVT!
Metric Class! Examples!
Accuracy metrics! RMSE, Bias, Correlation!
Ensemble metrics! Mean, Standard deviation, Likelihood!
Uncertainty metrics! Uncertainty importance!
Information theory metrics!
Entropy, Complexity!
Data assimilation metrics!
Mean, variance, lag correlations of innovation distributions!
Spatial similarity metrics! Hausdorff distance!
Scale decomposition metrics!
Discrete wavelet transforms!
NASA AMSR-E!
LPRM AMSR-E!Metric entropy provides a measure of the randomness in the soil moisture time series at each grid point. The availability of information theory metrics in LVT provides a way to discriminate model simulations based on their information content. !!
Change in Metric entropy as a result of the assimilation of soil moisture retrievals of AMSR-E from NASA and LPRM algorithms!

Capabilities!! LVT reconciles the differences in spatial and temporal resolutions by bringing the model (LIS)
and observational datasets to a common (user-specified) space and time domain. !
! Support for datasets in their “native” formats; Once the specific plugin to process a particular dataset is built, datasets can be directly employed within LVT. E.g. ARM-CART measurements. !
! Supports non-LIS datasets for intercomparisons – (An observational processing mode in LVT enables the conversion of an external dataset to a “LIS like” form. !
! Miscellaneous: !
! Confidence intervals on analysis statistics!
! Analysis outputs in ASCII, binary, GriB, NETCDF formats!
! Probability density functions of computed metrics!
! Stratify analysis by external datasets!
! Stratify analysis based on a model variable (e.g. day-night stratification)!
! Land surface diagnostics!

lvt.config !Running mode supports LSM intercomparisons/added analysis, analysis of DA diagnostics, processing of observational datasets. !!Supports the analysis of both LSM and other surface model outputs!!Supports all output formats and styles (grid/vector/ensemble) from LIS!!
The analysis time period is a subset of the LIS output !!Allows analysis restarts – for long analysis integrations. !

lvt.config !The analysis domain can be a subset of the LIS output domain!!LVT supports both upscaling and downscaling of the LIS outputs!
!The attributes file specifies the variables included in the analysis!
!The first column indicates the variables included in the LIS output; the last column indicates the variables that needs to be included in the LVT analysis (LIS output contains Qle, Qh, Qg, LVT output contains Qle and Qh)!

lvt.config !
!Supports external masks; A variety of metrics; !Pixel-by-pixel and basin-scale averaging and computation of metrics!Use of water years, temporal smoothing, lagged computations!

Analysis of LIS-DA outputs!
! Deviations from the expected mean and standard deviations of the normalized innovation distribution is used as a measure of the optimality of the data assimilation configuration. !
Model evaluation and verification are essential processes in the development and application of all simulation models. The process of systematic model evaluation and verification helps in the characterization of accuracy and uncertainty in model predictions and helps in improving the usage and acceptability of model outputs for real-world applications. "
The Land surface Verification Toolkit (LVT) is a framework developed to provide an automated, consolidated environment for intercomparing disparate datasets and for conducting both deterministic and probabilistic evaluation of land surface model (LSM) and data assimilation outputs. "
LVT is primarily built as a post-processor to the NASA Land Information System (LIS; http://lis.gsfc.nasa.gov; Kumar et al. 2006, Peters-Lidard et al. 2007), which is a
comprehensive land surface modeling and data assimilation framework."
LIS includes several subsystems to exploit the information content of observational data products for improving model predictions, including data assimilation, optimization and uncertainty estimation, radiative transfer and emission models and various end-use application models. LVT supports the analysis of outputs from these subsystems by connecting them to the relevant observational data. Together, LIS and LVT encompass a comprehensive set of computational tools for enabling end-to-end Model Data Fusion (MDF) experiments."
The development of a formal, systematic environment for model evaluation is expected to aid in bridging the gaps between the model and observations and in improving the “observability” of LSM outputs. "
Land surface Verification Toolkit (LVT): "A formal benchmarking and evaluation framework for land surface models"
Sujay V. Kumara,b, Christa D. Peters-Lidardb, Joseph A. Santanellob,"Kenneth W. Harrisonb,c,Yuqiong Liub,c and Michael Shawa,b,d"
aScience Applications International Corporation, McLean, VA. "bHydrological Sciences Branch, NASA Goddard Space Flight Center, Greenbelt, MD."cEarth System Science Interdisciplinary Center, University of Maryland, College Park, MD. "dAir Force Weather Agency, Offutt, NE. "
0
0.1
0.2
0.3
0.4
0.5
2010/05 2010/06 2010/07 2010/08 2010/09
Soil
Moi
stur
e (m
3/m
3)
Ensemble MeanObs
0
0.5
1
1.5
2010/05 2010/06 2010/07 2010/08 2010/09
Unc
erta
inty
Impo
rtanc
e (-
)
θsΨsKs
b
We gratefully acknowledge the financial support from the US Air Force Weather Agency (AFWA) and the NASA Earth Science Technology Office (ESTO)."
0
5
10
15
20
25
30
35
1 2 4 8 16 32 64 128 256 512 1024
Per
cent
age
cont
ribut
ion
Spatial Scale (KM)
Kumar, S.V., C.D. Peters-Lidard, J.A. Santanello, K.W. Harrison, Yuqiong Liu and Michael Shaw (2012), “Land surface Verification Toolkit (LVT): A generalized framework for land surface model evaluation, submitted to Geosci. Model. Dev."
LVT software is designed as an object-oriented framework with extensible interfaces for incorporating observational datasets and analysis metrics. "
LVT currently supports an array of terrestrial hydrology datasets from in-situ measurements, satellite and remote-sensing platforms, and model and reanalysis products, representing a wide range of land surface and terrestrial hydrologic regimes across the globe. These datasets are supported in their native formats and LVT handles the temporal and spatial transformations required in the analysis. "
LVT also supports a large suite of analysis metrics. In addition to the traditional accuracy-based measures, LVT supports ensemble and uncertainty measures, metrics based on information theory, similarity metrics
and methods to quantify the impact of spatial scales on model performance. "
Metric Class" Examples"Accuracy metrics" RMSE, Bias, Correlation"Ensemble metrics" Mean, Standard deviation,
Likelihood"Uncertainty metrics"
Uncertainty importance"
Information theory metrics"
Entropy, Complexity"
Data assimilation metrics"
Mean, variance, lag correlations of innovation distributions"
Spatial similarity metrics"
Hausdorff distance"
Scale decomposition metrics"
Discrete wavelet transforms"
EXAMPLES!Evaluation of surface flux estimates from LDAS simulations against ARM measurements . "
Mean diurnal cycles of latent and sensible heat fluxes from the offline Noah LSM (version 3.2) evaluated across ARM stations in the Southern Great Plains using default and calibrated model parameters for the period of April – September, 2006. "
-100
-50
0
50
100
150
200
250
300
350
0 5 10 15 20 25
Sen
sibl
e H
eat F
lux
(W/m
2)
Hour
DEFAULTCALIBRATED
OBS
0
50
100
150
200
250
300
0 5 10 15 20 25
Late
nt H
eat F
lux
(W/m
2)
Hour
DEFAULTCALIBRATED
OBS
The LSM simulations with default parameters show large errors, with a significant underestimation in latent heat fluxes and an overestimation in sensible heat fluxes. The calibration of model parameters helps in improving the model performance by correcting these systematic biases. This example illustrates an instance of the MDF paradigm that includes model characterization, reformulation through parameter estimation and verification using LVT. $
Model evaluation using remotely-sensed data over an uninstrumented region"
Probability of detection (POD) of snow cover estimates from Noah LSM (version 2.7.1), for a three year time period of 1 Oct 2007 to 1 May 2010, over Afghanistan. The POD values are computed by comparing the model estimates against the fractional snow extent global 500m product (MOD10A1) from the MODIS sensor on Terra spacecraft. "
This example provides an instance of model evaluation against satellite data over a region such as Afghanistan, where in-situ measurements are sparse. LVT facilitates model evaluation through the use of MODIS snow cover estimates. "
Analysis of data assimilation diagnostics "
Mean of normalized Innovations"
Variance of normalized Innovations"
Spatial distribution of the mean and variance of normalized innovations from a synthetic soil moisture data assimilation simulation. The experiment is conducted over the Continental U.S. domain at 1° spatial resolution, for a time period of 1 Jan 2000 to 1 Jan 2006. The synthetic soil moisture observations are assimilated using the Ensemble Kalman Filter (EnKF) algorithm. "
The metric entropy metric provides a measure of the randomness in the soil moisture time series at each grid point. The assimilation of NASA retrievals introduce more randomness in several parts of the modeling domain, whereas LPRM assimilation introduces less randomness. The availability of information theory metrics in LVT provides a way to discriminate model simulations based on their information content. $
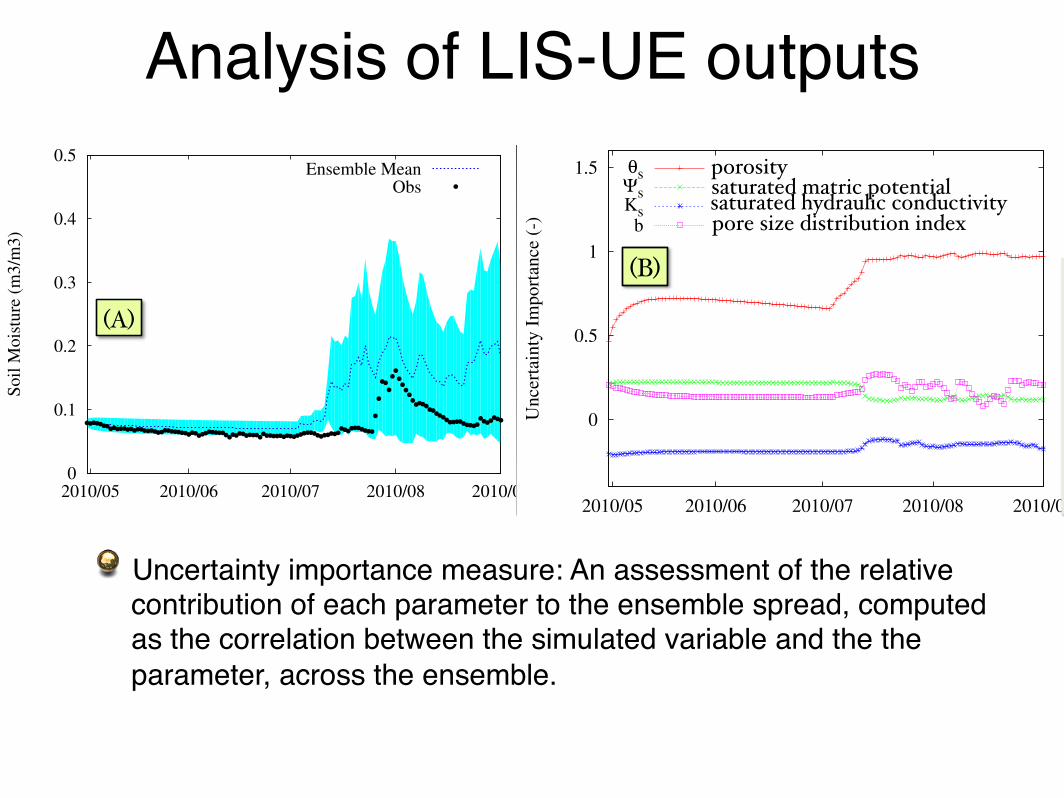
Characterization of uncertainty diagnostics "An ensemble model simulation is conducted using the Noah LSM (version 3.2) during 1 May to 1 September, 2010 over the Walnut Gulch watershed. The ensemble run is conducted by sampling 4 soil hydraulic properties from assumed prior distributions. "
(A) shows the time series comparison of the model simulation of surface soil moisture against in-situ observations. The cyan shading indicates the ensemble spread. (B) provides the uncertainty importance measure, which is an assessment of the relative contribution of each parameter to the ensemble spread. This metric is computed as the correlation between the simulated variable and the parameter, across the ensemble. "
(A) Indicates that soil moisture uncertainty is small during the dry period and grows significantly during the wet periods. (B) shows that among the four parameters, simulations are most sensitive to θs. LVT enables the quantification of parameter sensitivities for uncertainty simulations"
Information theory metrics"
Scale decomposition analysis"
Two simulations with Noah LSM (version 2.7.1) are conducted over a domain in Afghanistan at 1km spatial resolution to generate snow cover estimates: one that employs a terrain based correction of shortwave radiation input and one that does not include such adjustments. The improvement in POD as a result of the terrain correction is computed, and the scale decomposition technique is applied to this difference
field to quantify how the improvements at 1km spatial resolution translate to coarser scales. "
Intensity scale approach of Casati et al. (2004) using a two dimensional discrete Haar wavelet transform is used to decompose a spatial field into sum of orthogonal components at different spatial scales. "
(A)"
(B)"
porosity"saturated matric potential"saturated hydraulic conductivity"pore size distribution index"
Change in Metric entropy fields as a result of the assimilation of soil moisture retrievals of AMSR-E from NASA and LPRM. "
NASA AMSR-E"
LPRM AMSR-E"
The deviations from the expected mean and standard deviation of the normalized innovation distribution is used as a measure of the optimality of the data assimilation configuration. In this instance, a near optimal performance is observed (mean close to zero, variance close to 1). The assimilation diagnostics can be processed through LVT and the model and observation error specifications can be revised to ensure optimal data assimilation performance. "
The percentage contribution to the total POD improvement at each spatial scale is shown. Most improvements are obtained at fine spatial scales and the contribution of the scale drops to below 10% at scales coarser than 16km. $
26th Conference on Hydrology, 92nd American Meteorological Society Annual Meeting, January 22-26, 2012, New Orleans, LA."
ACKNOWLEDGEMENTS$
Em
ail:
Suj
ay.V
.Kum
ar@
nasa
.gov
, w
eb: h
ttp:
//li
s.gsf
c.n.
asa.
gov
"
Model evaluation and verification are essential processes in the development and application of all simulation models. The process of systematic model evaluation and verification helps in the characterization of accuracy and uncertainty in model predictions and helps in improving the usage and acceptability of model outputs for real-world applications. "
The Land surface Verification Toolkit (LVT) is a framework developed to provide an automated, consolidated environment for intercomparing disparate datasets and for conducting both deterministic and probabilistic evaluation of land surface model (LSM) and data assimilation outputs. "
LVT is primarily built as a post-processor to the NASA Land Information System (LIS; http://lis.gsfc.nasa.gov; Kumar et al. 2006, Peters-Lidard et al. 2007), which is a
comprehensive land surface modeling and data assimilation framework."
LIS includes several subsystems to exploit the information content of observational data products for improving model predictions, including data assimilation, optimization and uncertainty estimation, radiative transfer and emission models and various end-use application models. LVT supports the analysis of outputs from these subsystems by connecting them to the relevant observational data. Together, LIS and LVT encompass a comprehensive set of computational tools for enabling end-to-end Model Data Fusion (MDF) experiments."
The development of a formal, systematic environment for model evaluation is expected to aid in bridging the gaps between the model and observations and in improving the “observability” of LSM outputs. "
Land surface Verification Toolkit (LVT): "A formal benchmarking and evaluation framework for land surface models"
Sujay V. Kumara,b, Christa D. Peters-Lidardb, Joseph A. Santanellob,"Kenneth W. Harrisonb,c,Yuqiong Liub,c and Michael Shawa,b,d"
aScience Applications International Corporation, McLean, VA. "bHydrological Sciences Branch, NASA Goddard Space Flight Center, Greenbelt, MD."cEarth System Science Interdisciplinary Center, University of Maryland, College Park, MD. "dAir Force Weather Agency, Offutt, NE. "
0
0.1
0.2
0.3
0.4
0.5
2010/05 2010/06 2010/07 2010/08 2010/09
Soil
Moi
stur
e (m
3/m
3)
Ensemble MeanObs
0
0.5
1
1.5
2010/05 2010/06 2010/07 2010/08 2010/09
Unc
erta
inty
Impo
rtanc
e (-
)
θsΨsKs
b
We gratefully acknowledge the financial support from the US Air Force Weather Agency (AFWA) and the NASA Earth Science Technology Office (ESTO)."
0
5
10
15
20
25
30
35
1 2 4 8 16 32 64 128 256 512 1024
Per
cent
age
cont
ribut
ion
Spatial Scale (KM)
Kumar, S.V., C.D. Peters-Lidard, J.A. Santanello, K.W. Harrison, Yuqiong Liu and Michael Shaw (2012), “Land surface Verification Toolkit (LVT): A generalized framework for land surface model evaluation, submitted to Geosci. Model. Dev."
LVT software is designed as an object-oriented framework with extensible interfaces for incorporating observational datasets and analysis metrics. "
LVT currently supports an array of terrestrial hydrology datasets from in-situ measurements, satellite and remote-sensing platforms, and model and reanalysis products, representing a wide range of land surface and terrestrial hydrologic regimes across the globe. These datasets are supported in their native formats and LVT handles the temporal and spatial transformations required in the analysis. "
LVT also supports a large suite of analysis metrics. In addition to the traditional accuracy-based measures, LVT supports ensemble and uncertainty measures, metrics based on information theory, similarity metrics
and methods to quantify the impact of spatial scales on model performance. "
Metric Class" Examples"Accuracy metrics" RMSE, Bias, Correlation"Ensemble metrics" Mean, Standard deviation,
Likelihood"Uncertainty metrics"
Uncertainty importance"
Information theory metrics"
Entropy, Complexity"
Data assimilation metrics"
Mean, variance, lag correlations of innovation distributions"
Spatial similarity metrics"
Hausdorff distance"
Scale decomposition metrics"
Discrete wavelet transforms"
EXAMPLES!Evaluation of surface flux estimates from LDAS simulations against ARM measurements . "
Mean diurnal cycles of latent and sensible heat fluxes from the offline Noah LSM (version 3.2) evaluated across ARM stations in the Southern Great Plains using default and calibrated model parameters for the period of April – September, 2006. "
-100
-50
0
50
100
150
200
250
300
350
0 5 10 15 20 25
Sen
sibl
e H
eat F
lux
(W/m
2)
Hour
DEFAULTCALIBRATED
OBS
0
50
100
150
200
250
300
0 5 10 15 20 25
Late
nt H
eat F
lux
(W/m
2)
Hour
DEFAULTCALIBRATED
OBS
The LSM simulations with default parameters show large errors, with a significant underestimation in latent heat fluxes and an overestimation in sensible heat fluxes. The calibration of model parameters helps in improving the model performance by correcting these systematic biases. This example illustrates an instance of the MDF paradigm that includes model characterization, reformulation through parameter estimation and verification using LVT. $
Model evaluation using remotely-sensed data over an uninstrumented region"
Probability of detection (POD) of snow cover estimates from Noah LSM (version 2.7.1), for a three year time period of 1 Oct 2007 to 1 May 2010, over Afghanistan. The POD values are computed by comparing the model estimates against the fractional snow extent global 500m product (MOD10A1) from the MODIS sensor on Terra spacecraft. "
This example provides an instance of model evaluation against satellite data over a region such as Afghanistan, where in-situ measurements are sparse. LVT facilitates model evaluation through the use of MODIS snow cover estimates. "
Analysis of data assimilation diagnostics "
Mean of normalized Innovations"
Variance of normalized Innovations"
Spatial distribution of the mean and variance of normalized innovations from a synthetic soil moisture data assimilation simulation. The experiment is conducted over the Continental U.S. domain at 1° spatial resolution, for a time period of 1 Jan 2000 to 1 Jan 2006. The synthetic soil moisture observations are assimilated using the Ensemble Kalman Filter (EnKF) algorithm. "
The metric entropy metric provides a measure of the randomness in the soil moisture time series at each grid point. The assimilation of NASA retrievals introduce more randomness in several parts of the modeling domain, whereas LPRM assimilation introduces less randomness. The availability of information theory metrics in LVT provides a way to discriminate model simulations based on their information content. $
Characterization of uncertainty diagnostics "An ensemble model simulation is conducted using the Noah LSM (version 3.2) during 1 May to 1 September, 2010 over the Walnut Gulch watershed. The ensemble run is conducted by sampling 4 soil hydraulic properties from assumed prior distributions. "
(A) shows the time series comparison of the model simulation of surface soil moisture against in-situ observations. The cyan shading indicates the ensemble spread. (B) provides the uncertainty importance measure, which is an assessment of the relative contribution of each parameter to the ensemble spread. This metric is computed as the correlation between the simulated variable and the parameter, across the ensemble. "
(A) Indicates that soil moisture uncertainty is small during the dry period and grows significantly during the wet periods. (B) shows that among the four parameters, simulations are most sensitive to θs. LVT enables the quantification of parameter sensitivities for uncertainty simulations"
Information theory metrics"
Scale decomposition analysis"
Two simulations with Noah LSM (version 2.7.1) are conducted over a domain in Afghanistan at 1km spatial resolution to generate snow cover estimates: one that employs a terrain based correction of shortwave radiation input and one that does not include such adjustments. The improvement in POD as a result of the terrain correction is computed, and the scale decomposition technique is applied to this difference
field to quantify how the improvements at 1km spatial resolution translate to coarser scales. "
Intensity scale approach of Casati et al. (2004) using a two dimensional discrete Haar wavelet transform is used to decompose a spatial field into sum of orthogonal components at different spatial scales. "
(A)"
(B)"
porosity"saturated matric potential"saturated hydraulic conductivity"pore size distribution index"
Change in Metric entropy fields as a result of the assimilation of soil moisture retrievals of AMSR-E from NASA and LPRM. "
NASA AMSR-E"
LPRM AMSR-E"
The deviations from the expected mean and standard deviation of the normalized innovation distribution is used as a measure of the optimality of the data assimilation configuration. In this instance, a near optimal performance is observed (mean close to zero, variance close to 1). The assimilation diagnostics can be processed through LVT and the model and observation error specifications can be revised to ensure optimal data assimilation performance. "
The percentage contribution to the total POD improvement at each spatial scale is shown. Most improvements are obtained at fine spatial scales and the contribution of the scale drops to below 10% at scales coarser than 16km. $
26th Conference on Hydrology, 92nd American Meteorological Society Annual Meeting, January 22-26, 2012, New Orleans, LA."
ACKNOWLEDGEMENTS$
Em
ail:
Suj
ay.V
.Kum
ar@
nasa
.gov
, w
eb: h
ttp:
//li
s.gsf
c.n.
asa.
gov
"
Analysis of LIS-UE outputs!
Model evaluation and verification are essential processes in the development and application of all simulation models. The process of systematic model evaluation and verification helps in the characterization of accuracy and uncertainty in model predictions and helps in improving the usage and acceptability of model outputs for real-world applications. "
The Land surface Verification Toolkit (LVT) is a framework developed to provide an automated, consolidated environment for intercomparing disparate datasets and for conducting both deterministic and probabilistic evaluation of land surface model (LSM) and data assimilation outputs. "
LVT is primarily built as a post-processor to the NASA Land Information System (LIS; http://lis.gsfc.nasa.gov; Kumar et al. 2006, Peters-Lidard et al. 2007), which is a
comprehensive land surface modeling and data assimilation framework."
LIS includes several subsystems to exploit the information content of observational data products for improving model predictions, including data assimilation, optimization and uncertainty estimation, radiative transfer and emission models and various end-use application models. LVT supports the analysis of outputs from these subsystems by connecting them to the relevant observational data. Together, LIS and LVT encompass a comprehensive set of computational tools for enabling end-to-end Model Data Fusion (MDF) experiments."
The development of a formal, systematic environment for model evaluation is expected to aid in bridging the gaps between the model and observations and in improving the “observability” of LSM outputs. "
Land surface Verification Toolkit (LVT): "A formal benchmarking and evaluation framework for land surface models"
Sujay V. Kumara,b, Christa D. Peters-Lidardb, Joseph A. Santanellob,"Kenneth W. Harrisonb,c,Yuqiong Liub,c and Michael Shawa,b,d"
aScience Applications International Corporation, McLean, VA. "bHydrological Sciences Branch, NASA Goddard Space Flight Center, Greenbelt, MD."cEarth System Science Interdisciplinary Center, University of Maryland, College Park, MD. "dAir Force Weather Agency, Offutt, NE. "
0
0.1
0.2
0.3
0.4
0.5
2010/05 2010/06 2010/07 2010/08 2010/09
Soil
Moi
stur
e (m
3/m
3)
Ensemble MeanObs
0
0.5
1
1.5
2010/05 2010/06 2010/07 2010/08 2010/09
Unc
erta
inty
Impo
rtanc
e (-
)
θsΨsKs
b
We gratefully acknowledge the financial support from the US Air Force Weather Agency (AFWA) and the NASA Earth Science Technology Office (ESTO)."
0
5
10
15
20
25
30
35
1 2 4 8 16 32 64 128 256 512 1024
Per
cent
age
cont
ribut
ion
Spatial Scale (KM)
Kumar, S.V., C.D. Peters-Lidard, J.A. Santanello, K.W. Harrison, Yuqiong Liu and Michael Shaw (2012), “Land surface Verification Toolkit (LVT): A generalized framework for land surface model evaluation, submitted to Geosci. Model. Dev."
LVT software is designed as an object-oriented framework with extensible interfaces for incorporating observational datasets and analysis metrics. "
LVT currently supports an array of terrestrial hydrology datasets from in-situ measurements, satellite and remote-sensing platforms, and model and reanalysis products, representing a wide range of land surface and terrestrial hydrologic regimes across the globe. These datasets are supported in their native formats and LVT handles the temporal and spatial transformations required in the analysis. "
LVT also supports a large suite of analysis metrics. In addition to the traditional accuracy-based measures, LVT supports ensemble and uncertainty measures, metrics based on information theory, similarity metrics
and methods to quantify the impact of spatial scales on model performance. "
Metric Class" Examples"Accuracy metrics" RMSE, Bias, Correlation"Ensemble metrics" Mean, Standard deviation,
Likelihood"Uncertainty metrics"
Uncertainty importance"
Information theory metrics"
Entropy, Complexity"
Data assimilation metrics"
Mean, variance, lag correlations of innovation distributions"
Spatial similarity metrics"
Hausdorff distance"
Scale decomposition metrics"
Discrete wavelet transforms"
EXAMPLES!Evaluation of surface flux estimates from LDAS simulations against ARM measurements . "
Mean diurnal cycles of latent and sensible heat fluxes from the offline Noah LSM (version 3.2) evaluated across ARM stations in the Southern Great Plains using default and calibrated model parameters for the period of April – September, 2006. "
-100
-50
0
50
100
150
200
250
300
350
0 5 10 15 20 25
Sen
sibl
e H
eat F
lux
(W/m
2)
Hour
DEFAULTCALIBRATED
OBS
0
50
100
150
200
250
300
0 5 10 15 20 25
Late
nt H
eat F
lux
(W/m
2)
Hour
DEFAULTCALIBRATED
OBS
The LSM simulations with default parameters show large errors, with a significant underestimation in latent heat fluxes and an overestimation in sensible heat fluxes. The calibration of model parameters helps in improving the model performance by correcting these systematic biases. This example illustrates an instance of the MDF paradigm that includes model characterization, reformulation through parameter estimation and verification using LVT. $
Model evaluation using remotely-sensed data over an uninstrumented region"
Probability of detection (POD) of snow cover estimates from Noah LSM (version 2.7.1), for a three year time period of 1 Oct 2007 to 1 May 2010, over Afghanistan. The POD values are computed by comparing the model estimates against the fractional snow extent global 500m product (MOD10A1) from the MODIS sensor on Terra spacecraft. "
This example provides an instance of model evaluation against satellite data over a region such as Afghanistan, where in-situ measurements are sparse. LVT facilitates model evaluation through the use of MODIS snow cover estimates. "
Analysis of data assimilation diagnostics "
Mean of normalized Innovations"
Variance of normalized Innovations"
Spatial distribution of the mean and variance of normalized innovations from a synthetic soil moisture data assimilation simulation. The experiment is conducted over the Continental U.S. domain at 1° spatial resolution, for a time period of 1 Jan 2000 to 1 Jan 2006. The synthetic soil moisture observations are assimilated using the Ensemble Kalman Filter (EnKF) algorithm. "
The metric entropy metric provides a measure of the randomness in the soil moisture time series at each grid point. The assimilation of NASA retrievals introduce more randomness in several parts of the modeling domain, whereas LPRM assimilation introduces less randomness. The availability of information theory metrics in LVT provides a way to discriminate model simulations based on their information content. $
Characterization of uncertainty diagnostics "An ensemble model simulation is conducted using the Noah LSM (version 3.2) during 1 May to 1 September, 2010 over the Walnut Gulch watershed. The ensemble run is conducted by sampling 4 soil hydraulic properties from assumed prior distributions. "
(A) shows the time series comparison of the model simulation of surface soil moisture against in-situ observations. The cyan shading indicates the ensemble spread. (B) provides the uncertainty importance measure, which is an assessment of the relative contribution of each parameter to the ensemble spread. This metric is computed as the correlation between the simulated variable and the parameter, across the ensemble. "
(A) Indicates that soil moisture uncertainty is small during the dry period and grows significantly during the wet periods. (B) shows that among the four parameters, simulations are most sensitive to θs. LVT enables the quantification of parameter sensitivities for uncertainty simulations"
Information theory metrics"
Scale decomposition analysis"
Two simulations with Noah LSM (version 2.7.1) are conducted over a domain in Afghanistan at 1km spatial resolution to generate snow cover estimates: one that employs a terrain based correction of shortwave radiation input and one that does not include such adjustments. The improvement in POD as a result of the terrain correction is computed, and the scale decomposition technique is applied to this difference
field to quantify how the improvements at 1km spatial resolution translate to coarser scales. "
Intensity scale approach of Casati et al. (2004) using a two dimensional discrete Haar wavelet transform is used to decompose a spatial field into sum of orthogonal components at different spatial scales. "
(A)"
(B)"
porosity"saturated matric potential"saturated hydraulic conductivity"pore size distribution index"
Change in Metric entropy fields as a result of the assimilation of soil moisture retrievals of AMSR-E from NASA and LPRM. "
NASA AMSR-E"
LPRM AMSR-E"
The deviations from the expected mean and standard deviation of the normalized innovation distribution is used as a measure of the optimality of the data assimilation configuration. In this instance, a near optimal performance is observed (mean close to zero, variance close to 1). The assimilation diagnostics can be processed through LVT and the model and observation error specifications can be revised to ensure optimal data assimilation performance. "
The percentage contribution to the total POD improvement at each spatial scale is shown. Most improvements are obtained at fine spatial scales and the contribution of the scale drops to below 10% at scales coarser than 16km. $
26th Conference on Hydrology, 92nd American Meteorological Society Annual Meeting, January 22-26, 2012, New Orleans, LA."
ACKNOWLEDGEMENTS$
Em
ail:
Suj
ay.V
.Kum
ar@
nasa
.gov
, w
eb: h
ttp:
//li
s.gsf
c.n.
asa.
gov
"
Model evaluation and verification are essential processes in the development and application of all simulation models. The process of systematic model evaluation and verification helps in the characterization of accuracy and uncertainty in model predictions and helps in improving the usage and acceptability of model outputs for real-world applications. "
The Land surface Verification Toolkit (LVT) is a framework developed to provide an automated, consolidated environment for intercomparing disparate datasets and for conducting both deterministic and probabilistic evaluation of land surface model (LSM) and data assimilation outputs. "
LVT is primarily built as a post-processor to the NASA Land Information System (LIS; http://lis.gsfc.nasa.gov; Kumar et al. 2006, Peters-Lidard et al. 2007), which is a
comprehensive land surface modeling and data assimilation framework."
LIS includes several subsystems to exploit the information content of observational data products for improving model predictions, including data assimilation, optimization and uncertainty estimation, radiative transfer and emission models and various end-use application models. LVT supports the analysis of outputs from these subsystems by connecting them to the relevant observational data. Together, LIS and LVT encompass a comprehensive set of computational tools for enabling end-to-end Model Data Fusion (MDF) experiments."
The development of a formal, systematic environment for model evaluation is expected to aid in bridging the gaps between the model and observations and in improving the “observability” of LSM outputs. "
Land surface Verification Toolkit (LVT): "A formal benchmarking and evaluation framework for land surface models"
Sujay V. Kumara,b, Christa D. Peters-Lidardb, Joseph A. Santanellob,"Kenneth W. Harrisonb,c,Yuqiong Liub,c and Michael Shawa,b,d"
aScience Applications International Corporation, McLean, VA. "bHydrological Sciences Branch, NASA Goddard Space Flight Center, Greenbelt, MD."cEarth System Science Interdisciplinary Center, University of Maryland, College Park, MD. "dAir Force Weather Agency, Offutt, NE. "
0
0.1
0.2
0.3
0.4
0.5
2010/05 2010/06 2010/07 2010/08 2010/09
Soil
Moi
stur
e (m
3/m
3)
Ensemble MeanObs
0
0.5
1
1.5
2010/05 2010/06 2010/07 2010/08 2010/09U
ncer
tain
ty Im
porta
nce
(-)
θsΨsKs
b
We gratefully acknowledge the financial support from the US Air Force Weather Agency (AFWA) and the NASA Earth Science Technology Office (ESTO)."
0
5
10
15
20
25
30
35
1 2 4 8 16 32 64 128 256 512 1024
Per
cent
age
cont
ribut
ion
Spatial Scale (KM)
Kumar, S.V., C.D. Peters-Lidard, J.A. Santanello, K.W. Harrison, Yuqiong Liu and Michael Shaw (2012), “Land surface Verification Toolkit (LVT): A generalized framework for land surface model evaluation, submitted to Geosci. Model. Dev."
LVT software is designed as an object-oriented framework with extensible interfaces for incorporating observational datasets and analysis metrics. "
LVT currently supports an array of terrestrial hydrology datasets from in-situ measurements, satellite and remote-sensing platforms, and model and reanalysis products, representing a wide range of land surface and terrestrial hydrologic regimes across the globe. These datasets are supported in their native formats and LVT handles the temporal and spatial transformations required in the analysis. "
LVT also supports a large suite of analysis metrics. In addition to the traditional accuracy-based measures, LVT supports ensemble and uncertainty measures, metrics based on information theory, similarity metrics
and methods to quantify the impact of spatial scales on model performance. "
Metric Class" Examples"Accuracy metrics" RMSE, Bias, Correlation"Ensemble metrics" Mean, Standard deviation,
Likelihood"Uncertainty metrics"
Uncertainty importance"
Information theory metrics"
Entropy, Complexity"
Data assimilation metrics"
Mean, variance, lag correlations of innovation distributions"
Spatial similarity metrics"
Hausdorff distance"
Scale decomposition metrics"
Discrete wavelet transforms"
EXAMPLES!Evaluation of surface flux estimates from LDAS simulations against ARM measurements . "
Mean diurnal cycles of latent and sensible heat fluxes from the offline Noah LSM (version 3.2) evaluated across ARM stations in the Southern Great Plains using default and calibrated model parameters for the period of April – September, 2006. "
-100
-50
0
50
100
150
200
250
300
350
0 5 10 15 20 25
Sen
sibl
e H
eat F
lux
(W/m
2)
Hour
DEFAULTCALIBRATED
OBS
0
50
100
150
200
250
300
0 5 10 15 20 25
Late
nt H
eat F
lux
(W/m
2)
Hour
DEFAULTCALIBRATED
OBS
The LSM simulations with default parameters show large errors, with a significant underestimation in latent heat fluxes and an overestimation in sensible heat fluxes. The calibration of model parameters helps in improving the model performance by correcting these systematic biases. This example illustrates an instance of the MDF paradigm that includes model characterization, reformulation through parameter estimation and verification using LVT. $
Model evaluation using remotely-sensed data over an uninstrumented region"
Probability of detection (POD) of snow cover estimates from Noah LSM (version 2.7.1), for a three year time period of 1 Oct 2007 to 1 May 2010, over Afghanistan. The POD values are computed by comparing the model estimates against the fractional snow extent global 500m product (MOD10A1) from the MODIS sensor on Terra spacecraft. "
This example provides an instance of model evaluation against satellite data over a region such as Afghanistan, where in-situ measurements are sparse. LVT facilitates model evaluation through the use of MODIS snow cover estimates. "
Analysis of data assimilation diagnostics "
Mean of normalized Innovations"
Variance of normalized Innovations"
Spatial distribution of the mean and variance of normalized innovations from a synthetic soil moisture data assimilation simulation. The experiment is conducted over the Continental U.S. domain at 1° spatial resolution, for a time period of 1 Jan 2000 to 1 Jan 2006. The synthetic soil moisture observations are assimilated using the Ensemble Kalman Filter (EnKF) algorithm. "
The metric entropy metric provides a measure of the randomness in the soil moisture time series at each grid point. The assimilation of NASA retrievals introduce more randomness in several parts of the modeling domain, whereas LPRM assimilation introduces less randomness. The availability of information theory metrics in LVT provides a way to discriminate model simulations based on their information content. $
Characterization of uncertainty diagnostics "An ensemble model simulation is conducted using the Noah LSM (version 3.2) during 1 May to 1 September, 2010 over the Walnut Gulch watershed. The ensemble run is conducted by sampling 4 soil hydraulic properties from assumed prior distributions. "
(A) shows the time series comparison of the model simulation of surface soil moisture against in-situ observations. The cyan shading indicates the ensemble spread. (B) provides the uncertainty importance measure, which is an assessment of the relative contribution of each parameter to the ensemble spread. This metric is computed as the correlation between the simulated variable and the parameter, across the ensemble. "
(A) Indicates that soil moisture uncertainty is small during the dry period and grows significantly during the wet periods. (B) shows that among the four parameters, simulations are most sensitive to θs. LVT enables the quantification of parameter sensitivities for uncertainty simulations"
Information theory metrics"
Scale decomposition analysis"
Two simulations with Noah LSM (version 2.7.1) are conducted over a domain in Afghanistan at 1km spatial resolution to generate snow cover estimates: one that employs a terrain based correction of shortwave radiation input and one that does not include such adjustments. The improvement in POD as a result of the terrain correction is computed, and the scale decomposition technique is applied to this difference
field to quantify how the improvements at 1km spatial resolution translate to coarser scales. "
Intensity scale approach of Casati et al. (2004) using a two dimensional discrete Haar wavelet transform is used to decompose a spatial field into sum of orthogonal components at different spatial scales. "
(A)"
(B)"
porosity"saturated matric potential"saturated hydraulic conductivity"pore size distribution index"
Change in Metric entropy fields as a result of the assimilation of soil moisture retrievals of AMSR-E from NASA and LPRM. "
NASA AMSR-E"
LPRM AMSR-E"
The deviations from the expected mean and standard deviation of the normalized innovation distribution is used as a measure of the optimality of the data assimilation configuration. In this instance, a near optimal performance is observed (mean close to zero, variance close to 1). The assimilation diagnostics can be processed through LVT and the model and observation error specifications can be revised to ensure optimal data assimilation performance. "
The percentage contribution to the total POD improvement at each spatial scale is shown. Most improvements are obtained at fine spatial scales and the contribution of the scale drops to below 10% at scales coarser than 16km. $
26th Conference on Hydrology, 92nd American Meteorological Society Annual Meeting, January 22-26, 2012, New Orleans, LA."
ACKNOWLEDGEMENTS$
Em
ail:
Suj
ay.V
.Kum
ar@
nasa
.gov
, w
eb: h
ttp:
//li
s.gsf
c.n.
asa.
gov
"
! Uncertainty importance measure: An assessment of the relative contribution of each parameter to the ensemble spread, computed as the correlation between the simulated variable and the the parameter, across the ensemble. !

Scale decomposition features!! Tools to characterize the impact of spatial scale on different process
variables !
! E.g. Discrete Wavelet transforms, spatial similarity measures!S. V. Kumar et al.: Land surface Verification Toolkit 881
0
5
10
15
20
25
30
35
1 2 4 8 16 32 64 128 256 512 1024
Perc
enta
ge c
ontri
butio
n
Spatial Scale (KM)
Fig. 8. Percentage contribution to the total improvement in snow covered area POD at different spatial scales,
generated by a two dimensional discrete Haar wavelet analysis.
33
Fig. 8. Percentage contribution to the total improvement in snowcovered area POD at different spatial scales, generated by a twodimensional discrete Haar wavelet analysis.
an example of scale-decomposition evaluation of snow coversimulations from the LSMs using LVT.The intensity-scale approach of Casati et al. (2004), orig-
inally developed for the spatial verification of precipitationforecasts, is used to perform a scale decomposition analy-sis. The technique employs a two dimensional discrete Haarwavelet transform that decomposes a given field into thesum of orthogonal components at different spatial scales. Themean squared error (MSE) of the decomposed components ateach spatial scale is used to quantify the scale decompositioneffects.Using the domain configuration at 1 km spatial resolution
over Afghanistan (used in Sect. 5.1), two model simulationsare conducted using Noah LSM (version 2.7.1); one that em-ploys a terrain based correction of shortwave radiation inputto the LSM and one that does not include such adjustments.The terrain-based corrections adjust the incoming shortwaveradiation based on terrain slope and aspect, and these changesin turn impact the evolution of snow over these terrain. Theimprovements in the snow cover simulation as a result ofthe terrain-based correction is computed as the difference inPOD fields from the two simulations, generated by compar-ing against the MOD10A1 (version 4) fractional snow coverproduct. The scale-decomposition approach is then appliedto this difference field, to quantify how the improvements insnow cover estimates at 1 km spatial resolution translate tocoarser spatial scales.Figure 8 shows the result of scale decomposition of the to-
tal improvement field for POD using the two dimensionaldiscrete Haar wavelet transform. The algorithm computessuccessive decompositions of the original field by powers of2. The percentage contribution to the total improvement ateach coarse spatial scale is shown in Fig. 8. The results indi-cate that most of the improvements in POD are obtained atfine spatial scales and the contribution of the scale decreaseswith increase in spatial resolution. At scales coarser than16 km, the percentage contribution drops below 10%. Simi-lar analysis of scale effects can be performed on other metricsand variables of interest. This example demonstrates the use
of LVT for another MDF experiment where the MODIS frac-tional snow cover data is used to assess the applicability ofmodel formulations at different spatial scales.
5.7 Spatial similarity measures
With the increased availability of spatially distributeddatasets from satellites and remote-sensing platforms, thereis a need for techniques and metrics that evaluate modelsand observations based on the their spatial patterns, in addi-tion to the one-to-one correspondence comparisons that aretypically used. The incorporation of spatial pattern compar-isons will aid in further improving the reliability of LSMsfor hydrological applications (Bloschl and Sivapalan, 1995;Grayson and Bloschl, 2000). A review of spatial similaritymethods in hydrology is provided in Wealands et al. (2005),which includes techniques based on statistical identificationas well as image processing techniques. In this section, an ex-ample of using a similarity metric through LVT to comparesnow cover patterns from two different LSMs is presented.Snow cover estimates using two LSMs, Noah (version 3.2)
and CLM (version 2; Dai et al., 2003), forced with GDAS andCMAP datasets, are generated over a 100⇥ 100 region nearthe Southern Great Plains in the US at 1 km spatial resolutionfor a time period of 1 November 2008 to 1 June 2009. TheLSMs have different representations of snow processes, withNoah employing a simple single snow layer scheme. CLMincludes a more complex five layer snow scheme with param-eterizations for temporally varying snow albedo, as a func-tion of snow cover and snow age. Both LSMs simulate tem-porally varying snow density with evolution of patchy snowcover. The model simulations are evaluated against the frac-tional snow cover observations from MODIS (MOD10A1version 4) using the “Hausdorff distance” similarity metric.Hausdorff distance (HD) measures the similarity of points
in two finite sets and is not designed to find one-to-one cor-respondence between points in each set. It is expressed as themaximum distance of a set to the nearest point in the otherset:
h(M,O) = maxm2M
{mino2O
{||m � o||}}, (3)
where h(M,O) is the HD value, m and o are points of setsM (representing model) and O (representing observations),respectively. ||m � o|| is the norm of the points in the modeland observation spaces and can be computed as the Euclideandistance between m and o.Figure 9 shows a time series comparison of the cumulative
HD measure from Noah and CLM snow cover simulationsfor the winter season of 1 November 2008 to 1 June 2009.More temporal variability in HD values is observed duringthe snow evolution and ablation periods and it drops duringthe peak snow season, suggested by the flattening of the cu-mulative HD curves. This indicates that there is more con-sistent agreement in the observational and model simulated
www.geosci-model-dev.net/5/869/2012/ Geosci. Model Dev., 5, 869–886, 2012
! Percentage contribution to the total improvement in snow covered area POD at different spatial scales, generated by a two-dimensional discrete Haar wavelet analysis. !

Hydrological Products development!! A suite of common, normalized indicators used for drought monitoring has been developed in LVT (e.g.
Standardized precipitation index (SPI), Standardized Runoff Index (SRI), Standardized Soil Water Index (SSWI), Percentiles !
July 30, 2002!
Jan 3, 2006!
Sept 27, 2011!
Root zone soil moisture based drought percentiles generated by LVT from a LIS simulation!
The capabilities of LVT enable an environment for performing systematic evaluation of the OSSEs using various metrics including end-use oriented measures. !
U.S. Drought monitor estimate!

Benchmarking ! Integration with PALS (Protocol for the Analysis of Land
Surface Models) Land Model Benchmarking Evaluation Project (PLUMBER; Best et al. 2015) concepts!
! LVT is being modified with a number of data analysis/fusion methods (regression, neural networks) that can generate benchmarks are purely based on specified datasets. !
! These benchmarks can then be used for model intercomparisons (comparisons against a priori expectations of performance) and can be released to the community. !
! LIS supports model outputs in ‘PALS’ formats. Direct use of PALS infrastructure is also possible using LIS outputs. !

Summary
! An environment for the systematic, comprehensive and integrated verification of land surface models with a large suite of metrics. !
! LVT supports the outputs from various LIS subsystems including DA, OPT, UE, RTM etc.!
! Extensible features for incorporating new metrics and observation sources.!
! A conduit for developing hydrological products (e.g. drought/flood indicators).!