land use change and wildlife distribution ......use modeling and wide-ranging species distribution...
TRANSCRIPT

LAND USE CHANGE AND WILDLIFE
DISTRIBUTION MODELING IN
THE EMERALD TRIANGLE FOREST
COMPLEX
Yongyut TRISURAT
FACULTY OF FORESTRY
KASETSART UNIVERSITY
THAILAND
2015
The Royal Forest Department
RFD
International Tropical Timber Organization
ITTO

PD 577/10 Rev.1 (F)
i
ITTO Project PD 577/10 Rev.1 (F)
Management of the Emerald Triangle Protected Forests Complex to
Promote Cooperation for Trans-boundary Biodiversity Conservation
between Thailand, Cambodia and Laos (Phase III)
Host Government
THE GOVERNMENT OF THAILAND
Executing Agency
THE ROYAL FOREST DEPARTMENT OF THAILAND
Starting Date: 1 August 2012
(Duration of the Project: 36 Months)
Published By
KASETSART UNIVERSITY, THAILAND
February 2015
ISBN 978-616-278-215-2

PD 577/10 Rev.1 (F)
ii
PROJECT TECHNICAL STAFF:
(Thailand Component)
Mr. Somchai Masathian Deputy Director-General
Royal Forest Department
Project Director
Mr. Suchat Kalyawongsa Deputy Project Director
Mr. Sapol Boonsermsuk Project Coordinator/Head of Finance and
Budgeting Section
Mr. Thanakorn Keeratiphakhawat Assistant Project Coordinator
Mr. Krischana Nissa Head of Administration Section
Mr. Kampanat Dorkmai Head of Community Outreach Section
Mr. Thaned Buakaew Head of Biodiversity Conservation Section
Ms. Warawan Tanakitrungruang Head of Information Section
Mr. Kamol Wisupakan Project Manager
E-mail: [email protected]

PD 577/10 Rev.1 (F)
iii
ABBREVIATIONS
ADB Asian Development Bank
AEC ASEAN Economic Community
ASTER The Advanced Spaceborne Thermal Emission and Reflection
Radiometer
AUC Area under curve
CLUE Conversion of Land Use and its Effects
ETFC Emerald Triangle Forests Complex
FA Forest Administration
GDP Gross Domestic Product
GIS Geographic information system
GLM Generalized Linear Models
GMS Greater Mekong Sub-region
GPS Global Positioning System
ITTO International Tropical Timber Organization
KU Kasetsart University
LU/LC Land-use/Land-cover
MAXENT Maximum Entropy Method
NBCA National Biodiversity Conservation Area
PPFC Pha Taem Protected Forests Complex
PVPF Preah Vihear Protected Forest for the Conservation of Genetic
Resources of Plants and Wildlife
RFD Royal Forest Department
TBCAs Trans-boundary Biodiversity Conservation Areas
TORs Term of References

PD 577/10 Rev.1 (F)
iv
TABLE OF CONTENTS
Item Page
Inner Cover i
Project Technical Staff ii
Abbreviations iii
Acknowledgements ix
Executive Summary x
1 Introduction 1
2 Concepts and Backgrounds 4
2.1 GIS database 5
2.1.1 Core GIS database 5
2.1.2 Data catalogue and database dictionary 8
2.1.3 Database development 9
2.2 GIS training courses 9
2.3 Land-use modeling 12
2.4 Species distribution modeling 13
2.4.1 Cartographic overlay 14
2.4.2 Species distribution modeling using presence–
absence data
15
2.4.3 Species distribution modeling using presence-only
data
16
3 Study Area 19
3.1 Geographical location 19
3.2 Environmental aspects 22
3.3 Social and cultural aspects 23
4 Applied Methodology 25
4.1 Land use modeling 25
4.1.1 Gathering past land-use/land-cover map 25
4.1.2 Preparing current land-use/land-cover map 26
4.1.3 Land-use change detection 27
4.1.4 Land-use modeling 27
4.1.5 Assessing landscape configuration features 31
4.2 Wildlife distribution modeling 31
4.2.1 Collection of wildlife occurrences 32

PD 577/10 Rev.1 (F)
v
4.2.2 Target species selection 33
4.2.3 Generation of species distribution models 33
4.2.4 Validation and mapping species distributions 34
5. Results 35
5.1 Land use 35
5.1.1 Land-use/land-cover 2013 35
5.1.2 Land-use/land-cover change between 2003 and 2013 38
5.1.3 Predicted land-use/land-cover in 2030 41
5.2 Wildlife distributions 49
5.2.1 Selected wildlife species 49
5.2.2 Used distribution models and logistic thresholds 51
5.2.3 Extent of present distributions 53
5.2.4 Extent of future distributions 53
5.2.5 Contribution of protected areas 56
5.2.6 Concentration of selected wildlife species 56
5.3 GIS training courses 66
5.3.1 GIS Training I: GIS Training on Introduction of GIS,
Remote Sensing and Map Reading
66
5.3.2 GIS Training II: GIS Modeling for Forest Land Use
Assessment and Prediction
68
5.3.3 GIS Training 3: GIS - Wildlife Distribution Modeling 73
6 Conclusions and Recommendations 79
7 Implications for Practices 79
7.1 Integration of scenarios and models 79
7.2 Important habitats of selected species 79
7.3 Translating research results into concrete actions 80
Annexes 82
Annex 1 Correlation matrix of environmental variables
determining species distribution in the Emerald Triangle
landscape
83
Annex 2 Predicted distributions of selected wildlife under land
use change scenarios
84
Annex 3 Predicted distributions of selected wildlife under the
combination of climate and land-use change scenarios
98

PD 577/10 Rev.1 (F)
vi
Annex 4 List of participants and resource persons attending the
1st GIS training session on 28-29 November 2013
112
Annex 5 List of participants and trainers attending the joint
training workshop on GIS modeling for forest land use
planning
113
Annex 6 List of participants attending GIS-wildlife distribution
joint training workshop
116
Box 1 Some photos showing the 1st GIS training activities 118
Box 2 Some photos showing the 2nd GIS training activities 119
Box 3 Some photos showing the 1rd GIS training activities 120
Bibliography 121

PD 577/10 Rev.1 (F)
vii
LIST OF TABLES
Item Page
Table 1 Proposed core datasets for the PPFC 6
Table 2 Proposed core datasets for the entire Emerald Triangle landscape 7
Table 3 Proposed GIS training workshops for the project phase III conducted
by the GIS consultant
9
Table 4 Comparisons of species distribution models 15
Table 5 Summary of key features of the Emerald Triangle Protected Forests
Complex
17
Table 6 Contingency table resulting from field validation 34
Table 7 Land-use/land-cover classes in 2003 and 2013 in the Emerald
Triangle Protected Forest Complex (ha)
36
Table 8 Transition matrix of land-use/land-cover classes between 2003 and
2013
40
Table 9 Beta values of significant location factors for regression models
related to each land use type
41
Table 10 Selected wildlife species for modeling in the Emerald Triangle
landscape
50
Table 11 Relative contributions of the environmental variables to spatial
distribution model of each wildlife species
52
Table 12 Selected species and accuracy assessment of the predicted
distributions derived from used logistic thresholds
52
Table 13 Predicted suitable distributions for each mammal species in 2013 in
the Emerald Triangle landscape
54
Table 14 Contribution of protected areas to conserve selected mammal species
in the Emerald Triangle landscape
55
Table 15 Training schedule of GIS Training on Introduction of GIS, Remote
Sensing and Map Reading
66
Table 16 Training evaluation summary of the 1st GIS Training 68
Table 17 Provisional program of Joint Training Workshop on GIS Modeling
for Land Use Planning Scenario (2nd GIS Training)
69
Table 18 Training evaluation summary of the 2nd GIS Training 73
Table 19 Provisional program of Training Workshop on GIS-Wildlife
Distribution Modeling (3rd GIS Training)
74
Table 20 Training evaluation summary of the 3rd GIS Training 76

PD 577/10 Rev.1 (F)
viii
LIST OF FIGURES
Item Page
Figure 1 General guidelines for GIS database implementation 4
Figure 2 Location of the Emerald Triangle protected forests complex along
the borders of Thailand, Lao PDR and Cambodia
18
Figure 3 Main steps of land-use change detection and prediction 23
Figure 4 Land-use/land-cover scenarios of the Emerald Triangle 26
Figure 5 Land allocations for four scenarios from 2013-2030 27
Figure 6 Main steps of species distribution modeling 29
Figure 7 Land-use/land-cover in 2003 and 2013 in the Emerald Triangle
Protected Forest Complex
35
Figure 8 a) Predicted land uses for sustainable poverty and stable resources
scenario
43
b) Predicted land uses for Unsustainable economic development
and serious resource degradation
43
c) Predicted land uses for Low economic decline and localized
resource degradation
44
d) Predicted land uses for sustainable development and limited
resources degradation
44
Figure 9 Predicted new areas for arable land and rubber plantation in 2030 48
Figure 10 Predicted distribution for gaur 58
Figure 11 Predicted distribution for banteng 58
Figure 12 Predicted distribution for Sambar deer 59
Figure 13 Predicted distribution for Eld’s deer 59
Figure 14 Predicted distribution for elephant 60
Figure 15 Predicted distribution for Sarus crane 60
Figure 16 Predicted distribution for Lesser adjutant stork 61
Figure 17 Predicted distribution for barking deer 61
Figure 18 Predicted distribution for leopard 62
Figure 19 Predicted distribution for tiger 62
Figure 20 Predicted distribution for Giant ibis 63
Figure 21 Predicted distribution for wild boar 63
Figure 22 Species richness classes of selected species for modeling in the
Emerald Triangle protected forests complex
64

PD 577/10 Rev.1 (F)
ix
ACKNOWLEDGEMENTS
The GIS Consultant would like to thank the Government of Japan and International
Tropical Timber Organization (ITTO) to provide financial and technical support for
implementation of the Management of the Emerald Triangle Protected Forests Complex
to Promote Cooperation for Trans-boundary Biodiversity Conservation between Thailand,
Cambodia and Lao PDR (Phase III) Project number: PD 577/10 Rev. 1 (F), respectively.
The kind cooperation and support of all Superintendents and the Emerald Triangle project
staff from Thailand, Lao PDR and Cambodia are greatly appreciated during field work,
training and preparation of this report. We are grateful to the Mekong River Commission
Secretariat, the Department of National Parks, Wildlife and Plant Conservation in
Thailand and the Forest Administration in Cambodia for providing the data. Special
thanks are given to Mr. Kamol Wisupakan, Mr. Thanet Buakaew, Dr. Naris
Bhumpakphan and Dr. Hwan-ok Ma for support and guidance. Finally, the GIS
Consultant would like to thank Palle Havmoller for English editing.
Prof. Dr. Yongyut Trisurat
GIS Consultant

PD289/04 Rev.1 (F)
x
EXECUTIVE SUMMARY
After completion of the Management of the Emerald Triangle Protected Forests Complex
to Promote Conservation for Trans-boundary Biodiversity Conservation between
Thailand, Cambodia and Laos (Phase II), PD 289/04 Rev.1 (F), the Royal Forest
Department (RFD) of Thailand and Forestry Administration (FA) of Cambodian jointly
developed the Project Phase III Proposal. The project scope has extended the
implementation to cover Phou Xiang Thong and Dong Khanthung National Biodiversity
Conservation Areas in Lao PDR. The project phase III was approved by ITTO and
financed by the Government of Japan. It built on the achievements of project phases I and
II and resolved some pending issues identified in the evaluation report.
The overall objective was to contribute to the conservation of trans-boundary
biodiversity in the Emerald Triangle Protected Forests Complex between Thailand,
Cambodia and Laos. The experiences and lessons learned from this project will be used
as a model for other potential trans-boundary conservation areas in participating countries
and in the Greater Mekong Sub-region. The specific objective of Phase III of the project
is to strengthen the protection of trans-boundary habitats of protected wide-ranging
wildlife species in the Emerald Triangle.
The RFD has invited the Forestry Research Center of the Faculty of Forestry,
Kasetsart University (KU) to render professional services assigned to 1) GIS Consultant
and 2) Wildlife Consultant. This technical report presents the main outputs responsible by
the GIS Consultant (Dr. Yongyut Trisurat), which include updating the GIS database for
trans-boundary biodiversity conservation planning and assisting joint researches on land-
use modeling and wide-ranging species distribution in the ETFC. The Land Use Change
and Wildlife Distribution Modeling in the Emerald Triangle Forest Complex Report
consisted of seven sections, namely Section 1: Introduction; Section 2: Concepts and
Backgrounds; Section 3: Study Area; Section 4: Applied Methodology/ Projecting Land
Use and Landscape Change; Section 5: Results; Section 6: Conclusions and
Recommendations; and Section 7: Implications for Practices.

xi
Section 1: Introduction
Section 1 describes the importance of the Emerald Triangle landscape in the Greater
Mekong Sub-region, background of trans-boundary conservation in Thailand, key
achievements and pending issues of the project phases I and II. The overall objective and
specific objectives of the Management of the Emerald Triangle Protected Forests
Complex to Promote Conservation for Trans-boundary Biodiversity Conservation
between Thailand, Cambodia and Laos (Phase III) were also included. At the end roles
and responsibilities of GIS consultant were shown.
Section 2: Concept and Background
Section 2 identified six main activities to be implemented by the GIS consultant. In
addition, the GIS consultant proposed the processes to achieve the assigned activities,
including 1) core GIS dataset, 2) GIS database design and development, 3) collection of
wildlife occurrences, 4) prediction of land use change, 5) modeling species distributions
and 6) formulating management strategies. The GIS database is intended to be used to
support biodiversity conservation and protected areas management and decision-making
at both the Pha Taem complex and the Emerald Triangle landscape. Therefore, the GIS
database consists of two datasets. The core GIS dataset at scale of 1:50,000 for the PPFC
and at scale of 1:250,000 for the Emerald Triangle. Three GIS training modules were
proposed to increase capacity of multi-stakeholders and their understanding on spatial
data and analyses, namely 1) Introduction of GIS, Map Reading and GPS Mapping; 2)
Land Use Modeling; and 3) Species Distribution Modeling. The current research used the
Dyna-CLUE (Conversion of Land Use and its Effects) model to assess future land-use at
the ETFC. In addition, the presence-only species modeling technique (MAXENT model)
was selected. The advantages of MAXENT include the following: (1) it requires only
presence data and environmental factors, (2) it can utilize both continuous and categorical
variables, and (3) it is efficient at determining the algorithms for converging the optimal
probability distribution.
Section 3: Project Area
Section 3 presents physical feature, biological feature and socio-economic aspects of the
project area derived from the project phases I and II. It is noted that only little information

xii
was presented for Laos because most activities were implemented in Thailand and
Cambodia in previous phases.
The Emerald Triangle Protected Forest Complex landscape comprises five
protected areas, so called the Pha Taem Protected Forest Complex (PPFC). The total area
of the complex is approximately 1, 736 km2. The PPFC adjoins two protected areas in
Lao PDR (Phou Xing Thong and Dong Khanthung (NBCA), covering approximately
2,800 km2, and the Protected Forest for conservation of Genetic Resources of Plants and
Wildlife in Preah Vihear Province, Cambodia is about 1,900 km2. The total area of the
eight protected areas is approximately 6,500 km2.
Three main vegetation types, viz. Dry Evergreen Forest, Mixed Deciduous Forest
and Deciduous Dipterocarp Forest.Higher abundance of wildlife species were recorded in
Cambodia and Lao PDR and they seasonally migrate across the tri-national boundaries.
However, conservation measures in these two countries are weak due to limited financial
support and human capacity. Therefore, long-term persistence of wide-ranging and iconic
species in this area is largely dependent on close cross-border cooperation between the
three countries to maintain integrity of wildlife habitats and to reduce anthropogenic
pressures.
Section 4: Applied Methodology
This technical report emphasised methods used for land-use modelling and species
distribution modelling. Five steps were conducted to detect land use change between
2003 and 2013 and to predict future land use change at the Emerald Triangle landscape.
They consisted of 1) gathering past land-use/land-cover map, 2) preparing current land-
use/land-cover map, 3) land-use change detection, 4) land-use modeling and 5) assessing
landscape configuration features. Four land-use scenarios in 2030 were defined by multi-
stakeholders involved in the project, namely a) low economic decline and localized
resource degradation (business as usual), b) unsustainable economic development and
serious resource degradation scenario, c) sustainable poverty and stable resources
scenario, and d) sustainable development and limited resources degradation scenario.
In addition, the processes for mapping wildlife distributions and determining
priority areas for protecting the iconic species in the Emerald Triangle area include four
steps: a) collection of wildlife presence points, b) target species selection, c) generation of

xiii
species distribution models, and d) validation and mapping distributions. The criteria used
for selection of target species include: 1) wide distribution in the Emerald Triangle
(having trans-boundary territory), 2) regionally and nationally threatened status, 3)
adequate observation records (≥10 points) and 4) iconic or flagship for conservation.
Section 5: Results
Forest cover in the entire ETFC and surrounding landscape is predicted to decline from
44.8% in 2013 to 40.2, 36.2, 42.4 and 40.5% in 2030 under these scenarios, respectively.
In addition, the CLUE-s model results indicated that dry dipterocarp forest in the north of
Dong Khanthung provincial protected forest in Lao PDR and to the west of Pha Taem
National Park in Thailand would be threatened by encroachment for agriculture and
rubber plantation. If on restriction policy, parts of the Preah Vihear protected forest in
Cambodia and Phou Xiang Thong National Biodiversity Conservation Area in Lao PDR
would be converted for arable land in 2030. Evergreen forests were predicted as relatively
intact at the current stage because they are found either inside protected areas or in steep
terrains, thus become natural barriers for human-intervention.
The predicted deforestation would cause negative impacts on wildlife distribution
and wildlife hotspots in the Emerald Triangle protected forest complex. The multi-
stakeholders from three countries selected 12 species for modeling their distributions.
These species include nine mammals: gaur (Bos gaurus); banteng (B. javanicus); sambar
(Cervus unicolor); Eld’s deer (C. eldii siamensis); Asian elephant (Elephas maximus);
barking deer (Muntiacus muntjac); leopard (Neofelis nebulosa); tiger (Panthera tigris)
and wild boar (Sus scrofa), and three birds: Sarus crane (Grus Antigone); Lesser adjutant
stork (Leptoptilos javanicus); and Giant ibis (Pseudibis gigantean). The model results
revealed that the likely suitable habitats for selected wildlife species in 2013 cover
approximately 45% of the Emerald Triangle landscape and
the average percentage contribution of protected areas to protecting the focal selected
species were more than 80% of the total predicted suitable habitats, especially for gaur,
Sambar deer, Asian elephant and tiger. The average percentage of contribution was the
lowest (approximately 50%) under the sustainable poverty scenario. This may be due to
the fact that more forest areas and contiguous forest patches were predicted outside the
protected areas, therefore the selected species are able to inhabit these areas.

xiv
High species richness class was predicted along the borders between the PVPF
(except the western part) and Dong Kanthung NBCA will be classified as moderate
richness. In addition, the remaining areas in Preah Vihear, Yot Dom, Bun Thrarik-Yot
Mon and part of Phou Xiang Thong were predicted as low richness of the selected
species. The entire areas of Pha Taem and Kaeng Tana National Parks were categorized
as none habitat of any of the 12 species.
Three GIS training courses were conducted during the project phase III. They are
as follows:
1) Introduction of GIS, Map Reading and GPS Mapping. This training course
was conducted for park rangers and interested people involved in the project
(e.g. patrol border police, RFD officials). The objectives of this course were to
refresh GIS skills and to guide how to collect and develop standardized core
GIS database among the three countries. It was conducted on November 28th -
29th, 2013 at the Pha Taem National Park. There were approximately 30
participants from five protected areas in the PPFC. Besides, RFD staff, ITTO
Project staff and graduate students from Kasetsart University also participated
in this training.
2) GIS Modeling for Forest Land Use Assessment and Prediction. This training
course was jointly organized for GIS staff and park rangers of the three
countries who were involved in the project. The objectives of this course were
to train participants on CLUE model using default database and to jointly
develop land use scenarios for the Emerald Triangle. The second training was
conducted in Tbeng Mean Chey Preah Vihear province, Cambodia and the
duration of the training workshop was 5 days (March 10-15, 2014). There
were all together 50 participants/resource persons. Thirty two participants
were from Cambodia, 6 from Laos and 12 from Thailand.
3) GIS - Wildlife Distribution Modeling. This training course was conducted for
GIS staff, park rangers and wildlife scientists of the three countries who were
involved in the project. The training aimed at introducing various spatially
explicit species distribution models, advantages and disadvantages, finalizing
wildlife species for modeling and jointly generating distributions of selected
species in the Emerald Triangle. The 3rd GIS training sessions on GIS-Wildlife

xv
Distribution Modeling was planned for 5 days from October 20-25, 2014).
The venue of the training was Toh Saeng Kong chiam Hotel, Ubon
Ratchathani Province, Thailand. There were all together 41
participants/resource persons. Eighteen participants were from Cambodia, 5
from Laos and 18 from Thailand.
The training evaluation results of the three courses showed that the contents of
training were ranked between highest and good (>80%) and more than 80% of
participants appreciated logistic arrangement and facilities offered during the training.
The main constraint of the training contents was the period of time allowed for the
training. It should be noted that the objectives of the training courses were not aimed to
train participants to become experts in GIS modeling. In addition, most participants had
basic knowledge on GIS and spatial modeling obtained from previous training courses.
Therefore, the identified constraint was unavoidable.
Section 6: Conclusions and Recommendations
This section 6 summarized main findings and recommended key points for the effective
trans-boundary biodiversity conservation. It is recommended that the GIS center of the
regional office in Ubon Ratchathani province should host and maintain GIS database of
the PPFC, while Tbeng Mean Chey Forestry Office in Preah Vihear province and
Champasak University in Chapasak province are responsible for updating and
maintaining GIS database for Cambodia and Lao PDR, respectively. This is to ensure that
the GIS database will be kept in good shape for future uses. The results of land-use
prediction indicated that forest cover in the north of Dong Khanthung protected forest in
Lao PDR, parts of the Preah Vihear protected forest in Cambodia and to the west of Pha
Taem National Park in Thailand would be threatened by encroachment for agriculture and
rubber plantation if on restriction policy. This land-use change patterns will restrict the
distributions of selected species in small patches across the tri-national borders and cause
negative effect of long-term persistence of species having trans-boundary territory. It is
recommended that the three countries put collaborative efforts to regularly patrol and
prevent deforestation in the risk areas and to protect intact forest and remaining suitable
habitats, especially in Laos and Cambodia.

xvi
Section 7: Implications for Practices
This section highlighted and discussed the contributions of the research results. Three
sub-sections were elaborated, namely integration of scenarios and models, important
habitats of selected species and translating research results into concrete actions and
contributions to conservation communities.
Prof. Dr. Yongyut Trisurat
GIS Consultant

PD 577/10 Rev.1 (F)
1
1. INTRODUCTION
The Southeastern Indochina Dry Evergreen Forest ecoregion is situated in the Greater
Mekong across northern and central Thailand, Lao PDR, Cambodia and Vietnam.
However, about two-thirds of the original forest of this eco-region has been converted to
agricultural areas or seriously degraded (Wikramanayake et al., 2000). The largest
extensive intact block still remains along the tri-national borders between Thailand, Lao
PDR and Cambodia, in the so-called Emerald Triangle Forests Complex (ETFC). It is
recognized as global outstanding for biodiversity conservation and for important habitats
of the large vertebrates in the Greater Mekong Sub-region or GMS (Office of
Environmental Center, 2005). According to Bhumpakphan (2003), Cambodian Forest
Administration (2009) and Round (1998) the ETFC inhabits more than 50 threatened
species. Of this figure, more than 10 species found in the ETFC are categorized either as
critically endangered or endangered species such as Asian elephant (Elephans maximus),
banteng (Bos javanicus), Eld’s deer (Rucervus eldii siamensis), Clouded leopard (Neofelis
nebulosa) and Siamese crocodile (Crocodylus siamensis).
The ETFC landscape contains heterogenuous landscape patterns and different
hydrological conditions. The general topography in Thailand is mountaineous and slopes
gently towards the southeast. In contrast, the areas in Lao PDR and Cambodia are
generally flat and parts of the forested areas are inundated during wet season. As a result
of the highly heterogenuous landscape, wide-ranging species seasonally migrate across
the tri-national boundaries and some are dependent on strictly limited resources, including
permanent waterbodies and lowland forest patches in the dry season (Bhumpakphan,
2003). The resources are scattered in protected areas, while remnant forests outside the
reserves are vulnerable to disturbance .
Besides diversity of natural feaures, the disparities of local livelihhod,
conservation efforts and human capacity are clearly recognized among the three
countries. According to the International Monetary Fund, the Gross Domestic Product
(GDP) per capita in 2013 in Thailand was US$ 7,907. In contrast, the average GDP per
capital in Lao PDR and Cambodia was US$ 2,054 and US$ 1,818, respectively.
Cambodia and Lao PDR have some of the most extensive intact natural forests, but the
countries lack sufficient capacity to effectively maintain the remaining forest covers and
conserve biodiversity at all levels (Galt et al., 2000). In contrast, the Government of

PD 577/10 Rev.1 (F)
2
Thailand has deployed a lot of park rangers and facilities to manage and to protect
biological resources but Thailand’s protected areas contain relatively less biodiversity
than protected areas in Lao PDR and Cambodia (Trisurat, 2003). These contrasting
economic and biodiversity conservation conditions have resulted in an influx of foreign
migrant workers and illegal wild flora and fauna trades into Thailand (Trisurat, 2007).
Therefore, long-term persistence of trans-boundary biodiversity in the ETFC is
largely dependent on the cooperation between the three countries to safeguard the
remaining habitats and to reduce anthropogenic pressures both inside and in the buffer
zones of the protected forests. To address some of these issues, the Government of
Thailand has with technical support from the International Tropical Timber Organization
(ITTO) and financial support from Japan, Switzerland and USA has initiated the
framework of trans-boundary biodiversity conservation in cooperation with Cambodia,
and Lao PDR since 2001 (Kalyawongsa and Hort, 2010). The project phase I,
“Management of the Pha Taem Protected Forests Complex to Promote Cooperation for
Trans-boundary Biodiversity Conservation between Thailand, Cambodia and Laos
(Phase I),” in the period 2001-2003 was primarily aimed at initiating a management
planning process for the Pha Taem Protected Forests Complex (PPFC) in the framework
of trans-boundary biodiversity conservation and establishing cooperation among the three
countries. At the end of phase I, Cambodia showed interest and jointly developed a
second phase proposal recommending the Preah Vihear Protected Forest for the
Conservation of Genetic Resources of Plants and Wildlife (PVPF) to be included in the
project area. The project phase II (2008-2010) was directed to strengthening tri-national
cooperation and implementing biodiversity conservation activities through the
involvement of local communities and improvement of livelihoods of local residents
living in or close to the buffer zones of the protected forests (Trisurat, 2007).
In spite of the relative progress of establishing and promoting trans-boundary
biodiversity conservation areas (TBCAs) in the ETFC, there were some constraints
limiting the achievement and affecting the sustainability of project objectives identified in
the evaluation report for the project phase II (Gasana, 2010). These included project
design limitations and limited scale of project interventions in the Cambodia component
of the program, as well as incomplete establishment of effective partnerships with civil
society for long-term sustainability of the project. In addition, approximately 30% of dry
dipterocarp forest mainly in the buffer zones and protected areas in Cambodia and Lao

PD 577/10 Rev.1 (F)
3
PDR was converted to other land-use classes, including to rubber plantation in Thailand,
unsustainable logging concession in Lao PDR and land allocation program for military in
Cambodia (Trisurat et al., 2014). These issues were overlaid by external constraints
associated with the limited participation of Lao PDR in project activities and border
disputes between Thailand and Cambodia, which reduced the level of trans-boundary
cooperation (Kalyawongsa and Hort, 2010). In respond to those challenges, the Royal
Forest Department (RFD) in Thailand and the Forest Administration (FA) in Cambodia,
which are the main executing agencies received financial support from the Government of
Japan to execute the project phase III (2012-2015). The specific objective of the current
phase aims at strengthening the protection of trans-boundary habitats of the protected
wide-ranging wildlife species in the ETFC landscape.
The RFD invited the Forestry Research Center of the Faculty of Forestry,
Kasetsart University (KU) to render professional services assigned to 1) Geographic
information system (GIS) Consultant and 2) Wildlife Consultant. This technical report
presents the main outputs from the GIS Consultant (Prof. Dr. Yongyut Trisurat),
including updating the GIS database for trans-boundary biodiversity conservation
planning and assisting joint researches on land-use modeling and wide-ranging species
distribution in the ETFC. It should be noted that this technical report focuses on the
second objective using the updated GIS database and involvement of multi-stakeholders
participating in the series of training workshops as outlined in the Term of References
(TORs) between the RFD and KU.

PD 577/10 Rev.1 (F)
4
2. CONCEPTS AND BACKGROUNDS
The Term of References (TORs) has defined six main activities to be implemented by the
GIS consultant. The activities are as follows:
- Work with the project team and other consultants to develop additional GIS
database as might be required.
- Work with GIS consultants and wildlife scientists in Cambodia and Laos,
respectively to ensure that both countries develop GIS using a standardized
design.
- Propose mechanism and guidelines for joint research activities on wide-
ranging species distribution among the three countries.
- Conduct GIS training for scientists and professional staff of the three
countries.
- Predict land use change and its consequences on wildlife distribution in the
Emerald Triangle
- Assist in formulating protection a framework to prevent future land use
changes.
The processes to achieve these activities include 1) core GIS dataset development,
2) GIS database design and development, 3) collection of wildlife occurrence data, 4)
prediction of land use change, 5) modeling species distributions and 7) formulating
management strategies as shown in Figure 1.

PD 577/10 Rev.1 (F)
5
Figure 1 General guidelines for GIS database implementation
2.1 GIS Dataset
To ensure that the three participating countries develop GIS using a standardized design
and use the GIS data to enhance trans-boundary biodiversity conservation, the processes
of database development can be categorized into three main steps, including 1) defining
core GIS database for the PPFC and the ETFC; 2) GIS data catalogue and design; and 3)
database development. They are described in details as follows:
2.1.1 Core GIS database
The GIS database is intended to be used to support biodiversity conservation and
protected areas management and decision-making at both the PPFC and the ETFC levels.
Therefore, the GIS database consists of two datasets. The core GIS dataset at scale
1:50,000 for the PPFC consists of 11 themes and more than 30 layers, including their
attributes as shown in Table 2. The spatial extent of the PPFC dataset covers 16
topographic map sheets (Table 1). Basically, they were updated from the project phase II

PD 577/10 Rev.1 (F)
6
(Trisurat, 2010). The review of the work to date both at national (Thailand’s protected
areas and wildlife conservation) and regional levels (Greater Mekong Sub-region) (ADB,
1998) found that the vector-based model (shape file) and the raster-based model (grid),
developed by ArcView and ArcGIS soft wares, are commonly used in the region.
Therefore, in the context of the Emerald Triangle the spatial elements are largely restored
in vector model, but raster data is wherever applicable.
In addition, the project phase III also aimed to develop GIS database for land-use
and species distribution modeling at the ETFC. This dataset includes 9 themes and 18
layers (Table 2). Generally, they were gathered from existing databases available in other
organizations (e.g., FA-Cambodia, Mekong River Commission, FAO, WorldClim
database). Road and stream networks were updated from topographic maps and Landsat-
8 TM, and later interpolated to obtain proximity distance to these line features. The pixel
resolution of 500 m was selected for land use modeling because it was suitable for
landscape scale and generally relevant to original data.

PD 577/10 Rev.1 (F)
7
Table 1 Proposed core datasets for the PPFC
Relevant to
Core Dataset Spatial Layer Spatial data
type
Attribute Land use Wildlife
1. Admin. Country* Polygon Name NA NA
Province* Polygon Name NA NA
District* Point, polygon Name Delivery NA
Sub-district* Polygon Name, population NA Threat
Village* Point Name
Population
Threat Threat
2. Biodiversity Land use types*
(present/predicted)
Polygon Land use class Baseline Food and cover
Wildlife observation Point Name, location
and date
NA Occurrence,
distribution
Wildlife habitat suitability
1/*
Polygon Suitability class NA
Forest inventory plot Point Location, sector,
tree name
NA Food
LTER Plot Polygon Site ID NA NA
Tree tagging Point Name, ID, girth NA NA
3. Geology Geology Polygon Rock type,
Lithology class
Parent material NA
4. Infrastructure Roads* Line Width, surface
type
Accessibility Threat
5. Meteorology Weather station Point Name and
measured
parameter
Determine vegetation
type & specific crop
Water source
Annual rainfall* Grid Amount of rainfall
6. Protect Protected area* Polygon Name Restriction area Protection
measure
Locations of HQ and
Ranger Station*
Point Name Restriction area Protection
measure
Attraction location Point Name and type NA Threat
7. Soil Soil* Polygon Name and texture Parent material NA
8. Threats Encroachment Polygon Type of crop Demand Threat
Wildlife poaching Point Wildlife name,
signs
NA Threat
Illegal logging Point Tree name NA Threat
9. Topography Contour* Line Elevation value Natural barrier Natural barrier
Spot height elevation Point Height and name Natural barrier Natural barrier
DEM 2/* Grid Altitude Natural barrier Natural barrier
Slope 2/* Polygon/Grid Class Natural barrier Natural barrier
Aspect 2/ Polygon/Grid Class Suitability Natural barrier
10. Water River and stream
network*
Line Name and type Irrigation Water sources
Water body (e.g. reservoir) Polygon Name Irrigation Water sources
11. Images Past satellite image Pixel Value Data source Data source
Present satellite image Pixel Value Data source Data source
Remarks: * - primary GIS layer; 1/ derived from spatial analysis; 2/ derived from contour line

PD 577/10 Rev.1 (F)
8
Table 2 Proposed core datasets for the entire Emerald Triangle landscape
Theme Spatial Layer Spatial
data type
Attribute Scale/
resolution
Source
1. Land use Land use types
(2003)
Grid Land use class 250 m MRC1/
Land use types
(2013)
Grid Land use class 250 m Image
interpretation
2. Admin. Country Polygon/L
ine
Name 1:250,000 MRC
Population density Polygon/L
ine
Name 1:250,000 MRC
3. Geology Geology Polygon Rock type 1:250,000 MRC
4. Climate Bioclim 1 Grid Mean annual
temperature
(°C x 10)
1 km World climate
Bioclim 12 Grid Annual rainfall 1 km World
climate
Bioclim 17 Precipitation of
driest quarter
1 km World
climate
Bioclim 18 Precipitation of
warmest
quarter
1 km World
climate
5. Protect Protected area Polygon Name 1:50,000 Phase II and
Laos
6. Soil Soil Polygon/g
rid
Soil order 1:250,000 FAO & MRC
7. Threats Distance to main
road
Grid Nearest
distance
250 Topo map &
image
Distance to city Grid Nearest
distance
250 MRC
Population Grid Population
density per cell
1:250,000 LandScan
8. Topography DEM2/ Grid Altitude 100 m ASTER3/
Slope Grid % 100 m ASTER
Aspect Grid Degree
northward
100 m ASTER
9. Stream Distant to main
stream and river
Grid Nearest
distance
250 Topo maps &
interpolation
Remarks: 1/ Mekong River Commission; 2/ Digital elevation model; 3/Advanced
Spaceborne Thermal Emission and Reflection Radiometer (ASTER)
2.1.2 Data catalogue and database dictionary
The data catalogue contains information on spatial data and non-spatial data, source of
information, date of production and scale. In addition, all detailed database designs are
PD 577/10 Rev.1 (F)
9
compiled in a database dictionary, which ensures simplicity and integration between data
custodians and end-users. The bilingual database dictionary (Thai and English) was
produced during the previous project phases (Trisurat, 2003b, 2010) in order to describe
all coverage, tables, columns and relationships. It also contains the database object names
(e.g. administration, elevation), description, data type, length, etc. Therefore, the project
phase III has simply used the existing database dictionary.
2.1.3 Database development
As discussed earlier, the sources for geo-spatial data are probably more numerous and of
greater variety than in most other information sets. At the outset, the data, such as those
identified as core datasets mentioned above, can be imported/input to GIS from various
sources, such as:
Various digital forms: vectors, raster, database, spreadsheet tables, satellite
data, internet, etc.;
Non-digital graphics, such as conventional maps, photographs, sketches,
schematic diagrams, and the likes;
Conventional documents in registers and files;
Compilations in scientific reports; and
Collections of survey measurements (expressed in coordinates or other
units).
These regional and global data restored in various digital forms were then
converted to GIS format (Shapefile or Grid). It should be noted that all GIS layers were
developed using map datum WGS84 UTM zone 48 and that the main project execution,
especially data conversion was done at the Faculty of Forestry, Kasetsart University in
Bangkok.
2.2 GIS Training Courses
Geographic Information System or GIS can be defined as “ a power tool for collecting,
storing, retrieving at will, transforming and displaying spatial information from the real-
world for a particular set of purposes” (Burrough, 1986). It is information that identifies
the geographic location and characteristics of natural or constructed features and
boundaries on the earth. The main difference between geographical data or GIS and other

PD 577/10 Rev.1 (F)
10
data is that the latter helps answer question like, what? or where? and the former answers
both what? and where? Therefore, GIS has been widely used to support protected areas
management (Trisurat, 2007), biodiversity conservation and land-use modeling (Trisurat
et al., 2010)
GIS contains four main components: computer hardware, computer software, data
and human resource. Among these four components, human resource is recognized as the
most important component for effective implementation of GIS in a sustainable manner.
Therefore, the GIS consultant worked closely with the Project Managers of Thailand
Component (Mr. Kamol Wisupakan) and Cambodia Component (Mr. Dany Chheang) to
arrange training courses aiming at developing human resources with the skills and
technical knowledge necessary to effectively and efficiently obtain, exchange and use
core datasets. Three training modules were developed, namely 1) Introduction of GIS,
Map Reading and GPS Mapping; 2) Land Use Modeling; and 3) Species Distribution
Modeling. The proposed objectives, contents and participants are shown in Table 3.

Tab
le 3
P
ropose
d G
IS t
rain
ing w
ork
shops
for
the
pro
ject
phas
e II
I co
nduct
ed b
y t
he
GIS
co
nsu
ltan
t*
Cou
rse
titl
e
Ob
ject
ive
Parti
cip
an
ts
Pla
ce/
da
te
Intr
oduct
ion o
f G
IS, M
ap
Rea
din
g a
nd G
PS M
appin
g
Ref
resh
GIS
skil
ls a
nd t
o g
uid
e
ho
w t
o c
oll
ect
and d
evel
op
stan
dar
diz
ed c
ore
GIS
dat
abas
e
Thai
par
k r
anger
s an
d i
nte
rest
ed
peo
ple
involv
ed i
n t
he
pro
ject
(e.g
. pat
rol
bord
er p
oli
ces,
RF
D
off
icia
ls)
PP
FC
fie
ld o
ffic
e at
Pha
Tae
m
Nat
ional
Par
k, U
bon r
atch
ani
Pro
vin
ce
Inte
rnati
onal
Land U
se M
odel
ing
U
nder
stan
d v
ario
us
land
-use
mo
del
ing t
echniq
ues
; dev
elop
lan
d-u
se s
cen
ario
s in
203
0, an
d
be
fam
ilia
r w
ith C
LU
E-s
model
usi
ng t
he
ET
FC
dat
abas
e
GIS
sta
ff a
nd p
ark r
anger
s of
thre
e co
untr
ies
(Thai
land
, L
ao
PD
R a
nd C
ambodia
)
Cam
bodia
or
Lao
PD
R
(Cham
pas
ak U
niv
ersi
ty)
Spec
ies
Dis
trib
uti
on M
odel
ing
U
nder
stan
d v
ario
us
spec
ies
dis
trib
uti
on m
odel
s, a
nd
emphas
is o
n l
ogis
tic
regre
ssio
n
and M
AX
EN
T m
odel
s
GIS
sta
ff, par
k r
ang
ers
and
wil
dli
fe s
cien
tist
s of
thre
e
countr
ies
(Thai
land,
Lao
PD
R
and C
ambodia
)
Lao
PD
R (
Cham
pas
ak
Univ
ersi
ty)
or
Cam
bodia
(Fore
stry
Adm
inis
trat
ion).
*ex
cludin
g c
ontr
ibuti
on t
o t
he
wil
dli
fe m
onit
ori
ng w
ork
shop
PD 577/10 Rev.1 (F)
11

PD 577/10 Rev.1 (F)
12
The GIS Consultant defined qualifications of potential candidates, and worked
closely with the two Project Managers and Wildlife Consultants of Thailand and
Cambodia, as well as the Cambodian GIS consultant in order to identify suitable
participants to the training courses. The project provided facilities and supported
participants.
2.3 Land Use Modeling
It is important to understand present and future land-use/land-cover patterns because
deforestation is considered to have a large as an important effect on wildlife distribution
and biodiversity (Sodhi et al. 2004; Corlett 2012). This is due to the fact that
deforestation does not only cause habitat loss, but also results in habitat fragmentation,
diminishing patch size in core area, and isolates of suitable habitats (MacDonald, 2003).
Trisurat and Duengkae (2011) indicated that the predicted occurrence of Black-crested
Bulbul (Pycnonotus melanicterus) in the Sakaerat Man and Biosphere Reserve in Nakhon
Ratchasima Province, Thailand would significantly decrease even if forest cover only
slightly declined from 45.3% to 42% of the reserve and otherwise intact habitats would be
severely fragmented.
Various models have been develop to forecast future land-use patterns, they range
from simple system representations, including a few driving forces, to simulation systems
based on a profound understanding of situation-specific interactions among a large
number of factors (Verburg et al., 2004; Pontius et al., 2008). The Markov Chain Model
is a simple land use model that uses previous land use trends to predict what will happen
in the future. However, it is not capable of addressing land suitability, land demands and
government policies (Pontius et al., 2008). A Cellular Automata then incorporates spatial
components in the traditional Markov Chain Model and can address dynamisms with
simple rules (Baker, 1989). It has been applied in a wide range of land-use change
applications (Houet, and Hubert-Moy, 2006; Ballestores and Qiu, 2012). Recently, an
agent-based model was developed to allow the influence of human decision-making on
the environment to be incorporated in a mechanistic and spatially explicit way, also
taking into account social interaction, adaptation and decision-making at different levels
(Matthews et al., 2007).

PD 577/10 Rev.1 (F)
13
The current research used the Dyna-CLUE (Conversion of Land Use and its
Effects) model (Verburg and Overmars, 2009) to assess future land-use at the ETFC. The
Dyna-CLUE model was chosen for this study because it explicitly addresses the dynamics
of the different future land demands. In addition, it has been used at both local level
(Trisurat et al., 2010) and regional level (Verburg and Veldkamp, 2004) and has been
proven to be useful for different popular land-use change models (Pontius et al., 2008).
Specific objectives were (1) to quantify rate of land-use/land-cover change in recent years
and (2) to allocate land-use change and land-use patterns across the ETFC based on
different demand scenarios of stakeholders from the three participating countries.
2.4 Wildlife Habitat and Species Distribution Modeling
Habitat is the specific place or environment where an organism lives. Hutchinson (1957)
and Patton (1992) defined habitat as all factors affecting an animal’s chance to survive
and reproduce in a specific place. They include not only the abiotic environment but also
biotic factors of the respective ecosystem determining the abundance of resources as well
as their trophic chain interactions. These specific places are often described by a
vegetation type or a topographic feature (e.g., food, water, cover and space) and can be
derived from maps. A food map should include shrub areas, location of big trees (i.e.
Ficus spp.), concentrations of big trees, salt licks and natural openings, while a cover map
should include plant canopy, location of caves and trees, etc. A water map should show at
least the stream network, water bodies and amphibian habitats.
Ecological niche was developed similar to habitat and broadly classified into three
major concepts (Kimmins, 2004). Firstly, it refers to the functional role of a species in an
ecosystem and how the species fits into the complex functional processes of the
ecosystem and also defined as the relationship of an animal to food and enemies.
Secondly, niche refers to the habitat of a species: the range of environments in which it
lives. This definition also includes its temporal adaptations to light, temperature,
moisture, soil, fires, and the amplitude of these factors. Thirdly, it involves the geographic
distribution or range in which a species is found in the landscape.
Species-distribution models are based on the assumption that the relationship
between a given pattern of interest (e.g. species abundance or species occurrence) and a
set of factors assumed to control and can be quantified (Guisan and Zimmermann, 2000).

PD 577/10 Rev.1 (F)
14
Basically, there are two approaches for developing species distribution maps: the
deductive approach and the inductive approach, and the selection of these approaches is
dependent on objectives and data availability (Stoms et al., 1992). The deductive
approach extrapolates known habitat requirements or expert judgments to the spatial
distributions of habitat factors. If the habitat requirements are not well known, the
distribution map can be derived from a sample of observations of the species locations to
one or more habitat factors. This method is named inductive approach. Based on these
two general approaches, the existing species distribution models are categorized into three
modeling techniques, namely (1) cartographic overlay, (2) species modeling using
presence-absence data, and (3) species modeling using presence-only data. The elements
of each approach are illustrated in sections below.
2.4.1 Cartographic overlay
A Habitat Suitability Index (HIS) is one deductive approach that has been developed
using cartographic overlay technique (Patton, 1992). Once the species has been selected a
habitat suitability index based on research data and expert opinions is calculated. The
assumption is that the HIS, a numeric value summarizing habitat suitability based on
ranking habitat quality (e.g., 0.0-1.0 or 1-3), can be developed for the selected species.
There are a series of HIS equations as follows:
HIS = [V1 + V2 + V3]/3 Compensatory Model
HIS = [2V1 + V2 + V3]/4 Weighted Mean
HIS = [V1 x V2 x V3]1/3 Geometric Mean
Where HIS = habitat Index Suitability
Vi = habitat factors (e.g., food, cover, water, space).
A large number of habitat suitability indices have been developed for both
terrestrial and aquatic habitats. In operation, a Geographic Information System (GIS) is
used to create habitat factors, assign numeric values based on habitat quality, overlay all
these layers and calculate suitability classes.
To proceed this method, the required wildlife habitat factors were first reclassified
according to their attributes and their suitability for each species (e.g., 3-suitable, 2-

PD 577/10 Rev.1 (F)
15
moderate and 1-not suitable). For instance, during the project phase I, dry evergreen
forest was assigned as 3 because it is preferred by elephant. Meanwhile, score 2 is
assigned for deciduous forest and scrub while score 1 is given to the remaining classes
which are dominated by human activities (Trisurat, 2010). The weighting scores for each
factor may be included to determine their importance for species distribution. For
example, altitude and proximity to a stream are more important than vegetation for
elephant distribution because they normally roam in low altitude, flat terrain and prefer to
remain close to water sources. Therefore, the proposed weighting scores may be 4, 4 and
2 with the total of 10.
2.4.2 Species distribution modeling using presence–absence data
A range of species distribution models have been developed for binary response variables
(presence/absence) such as Generalized Additive Models ((Hastie and Tibshirani, 1990)
and Generalized Linear Models (GLM). Logistic regression modeling, a particular branch
of GLM, is a multivariate statistical technique that is used to predict a binary dependent
variable (presence or absence) from a set of variables (Atkinson and Massari, 1998). It is
an inductive approach in which the result is derived from the statistical relationship
between a sample observation and related variables. The advantage of logistic regression
is that the variables may be either continuous or discrete, or any combination of both
types, and they do not necessarily have normal distributions. Therefore, it is not necessary
to categorize explanatory factors before entering them in the model. The algorithm of
logistic regression applies maximum likelihood estimation after transforming the
dependent into a logit variable (the natural log of the odds of the dependent occurring or
not). In this way, logistic regression estimates the probability of a certain event occurring
(Lee and Nelder, 1996; Atkinson and Massari 1998). The logistic regression model is:
Prob event = e
eZi
Zi
1
Where Z i is the linear combination model of species I as follows:
Z = 0 + 1X1 + 2X2 + … + nXn
I = coefficient
Xi = independent variables (habitat factors)
PD 577/10 Rev.1 (F)
16
The probability values derived from the regression models range from 0.0-1.0.
The higher the value, the greater the likelihood of occupancy of the target species. A cut-
off value of 0.5 was used for binary classification. Any pixel containing the probability
values equal to or greater than 0.5 was categorized as presence, otherwise as absence. In
some cases, the cut-off value for binary classification may be adjusted (0.4, 0.45, 0.50,
0.55 and 0.60) to maximize the fit for sample data based on prior knowledge (Neter et al.,
1996; Trisurat et al., 2010).
The logistic regression model remains the most widely used model for predicting
the potential distributions of species (Guisan and Zimmermann, 2000). For example,
Trisurat et al. (2011) employed this method to predict distributions of key mammal
species in the Western Forest Complex in Thailand. In addition, Phrommakul (2003) used
the same method to estimate seasonal distribution of tiger in the Thung-Yai-Huai Kha
Khaeng world heritage site in Thailand.
2.4.3 Species distribution modeling using presence-only data
Reliable species distribution information on various scales is needed for both
biogeographic and conservation purposes. Species distribution data from herbarium and
museums, taxonomic literature, ecological communities, inventory data and field
observations that were documented in databases and GIS can provide information
relevant to the development of prediction maps (Dennis and Hardy, 1999; Chefaoui and
Lobo, 2008). However, these heterogeneous data sources generally do not indicate the
locations where the species have been found after a sufficiently intense collection effort
as pseudo-absences can decrease the reliability of prediction models (see Anderson, 2003;
Loiselle et al., 2003).
There are many methods that use presence-only data for modeling species
distributions. For instance, BIOCLIM predicts suitable conditions in a bioclimatic
envelope, consisting of a rectilinear region in environmental space and representing the
range of observed presence values in each environmental dimension (Busby, 1986). In
addition, DOMAIN predicts the suitability index by computing the minimum distance in
environmental space to any presence record (Carpenter et al., 1993) Environmental-Niche
Factor Analysis (ENFA, Hirzel et al., 2002) uses presence localities together with
environmental data for the entire study area, without requiring a sample of the
background to be treated like absence. It is similar to principle components analysis
PD 577/10 Rev.1 (F)
17
(Jolliffe, 2002), involving a linear transformation of the environmental space into
orthogonal marginality and specialization factors. Then, environmental suitability is
modeled as a Manhattan distance in the transformed space. In addition, the maximum
entropy method (MAXENT) uses entropy as the means to generalize specific
observations of presence of a species, and does not require or even incorporate absence
points within the theoretical framework (Peterson et al., 2001).
The idea of MAXENT is to estimate a target probability distribution by searching
the probability distribution of maximum entropy (i.e., the distribution that is most spread
out, or closest to uniform), subject to a set of constraints that represent our incomplete
information about the target distribution. The information available about the target
distribution often presents itself as a set of real-valued variables, called “features”, and
the constraints are that the expected value of each feature should match its empirical
average (i.e., average value for a set of sample points taken from the target distribution).
When MAXENT is applied to presence-only species distribution modeling, the pixels of
the study area make up the space in which the MAXENT probability distribution is
defined. Pixels with known species occurrence records constitute the sample points, and
the features can be climatic variables, elevation, soil category, vegetation type or other
environmental variables and functions.
The advantages of MAXENT include the following: (1) it requires only presence
data and environmental factors, (2) it can utilize both continuous and categorical
variables, and (3) it is efficient at determining the algorithms for converging the optimal
probability distribution (Philips et al., 2006). According to Tognelli et al. (2009),
MAXENT was one of the strongest performing methods among four groups of modeling
techniques (artificial neural networks, - BIOCLIM, classification and regression trees, -
DOMAIN, generalized additive models,-GARP and generalized linear models, -
MAXENT), particularly for species sampled from a relatively low number of localities.
Therefore, it was used to estimate the probability distribution of selected species in the
project phase III. The advantages and disadvantages of the three species distribution
approaches are presented in Table 4.

PD 577/10 Rev.1 (F)
18
Table 4 Comparisons of species distribution models
Model Advantages Disadvantages
Cartography overlay Simple to understand;
Applicable for all species
either with or without
occurrence data.
Normally overestimates the
distribution range
Largely depending on
expert knowledge.
Logistic regression model The relative importance of
different predictor variables
in determining species
distribution can be assessed
Requires large input dataset
in order to obtain a
meaningful model.
Maximum entropy model Uses only presence data to
run, easy to obtain.
The relative importance of
different predictor variables
in determining species
distribution can be assessed.
Can effectively model
species distribution from
small dataset.
Predicted distribution might
be biased due to non-
systematic samplings and
can be overestimated or
underestimated due to the
sampling scheme.
Source: Trisurat et al. (2011)

PD 577/10 Rev.1 (F)
19
3. STUDY AREA
3.1 Geographical Location
The Emerald Triangle Protected Forests Complex (ETFC) comprises the Pha Taem
Protected Forests Complex (PPFC) in Thailand, the Preah Vihear Protected Forest for the
Conservation of Genetic Resources of Plants and Wildlife (PVPF) in Cambodia and two
national biodiversity conservation areas (NBCA) in Lao PDR. The total protected areas
encompass approximately 6,500 km2. The study area of this research also covers
surrounding areas of protected areas located within the rectangular extent covering all
together approximately 25,800 km2 (Figure 2).
The PPFC is located between latitudes 14 12.5 and 15 13.9 North and
longitudes 104 58.5 and 105 8.5 East in Ubon Ratchathani province. It comprises five
protected areas, namely Pha Taem National Park, Kaeng Tana National Park, Phu Jong-
Na Yoi National Park and Yot Dom and Bun Thrik-Yot Mon Wildlife Sanctuary. The
collective area of the complex is approximately 1, 736 km2 with a perimeter of 730 km.
Some 317 km, or 43% of its total border, adjoins Lao PDR (298 km, or 40.96%) and
Cambodia (18 km, or 2.5%) (Table 1). Currently, 26 ranger stations (including
Headquarters) have been established to manage biological resources and facilitate tourism
activities. The number of park officials and employees varies from time to time.
The PVPF is a part of the Northern Plains of Cambodia and is located in Preah
Vihear Province. It is situated south of the Yot Dom Wildlife Sanctuary between latitudes
13º51’ and 14º25’ north and longitudes 104º52’ and 105º47’ east. The PVFP covers an
area of approximately 1,900 km2 and its total perimeter is 386 km. Approximately 186
km or 48% of the total border length is adjoining Thailand (72 km or 18.65%) and Laos
(114 km or 29.53%) (Table 5).
There are two protected areas in Lao PDR located in the ETFC, namely Phou
Xeing Thong National Biodiversity Conservation Area and Dong Khanthung proposed
National Biodiversity Conservation Area. The Phou Xeing Thong National Biodiversity
Conservation Area located in Saravan Province, Lao PDR has an area of approximately
1,015 km2. Dong Khanthung proposed National Biodiversity Conservation Area is
situated in Champasak Province between latitudes 14º5’ and 14º30’ north and longitudes
105º12’ and 105º45’ east. It has an area of approximately 1,828 km2 (Figure 2). It
PD 577/10 Rev.1 (F)
20
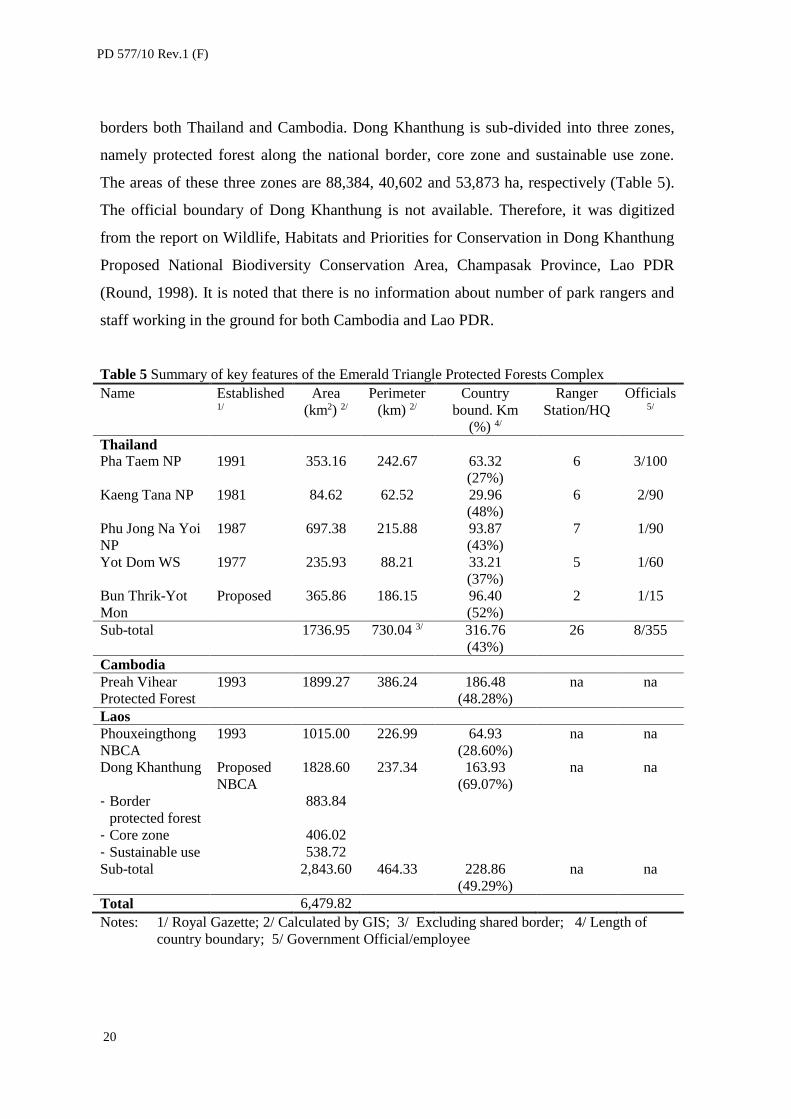
borders both Thailand and Cambodia. Dong Khanthung is sub-divided into three zones,
namely protected forest along the national border, core zone and sustainable use zone.
The areas of these three zones are 88,384, 40,602 and 53,873 ha, respectively (Table 5).
The official boundary of Dong Khanthung is not available. Therefore, it was digitized
from the report on Wildlife, Habitats and Priorities for Conservation in Dong Khanthung
Proposed National Biodiversity Conservation Area, Champasak Province, Lao PDR
(Round, 1998). It is noted that there is no information about number of park rangers and
staff working in the ground for both Cambodia and Lao PDR.
Table 5 Summary of key features of the Emerald Triangle Protected Forests Complex
Name Established 1/
Area
(km2) 2/
Perimeter
(km) 2/
Country
bound. Km
(%) 4/
Ranger
Station/HQ
Officials 5/
Thailand
Pha Taem NP 1991 353.16 242.67 63.32
(27%)
6 3/100
Kaeng Tana NP 1981 84.62 62.52 29.96
(48%)
6 2/90
Phu Jong Na Yoi
NP
1987 697.38 215.88 93.87
(43%)
7 1/90
Yot Dom WS 1977 235.93 88.21 33.21
(37%)
5 1/60
Bun Thrik-Yot
Mon
Proposed 365.86 186.15 96.40
(52%)
2 1/15
Sub-total 1736.95 730.04 3/ 316.76
(43%)
26 8/355
Cambodia
Preah Vihear
Protected Forest
1993 1899.27 386.24 186.48
(48.28%)
na na
Laos
Phouxeingthong
NBCA
1993 1015.00 226.99 64.93
(28.60%)
na na
Dong Khanthung Proposed
NBCA
1828.60 237.34 163.93
(69.07%)
na na
- Border
protected forest
883.84
- Core zone 406.02
- Sustainable use 538.72
Sub-total 2,843.60 464.33 228.86
(49.29%)
na na
Total 6,479.82
Notes: 1/ Royal Gazette; 2/ Calculated by GIS; 3/ Excluding shared border; 4/ Length of
country boundary; 5/ Government Official/employee

PD 577/10 Rev.1 (F)
21
Figure 2 Location of the Emerald Triangle protected forests complex along the borders of
Thailand, Lao PDR and Cambodia.

PD 577/10 Rev.1 (F)
22
3.2 Environmental Aspects
The terrain of the PPFC is flat to undulating with elevations ranging from 100 m to 732 m
above sea level. The terrain in the west and northwest is relatively low and then rises to
the east and south before declining to the Mekong River (Trisurat, 2003a). The rivers and
streams that have their origin in the PPFC provide the primary water resources for two
hydro-power reservoirs.
Three main vegetation types have been described based on the interpretation of
satellite imagery in 2002 in the PPFC. They are dry evergreen forest, mixed deciduous
forest, and dry dipterocarp forest. More than 288 tree species have been identified
(Marod, 2003) and at least 49 mammals, 145 birds, 30 reptile and 13 amphibian species
have been recorded, but large wildlife species such as Asian Elephant (Elephas maximus),
banteng (Bos javanicus), freshwater crocodile and tiger have only been observed along
the tri-national borders (Bhumpakphan, 2003).
The Preah Vihear Protected Forest (PVPF) in Cambodia is situated within the
Indo-Burma Biodiversity Hotspot, which is one of twenty five Hotspots that are
recognized globally. According to the forest cover assessments that were conducted in
2002 and 2006, forest land represents 96.78% of the total surface area of the PVPF, with
dry deciduous forest the dominant forest type, representing almost 67% of its total surface
area. There are two primary rivers, the Mekong and the Ro Pov, located to the northeast of
the PVPF, which have an important role in the region, not only for transportation, but also
for the social and economic sectors.
The area is home to 57 mammal species and about 255 species of birds, 58 species
of reptiles and numerous species of amphibians, including several globally-threatened
species. It is probably the most important site globally for the critically-endangered Giant
ibis (Pseudibis gigantean) and the most important site in south-east Asia for three
critically-endangered vultures. It also has important populations of the Asian elephant,
banteng, Eld’s deer (Rucervus eldii siamensis), fishing cat (Prionailurus viverrinus), dhole
(Cuon alpinus) and white-winged duck (Cairinia scutata), all of which are endangered.
Other threatened species that may be seen in the PVPF include the gaur (Bos gaurus), the
Bengal slow Loris (Nycticebus bengalensis), the northern pig-tailed macaque (Macaca
leonine), the Malayan sun bear (Helarctos malayanus), the green peafowl (Pavo muticus)

PD 577/10 Rev.1 (F)
23
and the Sarus Crane (Grus antigone). The primary biodiversity value of the PVPF is its
populations and unique assemblages of large mammals and water birds.
Since 1998, the Forestry Administration, in cooperation with Cat Action Treasury
and the Wildlife Conservation Society (since 1999) have conducted biodiversity
conservation surveys in Preah Vihear. The results of those surveys have documented an
impressive list of fauna, probably unique in south-east Asia for its representation of
species from dry dipterocarp forests and related habitats, many of which are in rapid
decline elsewhere.
3.3 Social and Cultural Aspects
There are more than 80 villages situated within three kilometers of the boundaries of the
PPFC in Thailand with a total estimated population of approximately 89,000. The
livelihood choices of local people often impact biodiversity conservation through
potential conflicts of interest between those livelihood choices and the conservation of
protected forest areas. This may lead to forest encroachment to support unsustainable
agriculture practices, the introduction of cow and buffalo into protected forest areas, and
wildlife poaching.
The majority of local households (70%) are engaged in agriculture as their
primary occupation, followed by fisheries (10%). The average annual household income
of local communities is US$ 1,070, which is only about one-third of that in Ubon
Rachathani city. Sixty-four percent of the local population believes that their incomes are
insufficient (Tanakajana, 2003) to cover expenses for food and basic services. Less than
half of the local populations (40%) have received a primary school education, while only
30% have received a secondary school education.
Currently, there are four communities situated inside the Pha Taem National Park.
These communities settled there long before the establishment of the national park. There
have been no substantive reports of conflicts between local people and park rangers,
however, since local people agreed to stop their practice of shifting cultivation.
Considering the political situation and the improved relationship between the local people
and park rangers, no resettlement programs have been planned.

PD 577/10 Rev.1 (F)
24
While social conditions inside protected areas and in the buffer zone in Lao PDR
are apparently difficult, reliable statistics are currently unavailable. In Cambodia, the
province of Preah Vihear is sparsely populated with about 130,000 primarily poor, rural
residents. Until 1998, it was primarily accessible only by air because of its remoteness
and since large areas were still insecure and most roads remained mined. As a
consequence, the province has not generally benefited from the economic development
that has been occurring throughout the country. There are seven districts in the province,
but four of them are cut off in the wet season by the Steung Saen River. Security
concerns, as well as access to most parts of the province, have improved (Royal
Government of Cambodia, 2000), but while some socio-economic information is
available, it has yet to be completely assessed, especially with regard to those living in
and around the PVPF.
Within and surrounding the PVPF are 3,042 families with the total population of
14,189. Some 3% of that population consists of minority ethnic groups. Life expectancy is
increasing and is now 58 years for women and 54 years for men (SCW, 2006). The low
population density, less than 8 persons/km2, in the project area is primarily due to the
inaccessibility that results from flooding in the wet season, the lack of water in the dry
season, undeveloped roads and other infrastructure, and the relatively small land area that is
suitable for intensive agriculture, although some irrigated agriculture is practiced in areas
that are inundated in the rainy season. There is, as a result, a low level of development with
very few employment opportunities. While no specific surveys on family income generation
within the PVPF have been conducted, an estimate of average domestic income per person in
2001 was about USD$259 (Cambodia Forest Administration, 2009). Indeed, a large segment
of the population in Preah Vihear province lives under the poverty line.
On the basis of statistics compiled by the Seila rural development program in 2004,
the percentage of the population between 6-17 years of age attending school in the project
area in Preah Vihear was 21% and the percentage of 14-15 years old attending school was
5%. Moreover, illiteracy in the project area is high, especially for women. Female illiteracy
at age 15 included 8,442 of 17,208 women (49%), while the comparable figure for males at
age 15 was 6,630 of 16,237 men (41%).

PD 577/10 Rev.1 (F)
25
4. APPLIED METHODOLOGY
This section emphasises methods used for land-use modelling and species distribution
modelling. They are presented in the following subsections.
4.1 Land Use Modelling
Basically, there are four main steps to detect land-use/land-cover (LU/LC) change and
modeling as shown in Figure 3. These steps are described as follows:
Figure 3. Main steps of land-use change detection and prediction
4.1.1 Gathering past land-use/land-cover map
The raster LU/LC map of 2003 with a resolution of 250 m covering the entire study area
was obtained from the Mekong River Commission Secretariat (MRC). The original
LU/LC map comprised 14 classes, namely 1) moist evergreen forest, 2) dry evergreen
forest, 3) hill evergreen forest, 4) mixed deciduous forest, 5) dry deciduous forest, 6)

PD 577/10 Rev.1 (F)
26
forest plantation, 7) rubber plantation, 8) oil palm plantation, 9) cash crop, 10) paddy
field, 11) settlement and infrastructure, 12) bare soil and miscellaneous land uses, 13)
rock outcrop and 14) water body. The original 14 LU/LC classes were generalized into 9
classes as a result of combining some classes renamed as evergreen forests (moist, dry
and hill evergreen forests), arable land (paddy, cash crop and oil palm) and bare soil &
rock outcrop. This is because the current Dyna-CLUE version is applicable to not more
than 11 classes (Verburg and Overmars, 2009) for land-use transitions at landscape level.
It was found during field reconnaissance that oil palm was recently introduced and mainly
planted in paddy fields in small patches (less than 250-m resolution). Thus, both classes
show similar image signatures and they are difficult to discriminate.
4.1.2 Preparing current land-use/land-cover map
The current LU/LC map of 2013 was interpreted from satellite images. The relatively
cloud-free Landsat-8 TM imageries were downloaded from USGS (United States
Geological Survey Department - http://earthexplorer.usgs.gov/). A sub-scene of images
path/row 126/49 and 126/50, dated 8 October 2013 and 26 October 2013, respectively,
was extracted and geometrically registered to the UTM coordinate system WGS Zone 48
using the topographic map at scale 1:50,000. Then, these two sub-scenes were mosaicked
using ERDAS Imagine software and false color composite images (band combination 4 5
3 – R G B) were produced for visual interpretation based on tone, shape, size, pattern,
texture, shadow and association (Lillesand et al., 2004). Due to unavailability of reference
data from the NBCAs in Lao PDR, key image features of LU/LC types were sampled
from the PPFC in Thailand and the PVPF in Cambodia.
The current research used the contingency table or classification matrix to
quantify the agreement between the interpreted classes and the known classes of LU/LC
map (Foody, 2002). Omission and commission errors for each LU/LC class, overall
accuracy, and the kappa statistic were calculated for the assessment (Jensen, 1996). A
number of samples classified in preliminary LU/LC classes were selected using stratified
random sampling scheme. The total number of sample locations for arable land, rubber
plantation, forest plantation, dry dipterocarp forest, mixed deciduous forest, dry evergreen
forest, settlement and others classes were 238, 38, 14, 43, 42, 61, 53 and 19, respectively.

PD 577/10 Rev.1 (F)
27
4.1.3 Land-use change detection
The LU/LC maps of 2003 and 2013 were overlaid and change detection between LU/LC
classes was evaluated using transition matrix. In addition, the annual rate of LU/LC
change was determined by using the deforestation rate (DR) equation from year P (start)
until year N (end year) (Trisurat, 2009), as below:
DR (%) = 1001
/1
x
LUyearP
LUyearNt
where DR = Annual rate of change
N = Land-use of end year
P = Land-use of start year
t = Time period; t2 – t1 (10 years)
4.1.4 Land-use change modeling
The Dyna-CLUE model requires four inputs to allocate a set of conditions and
possibilities of LU/LC patterns: (1) land-use requirements, (2) location characteristics, (3)
spatial policies and restrictions, and (4) land-use type-specific conversion settings
(Verburg and Overmars, 2009). Land use requirements were calculated at the aggregate
level jointly defined by 50 multi-stakeholders of the three participating countries
attending the Joint Training Workshop on GIS Modeling for Forest Land Use Planning
during 10-15 March 2014 in Cambodia. Superintendents of protected areas, government
officials, NGOs representatives and lecturers from universities participated in the
workshop.
Using a two dimensional matrix to develop the LU/LC scenarios (Van der
Heijden, 1996), the workshop participants identified population growth as an important
factor and economic growth as a result of the ASEAN Economic Community (AEC) in
2015 scheme as a critical uncertainty to drive four LU/LC . In addition, they jointly
defined the four LU/LC scenarios for the period from 2003 to 2030 (Figure 4).

PD 577/10 Rev.1 (F)
28
Figure 4 Land use/land cover scenarios of the Emerald Triangle
The definitions of the scenarios are detailed as below:
a) Low economic decline and localized resource degradation (business as usual).
A continuation of land transformation of recent years (2003-2013) is foreseen. The recent
land-use change detection revealed that only limited encroachment was observed inside
the PPFC (Protected Areas Region 9, personal communication). Therefore, this scenario
defines the PPFC as restriction areas.
b) Unsustainable economic development and serious resource degradation
scenario. It is predicted that the continuous high rubber prices and high population
growth make it profitable to transform large forest land and bare soil to paddy field and
economic crops.
c) Sustainable poverty and stable resources scenario. A lower rate of land
conversion is assumed due to low population growth and the delay of the AEC scheme,
meaning limited deforestation. In addition, this scenario anticipates effective protection of
remaining forest in all existing and proposed protected areas.

PD 577/10 Rev.1 (F)
29
d) Sustainable development and limited resources degradation scenario. A
relative land conversion rate applies for rubber plantation. Limited forest encroachment
for agriculture outside protected areas and along inner and outer buffer zones of Dong
Khanthung is assumed due to low population growth.
The estimated land demands for each land use class under 4 scenarios are shown
in Figure 5.
Figure 5 Land allocations for four scenarios from 2013-2030
The Dyna-CLUE model determines the location preferences of the different
LU/LC classes based on logistic regression models (Verburg nd Veldkamp, 2004), which
define the relation between occurrence of a particular LU/LC type and the physical and
socio-economic conditions of a specific location (location factors):
Logit(pi) = ln (pi)/(1-pi) = β0 + β1X1 + β2X2+ … + βnXn
where, pi is the probability of a grid cell for the occurrence
β0 = constant value
βi = estimated through logistic regression
Xi = explanatory factors (physical and socio-economic factors)

PD 577/10 Rev.1 (F)
30
The physical factors that indicate the preference for a specific type of land use
were altitude, slope, aspect, distance to available water, annual rainfall, rainfall in wettest
quarter, rainfall in the driest quarter and soil characteristics. In addition, the socio-
economic factors influencing land-use change were distance to district, population density
and distance to main road. Topographic variables were gathered from Advanced Space
Thermal Emission and Reflection Radiometer (ASTER) archive of 100-m resolution
(http://asterweb.jpl.nasa.gov/data.asp). Road and stream networks, and district location
were updated from topographic maps at scale 1:50,000 and Landsat-8 TM, and later they
were interpolated to obtain proximity to road, proximity to stream and proximity to city,
respectively.
Climatic variables of approximately 1-km resolution were downloaded from the
World climate database (http://www.worldclim.org/download), while soil map and
population density were obtained from the MRC. The pixel resolution of 100 m was
selected for this research because it was suitable for landscape scale and relevant to the
original LU/LC map in 2003 and the driving factors. In addition, the goodness-of-fit of a
logistic regression model was evaluated using the receiver operating characteristic
(Hosmer and Lemeshow, 2000). The value of the area under curve (AUC) ranges between
0.0 (completely unfit) and 1.0 (perfect fit), where AUC 0.5 is completely random.
Generally, the elasticity values are estimated based on capital investment and
expert judgment, ranging from 0 (easy conversion) to 1 (irreversible change) (Verburg
and Veldkamp, 2004). In this study, the elasticity values were obtained from the
probability transition matrix of land-use between 2003 and 2013. In addition, water body
and settlement & infrastructure classes were assigned not possible to be transformed. A
minimum of 10 years was assigned in the transition-setting as a requirement for the
natural succession of reforestation to forest class and 20 years were specified for
succession from abandoned agriculture back to forest cover, based on a previous study
(Sahunaru et al., 1993) and image signature.
When all inputs were provided, the Dyna-CLUE model calculated the total
probability for each grid cell of each land use type based on the suitability of location
derived from the logit model, the conversion elasticity and the competitive advantage of
the location. The total allocated area of each land use equals the total land requirements
specified in the scenario (Verburg and Veldkamp, 2004).

PD 577/10 Rev.1 (F)
31
4.1.5 Assessing landscape configuration features
The FRAGSTATS ver. 3.0 software (McGarigal and Marks, 1995) was used to assess
landscape structure and fragmentation indices of forest classes, arable land and rubber
plantation in 2013 and 2030 in terms of total area, number of patches, mean patch size,
largest patch index, shape index, total core area and mean core area. An eight-neighbor
rule was used to identify patch in the landscape. In addition, a core area was assigned
from 1 km from perimeter. These landscape indices imply direct and indirect impacts of
forest fragmentation on biodiversity (Turner et al., 2001; Trisurat and Duengkae, 2011).
4.2 Species Distribution Modelling
The processes for mapping wildlife distributions and determining priority areas for
maintaining viable population in the Emerald Triangle area include four steps: a)
collection of wildlife presence points, b) target species selection, c) generation of species
distribution models, and d) validation and mapping distributions (Figure 6).
Figure 6. Main steps of species distribution modeling

PD 577/10 Rev.1 (F)
32
4.2.1 Collection of wildlife occurrences
Wildlife occurrence data in the ETFC were obtained from three methods, namely ground
survey, existing GIS database and literature review. Details of these methods are available
in Wildlife Technical Report written by Bhumpakphan (in press). Each method is detailed
as follows:
a) Ground survey
Additional ground surveys were conducted in the PPFC in Thailand and Dong Khanthung
NBCA in Lao PDR by the Wildlife Consultant (Dr. Naris Bhumpakphan), scientists
(lecturers from Champasak University), and park rangers. It is noted that the scientists
and park rangers were trained in how to identify tracks and signs of wildlife before the
actual survey. The training workshop on Wildlife and Landscape Training was held in
Lao PDR on December 11st – 15th, 2013. After the training, the project provided guide
books (e.g., Lekagul and McNeely, 1988; Lekagul and Round, 1991; Das, 2010), Global
Positioning System (GPS), camera and infra-red camera trapping to assist field survey. In
addition, local market survey and interview were included to obtain information on bush
meat to confirm the actual presence of wildlife species on the ground.
b) Existing GIS database
The existing geo-referenced wildlife locations were combined from the GIS database
developed during the PPFC project phases 1 and 2 and from the GIS database of the
PVPF. The later data were collected during 2000-2010 by the Forestry Administration, in
cooperation with Cat Action Treasury and with the Wildlife Conservation Society for
biodiversity conservation surveys in the Preah Vihear Northern Plain (Dany Chheang,
personal communication). Besides the environmental factors used in the CLUE-s model,
four additional layers were added to determine wildlife habitats, namely deciduous forest
patch size, evergreen forest patch size, precipitation of the wettest quarter and
precipitation of the driest quarter.
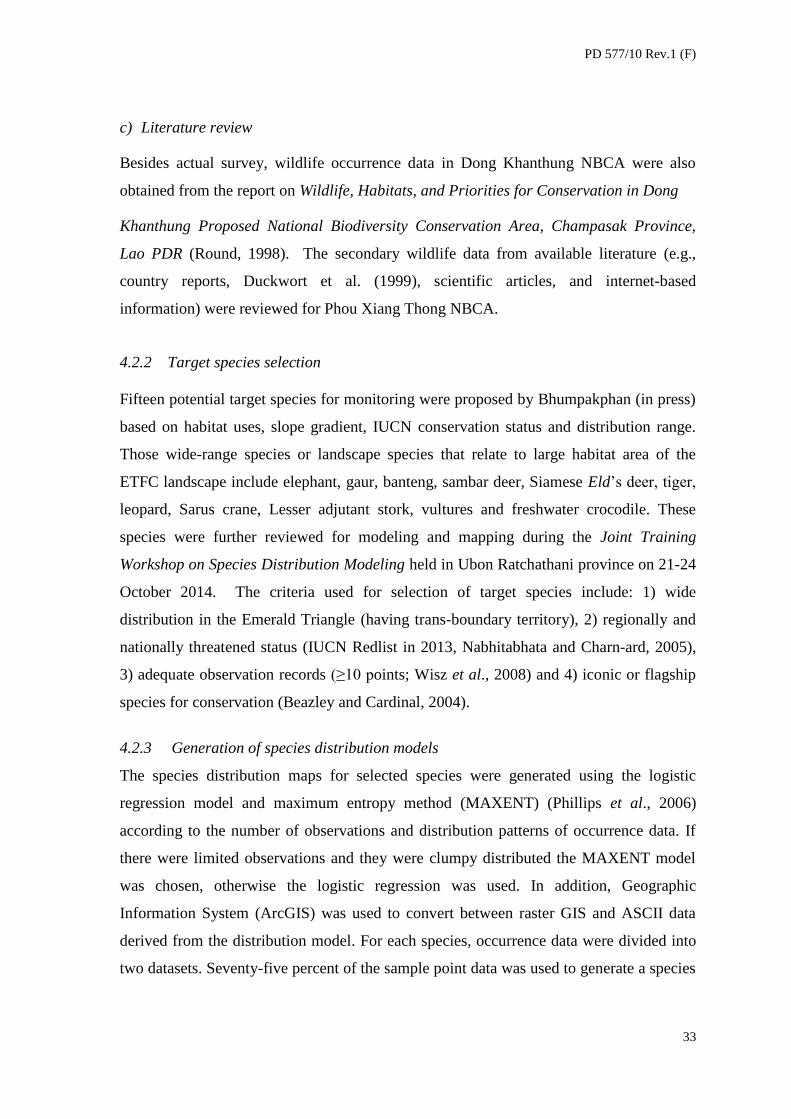
PD 577/10 Rev.1 (F)
33
c) Literature review
Besides actual survey, wildlife occurrence data in Dong Khanthung NBCA were also
obtained from the report on Wildlife, Habitats, and Priorities for Conservation in Dong
Khanthung Proposed National Biodiversity Conservation Area, Champasak Province,
Lao PDR (Round, 1998). The secondary wildlife data from available literature (e.g.,
country reports, Duckwort et al. (1999), scientific articles, and internet-based
information) were reviewed for Phou Xiang Thong NBCA.
4.2.2 Target species selection
Fifteen potential target species for monitoring were proposed by Bhumpakphan (in press)
based on habitat uses, slope gradient, IUCN conservation status and distribution range.
Those wide-range species or landscape species that relate to large habitat area of the
ETFC landscape include elephant, gaur, banteng, sambar deer, Siamese Eld’s deer, tiger,
leopard, Sarus crane, Lesser adjutant stork, vultures and freshwater crocodile. These
species were further reviewed for modeling and mapping during the Joint Training
Workshop on Species Distribution Modeling held in Ubon Ratchathani province on 21-24
October 2014. The criteria used for selection of target species include: 1) wide
distribution in the Emerald Triangle (having trans-boundary territory), 2) regionally and
nationally threatened status (IUCN Redlist in 2013, Nabhitabhata and Charn-ard, 2005),
3) adequate observation records (≥10 points; Wisz et al., 2008) and 4) iconic or flagship
species for conservation (Beazley and Cardinal, 2004).
4.2.3 Generation of species distribution models
The species distribution maps for selected species were generated using the logistic
regression model and maximum entropy method (MAXENT) (Phillips et al., 2006)
according to the number of observations and distribution patterns of occurrence data. If
there were limited observations and they were clumpy distributed the MAXENT model
was chosen, otherwise the logistic regression was used. In addition, Geographic
Information System (ArcGIS) was used to convert between raster GIS and ASCII data
derived from the distribution model. For each species, occurrence data were divided into
two datasets. Seventy-five percent of the sample point data was used to generate a species

PD 577/10 Rev.1 (F)
34
distribution model, while the remaining 25% was kept as independent data to test the
accuracy of each model.
It is noted that species distributions were conducted at the ETFC level. Therefore,
environmental variables that were previously identified as direct or indirect factors
affecting the patterns of abundance and distribution of wildlife at the regional and
national levels (Lekagul and McNeely, 1977; Bonilla-Sanchez et al., 2010; Trisurat et al.,
2010) were developed or extracted from the existing GIS database. For medium-and large
sized carnivore species, an additional prey species was included because it is recognized
as an important factor for large carnivore distribution. This layer was obtained by
combining key prey species previously derived from the species distribution models. Prey
species for leopard consisted of wild boar, barking deer, Sambar deer and Eld’s deer.
Banteng and gaur were included for tiger (Simcharoen et al., 2007). All environmental
variables were converted to GIS raster format to perform spatial analyses. The pixel
resolution of 250 m was chosen because it was relevant to the minimum mapping unit of
the land use derived from visual interpretation and most of environmental factors.
4.2.4 Validation and mapping species distributions
The continuous probability of occurrence of each model output (0.00-1.00) was
transformed into a binary prediction by applying the commonly used thresholds for
predicting species distributions (Liu et al., 2005). If the probability value is equal or
greater than this threshold value, it will be classified as presence, otherwise absence. In
addition, the performance of each model was evaluated by using the area under curve
(AUC) of the receiver operating characteristic (Hosmer and Stanley, 2000) and the
predicted maps were validated using omission & commission errors and a contingency
matrix by comparing the predicted presence-absence with independent presence-absence
occurrences (25% of total occurrence data). The logistic threshold derived from the
MAXENT model that yield the highest overall accuracy and provide optimum omission
& commission errors was selected to map species distribution. On the other hand, the cut-
off value of 0.5 was selected to reclassify probability values derived from the logistic
regression model. It is noted that the predicted LU/LC maps derived from land use
scenarios and future climatic variables in 2050 (http://www.worldclim.org/download)
were replaced by the existing LU/LC map and current climatic variables to obtain future
distribution maps. The analyses were conducted accordingly as present distribution.

5. RESULTS
5.1 Land Use
5.1.1 Land use/land cover 2013
Preliminary land use/land cover in 2013 was visually interpreted from Landsat-8 TM
satellite images based on tone, shape, size, pattern, texture, shadow, and association
(Lillesand and Kiefer, 1987). The GIS Consultant used stratified random sampling to
determine the number of samples classified in preliminary land use classes and compared
them with the actual (known) classes during field validation. The total number of sample
locations for paddy, rubber plantation, forest plantation, dry dipterocarp forest, mixed
deciduous forest, dry evergreen forest, settlement and others classes were 232, 38, 14, 43,
42, 59, 59 and 21 respectively.
The contingency table or classification matrix (Table 6) shows that classification
accuracy of most land use classes, except cassava and oil palm was greater than 80%.
The overall accuracy for land use interpretation was approximately 91% and kappa
accuracy was 86%, which is acceptable for most remote sensing scientists. Five sample
locations of paddy field were misclassified as dry dipterocarp forest. This is because
some shrubs still remain in the paddy field. In addition, the classification between oil
palm and paddy, as well as paddy and cassava was difficult. This is due to the fact that oil
palm was recently introduced and mainly planted in paddy fields. Crown cover of young
oil palm covered only small areas. To avoid omission and commission errors, cassava
and oil palm were later merged with paddy and renamed as agriculture class (Figure 7).
PD 577/10 Rev.1 (F)
35

Ta
ble
6 C
onti
ngen
cy t
able
res
ult
ing f
rom
fie
ld v
ali
dat
ion
Inte
rpre
tati
on
Land
use
/
land
co
ver
cla
ss
Paddy field
Cassava
Para rubber
Oil palm
Plantation
Bare soil
Dry dipterocarp
forest
Mixed dipterocarp
forest
Dry evergreen
forest
Hill evergreen
forest
Moist evergreen
forest
Rock outcrop
Water
Settlement & infra
Total
Producer's
Accuracy (%)
Omission error (%)
Ground truth
Pad
dy
21
0
5
21
5
98
2
Cas
sava
5
4
9
44
56
Par
a ru
bb
er
7
3
5
1
43
81
19
Oil
pal
m
3
2
5
40
60
Pla
nta
tio
n
3
1
3
1
6
81
19
Bar
e so
il
2
2
1
00
0
Dry
dip
terc
arp
fo
rest
7
38
2
47
81
19
Mix
ed d
ecid
uo
us
fore
st
4
0
7
4
7
85
15
Dry
ever
gre
en f
ore
st
52
5
2
10
0
0
Hil
l ev
ergre
en f
ore
st
1
1
1
00
0
Mo
ist
ever
gre
en f
ore
st
1
1
1
00
0
Ro
ck o
utc
rop
6
1
7
8
6
14
Wat
er
10
1
0
10
0
0
Set
tlem
ent
& I
nfr
a
5
3
53
10
0
0
T
ota
l 2
32
4
38
2
14
2
43
42
59
1
1
6
10
54
50
8
92
8
C
om
mis
sio
n e
rro
r (%
) 9
0
8
0
7
0
1
2
5
12
0
0
10
0
10
0
98
U
ser'
s ac
cura
cy (
%)
91
10
0
92
10
0
93
10
0
88
95
88
10
0
10
0
0
0
2
PD 577/10 Rev.1 (F)
36

Figure 7 Land-use/land-cover in 2003 and 2013 in the Emerald Triangle Protected
Forest Complex
PD 577/10 Rev.1 (F)
37

5.1.2 Land use/land cover change between 2003 and 2013
Land use/land cover maps in 2003 and 2013 were overlaid. Based on spatial and static
analyses, the results are shown in Table 7.
Table 7 Land use/land cover classes in 2003 and 2013 in the Emerald Triangle Protected Forest
Complex (ha)
Type of land-use
2003 2013 Change Change in %
ha
%
ha
%
ha (+/-)
10
yrs. Yearly
Moist evergreen
forest 1,150 0.04 1,081 0.04 -69 -6.00 -0.62
Dry evergreen forest 546,750 21.15 555,823 21.50 9,073 1.66 0.16
Hill evergreen forest 4,212 0.16 4,200 0.16 -12 -0.29 -0.03
Mixed deciduous
forest 245,412 9.49 226,573 8.77 -18,839 -7.68 -0.80
Dry dipterocarp
forest 540,687 20.92 374,337 14.48 -166,350 -30.77 -3.61
Forest plantation 9,850 0.38 13,475 0.52 3,625 36.80 3.18
Para rubber 85,456 3.31 164,225 6.35 78,769 92.18 6.75
Oil palm 600 0.02 1,075 0.04 475 79.16 6.00
Paddy 951,556 36.81 1,040,444 40.25 88,888 9.34 0.90
Cash crop 12,931 0.50 17,317 0.67 4,386 33.92 2.96
Settlement 77,700 3.01 80,365 3.11 2,665 3.43 0.34
Bare soil 14,281 0.55 12,587 0.49 -1,694 -11.87 -1.26
Rock outcrop 11,268 0.44 10,706 0.41 -562 -4.99 -0.51
Water body 83,050 3.21 82,697 3.20 -353 -0.43 -0.04
Total 2,584,903 100.00 2,584,903 100.00 0.00 0.00 0.00
Moist and hill evergreen Forest: In the ETFC, moist evergreen forest is found
along stream networks where soil moisture is high all year round. Hill evergreen forest
normally occurs in elevation higher than 1,000 m above mean sea level. Accessibility to
this vegetation type is difficult, therefore the area of hill evergreen forest was similar. In
2003, moist evergreen forest covered approximately 1,150 ha or 0.04% of the ETFC, and
it slightly declined to 1,081 ha or 69 ha in 2013.
Dry evergreen forest is dominant among evergreen forest classes and mainly
found in Phu Jong-Na Yoi National Park, Yot Dom Wildlife Sanctuary and the core area
of Dong Khanthung. According to remote sensing and GIS analysis, dry evergreen forest
covered an area of 546,750 ha or 21.15% of the ETFC landscape in 2003, and it slightly
PD 577/10 Rev.1 (F)
38

increased to 555,823 ha or 21.50% in 2013. Approximately 9,000 ha were added
possibly due to different image signature. The land-use/land-cover map in 2013 was
interpreted from Landsat-8 TM taken in October 2013 which was early dry season.
Therefore, there might be commission errors as the results of the signature of dense
mixed deciduous forest and flooded dry dipterocarp forest situated in Dong Khanthung
(Table 6). Therefore, they were wrongly interpreted as dry evergreen forest.
Mixed deciduous forest basically exists in Phou Xing Thong NBCA, Pha Taem
National Park, Kaeng Tana National Park, along the escarpment between Thailand and
Lao PDR and patchy scatters in the south part of the ETFC landscape. This forest class
covered 245,412 ha in 2003 and declined to 226,573 ha in 2013. The reduction rate was
7.68% in 10 years or 0.80 annually.
Dry dipterocarp forest usually occurs on dry shallow and lateritic soils. It used to
be abundant along the buffer zone of PPFC but has been converted to agriculture. It is
now dominant in Phreah Vihear and Dong Khanthung. In 2003, dry pipterocarp forest
covered an area of 540,678 ha or 20.92%. The existing area in 2013 was estimated at
374,337 ha or 14.48%. Thus approximately 116,350 ha or 30.77% of the total area had
been converted to agriculture and other uses in the last decade or it has declined 3.61%
annually. Sobon (2014) reported that dry dipterocarp forest in the Phreah Vihear northern
plain of Cambodia was largely converted to paddy field and settlement under a land
allocation program for military.
Forest plantations are mainly established and managed by both the Forest
Industrial Organization and Department of National Park, Wildlife and Plant
Conservation for economic purpose and natural rehabilitation, respectively. Small scale
plantation by villagers is also practiced. Eucalyptus sp. is a common species for
plantation by the Forest Industrial Organization and villagers. Most of the eucalyptus
plantations are sited in Bun Thrarik District between the Bun Thrarik-Yot Mon Proposed
Wildlife Sanctuary and the Sirinthon Reservoir. Remote sensing analysis reveals that in
2003 there were about 9,850 ha and that increased to 13,475 ha in 2013 or accelerates
3.18% annually.
Para rubber plantation: Para rubber cultivation is a new agricultural practice in
the Emerald Triangle landscape. However, it has increased rapidly in the last decade in
PD 577/10 Rev.1 (F)
39

the three countries. Rubber plantation covered an area of 85,456 ha in 2003 and rapidly
increased to 164,225 ha in 2013 or nearly doubled during 10 years. The annual increment
rate was 6.75%, which was the highest among 14 classes. Most plantations are situated in
the buffer zones of Bun Thrarik, Phu Jong-Na Yoi and Yot Mon. A few patches are
observed inside Bun Thrarik-Yot Mon Wildlife Sanctuary.
Oil palm is determined as a new economic agricultural crop recently found in the
PPFC landscape. The areas in 2003 (600 ha) and 2013 (1,075 ha) were not large, but the
increment rate (6% annually) was ranked as the second after rubber plantation. Based on
land suitability, it is anticipated that the extent of oil palm would not cover large area as
rubber or other economic crops due to constraint of soil characteristics and climatic
conditions. Because oil palm requires soil moisture all year round and high rainfall.
Paddy and cash crops are widespread in the ETFC landscape. In the PPFC
landscape, these two classes constituted nearly 28.72% in 2002 and substantially
increased to 30.12% in 2008 (Trisurat, 2010). According to the land use/land cover map
2013 it was found that some paddy and cash crop patches were converted to rubber
plantation. On the other hand, agriculture areas in Lao PDR and Cambodia increased
substantially. The aggregate areas of paddy and cash crop increased 88,888 ha and 4,386
ha, respectively.
Bare soil and rock outcrops: This land cover class includes a drawdown zone
along the river bank and rock out crop in the marginal land or unfertile soil. The areas of
1,694 ha of bare soil and 562 ha of rock outcrop were changed to other classes such as
seasonally agriculture or water body in the wet season.
Build-up area: As discussed in the previous section, there are 82 villages situated
within a 3-km buffer of the PPFC and 4 villages are located inside the PPFC. In the last
10 years (2003–2013), human settlements had expanded and the number of local
residents substantially increased from 49,324 to 65,016 individuals. In addition, new
settlements for Cambodian military staff were established in Phreah Vihear province.
Therefore, the settlement area in the Emerald Triangle landscape have increased
approximately 2,670 ha in the last decade.
Water bodies: This class includes reservoirs, ponds and major rivers. In 2003, the
overall water surface covered 83,053 ha. Based on remote sensing analysis, it was found
PD 577/10 Rev.1 (F)
40

that the water body covered 82,697 ha in 2013 or decreased 353 ha. This may be due to
the fluctuation of water level during wet and dry season.
5.1.3 Predicted land use/land cover in 2030
It should be noted that the current CLUE-s model version is applicable to not more than
11 classes. In addition, the classification matrix (Table 8) shows that the classification
between oil palm and paddy, as well as paddy and cassava was difficult and their
classification accuracies were low. In addition, the CLUE-s model was developed for
modeling land use at landscape level (Verburg and Veldkamp 2004). . To avoid omission
and commission errors, the original classes (14 classes) were generalized to 9 classes,
namely 1) evergreen forest (moist, dry and hill evergreen forests), 2) mixed deciduous
forest, 3) dry deciduous forest, 4) forest plantation, 5) rubber plantation, 6) agriculture
(paddy, cash crop and oil palm), 7) settlement and infrastructure, 8) bare soil and rock
outcrop and 9) water body. In addition, the transition matrix of these land use classes
between 2003 and 2013 is shown in Table 8. It is noted that water body was not modeled
because it was determined as stable in the land demand scenarios (Figure 5).
The significant factors and coefficients of the logistic regression models that
determine the location suitability of the eight LU/LC classes are shown in Table 9. It is
noted that each driving factor contributed to different LU/LC types. High altitude, steep
slope, high annual rainfall and further distance from city and stream, as well as difficult
to access by road were positively correlated to remaining evergreen forest. In contrast,
areas that were close to the stream and main city, situated on fertile soil, accessible from
main roads, and at low altitude were a prime target for agriculture. Aspect is a
considerable factor only for rubber plantation in the logistic regression model. In general,
rubber trees can grow in all aspect directions (Ranst et al., 1996) but the model results
indicated that the greater degree from clock-wise direction is more suitable for rubber.
This is due to the fact that most existing rubber plantation areas are situated in the buffer
zones of the PPFC (Figure 7). The areas to the east of PPFC are mountainous landscapes.
PD 577/10 Rev.1 (F)
41

Tab
le 8 T
ransi
tion m
atri
x o
f la
nd u
se/l
and c
over
cla
sses
bet
wee
n 2
003 a
nd 2
013
Lan
d u
se/l
an
d c
ov
er
Yea
r 20
03
(co
lum
n)
Yea
r 20
13
(ro
w)
Evergreen
forest
Mixed
deciduous
forest
Dry
dipterocarp
forest
Forest
plantation
Rubber
Agriculture
Settlement
Bare
soil/rock
Water
Gra
nd
To
tal
Ever
gre
en f
ore
st
83
.60
5.7
0
7.0
8
0.0
3
0.4
4
2.8
6
0.1
2
0.0
6
0.1
0
10
0.0
0
Mix
ed d
ecid
uo
us
fore
st
15
.57
56.1
9
11.9
2
0.0
8
2.3
4
12.8
9
0.4
3
0.3
2
0.2
7
10
0.0
0
Dry
dip
tero
carp
fo
rest
9
.38
6.1
8
48.4
5
0.1
1
1.9
7
32.2
8
0.5
9
0.6
0
0.4
4
10
0.0
0
Fore
st p
lanta
tio
n
0.9
6
1.2
8
1.1
6
58.0
0
15.4
8
17.2
8
4.5
6
0.1
3
1.1
6
10
0.0
0
Rubber
2
.00
4.3
0
5.6
8
1.1
4
62.5
4
20.6
9
2.8
2
0.3
1
0.5
2
10
0.0
0
Agri
cult
ure
0
.96
1.6
6
3.1
1
0.5
6
8.9
0
82.2
2
1.7
9
0.0
4
0.7
5
10
0.0
0
Set
tlem
ent
0.4
9
0.6
5
0.7
8
0.4
7
2.6
1
14.6
4
79
.52
0.0
1
0.8
2
10
0.0
0
Bar
e so
il/r
ock
2
.15
4.9
9
15.1
3
0.6
8
13.2
6
23.1
7
16
.55
23
.04
1.0
1
10
0.0
0
Wat
er
0.5
6
0.7
6
1.3
7
0.1
3
0.8
3
10.7
7
1.2
0
0.0
2
84
.37
10
0.0
0
Gra
nd
To
tal
10
0.0
0
100.0
0
100.0
0
100.0
0
100.0
0
100.0
0
10
0.0
0
10
0.0
0
10
0.0
0
10
0.0
0
PD 577/10 Rev.1 (F)
42
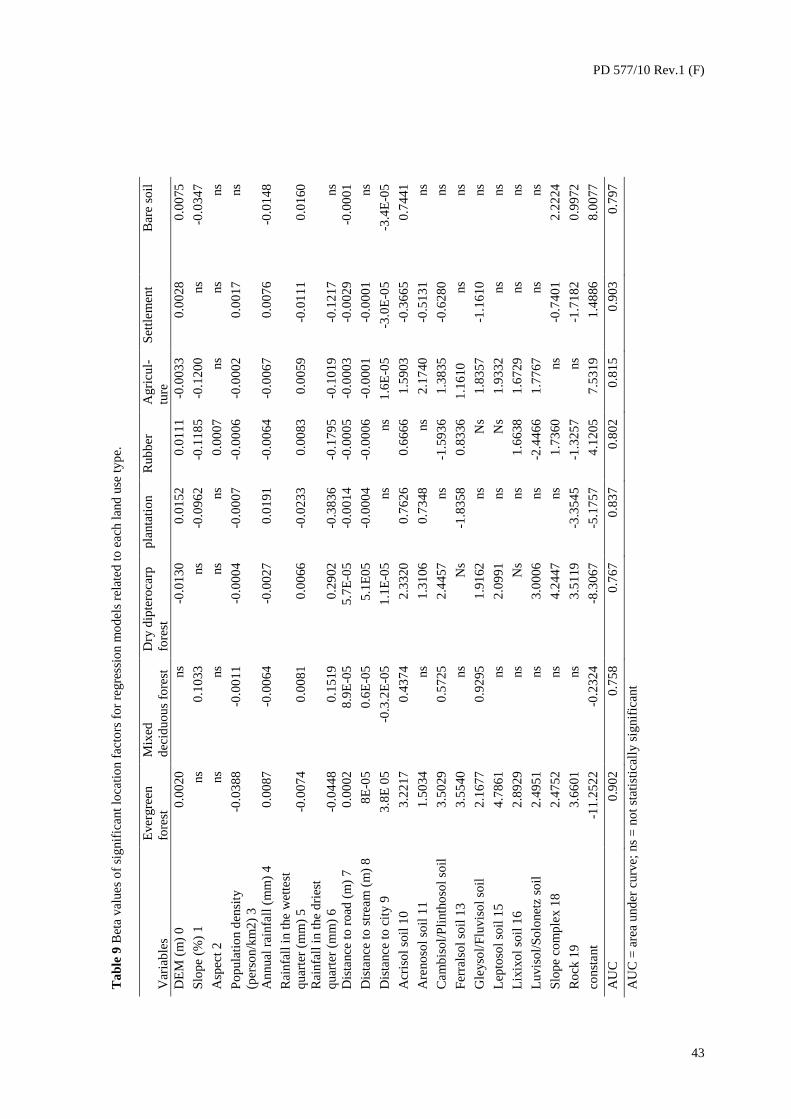
Ta
ble
9 B
eta
val
ues
of
sig
nif
ican
t lo
cati
on f
acto
rs f
or
regre
ssio
n m
od
els
rela
ted
to
eac
h l
and
use
typ
e.
Var
iab
les
Ever
gre
en
fore
st
Mix
ed
dec
iduo
us
fore
st
Dry
dip
tero
carp
fore
st
pla
nta
tio
n
Rub
ber
A
gri
cul-
ture
Set
tlem
ent
Bar
e so
il
DE
M (
m)
0
0.0
020
ns
-0.0
13
0
0.0
152
0.0
111
-0.0
03
3
0.0
028
0
.00
75
Slo
pe
(%)
1
ns
0.1
033
ns
-0.0
96
2
-0.1
18
5
-0.1
20
0
ns
-0.0
34
7
Asp
ect
2
ns
ns
ns
ns
0.0
007
ns
ns
ns
Po
pula
tio
n d
ensi
ty
(per
son/k
m2
) 3
-0.0
38
8
-0.0
01
1
-0.0
00
4
-0.0
00
7
-0.0
00
6
-0.0
00
2
0.0
017
ns
An
nual
rai
nfa
ll (
mm
) 4
0
.00
87
-0.0
06
4
-0.0
02
7
0.0
191
-0.0
06
4
-0.0
06
7
0.0
076
-0
.01
48
Rai
nfa
ll i
n t
he
wet
test
quar
ter
(mm
) 5
-0.0
07
4
0.0
081
0.0
066
-0.0
23
3
0.0
083
0.0
059
-0.0
11
1
0.0
160
Rai
nfa
ll i
n t
he
dri
est
quar
ter
(mm
) 6
-0.0
44
8
0.1
519
0.2
902
-0.3
83
6
-0.1
79
5
-0.1
01
9
-0.1
21
7
ns
Dis
tance
to
ro
ad (
m)
7
0.0
002
8.9
E-0
5
5.7
E-0
5
-0.0
01
4
-0.0
00
5
-0.0
00
3
-0.0
02
9
-0.0
00
1
Dis
tance
to
str
eam
(m
) 8
8
E-0
5
0.6
E-0
5
5.1
E05
-0.0
00
4
-0.0
00
6
-0.0
00
1
-0.0
00
1
ns
Dis
tance
to
cit
y 9
3
.8E
05
-0.3
.2E
-05
1.1
E-0
5
ns
ns
1.6
E-0
5
-3.0
E-0
5
-3.4
E-0
5
Acr
iso
l so
il 1
0
3.2
217
0.4
374
2.3
320
0.7
626
0.6
666
1.5
903
-0.3
66
5
0.7
441
Are
no
sol
soil
11
1
.50
34
ns
1.3
106
0.7
348
ns
2.1
740
-0.5
13
1
ns
Cam
bis
ol/
Pli
nth
oso
l so
il
3.5
029
0.5
725
2.4
457
ns
-1.5
93
6
1.3
835
-0.6
28
0
ns
Fer
rals
ol
soil
13
3
.55
40
ns
Ns
-1.8
35
8
0.8
336
1.1
610
ns
ns
Gle
yso
l/F
luvis
ol
soil
2
.16
77
0.9
295
1.9
162
ns
Ns
1.8
357
-1.1
61
0
ns
Lep
toso
l so
il 1
5
4.7
861
ns
2.0
991
ns
Ns
1.9
332
ns
ns
Lix
ixo
l so
il 1
6
2.8
929
ns
Ns
ns
1.6
638
1.6
729
ns
ns
Luvis
ol/
So
lonet
z so
il
2.4
951
ns
3.0
006
ns
-2.4
46
6
1.7
767
ns
ns
Slo
pe
com
ple
x 1
8
2.4
752
ns
4.2
447
ns
1.7
360
ns
-0.7
40
1
2.2
224
Ro
ck 1
9
3.6
601
ns
3.5
119
-3.3
54
5
-1.3
25
7
ns
-1.7
18
2
0.9
972
const
ant
-11
.25
22
-0
.23
24
-8.3
06
7
-5.1
75
7
4.1
205
7.5
319
1.4
886
8
.00
77
AU
C
0.9
02
0.7
58
0.7
67
0.8
37
0.8
02
0.8
15
0.9
03
0
.79
7
AU
C =
are
a u
nd
er c
urv
e; n
s =
no
t st
atis
tica
lly s
ignif
ican
t
PD 577/10 Rev.1 (F)
43

According to Hosmer and Lemeshow (2000), the predicted models were
outstanding for evergreen forest and settlement (AUC>0.9), excellent for forest
plantation, rubber plantation and agriculture (0.8≤AUC<0.9) and acceptable for mixed
deciduous forest, dry dipterocarp forest and bare soil & rock outcrop (0.7≤AUC<0.8)
(Hosmer and Lemeshow, 2000). This is due to the fact that evergreen forest and human
settlement were mainly restricted and clustered in certain areas, while other classes were
widely distributed in the ETFC landscape. The gradient of AUC values showed similar
agreement with the accuracy assessment of the interpreted LU/LC classes (Table 6).
The simulated LU/LC maps in 2030 for the four scenarios are shown in Figure 8.
The results of the low economic decline and localized resource degradation (business as
usual) scenario with restriction policy in the PPFC show that future deforestation for
agriculture was predicted in the remnant forests situated in the buffer zones of the PPFC
and areas close to the Chong-Mek border check point (Figure 8a). In addition, substantial
areas of forest cover in the Phou Xiang Thong and to the north of Dong Khanthung were
predicted to be converted to rubber plantations. In Thailand, expansion of rubber
plantation was predicted in the west outside the Pha Taem national park and close to road
network currently covered by cash crop and mixed deciduous forest.
The unsustainable economic development and serious resource degradation
scenario predicted a lot of land conversion to arable land and rubber plantation. The area
of mixed deciduous and dry dipterocarp forests was predicted to decline from 22.9% of
the entire ETFC in 2013 to 15.1% in 2030. In contrast, rubber plantation area was
anticipated to increase 50% from the current status (Figure 5). Figure 8b shows that new
arable land is also predicted in the west of PVPF, which is close to the Preah Vihear
Temple cultural world heritage site.
PD 577/10 Rev.1 (F)
44
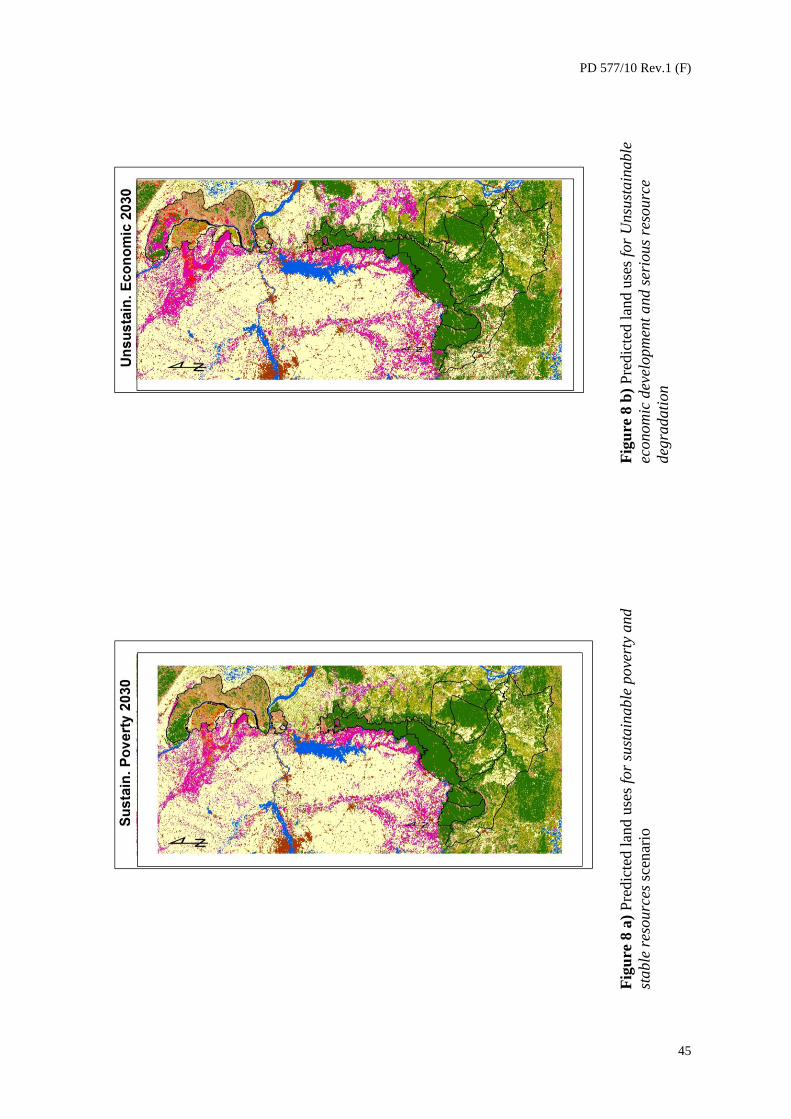
Fig
ure
8 a
) P
redic
ted l
and u
ses
for
sust
ain
able
pove
rty
and
stable
res
ourc
es s
cen
ario
F
igu
re 8
b)
Pre
dic
ted l
and u
ses
for
Unsu
stain
able
econom
ic d
evel
opm
ent
and s
erio
us
reso
urc
e
deg
radati
on
PD 577/10 Rev.1 (F)
45

Fig
ure
8 c
) P
redic
ted l
and u
ses
for
Low
eco
nom
ic d
ecli
ne
and
loca
lize
d r
esourc
e deg
radati
on
F
igu
re 8
d)
Pre
dic
ted l
and u
ses
for
sust
ain
able
dev
elopm
ent
and l
imit
ed r
esourc
es d
egra
dati
on
PD 577/10 Rev.1 (F)
46

The sustainable development and limited resources degradation scenario (Figure 8d)
predicted similar land-use patterns as the business as usual scenario (Figure 8a). High
deforestation was found in the north of Dong Khanthung and to the west of Pha Taem, but
limited deforestation was in all protected areas. Finally, the sustainable poverty and stable
resources scenario showed different land-use patterns than the other scenarios. This scenario
assumed less demand for agriculture and rubber plantations due to low population growth and
the delay of AEC implementation scheme, leading to limited deforestation. A small amount
of land conversion to rubber plantation was expected outside all existing and proposed
protected areas (Figure 8c). In addition, the predicted deforestation maps in 2030 derived
from the four scenarios are shown in Figure 9.
PD 577/10 Rev.1 (F)
47

Figure 9 Predicted new areas for arable land and rubber plantation in 2030
PD 577/10 Rev.1 (F)
48

5.2 Wildlife Distributions
5.2.1 Selected wildlife species
Wildlife occurrence data in the ETFC were obtained from three methods, namely ground
survey, existing GIS database and literature review. Based on the criteria used for selection of
target species, multi-stakeholders participating in the Joint Training Workshop on Species
Distribution Modeling held in Ubon Ratchathani province on 21-24 October 2014, selected
12 species for modeling, their distributions in the ETFC landscape (Table 10). Those wide-
range species include elephant, gaur, banteng, sambar, Siamese Eld’s deer, barking deer,
tiger, leopard, Sarus crane, Lesser adjutant stork, Giant ibis and wild boar. Indian muntjac or
barking deer had more than 900 records. A high number of observations was also available
for gaur, banteng, Eld’s deer, Asian elephant, barking deer, Sarus crane, Lesser adjutant
stork, Giant ibis and wild boar. A minimum record was recorded for tiger and Siamese
crocodile. There were a few sightings for vultures in Dong Khanthung and Preah Vihear, but
geo-reference locations were not available.
It should be noted that Siamese crocodile, vultures and pileated gibbon were not
included although they are classified as threatened species because there were limited records
for Siamese crocodile and vultures. Pileated gibbon was reported along the tri-national
borders but current distribution is mainly restricted in the Phreah Vihear and along the border
between Dong Khanthung and Bun Thrarik-Yot Mon. A herd of Pileated gibbon (3-6
individuals) has an average home range of less than 1 km2 (Srikosamatara, 1984). Thus, it is
not recognized as a landscape species. In contrast, wild boar and barking deer were added for
modeling because they are main prey species for tiger (Simcharoen et al., 2007) and leopard
(Reed et al., 2012) in the ETFC landscape.
PD 577/10 Rev.1 (F)
49

Table 10. Selected wildlife species for modeling in the Emerald Triangle landscape
Scientific name Common name Distribution1/ IUCN
status2/
ETFC
Iconic
No. of
records3/
Y/N4/
T L C
Bos gaurus Gaur x x x VU 203 Y
Bos javanicus Banteng x x x EN 228 Y
Cervus unicolor Sambar x x x VU 20 Y
Rucervus eldii
siamensis
Eld’s deer x x EN 142 Y
Crocodylus
siamensis
Siamese crocodile x x x CR 9 N
Elephas maximus Elephant x x x EN 356 Y
Gyps bengalensis White-backed
vulture
? x CR ? N
Gyps indicus Long-billed
vulture
? x CR ? N
Grus antigone Sarus crane x x VU 272 Y
Hylobates
pileatus
Pileated gibbon x x x EN 30 N
Leptoptilos
javanicus
Lesser Adjutant
stork
? x x EN 310 Y
Muntiacus
muntjac
Indian muntjac,
Barking deer5/
x x x LC 927 Y
Neofelis nebulosa Leopard x x x NT 44 Y
Panthera tigris Tiger x x x EN 10 Y
Pseudibis
gigantea
Giant ibis x x CR 291 Y
Sarcogyps calvus) King or red-
headed vulture
? x CR ? N
Sus scrofa Wild boar5/ x x x LC 326 Y
Notes: 1/ T, Thailand; C, Cambodia; L, Lao PDR (Bhumpakphan, in press)
2/ EN, Endangered species; CR, Critical Endangered species;
VU, Vulnerable species; NT, Near threatened species (IUCN, 2013)
LC, Less Concern species
3/ Number of records compiled from surveys, literatures and GIS database
4/ Y, selected for modeling; N, not selected for modeling
5/ Important prey species for the selected carnivores
x, existing; ?, need to be confirmed/limited records
High occurrences were recorded in the Preah Vihear, Cambodia and followed by
Dong Khanthung. This phenomena resulted from the dissimilarity of survey efforts in the
study areas. Since 1998, the Forestry Administration, has in cooperation with Cat Action
Treasury and with the Wildlife Conservation Society since 1999 conducted biodiversity
conservation surveys in the Preah Vihear. The results of those surveys have documented an
impressive list of fauna. The wildlife occurrences found in the Preah Vihear were more than
3,000 points from the total points of 3,500 accumulated from the three countries. The number
PD 577/10 Rev.1 (F)
50

of total points recorded in the Dong Kanthung was approximately 200 points (Round, 1998)
while the lowest number of 60 points was observed in the PPFC (Bhumpakphan, in press).
This is due the fact that wildlife surveys in Lao PDR and Thailand were conducted by rapid
assessment and conducted only one time.
5.2.2 Used distribution models and logistic thresholds
Based on the bias surveys and the patterns of occurrence distributions discussed above, the
MAXENT model was used to generate distribution of sambar deer, leopard and tiger because
there were limited number of records for these species. In addition, the logistic model was
used for the remaining species. It is noted that annual rainfall was excluded in the model due
to high correlation with the precipitation in the wettest quarter months (Annex 1).
The results of logistic regression indicated that land use did not contribute to the
species distribution for the nine modeled species and only slightly contributed to the
distribution of sambar, leopard and tiger. This may be due to the fact that all twelve species
are recognized as landscape species meaning they are able to inhabit all vegetation types in
the landscape. Distance from city was positively correlated with most species distributions
due the fact that they are sensitive to human pressures, but distance was non-considerable for
Lesser adjutant stork and barking deer. In contrast, altitude was negatively correlated for
many species. This implied that the selected species, especially large mammals prefer to live
in low altitude.
It should be noted that environmental variables affected the distributions of selected
species differently. The coefficient values derived from the logistic regression showing how
environmental variable affects the prediction for each species are found in Table 11. The
coefficient value showed that the precipitation in the wettest quarter months was positively
correlated for elephant, but it was considered as a negative factor for the remaining species.
Basically, most species prefer large forest patches, except bird species (Sarus crane, Lesser
adjutant stork and Giant ibis) and Eld’s deer that most likely live in open-woodland.
PD 577/10 Rev.1 (F)
51

Ta
ble
1
1 R
elat
ive
con
trib
uti
ons
of
the e
nvir
on
menta
l var
iab
les
to s
pat
ial
dis
trib
uti
on m
od
el o
f ea
ch w
ild
life
sp
ecie
s
Sp
ecie
s C
onst
ant
Cit
y
dis
tant
LU
/LC
P
op
ula
tio
n
DE
M
Slo
pe
Str
eam
-
dis
t
Ro
ad-
dis
t
Wet
_Q
_ra
in
Dry
_Q
_ra
in
Dec
iduo
us
pat
ch s
ize
Ever
gre
en
pat
ch s
ize
Pre
y
AU
C
Acc
ura
cy
Lo
gis
tic r
eg
ress
ion
Gau
r -3
.57
11
0.0
001
-0.0
08
8
0.5
227
0
.00
06
0
.83
67
/80
/74
Ban
ten
g
4.3
376
0.0
001
-0.0
15
0.0
002
-0.0
05
8
0.0
007
0
.84
68
/83
/76
Eld
's d
eer
-12
.21
5
0.0
001
-0
.70
1
0.0
009
-0
.00
03
0
.48
53
-0
.00
2
0
.96
86
/92
/90
Ele
phan
t -2
3.8
57
9
0.0
002
-0.0
08
-0.2
14
-0.0
00
4
0.0
003
0.0
075
0.6
834
0.0
009
0
.00
06
0
.91
76
/89
/83
Sar
us
cran
e
4.5
33
0.0
002
0
.01
73
0.0
006
-0.0
28
2
1.0
253
-0.0
02
3
-0.0
01
7
0
.95
86
/93
/90
Les
ser
adju
tant
sto
rk
-13
.26
7
-0
.04
2
0
.00
03
0
.95
44
-0.0
01
1
0.8
9
75
/84
/79
Bar
kin
g d
eer
8.9
072
-0.0
38
6
-0.0
18
-0
.00
36
-0.1
41
4
0.0
007
0
.00
06
0
.81
62
/87
/75
Gia
nt
ibis
2
.05
01
0.0
002
0.0
002
-0.0
28
1
1.1
752
-0
.00
1
0
.96
79
/92
/86
Wil
d b
oar
1
1.3
31
6
8.2
0E
-05
-0
.05
49
-0.0
23
-0.0
00
1
-0.0
04
4
-0.2
78
3
0.0
015
0
.00
07
0
.86
73
/88
/81
MA
XE
NT
mo
del
Sam
bar
N
A
29
.1
2.3
<
0.1
6
.0
0.1
0
..2
0.4
1
.0
1.4
<
0.1
1
.6
NA
0
.96
89
/90
/90
Leo
par
d
NA
1
5.1
0
.3
3.5
8
.1
0.5
2
.0
3.6
1
.2
24
.8
3.0
1
0.5
2
46
0.9
5
83
/91
/87
Tig
er
NA
4
8.1
5
.0
<0
.1
<0
.1
<0
.1
0.3
0
.2
<0
.1
<0
.1
0.2
<
0.1
4
6.2
0
.96
NA
Rem
arks:
An
nual
rain
20
00
: 18
64
mm
(1
,46
9-3
,24
7);
dri
est
quar
ter
20
00
: 1
6 m
m (
11
-41
); w
ette
st q
uar
ter
20
00
: 1
11
9 m
m (
84
7-2
05
4)
A
nn
ual
rai
n 2
05
0:
17
79
mm
(1
,38
1-3
,08
1);
dri
est
quar
ter
20
00
: 1
2.3
mm
(8
-33
); w
ette
st q
uar
ter
20
00
: 1
04
8 m
m (
78
7-1
92
2)
A
UC
, ar
ea u
nd
er c
urv
e;
NA
, no
t ap
pli
cab
le
Ta
ble
12
Sel
ecte
d s
pec
ies
and
acc
ura
cy a
sses
sment
of
the
pre
dic
ted
dis
trib
uti
ons
der
ived
fro
m u
sed
lo
gis
tic
thre
sho
lds
No
. S
pec
ies
1
0P
T1 a
nd
acc
ura
cy
EQ
2 a
nd
acc
ura
cy
MT
S3 a
nd
acc
ura
cy
EQ
T4an
d a
ccura
cy
MT
ST
5 a
nd
acc
ura
cy
U
sed
nam
e
T
hre
sho
ld
Om
m./
Co
mm
.
Acc
ur.
T
hre
sho
ld
Om
m./
Co
mm
.
Acc
ur.
T
hre
sho
ld
Om
m./
Co
mm
.
Acc
ur.
T
hre
sho
ld
Om
m./
Co
mm
.
Acc
ur.
T
hre
sho
ld
Om
m./
Co
mm
.
Acc
ur.
A
UC
7
thre
sho
ld
1
Sam
bar
0.4
2
11
/10
89
0.1
8
11
/70
58
0.4
2
11
/10
89
0.5
1
28
/0
89
0.5
6
28
/0
89
0.9
6
10
PT
/MT
S
2
Leo
par
d
0
.36
17
/9
87
0.3
3
17
/27
78
0.2
9
17
/45
79
0.2
4
8/4
5
74
0.2
4
8/4
5
74
0.9
5
10
PT
3
Tig
er
0
.21
NA
N
A
0.2
1
NA
N
A
0.2
1
NA
N
A
0.4
8
NA
N
A
0.4
8
NA
N
A
0.9
6
10
PT
1 1
0 p
erce
nti
le t
rain
ing p
rese
nce;
2 E
Q,
Eq
ual
tra
inin
g s
ensi
tivit
y p
lus
spec
ific
ity;
3 M
TS
, M
axim
um
tra
inin
g s
ensi
tivit
y p
lus
spec
ific
ity;
4 E
QT
, E
qual
tes
t se
nsi
tivit
y p
lus
spec
ific
ity;
6 M
TS
T,
Max
imu
m t
est
sen
siti
vit
y p
lus
spec
ific
ity
; A
UC
, ar
ea u
nd
er c
urv
e
PD 577/10 Rev.1 (F)
52
In addition, the response curves derived from the MAXENT model reflect the
dependence of predicted suitability both on the selected variable and on species occurrences
induced by correlations between the selected variable and other variables. The confusion
matrix (Table 12) indicate that the overall accuracy derived from the 10PT approach was the
highest among the five logistic thresholds. It was therefore selected to reclassify the
probability values for mapping distributions of sambar, leopard and tiger.
5.2.3 Extent of present distributions
The predicted distributions of barking deer cover an area of 7,612 km2 or 30.37% of the
Emerald Triangle landscape, the highest of any of the 12 species. It is followed by wild boar
(25.55%), elephant (20.46%) and banteng (15.58%) (Table 13). Although, elephant is
classified as an endangered species, but it is also recognized as a landscape species and
requires a larger territories. In addition, elephant inhabits various habitats both intact and
degraded forests. Barking deer and wild boar are medium-sized mammals and classified as
common species. Their habitat covers various ranges of ecosystems.
In contrast, potential habitats for Sambar deer, Eld’s deer, leopard, tiger and Giant ibis
cover less that 10% of the Emerald Triangle landscape and mainly concentrate in the
protected areas. These species are listed as endangered or vulnerable species. Table 13 shows
that more than 70% of the total suitable habitat for these species (except Sarus crane) were
predicted to be in protected areas. Figures 10-21 show the species occurrences and
distribution maps for the 12 selected species.
5.2.4 Extent of future distributions
This research determined the consequences of land-use change and combination of land-use
and climate changes on the distributions of selected species. The results indicate that future
land-use change (less forest cover) will slightly increase suitable habitats for Sarus crane,
gaur, banteng, sambar deer and tiger (Table 13; Annex 2). This is due to the fact that gaur,
banteng and sambar deer are browser species and they are main prey species for tiger
(Simcharoen et al., 2007). In addition, crane prefers to inhabit open areas such as paddy field,
open woodland close to water bodies (Purchkoon et al., 2014). In contrast, future land-use
change negatively affects habitat for elephant, especially under the sustainable development
scenario. The suitable habitat was predicted to decrease from 20.46% at present to
approximately 14% in 2030.
PD 577/10 Rev.1 (F)
53

Ta
ble
13
. P
red
icte
d s
uit
able
dis
trib
uti
on
s fo
r ea
ch m
am
mal
sp
ecie
s in
20
13
in t
he
Em
eral
d T
rian
gle
lan
dsc
ape
Sp
ecie
s n
am
e
Are
a (k
m2)
%
Lo
w E
con
wit
ho
ut
CC
Lo
w_
Eco
n
Sus.
Po
v
wit
ho
ut
CC
Sus
Po
v
Sus
Devl
wit
ho
ut
CC
Sus
Devl
Unsu
s D
ev.
wit
ho
ut
CC
Unsu
s D
evl.
Gau
r 3
,66
4
14
.62
14
.66
8.5
1
14
.79
8.5
2
15
.37
8.5
5
15
.19
8
.99
Ban
ten
g
3,9
05
15
.58
15
.81
19
.00
15
.98
19
.13
16
.32
19
.32
16
.19
1
6.2
0
Sam
bar
1
,00
8
4.0
2
3.7
8
3.8
4
4.0
2
3.1
1
3.9
0
3.8
6
3.9
0
3.9
9
Eld
’s d
eer
1,5
11
6.0
3
6.0
0
2.5
9
6.0
2
2.6
0
5.9
8
2.6
0
5.9
0
2.5
2
Ele
phan
t 5
,12
8
20
.46
20
.05
7.7
4
19
.48
7.7
2
14
.01
7.8
2
20
.07
8
.13
Sar
us
cran
e
3,0
18
12
.04
12
.72
10
.67
13
.41
4.8
3
12
.66
4.6
2
12
.73
4
.61
Les
ser
adju
tant
sto
rk
4,5
42
18
.12
18
.36
0.8
5
19
.03
0.8
6
18
.34
0.8
5
18
.54
0
.85
Bar
kin
g d
eer
7,6
12
30
.37
30
.75
42
.01
30
.09
41
.16
31
.01
42
.24
30
.74
4
1.7
4
Leo
par
d
1,5
24
6.0
8
5.9
2
6.0
9
6.0
8
6.5
9
5.9
6
6.1
6
5.8
7
6.0
7
Tig
er
1,8
56
7.4
1
7.6
0
6.8
1
7.2
6
4.3
7
7.2
9
7.2
7
8.1
3
7.0
8
Gia
nt
ibis
2
,04
2
8.1
5
8.1
5
0.4
5
8.1
4
0.4
5
8.1
4
0.4
5
8.1
3
0.4
5
Wil
d b
oar
6
,40
3
25
.55
24
.79
41
.39
23
.45
39
.87
25
.35
41
.66
24
.67
4
0.8
1
Max
imu
m
7,6
12
30
.37
30
.75
42
.01
30
.09
41
.16
31
.01
42
.24
30
.74
4
1.2
8
Min
imu
m
1,0
08
4.0
2
3.7
8
0.4
5
4.0
2
0.4
5
3.9
0
0.4
5
3.9
6
0.4
5
Aver
age
3,5
18
14
.04
14
.05
12
.50
14
.76
11
.67
13
.70
12
.12
14
.10
1
1.7
9
Ric
hn
ess
cla
ss
No
ne
13
,600
54
.27
54
.71
44
.18
56
.04
50
.75
53
.86
49
.24
54
.97
5
0.1
4
Lo
w (
1-4
sp
ecie
s_
7,2
83
29
.06
28
.43
48
.10
28
.41
40
.12
31
.74
41
.08
27
.79
4
0.2
8
Mo
der
ate
(5-8
sp
ecie
s)
3,8
39
15
.32
15
.63
6.9
2
14
.58
9.1
3
13
.03
9.6
8
15
.94
9
.58
Hig
h (
9-1
2 s
pec
ies)
3
39
1.3
5
1.2
4
0.0
0
0.9
2
0.0
0
1.3
8
0.0
0
1.2
9
0.0
0
To
tal
hab
itat
4
11
,461
45
.73
45
.29
45
.73
43
.96
7
9.2
1
To
tal
area
2
5,0
61
6
,51
3
1 p
erce
nta
ge
of
dis
trib
uti
on r
ange
to t
he
no
rther
n r
egio
n;
2 p
erce
nta
ge
of
the
rem
ain
ing h
ab
itat
in y
ear
20
06
to
the
no
rth
ern r
egio
n;
3 s
hif
t in
sp
ecie
s d
istr
ibuti
on c
om
par
ed
wit
h y
ear
20
06
; 4 p
red
icte
d s
uit
able
hab
itat
s fo
r al
l ta
xa,
excl
ud
ing o
ver
lap
ped
are
as
PD 577/10 Rev.1 (F)
54

Ta
ble
14
. C
ontr
ibuti
on o
f p
rote
cted
are
as t
o c
onse
rve
sele
cted
mam
mal
sp
ecie
s in
the
Em
era
ld T
rian
gle
lan
dsc
ape
Sp
ecie
s n
am
e
Bas
elin
e
Lo
w E
con
wit
ho
ut
CC
Lo
w_
Eco
n
Sus.
Po
v
wit
ho
ut
CC
Sus
Po
v
Sus
Devl
wit
ho
ut
CC
Sus
Devl
Unsu
s D
ev.
wit
ho
ut
CC
Unsu
s D
ev.
A
rea
Co
nt.
(%
) A
rea
Co
nt.
(%)
Are
a
Co
nt.
(%)
Are
a
Co
nt.
(%)
Are
a
Co
nt.
(%)
Are
a
Co
nt.
(%)
Are
a
Co
nt.
(%)
Are
a
Co
nt.
(%)
Are
a
Co
nt.
(%)
Gau
r 4
1.0
6
73
.00
41
.27
7
3.1
8
30
.28
92
.52
30
.19
53
.07
3
0.1
9
92
.20
41
.37
69
.94
30
.31
9
2.2
5
42
.59
72
.90
32
.04
92
.72
Ban
ten
g
41
.41
69
.06
42
.11
6
9.2
4
49
.13
67
.24
49
.11
79
.90
4
9.1
1
66
.78
42
.33
67
.40
49
.26
6
6.3
1
43
.10
69
.20
43
.10
69
.20
Sam
bar
1
5.4
1
99
.52
14
.43
9
9.1
8
14
.64
99
.02
15
.14
97
.99
1
5.1
4
99
.20
14
.90
99
.38
14
.74
9
9.4
0
15
.18
99
.54
15
.23
99
.11
Eld
’s d
eer
13
.79
59
.44
13
.68
5
9.2
6
6.3
5
63
.87
6.4
6
59
.65
6
.46
64
.51
13
.77
59
.81
6.4
4
64
.35
13
.29
58
.56
6.1
0
62
.95
Ele
phan
t 5
6.1
1
71
.26
55
.48
7
1.9
4
25
.13
84
.47
53
.26
71
.08
2
5.0
1
84
.31
37
.94
70
.38
25
.20
8
3.8
5
55
.52
71
.91
26
.54
84
.92
Sar
us
cran
e
16
.46
35
.51
17
.03
3
5.1
0
5.4
2
13
.32
3.7
6
35
.20
3
.76
20
.43
17
.11
35
.44
3.6
1
20
.50
16
.93
34
.88
3.5
3
20
.08
Les
ser
adju
tant
sto
rk
27
.14
38
.91
27
.13
3
8.4
2
0.0
8
2.4
2
0.0
8
0.1
1
0.0
8
2.4
1
2.7
1
3.8
4
0.0
8
2.4
2
27
.53
38
.60
0.0
8
2.4
2
Bar
kin
g d
eer
56
.68
48
.49
57
.53
4
8.6
3
72
.32
44
.77
69
.73
60
.24
6
9.7
3
44
.06
58
.07
48
.67
73
.04
4
4.9
7
57
.64
48
.74
71
.86
44
.77
Leo
par
d
16
.91
72
.27
16
.65
7
3.1
4
16
.69
71
.25
16
.93
72
.36
1
7.8
9
70
.59
16
.80
73
.29
16
.95
7
1.5
2
16
.33
72
.36
16
.53
70
.78
Tig
er
25
.72
90
.26
26
.52
9
0.7
0
24
.02
91
.76
25
.21
90
.24
1
6.1
6
96
.20
25
.25
89
.99
25
.01
8
9.4
1
25
.36
91
.36
25
.22
92
.60
Gia
nt
ibis
1
5.2
5
48
.63
15
.23
4
8.5
8
0.0
0
0.0
0
0.0
0
0.0
0
0.0
0
0.0
0
15
.25
48
.70
0.0
0
0.0
0
15
.16
48
.44
0.0
0
0.0
0
Wil
d b
oar
5
3.6
1
54
.53
53
.15
55
.73
71
.71
45
.06
67
.75
75
.09
6
7.7
5
44
.20
53
.82
55
.19
72
.66
4
5.3
6
52
.89
55
.72
70
.76
45
.10
Max
imu
m
56
.68
99
.52
57
.53
9
9.1
8
72
.32
99
.02
69
.73
97
.99
6
9.7
3
99
.20
58
.07
99
.38
73
.04
9
9.4
0
57
.64
99
.54
71
.86
99
.11
Min
imu
m
13
.79
35
.51
13
.68
3
5.1
0
0.0
0
0.0
0
0.0
0
0.0
0
0.0
0
0.0
0
2.7
1
3.8
4
0.0
0
0.0
0
13
.29
34
.88
0.0
0
0.0
0
Aver
age
31
.63
63
.41
31
.68
6
3.5
9
26
.31
56
.31
28
.14
52
.69
2
2.8
5
50
.16
28
.28
60
.17
26
,44
5
6.6
9
31
.79
63
.52
25
.92
57
.50
Ric
hn
ess
cla
ss
No
ne
20
.79
9.9
7
21
.61
1
0.2
8
19
.77
11
.64
23
.63
50
.75
2
3.4
2
23
.42
19
.14
9.2
4
19
.16
1
0.1
3
22
.19
10
.50
20
.92
10
.86
Lo
w (
1-4
sp
ecie
s_
32
.65
29
.19
31
.30
2
8.6
4
56
.04
30
.31
31
.52
40
.12
4
5.2
6
45
.26
42
.51
34
.84
47
.71
3
0.2
3
29
.96
28
.04
46
.46
30
.02
Mo
der
ate
(5-8
sp
ecie
s)
42
.10
71
.41
42
.75
7
1.1
4
24
.17
90
.90
41
.46
9.1
3
31
.32
31
.32
33
.85
67
.58
33
.12
8
9.0
4
43
.37
70
.75
32
.62
88
.57
Hig
h (
9-1
2 s
pec
ies)
4
.46
85
.83
4.3
4
91
.31
0.0
0
NA
3
.39
NA
0
.00
NA
4
.50
85
.13
0.0
1
NA
4
.48
90
.04
0.0
0
NA
1 p
erce
nta
ge
of
dis
trib
uti
on r
ange
to t
he
no
rther
n r
egio
n;
2 p
erce
nta
ge
of
the
rem
ain
ing h
ab
itat
in y
ear
20
06
to
the
no
rth
ern r
egio
n;
3 s
hif
t in
sp
ecie
s d
istr
ibuti
on c
om
par
ed
wit
h y
ear
20
06
PD 577/10 Rev.1 (F)
55

It should be noted that the predicted distributions for most species, except banteng
barking deer and wild boar significantly declined when future climatic conditions
(precipitation in the wettest quarter months and precipitation in the driest quarter months)
were added. In contrast, the predicted habitats for banteng barking deer and wild boar
significantly increased (Table 13; Annex 3).
5.2.5 Contribution of protected areas
All protected areas in the Emerald Triangle landscape cover approximately 6,500 km2 or
26% of the total area. Noticeably, not all of the protected areas were defined as suitable
habitat for selected species. The average extent of suitable habitats was 63% at present
and ranged between 50-64% in 2030. The results also show that the average contributions
of protected areas under the combination of land-use and climate change were less than
under land-use change only.
It should be noticed that more than 80% of the total current and future suitable
habitats for gaur, Sambar deer, Asian elephant and tiger are predicted to be in protected
areas. The contributions of protected areas to protecting the focal selected species were
moderate for banteng, Eld’s deer, barking deer, leopard and wild boar and were low for
Sarus crane, Lesser adjutant stork and Giant ibis. Table 14 also shows that the
contributions of protected areas to protecting the selected species in the future are less
than the current status for most species, except elephant and tiger. The average percentage
of contribution was the lowest (approximately 50%) under the sustainable poverty
scenario. This may be due to the fact more forest areas and contiguous forest patches
were predicted outside the protected areas, therefore the selected species are able to
inhabit these areas.
5.2.6 Concentration of selected wildlife species
The probability values for 12 species generated from the species distribution models were
overlaid using GIS to derive at the total area of distributions and the summed scores for
all species. The results suggest that the total extent of distribution covers approximately
11,460 km2 or 46% of the Emerald Triangle landscape. Of this figure, approximately
5,160 km2 or 45% of the potential distributions were situated in protected area networks,
especially in the PVPF and Dong Kanthung NBCA (Figure 22). In addition,
PD 577/10 Rev.1 (F)
56

approximately 90% of protected areas were predicted as habitat for at least one of 12
selected species.
The summed scores for all species ranging from 1 to 12 were reclassified into 4
richness classes: none; low; moderate and high. Figure 22 also shows that approximately
45% of the Emerald Triangle landscape (study area) was classified as not suitable habitat
for the selected species at the current and all future land-use scenarios. If future climate
change conditions were combined, the predicted none habitat would range from 50-55%,
meaning the selected species will mainly live in protected areas. High species richness
class was predicted along the borders between the PVPF (except the western part) and
Dong Kanthung NBCA, which will be classified as moderate richness. In addition, the
remaining areas in PVPF, Yot Dom, Bun Thrarik-Yot Mon and part of Phou Xiang Thong
were predicted as of low richness for the selected species. The entire areas of Pha Taem
and Kaeng Tana National Parks were categorized as none habitat for any of the 12
species.
PD 577/10 Rev.1 (F)
57

Fig
ure
10 P
redic
ted d
istr
ibuti
on f
or
gau
r F
igu
re
11 P
redic
ted d
istr
ibuti
on f
or
ban
ten
g
PD 577/10 Rev.1 (F)
58

Fig
ure
12 P
redic
ted d
istr
ibuti
on f
or
Sam
bar
dee
r F
igu
re 1
3 P
redic
ted d
istr
ibuti
on f
or
Eld
’s d
eer
PD 577/10 Rev.1 (F)
59

Fig
ure
14 P
redic
ted d
istr
ibuti
on f
or
elep
han
t F
igu
re 1
5 P
redic
ted d
istr
ibuti
on f
or
Sar
us
cran
e
PD 577/10 Rev.1 (F)
60

Fig
ure
1
6 P
redic
ted d
istr
ibuti
on f
or
Les
ser
adju
tant
stork
F
igu
re 1
7 P
redic
ted d
istr
ibuti
on f
or
bar
kin
g d
eer
PD 577/10 Rev.1 (F)
61

Fig
ure
18 P
redic
ted d
istr
ibuti
on f
or
leopar
d
Fig
ure
19 P
redic
ted d
istr
ibuti
on f
or
tiger
PD 577/10 Rev.1 (F)
62

Fig
ure
20 P
redic
ted d
istr
ibuti
on f
or
Gia
nt
ibis
F
igu
re 2
1 P
redic
ted d
istr
ibuti
on f
or
wil
d b
oar
PD 577/10 Rev.1 (F)
63

Figure 22 Species richness classes of selected species for modeling in the Emerald
Triangle protected forests complex
.
PD 577/10 Rev.1 (F)
64

PD 577/10 Rev.1 (F)
65
5.3 GIS Training Courses
Three GIS training courses were conducted during the project phase III. They aimed at
developing human resources skills and technical knowledge necessary for effectively
developing and sharing core dataset and participating in land use and species distribution
modeling. The names of the three training courses and their objectives were as follows:
1) Introduction of GIS, Map Reading and GPS Mapping. This training course was
conducted for park rangers and interested people involved in the project (e.g.
border patrol police staff, RFD officials). The objectives of this course were to
refresh GIS skills and to guide in how to collect and develop a standardized core
GIS database among the three countries.
2) GIS Modeling for Forest Land Use Assessment and Prediction. This training
course was jointly organized for GIS staff and park rangers of the three countries
involved in the project. The objectives of this course were to train participants in
the CLUE model, using default database and to jointly develop land use scenarios
for the Emerald Triangle.
3) GIS - Wildlife Distribution Modeling. This training course was conducted for GIS
staff, park rangers and wildlife scientists of the three countries who were involved
in the project. The training aimed at introducing various spatially explicit species
distribution models (e.g. logistic regression, maximum entropy [MAXENT]),
including their advantages and disadvantages, finalizing wildlife species for
modeling and jointly generating distributions of selected species in the Emerald
Triangle.
The GIS Consultant worked closely with Project Managers from Thailand and
Cambodia, as well as Cambodian staff and Wildlife Consultants to define qualifications of
potential candidates, and to identify suitable participants to attend the training courses.
Descriptions and results of each training course are presented in the next section.
5.3.1 GIS Training I: GIS Training on Introduction of GIS, Remote Sensing and Map
Reading
The 1st GIS training session (A 1.4- 1x2 days GIS Training on Introduction of GIS, Remote
Sensing and Map Reading) was conducted on November 28th -29th, 2013 at the Pha Taem
National Park. A detailed training schedule is shown in Table 15. The Director of National

PD 577/10 Rev.1 (F)
66
Park Division, and the Director of Wildlife Conservation Division and Information Center
affiliated with Protected Area Administration Region 9 were invited to open the training and
to present a lecture on application of remote sensing and GIS for forest monitoring at
protected areas in region 9. In addition, Dr. Naris Bhumphanpan (Wildlife Consultant)
presented the overview of wildlife diversity and guideline for wildlife survey at the Emerald
Triangle. These two presentations stimulated and integrated related activities either
implemented by the ITTO project or the Department of National Parks, Wildlife and Plant
Conservation. Therefore, participants and concerned individuals & agencies understood
overall project goals and objectives.
Table 15 Training schedule of GIS Training on Introduction of GIS, Remote Sensing and
Map Reading
Day 1, December 28, 2013
Time Topic Responsibility/Instructor
08.00-09.00 Registration ITTO Project (Thailand
Component)
09.00-09.15 Opening and welcome remark Director of National Park
Division, Protected Area
Administration Region 9
09.15-09.30 Summary of ITTO Project (Phase I-III)
and introduction of participants
Mr. Kamol Wisupakarn (Project
Manager)
09.30-10.30 Introduction to Remote Sensing Prof. Yongyut Trisurat
10.30-10.45 Coffee break -
10.45-11.30 Application of remote sensing and GIS
for forest monitoring at protected areas
region
Director of Wildlife
Conservation Division and
Information Center, Protected
Area Administration Region 9
11.30-12.00 Overview of wildlife diversity and
guideline for wildlife survey at the
Emerald Triangle
Dr. Naris Bhumpakphan
12.00-13.00 Lunch -
13.00-14.30 Visual interpretation technique and
practice
Prof. Yongyut Trisurat
14.30-14.45 Coffee break -
14.45-16.15 Accuracy assessment and field check Prof. Yongyut Trisurat and
ITTO Project
16.15-16.45 Contingency matrix and presentation of
accuracy assessment
Prof. Yongyut Trisurat and
participants
16.45-17.00 Summary for day 1 Prof. Yongyut Trisurat
Day 2, December 29th, 2013 08.00-08.30 Registration ITTO Project (Thailand
Component)
08.30-10.30 Introduction to coordinate system and
map reading
Prof. Yongyut Trisurat

PD 577/10 Rev.1 (F)
67
Time Topic Responsibility/Instructor
10.30-10.45 Coffee break
10.45-12.00 Introduction to GIS Prof. Yongyut Trisurat
12.00-13.00 Lunch
13.00-14.30 GIS exercise (I) Prof. Yongyut Trisurat and
participants
14.30-14.45 Lunch
14.45-16.00 GIS exercise (II) Prof. Yongyut Trisurat and
participants
16.00-16.15 Training assessment ITTO Project
16.15-16.30 Awarding training certificate Project Manager and
Prof. Yongyut Trisurat
Training materials provided to participants included:
1) Remote sensing technique for ecosystem monitoring at Khao Yai National Park (Dr.
Satit Wacharakitti)
2) Introduction to remote sensing and visual interpretation (Prof. Yongyut Trisurat)
3) Training manual on Introduction to GIS and remote sensing (Prof. Yongyut Trisurat)
4) GIS database and decision support system for field staff of the Protected Area
Administration Region 9 (Ubon Ratchathani) (Mr. Vichit Jiramongkolkarn, Director
of National Park Division, Protected Area Administration Region 9)
5) Threats and patrolling data (Mr. Wichit Jiramongkolgran)
There were approximately 30 participants from Pha Taem National Park, Kaeng
Tana National Park, Phu Jong Nayoi National Park Buntrarik-Yot Mon Wildlife Sanctuary
and Yot Dom Wildlife Sanctuary attending the training. Besides, RFD staff, ITTO Project
staff and graduate students from Kasetsart University also participated in this training.
Names of participants and trainers are attached in Annex 2. In addition, selected photos
showing training activities are attached in Box 1.
At the end of the training, the ITTO Project asked participants to evaluate the training
performance according to two main criteria namely training content and logistic arrangement.
The results are summarized in Table 16.

PD 577/10 Rev.1 (F)
68
Table 16 Training evaluation summary of the 1st GIS training
Item
Percent (%)
Very
high
High Moderate Low Very
low
Not
satisfy
I. Content and training
approach
1. Training contents meet
expectation
43.4 53.3 3.3
2. Benefits to participant’s
responsibility
56.7 43.3
3. Capacity of trainer to
disseminate knowledge
70.0 26.7 3.3
4. Duration of training 16.7 33.3 13.3 36.7
5. Training materials 23.3 70.0 6.7
6. Equipment and supply for
training
36.7 43.3 16.7 3.3
Average 41.1 45.0 7.2 6.7
II. Logistic arrangement
1. Invitation and contact prior
training
40.0 53.3 6.7
2. Arrangement during training 40.0 60.0
3. Training venue 40.0 43.3 16.7
4. Food and drink 33.4 43.3 23.3
5. Overall satisfaction 60.0 30.0 10.0
Average 42.7 46.0 11.3
Overall average 41.8 45.4 9.1 3.6
In summary, 86% of all participants expressed very high or high satisfaction of the
performance of the training session. Nevertheless, about 37% of all participants showed low
satisfaction on the duration of training. They preferred to have a longer duration of the
training period due to a lot of interesting topics were provided and they could not capture all
contents in a short period. The GIS consultant and the Project Manager had discussed this
issue before the training. However, we had experiences and observations that if the duration
was longer (3-4 days) some participants would leave the training before the end. In addition,
fewer participants would attend the training. Therefore, the duration of training was
decided to be 2 days.
5.3.2 GIS Training II: GIS Modeling for Forest Land Use Assessment and Prediction
Originally, the 2nd GIS training session was also planned for 2 days (A 1.5 - 1 x 2 days on
Joint Training Workshop on GIS Modeling for Forest Land Use Assessment and Prediction).
After discussion with the two project managers on the detailed program, the duration of the
training workshop was extended to 5 days (March 10-15, 2014). The second training was

PD 577/10 Rev.1 (F)
69
conducted in Tbeng Mean Chey Preah Vihear province, Cambodia. A detailed training
schedule is shown in Table 17.
Table 17. Provisional program of Joint Training Workshop on GIS Modeling for Land Use
Planning Scenario (2nd GIS Training)
Day Description Resource Person/Faculty
Day 1 Arrival of Participants and Resources Persons
Check in at Guess House
Dinner Lim Sopheap
Day 2
Session 1: Opening Session
Dany and Kamol
Wisupakan
Welcome (Mr. Ith Phumara,_Cheif Of Preah Vihear
Forestry Administration Cantonment Ith Phumara
Remark (Dr. Dennis Cengle, Technical Advisor,
ITTO PD 577/10 Rev.1 (F))
Remarks (Mr. Sapol, ITTO Project Coordinator, Thailand
Component)
Remarks (Dr.Phonesavanh Thepphasoulithone, Vice
Rector of Champasak University
Opening Address (H.E. Ung Sam Ath, Deputy Director
General of Forestry Administration, Cambodia
Introduction of Participants Participants
Group Photo and Coffee Break
Session 2: Target Key Species of Wildlife in the Emerald
Triangle Protected Forests Complex
ITTO Transboundary Biodiversity Conservation at the
Emerald Triangle Protected Forest Complex, Project
Phase III
Dr. Dennis Cengel
The Target Key Species of Wildlife in Preah Vihear
Protected Forest Prom Sovanna
Target Key Species of Wildlife in Pha Taem Protected
Forest Complex
Dr. Naris Bhumpakphan
Progress and Target Key Species of Wildlife in
Dongkanthung Protected Forest
Dr.Phonesavanh or
representative
Lunch Break
Session 3: Land Use Dynamic and Land cover
classification
Land cover classification in GMS Region Mrs. Sar Sophyra
Satellite Imagery Interpretation and Land Cover
Assessment Leng Chivin
Coffee Break Lim Sopheap
Session 4: Land Use Dynamic and Land cover
classification

PD 577/10 Rev.1 (F)
70
Detection of Forest Cover Change in the Pha Taem
Protected Forests Complex, Thailand
Mr. Wichit
Jiramongkhonkan
Land Use Classification and Land Use Planning in
Cambodia Kim Sobon
Dinner Lim Sopheap
Day 3
Session 5: CLUES-s model (Exercise 1: Learning to Know
the User-Interface and Exercise 2: Simulating Different
Scenarios of Land Use Change)
Introduction of Markov Chain (Lecture) Dr. Yongyut Trisurat
Open Source Land Use Modeling: and CLUE-s models
(Lecture)
Dr. Yongyut Trisurat
Practice on GIS Land Use Modeling Resource Person/Faculty
Coffee Break
Session 6: CLUES-s model (Exercise 3: Defining Spatial
Policies and Exercise 4: How to Do Statistical Analysis?)
Practice on GIS Land Use Modeling Dr. Yongyut Trisurat
Lunch Break Lim Sopheap
Session 7: Past and Current Land Use in the Emerald
Triangle and Future Scenarios (Lecture and Brain
Storming)
Group Works and Brain Storming on Scenario
Development
Dr. Yongyut Trisurat
Coffee Break
Session 8: Creating CLUE-s Application for the Emerald
Triangle
Group Works on preparation of land use data, location
factors and conceptual models)
Dr. Yongyut Trisurat
Dinner
Day 4
Session 9: Creating CLUE-s Application for the Emerald
Triangle
Group Works on preparation of parameter files and
conditions
Dr. Yongyut Trisurat
Practice on GIS Land Use Modeling
Coffee Break
Session 10: Creating CLUE-s Application for the Emerald
Triangle
Evaluating preliminary results and discussion Dr. Yongyut Trisurat
Practice on GIS Land Use Modeling
Lunch Break Lim Sopheap
Session 11: Creating CLUE-s Application for the Emerald
Triangle
Defining appropriate scenarios and most likely conditions,
and simulating the models
Dr. Yongyut Trisurat
Practice on GIS Land Use Modeling
Coffee Break Lim Sopheap

PD 577/10 Rev.1 (F)
71
Session 12: Creating CLUE-s Application for the Emerald
Triangle
Evaluating the designated future land use and implications
for biodiversity conservation
Dr. Yongyut Trisurat
Practice on GIS Land Use Modeling
Dinner Lim Sopheap
Day 5
Field Visit to Emerald Triangle Area Between Cambodia-
Lao PDR-Thailand (Optional) Ith Phumara
Lunch Break: At the Border Cambodia and Lao PDR Lim Sopheap
Closing and Certificate Handout Dany Chheang &
Kamol Wisupakan
Course Evaluation
Remarks by the Trainers
Remarks by the Dr. Dennis Cengle
Distribute Certificates
Day 6 Departure of participants and resource persons
The Governor of Preah Vihear Province, Mr. Ung Sam Ath (Deputy Director General
of Cambodia Forest Administration), Mr. Hiroshi Nakata (JICA/Technical Advisor of
Cambodia Forest Administration) and Mr. Ith Phoumar (Preah Vihear Cantonment, FA) were
invited to give speeches and opening remarks at the training workshop.
Mr. Chheang Dany presented the Key Species of Wildlife in Preah Vihear Protected
Forest and Dr. Naris Bhumphanpan provided the overview of wildlife diversity and guideline
for wildlife survey at the Emerald Triangle. These two presentations stimulated and
integrated activities implemented by the ITTO project and the Cambodia Forestry
Administration. Therefore, participants and concerned individuals & agencies had a good
overll picture of project goals and objectives.
Training materials provided to participants included:
1) CLUE Model manual (Prof. Peter Verburg)
2) Introduction to Markov Chain Model (Prof. Yongyut Trisurat)
3) Scenario development (Prof. Yongyut Trisurat)
4) Target wildlife species and survey techniques (Dr. Naris Bhumpakphan)
5) Land use change detection and decision support system (Mr. Vichit Jiramongkolkarn,
Director of National Park Division, Protected Area Administration Region 9)
6) GIS dataset for land use modeling in the Emerald Triangle (Mr. Utai Dechyosdee,
GIS Program Assistant)

PD 577/10 Rev.1 (F)
72
There were all together 50 participants/resource persons. Thirty two participants
were from Cambodia, 6 from Laos and 12 from Thailand. It is noted that three
Superintendents (Phu Jong-Na Yoi National Park, Bunthrarik Yot Mon Wiildlife Sanctuary
and Yot Dom Wildlife Sanctuary), Director of Wildlife Division and Director, National Park
Division, DNP Regional Office 9, Ubon Ratchathanee also participated in the workshop.
Participants from Cambodia included government officials, NGO representatives and
lecturers from Preak Leap National College of Agriculture. Participants from Laos
consisted of three lecturers from Champasack University and Forestry officials. Names of
participants and trainers are attached in Annex 3.
At the end of the training, the Local Organizing Committee (Cambodia Component)
asked participants to evaluate the training performance according to three main criteria
namely training content, logistic arrangement and overall training. Thirty-six participants
returned the questionnaires. The training evaluation results showed that the contents of
training were average (ranks 13-38%) to good (41-77%) (Table 18). The main constraints of
the training contents included limited time and subject matter. Most participants did not
have knowledge background on GIS and spatial modeling. Therefore, they could not truly
understand the concepts and practices within 3 days.
The GIS consultants and local organizers had foreseen the issues on level of GIS
understanding, languages and participant knowledge background. However, we could not
select suitable candidates because of poor human resource capacities, especially from Laos
and Cambodian. To minimize these issues, we used four languages (English, Thai, Laotian
and Cambodian) and more exercises. Nevertheless, the percentage of overall satisfaction
was over 80%. Most participants realized the usefulness and the power of GIS and the
participatory approach for land use modeling and wildlife distribution prediction in the
Emerald Triangle area. In addition, more than 70% of participants appreciated logistic
arrangement and facilities offered during the training, although it was the first meeting held
in this new building.

PD 577/10 Rev.1 (F)
73
Table 18 Training evaluation summary of the 2nd GIS training
Details Percent (%)
Very high High Moderate Low Very
low
Not satisfy
I. Content of training
The content was appropriate and met
my expectations 5.56 77.78 13.89 2.78 0.00 0.00
The content was useful and I will be
able to be use it on the job 16.67 61.11 22.22 0.00 0.00 0.00
The transfer of knowledge of the
resource persons during the training
was appropriate and suitable 2.78 61.11 33.33 2.78 0.00 0.00
The period of time allowed for the
training was appropriate 0.00 41.67 38.89 16.67 0.00 2.78
The documents and supporting
materials provided were suitable 2.78 75.00 11.11 11.11 0.00 0.00
II. Organization of training
Cooperation between the participants 13.89 72.22 11.11 0.00 2.78 0.00
Facilitation of the training organizers 8.33 72.22 16.67 2.78 0.00 0.00
Suitability of the training room 11.11 75.00 11.11 2.78 0.00 0.00
Satisfaction with meals and breaks 11.11 75.00 11.11 2.78 0.00 0.00
III. Overall satisfaction with the
training 2.78 86.11 11.11 0.00 0.00 0.00
5.3.3 GIS Training 3: GIS - Wildlife Distribution Modeling
The 3rd GIS training session on GIS-Wildlife Distribution Modeling was planned to the last
for 5 days (A 1.5 - 1 x 5 (2) days) on October 20-25, 2014). The venue of the training was
Toh Saeng Kong Chiam Hotel, Ubon Ratchathani Province, Thailand. A detailed training
schedule is shown in Table 19. The training aimed at introducing various spatially explicit
species distribution model (e.g. logistic regression, maximum entropy [MAXENT]),
advantages and disadvantages, finalizing wildlife species for modeling and jointly generating
distributions of selected species in the Emerald Triangle

PD 577/10 Rev.1 (F)
74
Table 19 Provisional program of Training Workshop on GIS-Wildlife Distribution Modeling
(3rd GIS Training)
Time Topic Responsible Person
Day 1 – October 20, 2014
13.00-16.00 Arrival of participants Project-Thailand Component
16.00-17.00 Brief of Workshop Introduction Project-Thailand Component
18.00 Welcome Dinner
Day 2 – October 21, 2014
08.00-09.00 Registration Project-Thailand Component
09.00-09.10 Opening Address Mr. Suchat Kalawongsa, RFD
representative
09.10-09.20 Welcome Addresses Mr. Dany Chhaeng and Dr.
Dennis Cengel, ITTO-Project
(Cambodia component)
09.20-09.30 Workshop Objective and Introduction Dr. Yongyut and participants
09.30-10.30 Final Wildlife Technical Report(Thailand
and Laos) Cambodia
Dr. Naris Bhumpakphan and
Representative of
Champasack University
FA Representative
10.30-10.45 Coffee Break Project-Thailand Component
10.45-12.00 Finalize Key Wildlife Targets for Modeling Dr. Naris and Team
12.00-13.00 Lunch Project-Thailand Component
13.00-14.30 Map Coordinates and Introduction to GIS Dr. Yongyut
14.30-14.45 Coffee Break Project-Thailand Component
14.45-17.30 Field Excursion to Pha Taem national Park Project-Thailand Component
Day 3 - October 22, 2014
08.00-08.30 Registration Project-Thailand Component
08.30-10.00 Wildlife habitat welfare Dr. Naris
10.00-10.15 Coffee Break Project-Thailand Component
10.15-12.00 Wildlife Mapping (Cartography Overlay) Dr. Yongyut and Participants
12.00-13.00 Lunch Project-Thailand Component
13.00-14.30 Wildlife Mapping (Logistic Regression) Dr. Yongyut and Participants
14.30-14.45 Coffee Break Project-Thailand Component
14.45-16.30 Wildlife Mapping (Logistic Regression-
Cont.)
Dr. Yongyut and Participants
Day 4 - October 23, 2014
08.00-08.30 Registration Project-Thailand Component
08.30-10.30 Wildlife Modeling With MAXENT (I) Dr. Yongyut
10.30-10.45 Coffee Break Project-Thailand Component
10.45-12.00 Wildlife Modeling With MAXENT (II) Dr. Yongyut and Participants
12.00-13.00 Lunch Project-Thailand Component
13.00-15.00 Case Studies on Wildlife Modeling Dr. Yongyut and Participants
15.00-15.15 Coffee Break Project-Thailand Component
15.15-15.30 Training Evaluation Project-Thailand Component
15.30-16.00 Awarding Certificate and Closing RFD representative
Day 5 - October 24, 2014
08.30-10.30 Preparation of conclusion and reports Project-Thailand and
Cambodia Component
11.00 Departure of participants
-2-

PD 577/10 Rev.1 (F)
75
Training materials provided to participants included
1) A MAXENT Model v3.3.3e Tutorial (Nick Young, Lane Carter and Paul Evangelista)
2) Modeling species distribution (Prof. Yongyut Trisurat)
3) A statistical explanation of MAXENT for ecologists (Elith et al., 2011)
4) Lecture notes: coordinate; introduction to GIS; GIS analysis and overlay; and logistic
regression (Prof. Yongyut Trisurat)
5) Progress report on GIS database (Prof. Yongyut Trisurat)
6) Final Tecxhnical Report on Wildlife Ecology (Dr. Naris Bhumpakphan)
Mr. Suchat Kalawongsa, Director of Forestry International Coordination Office of the
Royal Forest Department welcomed participants and gave the opening remark. Then, Dr.
Phonesavanh Thepphasoulithone (Deputy-Rector of Champasak University), Mr. Dany
Chheang (Manager of Cambodia Component) and Dr. Dennis Cengel (Project Technical
Advisor of the Cambodia Component) were invited to give speeches and expectations of the
training workshop.
After the opening, Dr. Naris Bhumphanpan (Wildlife Consultant) presented the Final
Technical Report on wildlife diversity and potential species for monitoring at the Emerald
Triangle. The results of wildlife surveys in Preah Vihear Protected Forest and Dong
Kanthung proposed National Biodiversity Conservation Area were also presented by
scientists from Champasak University and FA of Cambodia, respectively. The main contents
of this training course were conducted by Prof. Yongyut Trisurat (GIS consultant) through
normal lecture, exercise, discussion and presentation of group works.
There were all together 41 participants/resource persons. Eighteen participants were
from Cambodia, 5 from Laos and 18 from Thailand. It is noted that this training course was
a continuation from the second training course on land-use modeling held in Cambodia.
Therefore, more than 80% of participants were the same as the second course. All
Superintendents of the protected areas situated in the Pha Taem complex, Director of
Wildlife Division and Director, National Park Division, DNP Regional Office 9, Ubon
Ratchathanee attended the training workshop. Participants from Cambodia included
government official and ITTO project/Cambodia component. Participants from Laos
consisted of five staff from Champasack University. Names of participants and trainers are
attached in Annex 4.

PD 577/10 Rev.1 (F)
76
At the end of the training, the Local Organizing Committee asked participants to
evaluate the training performance according to three main criteria namely training content,
logistic arrangement and overall training. Thirty-six participants returned the questionnaires.
The training evaluation results showed that the contents of training were ranked between
highest and good (>80%) (Table 20). The main constraint of the training contents was the
period of time allowed for the training. It should be noted that the objectives of this training
course were to introduce species distribution modeling techniques and to finalize key
wildlife species for modeling. It was not aimed to train participants to become experts in
GIS modeling. In addition, most participants had basic knowledge of GIS and spatial
modeling obtained from previous training courses. Therefore, the identified constraint was
unavoidable.
In addition, more than 80% of participants appreciated logistic arrangement and
facilities offered during the training. The percentage of overall satisfaction was over 80%.
Most participants realized the usefulness and the power of GIS for wildlife distribution
prediction in the Emerald Triangle area. In addition, they agreed to select 12 wide-ranging
species having trans-boundary territory. These species include nine mammals: gaur;
banteng; sambar; Eld’s deer; Asian elephant; barking deer; leopard; tiger and wild boar; and
three birds: Sarus crane; Lesser adjutant stork; and Giant ibis.
Table 20 Training evaluation summary of the 3rd GIS Training
Content of training Level of satisfaction (%)
Very
high
High Moderate Low Very
low
Not
satisfy
I. The content was appropriate and met
my expectations
The content was useful and I will be able to
be used it on the job. 17 71 13 0 0 0
The transfer of knowledge of the resource
persons during the training was appropriate
and suitable. 21 63 17 0 0 0
The period of time allowed for the training
was appropriate. 8 58 33 0 0 0
The documents and supporting materials
provided were suitable 17 75 8 0 0 0
II. Organization of training
Cooperation between the participants 17 75 8 0 0 0
Facilitation of the training organizers 17 71 13 0 0 0
Suitability of the training room 17 71 13 0 0 0
Satisfaction with meals and breaks 17 63 21 0 0 0
III. Overall satisfaction with the training 8 79 13 0 0 0

PD 577/10 Rev.1 (F)
77
6. CONCLUSIONS AND RECOMMENDATIONS
The GIS consultant had overall responsibility to update the GIS database for trans-boundary
biodiversity conservation planning and to assist joint researches on land-use modeling and
wide-ranging species distribution in the ETFC through the involvement of multi-stakeholders
from the three participating countries. Six specific duties were assigned to the GIS Consultant
as outlined in Chapter 1.
The GIS database is intended to be used to support biodiversity conservation and
protected areas management and decision-making at both the PPFC and the ETFC levels.
Therefore, two GIS databases were updated and or developed during the project phase III.
The first database at the scale of 1:50,000 is for the PPFC. It consists of 11 themes and more
than 30 layers, including their attributes. Basically, they were updated from the project phase
II using up-to-date data and satellite images. The second database covers the entire Emerald
Triangle landscape and surrounding areas. This dataset includes 9 themes and 18 layers. The
coverage of protected areas in Lao PDR (Phou Xeing Thong and Dong Khanthung) and in
Cambodia (Preah Vihear Protected Forest) and wildlife occurrences were included.
Generally, they were gathered from existing databases that are available in other
organizations (e.g., FA, Mekong River Commission, FAO, WorldClim database, previous
phase). The main purposes of the database development were for land use modeling and
prediction of species distributions.
The current land-use map across the Emerald Triangle landscape was visually
interpreted from satellite images and the rate of reduction was calculated accordingly. Future
land-use patterns were predicted using the Dyna-CLUE model based on four different land-
use scenarios in 2030 defined by multi-stakeholders from the three countries. The model
results indicated that dry dipterocarp forest in the north of Dong Khanthung provincial
protected forest in Lao PDR and to the west of Pha Taem National Park in Thailand would be
threatened by encroachment for agriculture and rubber plantation. If on restriction policy,
parts of the Preah Vihear protected forest in Cambodia and Phou Xiang Thong National
Biodiversity Conservation Area in Lao PDR would be converted to arable land in 2030.
Evergreen forests were predicted as relatively intact at the current stage because they are
found either inside protected areas or in steep terrains, thus become natural barriers for
human-intervention.

PD 577/10 Rev.1 (F)
78
The predicted deforestation in combination with future climate change would cause
negative impacts on wildlife distribution and wildlife hotspots in the Emerald Triangle
protected forest complex. The multi-stakeholders from the three countries selected 12 species
for modeling their distributions. The criteria used for selection of target species include: 1)
wide distribution in the Emerald Triangle (having trans-boundary territory), 2) regionally and
nationally threatened status, 3) adequate observation records and 4) iconic or flagship for
conservation.
The results revealed that the likely suitable habitats for 12 wildlife species in 2013
derived from the logistic regression and the MAXENT model cover approximately 19% of the
Emerald Triangle landscape and 61% of this figure were as predicted to be in protected area
networks, especially in the PVPF and Dong Kanthung NBCA. Protected areas in Thailand
were predicted as having relatively low suitable for the modeled species. This phenomena
resulted from the dissimilarity of survey efforts in the study areas. Intensive wildlife surveys
were conducted in the Preah Vihear during 1998-2006, but they were rarely or conducted
only once in Lao PDR and Thailand.
In addition, three GIS training courses were conducted during the project phase III,
which aimed at developing human resources in the skills and technical knowledge necessary
for understanding and using GIS database in land use and species distribution modeling.
These training courses consisted of a) Introduction of GIS, Map Reading and GPS Mapping,
b) GIS Modeling for Forest Land Use Assessment and Prediction and 3) GIS - Wildlife
Distribution Modeling. The participants of the first training were GIS staff, park rangers and
wildlife scientists from Thailand but the remaining courses were conducted for participants
from the three countries who were involved in the project. It should be noted that the results
of the second and the third courses were used for land-use modeling and wildlife distribution
modeling in the Emerald Triangle landscape as discussed in the sections 5.1 and 5.2,
respectively.

PD 577/10 Rev.1 (F)
79
7. IMPLICATIONS FOR PRACTICES
7.1 Integration of Scenarios and Models
The results of this research clearly demonstrate that the scenarios and modeling of land use
would contribute to a better understanding of management decisions to protect the remaining
forest cover and to maintain trans-boundary biodiversity across the Emerald Triangle
landscape. The scenario framework provided opportunities for multi-stake holders to
effectively participate and raised their concerns and ambition of future land use options based
on two main drivers, namely 1) population growth and 2) uncertainty of economic trends that
are stimulated by the AEC scheme. In addition, the spatially explicit land use modeling
method (CLUE-s) make it possible to visually present land use patterns, locations and
magnitude of change in the landscape. So that, multi-stakeholders involved in the project
have the same picture and understanding of what, when, where and how the future
phenomena happen for effective collaboration. The integration of scenarios and models used
in this project is applicable for other projects implemented at local, national and regional
scales.
7.2 Important Habitats of Selected Species
The distributions of the 12 species and the centers of species richness were predicted in the
Preah Vihear protected forest adjoining the Dong Khanthung NBCA and along the tri-
national borders, which suffer less from fragmentation and other human disturbances. These
results confirm the important role of core area located in large protected areas in conserving
medium- to large-bodied mammal species. In addition, threatened species were restricted in a
few patches due to specific ecological factor requirements and less human disturbance. In
contrast, substantial suitable habitats for common taxa (e.g., barking deer and wild boar) and
landscape bird species (Giant ibis, Sarus crane and Lesser adjutant stork) were predicted
outside protected areas because these taxa occupy various habitats ranging from pristine to
human-altered natural landscapes. Their preferable habitats include paddy fields and open
woodland close to water bodies that mainly exist outside protected areas.
The results of this research also revealed that these species will require significant
movement across the tri-national borders to respond heterogeneously to topographic features
and seasonal climatic conditions. Based on field surveys, literature reviews and discussion
with local residents these species seasonally move from places to places. Recently, a herd of

PD 577/10 Rev.1 (F)
80
elephants and a few guars move to Bun Thrarik-Yot Mon Wildlife Sanctuary and Pha Taem
National Park in Thailand, respectively to avoid human disturbance in Lao PDR. Although,
protected areas in Thailand are either relatively small or isolated or lack core area and have
less suitable habitats for many selected mammal species, the protection measures are more
effective than Lao PDR and Cambodia (Trisurat 2007; Bhumpakphan, in press).
7.3 Translating research results into concrete actions
Although border tension and armed conflicts between Thailand and Cambodia erupted twice
during the project phases, technical contacts and cooperation between teams of participating
countries have survived and quickly rebooted political and diplomatic relationship. The
ETFC project is able to translate trans-boundary conservation concepts into concrete actions
to enhance continuing collaboration between all relevant agencies, as well as sustainable
livelihoods of local communities.
The tangible achievements of this technical report include a) developing and updating
GIS databases for the PPFC and the Emerald Triangle, b) improving knowledge and
understanding of multi-stakeholders on GIS and its potential uses for trans-boundary
biodiversity conservation through a series of training sessions and joint wildlife research
projects and c) identifying risk areas of future deforestation and the consequences on wide-
ranging species distribution in the Emerald Triangle.
In terms of the international collaboration to support trans-boundary biodiversity
conservation initiatives, this report provided research outputs on land-use modeling and
predicted distributions of 12 wide-ranging species having trans-boundary territory, and used
to formulate compatible management framework reflected in the common vision of the
project.
It is noted that the projected species distribution models should not be used as
accurate predictors of where species will be in the future because of the various limitations of
the factors used in the models as mentioned above. Despite these limitations, the modeled
results provide an understanding of the potential effects of land-use scenarios, so that policy
makers can proactively strengthen collaborative trans-boundary biodiversity conservation to
response to projected range shifts. The priority areas for protection include moderate and high
richness classes and the predicted deforestation between 2013 and 2030. In addition, the
lessons from this project can be applied to conservation planning of individual or protected
areas complexes.

PD 577/10 Rev.1 (F)
81
The lessons learned and the research results have been disseminated to national and
international communities. Two articles, 1) Predicting Land-use and Land-cover Patterns
Driven by Different Scenarios in the Emerald Triangle Protected Forests Complex and 2)
Promoting Trans-boundary Biodiversity Conservation between Thailand, Lao PDR and
Cambodia have been accepted to be published in Thai Forestry Journal and ITTO Tropical
Forestry Update Bulletin in early 2015, respectively. In addition, parts of the results were
presented at the CBD COP 12 meeting in Korea and Joint Meeting on Promotion of Trans-
boundary Biodiversity Conservation in the Taninthayi Range between Myanmar and
Thailand held in Bangkok on 29 July 2014.

PD 577/10 Rev.1 (F)
82
ANNEXES

A
nn
ex 1
C
orr
elat
ion m
atri
x o
f en
vir
onm
enta
l var
iable
s det
erm
inin
g s
pec
ies
dis
trib
uti
on i
n t
he
Em
eral
d T
rian
gle
lan
dsc
ape
Var
iab
les
AN
N._
RA
IN
DR
Y_Q
_R
AIN
W
ET
_Q
_R
AIN
D
EM
S
LO
PE
A
SP
EC
T
RO
AD
_D
IST
S
TR
EA
M_D
IST
C
ITY
_D
IST
P
OP
UL
AT
ION
T
IGE
R_P
RE
Y
LE
OP
_P
RE
Y
AN
N._
RA
IN
1
-.022
.9
64
.2
72
.2
53
.0
01
.1
26
.3
35
.1
85
-.
057
-.
019
-.
011
DR
Y_
Q_
RA
IN
-.022
1
-.
13
6
.20
7
.24
0
-.0
02
.4
26
.2
01
.0
33
-.
099
.2
97
.2
87
WE
T_
Q_
RA
IN
.964
-.
136
1
.26
3
.24
0
.00
5
.01
0
.276
.1
00
-.
040
-.
137
-.
131
DE
M
.272
.2
07
.2
63
1
.6
22
.0
19
.2
09
-.
080
.1
12
-.
050
-.
212
-.
249
SL
OP
E
.253
.2
40
.2
40
.6
22
1
-.
01
1
.19
7
.021
.0
63
-.
055
-.
100
-.
116
AS
PE
CT
.0
01
-.
002
.0
05
.0
19
-.
01
1
1
-.0
16
.0
12
-.
001
.0
19
.0
20
.0
22
RO
AD
_D
IST
.1
26
.4
26
.0
10
.2
09
.1
97
-.
01
6
1
.197
.2
92
-.
109
.2
63
.2
52
ST
RE
AM
_D
IST
.3
35
.2
01
.2
76
-.
08
0
.02
1
.01
2
.19
7
1
.154
-.
051
.2
35
.2
41
CIT
Y_
DIS
T
.185
.0
33
.1
00
.1
12
.0
63
-.
00
1
.29
2
.154
1
-.065
.4
48
.4
54
PO
PU
LA
TIO
N
-.057
-.
099
-.
04
0
-.0
50
-.
05
5
.01
9
-.1
09
-.
051
-.
065
1
-.071
-.
078
TIG
ER
_P
RE
Y
-.019
.2
97
-.
13
7
-.2
12
-.
10
0
.02
0
.26
3
.235
.4
48
-.
071
1
.9
71
LE
OP
_P
RE
Y
-.011
.2
87
-.
13
1
-.2
49
-.
11
6
.02
2
.25
2
.241
.4
54
-.
078
.9
71
1
Rem
ark
s: A
NN
._R
AIN
, an
nu
al r
ain
fall
; D
RY
_Q
_R
AIN
, ra
infa
ll i
n t
he
dri
est
qu
arte
r; W
ET
_Q
RA
IN,
rain
fall
in
th
e w
ette
st q
uar
ter;
DE
M,
dig
ital
ele
vat
ion
mo
del
; S
LO
PE
, p
erce
nt
slo
pe;
AS
PE
CT
, as
pec
t d
irec
tio
n (
deg
ree
fro
m n
ort
h d
irec
tion
); R
OA
D_
DIS
T,
pro
xim
ity t
o r
oad
; S
ST
RE
AM
_D
IST
, p
roxim
ity t
o s
trea
m n
etw
ork
; C
ITY
_D
IST
, p
roxim
ity t
o d
istr
ict
cen
ter;
PO
UL
AT
ION
, p
op
ula
tion
den
sity
per
km
;, T
IGE
R_
PR
EY
, ti
ger
pre
y s
pec
ies;
an
d L
EO
P_P
RE
Y,
leop
ard
pre
y s
pec
ies
PD 577/10 Rev.1 (F)
83

PD 577/10 Rev.1 (F)
84
ANNEX 2
PREDICTED DISTRIBUTIONS OF SELECTED WILDLIFE
UNDER LAND-USE CHANGE SCENARIOS

PD 577/10 Rev.1 (F)
85
Annex 2.1 Predicted distribution for gaur in 2030 under different land-use change scenarios:
a) low economic decline and localized resource degradation; b) unsustainable
development and serious resource degradation; c) sustainable poverty and stable
resources; and d) sustainable development and limited resources degradation

PD 577/10 Rev.1 (F)
86
Annex 2.2 Predicted distribution for banteng in 2030 under different land-use change scenarios:
a) low economic decline and localized resource degradation; b) unsustainable
development and serious resource degradation; c) sustainable poverty and stable
resources; and d) sustainable development and limited resources degradation

PD 577/10 Rev.1 (F)
87
Annex 2.3 Predicted distribution for Sambar deer in 2030 under different land-use change scenarios:
a) low economic decline and localized resource degradation; b) unsustainable
development and serious resource degradation; c) sustainable poverty and stable
resources; and d) sustainable development and limited resources degradation

PD 577/10 Rev.1 (F)
88
Annex 2.4 Predicted distribution for Eld’s deer in 2030 under different land-use change scenarios: a)
low economic decline and localized resource degradation; b) unsustainable development
and serious resource degradation; c) sustainable poverty and stable resources; and d)
sustainable development and limited resources degradation

PD 577/10 Rev.1 (F)
89
Annex 2.5 Predicted distribution for elephant in 2030 under different land-use change scenarios: a)
low economic decline and localized resource degradation; b) unsustainable development
and serious resource degradation; c) sustainable poverty and stable resources; and d)
sustainable development and limited resources degradation

PD 577/10 Rev.1 (F)
90
Annex 2.6 Predicted distribution for Sarus crane in 2030 under different land-use change scenarios:
a) low economic decline and localized resource degradation; b) unsustainable
development and serious resource degradation; c) sustainable poverty and stable
resources; and d) sustainable development and limited resources degradation

PD 577/10 Rev.1 (F)
91
Annex 2.7 Predicted distribution for Lesser adjutant stork in 2030 under different land-use change
scenarios: a) low economic decline and localized resource degradation; b) unsustainable
development and serious resource degradation; c) sustainable poverty and stable
resources; and d) sustainable development and limited resources degradation

PD 577/10 Rev.1 (F)
92
Annex 2.8 Predicted distribution for barking deer in 2030 under different land-use change scenarios:
a) low economic decline and localized resource degradation; b) unsustainable
development and serious resource degradation; c) sustainable poverty and stable
resources; and d) sustainable development and limited resources degradation

PD 577/10 Rev.1 (F)
93
Annex 2.9 Predicted distribution for leopard in 2030 under different land-use change scenarios: a)
low economic decline and localized resource degradation; b) unsustainable development
and serious resource degradation; c) sustainable poverty and stable resources; and d)
sustainable development and limited resources degradation

PD 577/10 Rev.1 (F)
94
Annex 2.10 Predicted distribution for tiger in 2030 under different land-use change scenarios: a) low
economic decline and localized resource degradation; b) unsustainable development and
serious resource degradation; c) sustainable poverty and stable resources; and d)
sustainable development and limited resources degradation

PD 577/10 Rev.1 (F)
95
Annex 2.11 Predicted distribution for giant ibis in 2030 under different land-use change scenarios: a)
low economic decline and localized resource degradation; b) unsustainable development
and serious resource degradation; c) sustainable poverty and stable resources; and d)
sustainable development and limited resources degradation

PD 577/10 Rev.1 (F)
96
Annex 2.12 Predicted distribution for wild boar in 2030 under different land-use change scenarios: a)
low economic decline and localized resource degradation; b) unsustainable development
and serious resource degradation; c) sustainable poverty and stable resources; and d)
sustainable development and limited resources degradation

PD 577/10 Rev.1 (F)
97
Annex 2.13 Predicted species richness in 2030 under different land-use change scenarios: a) low
economic decline and localized resource degradation; b) unsustainable development and
serious resource degradation; c) sustainable poverty and stable resources; and d)
sustainable development and limited resources degradation
PD 577/10 Rev.1 (F)
98
ANNEX 3
PREDICTED DISTRIBUTIONS OF SELECTED WILDLIFE
UNDER THE COMBINATION OF CLIMATE AND LAND-USE
CHANGE SCENARIOS

PD 577/10 Rev.1 (F)
99
Annex 3.1 Predicted distribution for gaur in 2030 under the combination of climate and different
land-use change scenarios: a) low economic decline and localized resource degradation;
b) unsustainable development and serious resource degradation; c) sustainable poverty
and stable resources; and d) sustainable development and limited resources degradation

PD 577/10 Rev.1 (F)
100
Annex 3.2 Predicted distribution for banteng in 2030 under the combination of climate and different
land-use change scenarios: a) low economic decline and localized resource degradation;
b) unsustainable development and serious resource degradation; c) sustainable poverty
and stable resources; and d) sustainable development and limited resources degradation

PD 577/10 Rev.1 (F)
101
Annex 3.3 Predicted distribution for Sambar deer in 2030 under the combination of climate and
different land-use change scenarios: a) low economic decline and localized resource
degradation; b) unsustainable development and serious resource degradation; c)
sustainable poverty and stable resources; and d) sustainable development and limited
resources degradation

PD 577/10 Rev.1 (F)
102
Annex 3.4 Predicted distribution for Eld’s deer in 2030 under the combination of climate and
different land-use change scenarios: a) low economic decline and localized resource
degradation; b) unsustainable development and serious resource degradation; c)
sustainable poverty and stable resources; and d) sustainable development and limited
resources degradation

PD 577/10 Rev.1 (F)
103
Annex 3.5 Predicted distribution for elephant in 2030 under the combination of climate and
different land-use change scenarios: a) low economic decline and localized resource
degradation; b) unsustainable development and serious resource degradation; c)
sustainable poverty and stable resources; and d) sustainable development and limited
resources degradation

PD 577/10 Rev.1 (F)
104
Annex 3.6 Predicted distribution for Sarus crane in 2030 under the combination of climate and
different land-use change scenarios: a) low economic decline and localized resource
degradation; b) unsustainable development and serious resource degradation; c)
sustainable poverty and stable resources; and d) sustainable development and limited
resources degradation

PD 577/10 Rev.1 (F)
105
Annex 3.7 Predicted distribution for Lesser adjutant stork in 2030 under the combination of climate
and different land-use change scenarios: a) low economic decline and localized resource
degradation; b) unsustainable development and serious resource degradation; c)
sustainable poverty and stable resources; and d) sustainable development and limited
resources degradation

PD 577/10 Rev.1 (F)
106
Annex 3.8 Predicted distribution for barking deer in 2030 under the combination of climate and
different land-use change scenarios: a) low economic decline and localized resource
degradation; b) unsustainable development and serious resource degradation; c)
sustainable poverty and stable resources; and d) sustainable development and limited
resources degradation

PD 577/10 Rev.1 (F)
107
Annex 3.9 Predicted distribution for leopard in 2030 under the combination of climate and different
land-use change scenarios: a) low economic decline and localized resource degradation;
b) unsustainable development and serious resource degradation; c) sustainable poverty
and stable resources; and d) sustainable development and limited resources degradation

PD 577/10 Rev.1 (F)
108
Annex 3.10 Predicted distribution for tiger in 2030 under the combination of climate and different
land-use change scenarios: a) low economic decline and localized resource degradation;
b) unsustainable development and serious resource degradation; c) sustainable poverty
and stable resources; and d) sustainable development and limited resources degradation

PD 577/10 Rev.1 (F)
109
Annex 3.11 Predicted distribution for giant ibis in 2030 under the combination of climate and
different land-use change scenarios: a) low economic decline and localized resource
degradation; b) unsustainable development and serious resource degradation; c)
sustainable poverty and stable resources; and d) sustainable development and limited
resources degradation

PD 577/10 Rev.1 (F)
110
Annex 3.12 Predicted distribution for wild boar in 2030 under the combination of climate and
different land-use change scenarios: a) low economic decline and localized resource
degradation; b) unsustainable development and serious resource degradation; c)
sustainable poverty and stable resources; and d) sustainable development and limited
resources degradation

PD 577/10 Rev.1 (F)
111
Annex 3.13 Predicted species richness in 2030 under the combination of climate and
different land-use change scenarios: a) low economic decline and localized
resource degradation; b) unsustainable development and serious resource
degradation; c) sustainable poverty and stable resources; and d) sustainable
development and limited resources degradation

PD 577/10 Rev.1 (F)
112
Annex 4 List of participants and resource persons attending the 1st GIS Training Session 28-29
November 2013
No Name in Thai Name in English Organization
1 นายธงชัย ศรีสะอาด Mr. Thongchai Srisaart Buntrik Yod Mon
2 นายวุฒิชัย นุสนธิ์ Mr. Wuttichai Nuson Buntrik Yod Mon
3 นางสาวจารุวรรณ ศรีอึ่ง Miss Jaruwan Sriaung Buntrik Yod Mon
4 นายแสงจันทร์ ชาวตระการ Mr. Saengchan Chaotakan Ubon Ratchatani Reg 12, RFD
5 นายสุบรรณ์ แสวงผล Mr. Suban Sawaengphon Ubon Ratchatani Reg 12, RFD
6 นายอุทิศ วิริยะรุ่งโรจนส์กุล Mr. Uthit Viriyarungrojsakul Ubon Ratchatani Reg 12, RFD
7 นางสาวอรทัย ทันวิมา Miss Oorathai Tanwima Phu Jong Na Yoi
8 นางสาวสุพรรณี ฝางค า Miss Supannee Fangkam Phu Jong Na Yoi
9 นางสาวปฏิญญา นิคม Miss Patinya Nikhom Phu Jong Na Yoi
10 นายสมชาย กอมณ ี Mr. Somchai Kurmanee Kaeng Ta Na
11 นายวีระพันธ์ เรือนแก้ว Mr. Weerapan Raunkao Kaeng Ta Na
12 นายวิรัช พันธุ์จันทร์ Mr. Wirat Panchan Kaeng Ta Na
13 นายสกุลทยั จันทร์สุข Mr. Sakulthai Junsook Pha Taem
14 นายไพโรจน์ ผิวอ่อน Mr. Phairot Paew-on Pha Taem
15 นายขอบคุณ ค ามั่น Mr. Khobkhun Khamman Pha Taem
16 นายอนัน จักษุนิล Mr. Anan Jaksunin Yod Dom
17 นายวิชัย ภารุนัย Mr. Wichai Pharunai Yod Dom
18 นายสุภาพ ฦาชา Mr. Suphap Luecha Yod Dom
19 นางสาวเกษราภรณ์ จันทร์จริง Miss Ketsarapon Chunchring Project staff
20 นายเจรญิศักดิ์ ป้องพิมพ์ Mr. Charoensak Pongpim Project staff
21 นายพิทยา ค ามั่น Mr. Phittaya Khamman Project staff
22 นายธีรวัฒน์ ภูมิลาวลัย ์ Mr. Theerawat Phummilawan Project staff
23 นางสาวนลิน ป้องพิมพ์ Miss Narin Pongpim Project staff
24 นางสาวอรฤดี มณีทอง Miss Onruedee Maneethong Protected Area Administration
Region 9
25 นายอัครเดช เดชธิสา Mr. Akaradet Dettisa Protected Area Administration
Region 9
26 นายรัฐพล บุญม ี Mr. Rattapon Bunmee Protected Area Administration
Region 9
27 นางสาวเบญญา ขุนณรงค ์ Miss Benya Khunnarong Kasetsart University
28 นางสาวศศิธร หาสิน Ms. Sasitorn Hasin Kasetsart University
29 นายบารมี สกลรักษ ์ Mr. Baramee Sakolrak Kasetsart University
Names of resource persons
No Name in Thai Name in English Organization
1 ศ.ดร. ยงยุทธ ไตรสรุัตน ์ Prof. Dr. Yongyut Trisurat Kasetsart University
2 ดร. นริศ ภมูิภาคพันธ์ Dr. Naris Bhumpakphan Kasetsart University
3 นายวิชิต จิรมงคลการ Mr. Wichit Jiramongkolgran Protected Area Administration
Region 9
4 นายธานนท์ โสภิตชา Mr. Thanon Sophitcha Protected Area Administration
Region 9
5 นายกมล วิศุภกาญจน ์ Mr. Kamol Wisupakarn ITTO Project Manager

PD 577/10 Rev.1 (F)
113
Annex 5 List of Participants and Trainers Attending the Joint Training Workshop on GIS Modeling for Forest Land Use Planning
No. Name Institution Position Country
1 H.E. Ung Sam Ath Forestry
Administration
Deputy Director
General
Cambodia
2 Mr. Hiroshi Nakata Forestry
Administration
Technical Advisor Japan
3 Mr. Ith Phoumara Preah Vihear
Cantonment, FA
Chief Cambodia
4 Mr. Chheang Dany ITTO-Project Project Manager Cambodia
5 Dr. Dennis Cengel ITTO-Project Project Technical
Advisor
USA
6 Mr. Kim Sobon ITTO-Project Project Site
Manager, Forest land
Use Planning
Specialist
Cambodia
7 Mr. Nhan Bunthan ITTO-Project GIS Mapping
Specialist
Cambodia
8 Ms. Lim Sopheap ITTO-Project Project Admin and
Accountant
Cambodia
9 Mr. Tan Setha Dept. Wildlife and
Biodiversity, FA
Deputy Chief,
Wildlife and
Biodiversity office
Cambodia
10 Mr. Pang Phanit ITTO-Project Forest and
Biodiversity
Conservation Officer
Cambodia
11 Mr. Say Sinly ITTO-Project Field Assistant for
Forest Land Use
Planning
Cambodia
12 Mr. Noun Sokhom Preah Vihear
Cantonment, FA
Deputy Chief, Cambodia
13 Mr. Mak Panha Preah Vihear
Cantonment, FA
Chief, Choam Ksan
Division
Cambodia
14 Mr. Vong Viseth Preah Vihear
Cantonment, FA
Deputy Chief, Chheb
Division
Cambodia
15 Mr. Lonh Ponnarith Preah Vihear
Cantonment, FA
Deputy Chief,
Rovieng Division
Cambodia
16 Mr. Sum Sovutha Preah Vihear
Cantonment, FA
Deputy Chief,
Rovieng Division
Cambodia
17 Mr. Hang Samrith Preah Vihear
Cantonment, FA
Chief, Kantort
Triage
Cambodia

PD 577/10 Rev.1 (F)
114
18 Mr. Chey Setha Preah Vihear
Cantonment, FA
Staff Cambodia
19 Mr. Yim Bunthet Preah Vihear
Cantonment, FA
Staff Cambodia
20 Mr. Houch Sreann Preah Vihear
Cantonment, FA
Staff Cambodia
21 Mr. An Visal Preah Vihear
Cantonment, FA
Staff Cambodia
22 Mr. Chou Chandararith Pailin Cantonment,
FA
Acting Chief Cambodia
23 Mr. Nop Chhaya Oddar Meanchey
Cantonment, FA
Deputy Chief of
Bantey Ampil
Divisionl
Cambodia
24 Mr. Prum Vibolratanak Preak Leap National
College of
Agriculture
Acting Dean,
Forestry Faculty
Cambodia
25 Mr. Im Saovorith DFA. Samrong Deputy Chief Cambodia
26 Mr. Kim Chantha FA Vice Chief of
Inspectorate
Cambodia
27 Mr. Khlok Siphan Try Pheap Import
Export Co. Ltd.,
Staff Cambodia
28 Mr. Sroy Rama Try Pheap Import
Export Co. Ltd.,
Staff Cambodia
29 Mr. Sok Seila Try Pheap Import
Export Co. Ltd.,
Staff Cambodia
30 Mr. Sok Vutthin MoE Kulen Prumtep
wildlife Sanctuary
Cambodia
31 Mr. Saroeun Sithika Preah Vihear
Cantonment, FA
Staff Cambodia
32 Mr. Chay Reth Preah Vihear
Cantonment, FA
Staff Cambodia
33 Mr. Vilavanh Saphangthong Champasak
University
Vice Dean Lao PDR
34 Mr. Inpeng Duangvongsa Champasak
University
Lecturer Lao PDR
35 Mr. Bounthavy
Vongkhamchanh
Champasak
University
Lecturer Lao PDR
36 Mr. Angkham Bouthdala Champasak
University
Lecturer Lao PDR
37 Mr.Vichitta Soumphonphakdy Champasak Province Chief of Forest
Protection Unit
Lao PDR

PD 577/10 Rev.1 (F)
115
38 Mr.Visouk Tanchanthoun Champasak Province Deputy Head of
Resources
Management Section
Lao PDR
39 Mr. Suchat kalyawongsa Royal Forest
Department
ITTO Project Deputy
Director
Thailand
40 Mr. Sapol Boonsermsook Royal Forest
Department
ITTO-Project
Coordinator
Thailand
41 Mr. Kamol Wisupakan ITTO-Project Project Manager Thailand
42 Prof. Dr. Yongyut Trisurat Faculty of Forestry,
Kasetsart University
ITTO-Project GIS
Consultant
Thailand
43 Dr. Naris Bhumpakphan Faculty of Forestry,
Kasetsart University
ITTO-Project
Wildlife Consultant
Thailand
44 Mr. Wichit Jiramongkhonkan DNP, Regional
Office 9, Ubon
Ratchathanee
Director, Wildlife
Division, DNP
Regional Office 9,
Ubon Ratchathanee
Thailand
45 Mr. Thanon Sopitcha DNP, Regional
Office 9, Ubon
Ratchathanee
Director, National
Park Division, DNP
Regional Office 9,
Ubon Ratchathanee
Thailand
46 Mr. Teerayut Wongpaiseart DNP, Regional
Office 9, Ubon
Ratchathanee
Superintendent,
PhuJong-Nayoi
National Park, Ubon
Ratchathanee
Thailand
47 Mr. Somsak Khonthon DNP, Regional
Office 9, Ubon
Ratchathanee
Superintendent,
Bunthrik-Yodmon
Wildlife Sanctuary,
Ubon Ratchathanee
Thailand
48 Mr.Thaned Buakaeo RFD ITTO-Project Staff Thailand
49 Mr. Pramote Ratree DNP, Regional
Office 9, Ubon
Ratchathanee
Superintendent, Yod
Dome Widlife
Sanctuary, Ubon
Ratchathanee
Thailand
50 Mr. Utai Dachyosdee Kasetsart University Staff Thailand

PD 577/10 Rev.1 (F)
116
Annex 6 List if Participants attending GIS - Wildlife Distribution Modeling Joint Training Workshop
No Name Institution Title Country
1 Mr. Suchat
Kalyawongsa
Royal Forest
Department
Director,
International
Cooperation Office
Thailand
2 Ms. Rabieb Seigongpan Royal Forest
Department
ITTO-Project
Coordinator Staff
Thailand
3 Mr. Krischana Nissa Royal Forest
Department
ITTO-Project Staff Thailand
4 Mr. Kampanat Dokmai Royal Forest
Department
ITTO-Project Staff Thailand
5 Mr. Thanakorn
Keeratiphakhawat
Royal Forest
Department
Assistance Project
Coordinator
Thailand
6 Mr. Thaned Boukaeo Royal Forest
Department
ITTO-Project Staff Thailand
7 Mr. Kamol Wisupakan ITTO-Project Project Manager Thailand
8 Ms. Niranrat
Pom-im
Royal Forest
Department
Thailand
9 Ms.Varangkhana
Tophila
ITTO-Project Project Support Staff Thailand
10 Mr. Wichit
Jiramongkhonkan
DNP, Regional
Office 9, Ubon
Ratchathanee
Director, Wildlife
Division,
Thailand
11 Mr. Thanon Sopitcha DNP, Regional
Office 9, Ubon
Ratchathanee
Director, National
Park Division,
Thailand
12 Mr. Teerayut
Wongpaiseart
DNP, Regional
Office 9, Ubon
Ratchathanee
Superintendent,
PhuJong-Nayoi
National Park,
Thailand
13 Mr. Somsak Khonthon DNP, Regional
Office 9, Ubon
Ratchathanee
Superintendent,
Bunthrik-Yodmon
Wildlife Sanctuary,
Thailand
14 Mr. Pramote Ratree DNP, Regional
Office 9, Ubon
Ratchathanee
Superintendent, Yod
Dome Widlife
Sanctuary,
Thailand
15 Mr. Nakarin Suthatto DNP, Regional
Office 9, Ubon
Ratchathanee
Superintendent, Pha
Taem National Park,
Thailand
16 Mr. Verachai Kamlung-
ngam
DNP, Regional
Office 9, Ubon
Ratchathanee
Superintendent,
Kang Tana National
Park,
Thailand
17 Prof. Dr. Yongyut
Trisurat
Faculty of Forestry,
Kasetsart University
Project GIS
Consultant
Thailand
18 Assoc. Prof. Dr. Naris
Bhumpakphan
Faculty of Forestry,
Kasetsart University
Project Wildlife
Consultant
Thailand
19 Dr. Phonesavanh
Thepphasoulithone
Champasak
University
Vice President,
Champasack
University
Lao PDR
20 Mr. Inpeng
Duangvongsa
Champasack
University
Lecturer Lao PDR
21 Mr. Bounthavy
Vongkhamchanh
Champasack
University
Lecturer Lao PDR
22 Mr. Angkham Champasack Lecturer Lao PDR

PD 577/10 Rev.1 (F)
117
No Name Institution Title Country
Bouthdala University
Champasack
University
Lecturer Lao PDR
23 Mr. Noun Sokhom Preah Vihear
Cantonment, FA
Deputy Chief, Cambodia
24 Mr. Mak Panha Preah Vihear
Cantonment, FA
Chief, Choam Ksan
Division
Cambodia
25 Mr. Hang Samrith Preah Vihear
Cantonment, FA
Chief, Rovieng
Division
Cambodia
26 Mr. Sum Sovatha Preah Vihear
Cantonment, FA
Deputy Chief,
Rovieng Division
Cambodia
27 Mr. Vong Viseth Preah Vihear
Cantonment, FA
Deputy Chief, Chheb
Division
Cambodia
28 Mr. Lonh Ponnarith Preah Vihear
Cantonment, FA
Deputy Chief, Tbeng
Meanchay Division
Cambodia
29 Mr. Yim Bunthet Preah Vihear
Cantonment, FA
Deputy Chief,
Rovieng Triage
Cambodia
30 Mr. Houch Sreann Preah Vihear
Cantonment, FA
Staff Cambodia
31 Mr. Chheang Dany ITTO-Project Project Manager Cambodia
32 Dr. Dennis J. Cengel ITTO-Project Project Technical
Advisor
USA
33 Ms. Lim Sopheap ITTO-Project Project Admin and
Accountant
Cambodia
34 Mr. Kim Sobon ITTO-Project Project Site
Manager, Forest land
Use Planning
Specialist
Cambodia
35 Mr. Pang Phanit ITTO-Project Forest and
Biodiversity
Conservation Officer
Cambodia
36 Mr. Say Sinly ITTO-Project Field Assistant for
Forest Land Use
Planning
Cambodia
37 Mr. Pheng Sophak ITTO-Project Community
Livelihood
Development Officer
Cambodia
38 Mr. Chou Chandararith Pailin Cantonment,
FA
Acting Deputy Chief Cambodia
39 Mr. Nop Chhaya Oddar Meanchey
Cantonment, FA
Deputy Chief of
Bantey Ampil
Divisionl
Cambodia
40 Mr. Im Saovorith Oddar Meanchey
Cantonment, FA
Deputy Chief,
Samrong Division
Cambodia
41 Mr. You Viy Svay Reang
Cantonment, FA
Chief, Svay Reang
Division
Cambodia

PD 577/10 Rev.1 (F)
118
Box 1 Some photos showing the 1st GIS training activities
Registration Lecture by Mr. Wichit Jiramongkolgran
Lectured by Prof. Dr. Yongyut Trisurat Group exercise
Field check Field check
Awarding training certificate Group photo

PD 577/10 Rev.1 (F)
119
Box 2 Some photos showing the 2nd GIS training activities
Opening session Group photo in front of training venue
Lectured by Prof. Dr. Yongyut Trisurat Group exercise
Presentation of group work Group work

PD 577/10 Rev.1 (F)
120
Box 3 Some photos showing training activities (GIS training III)
Opening session Group photo
Lectured by Prof. Dr. Yongyut Trisurat Group exercise
Awarding certificate of participation Field excursion at Pha Taem National Park

PD 577/10 Rev.1 (F)
121
Bibliography
ADB. 1998. Sub-regional Environmental Monitoring and Information System: Final Report
Prepared by the Roche International.
Anderson, R. P., Lew, D. and Peterson, A. T. 2003. Evaluating predictive models of species’
distributions: criteria for selecting optimal models. Ecological Modeling 162: 211-232.
Atkinson, P., and Massari, I. 1998. Generalized linear modeling of landslide susceptibility in
the Central Apennines, Italy, Computers & Geosciences 24: 373–385
Baker, W.L. 1989. A review of models of landscape changes. Landscape Ecology 2(2): 111-
133.
Ballestores, F.Jr. and Z. Qiu. 2012. An integrated parcel-based land use change model using
cellular automata and decision tree. Proceedings of the International Academy of
Ecology and Environmental Sciences 2(2):53-69.
Beazley, K., and Cardinal, N. 2004. A systematic approach for selecting focal species for
conservation in the forests of Nova Scotia and Maine. Environmental Conservation 31:
91-101.
Bhumpakphan, N. in press. Wildlife Resources Report: Final Technical Report. Management
of the Emerald Triangle Protected Forest Complex to Promote Cooperation for Trans-
boundary Biodiversity Conservation between Thailand, Cambodia and Laos (Phase III).
Faculty of Forestry, Kasetsart University, Bangkok, Thailand.
Bhumpakphan, N. 2003. Management of the Pha Taem Protected Forest Complex to Promote
Cooperation for Trans-boundary Biodiversity Conservation between Thailand,
Cambodia and Laos (Phase I): Wildlife Ecology Final Report. Faculty of Forestry,
Kasetsart University, Bangkok, Thailand.
Burrough, P.A. 1986. Principles of Geographic Information Systems for Land Resources
Assessment. Clarendon Press, Oxford, UK.
Busby, J. R. (1986). Bioclimate Prediction System (BIOCLIM). User's Manual version 2.0.
Australian Biological Resources, Study Leaflet.
Cambodia Forestry Administration. 2009. The Management Plan of the Preah Vihear
Protected Forest for Plant and Wildlife Genetic Resources Conservation 2010-2014.
Phnom Penh, Cambodia.
Chefaoui, R. M. and Lobo, J. M. 2008. Assessing the effects of pseudo-absences on
predictive distribution model performance. Ecological Modelling 210: 478-486.

PD 577/10 Rev.1 (F)
122
Corlett, R.T. 2012. Climate change in the tropics: the end of the world as we know it?
Biological Conservation 151: 22-25.
Das, I. 2010. A field guide to the reptiles of Thailand & South-east Asia. Asia Books, Co.,
Ltd., Bangkok.
Dennis, R. L. H. and Hardy, P. B. 1999. Targeting squares for survey: predicting species
richness and incidence of species for a butterfly atlas. Global Ecology & Biogeography
8 (6): 443-454.
Duckworth, J.W., Salter, R.E. and Khouboline, K. (compilers). 1999. Wildlife in Lao PDR:
1999 Status Report. IUCN-The World Conservation Union/ Wildlife Conservation
Society / Centre for Protection Areas and Watershed Management, Vientiane.
Elith, J., Phillips, S. J., Hastie, T., Dudik, M., Chee, Y. E., and Yates, C. J. 2011. A statistical
explanation of MaxEnt for ecologists. Diversity and Distributions 17: 43-57.
Fahrig, L. 2003. Effects of habitat fragmentation on biodiversity. Annual Review of Ecology
and Systematics 34: 487-515.
Foody, G. 2002. Status of land cover classification of accuracy assessment. Remote Sensing
of Environment 80: 185-201.
Galt, A., Sigaty, T., and Vinton, M. (Eds.). 2000. The World Commission on Protected
Areas, 2nd Southeast Asia Regional Forum, Pakse, Lao PDR: Volume I: Executive
Summary. IUCN, Vientiane.
Gasana, J.K. 2010. Report of a Final Evaluation of the Management of the Emerald Triangle
Protected Forests Complex to Promote Cooperation for Trans-boundary Biodiversity
Conservation between Thailand, Cambodia and Laos (Phase III). International Tropical
Timber Organization, Yokohama, Japan.
Guisan, A., and Zimmermann, N. E. 2000. Predictive habitat distribution models in ecology.
Ecological Modelling 135: 147-186.
van der Heijden, K. 1996. Scenarios: the Art of Strategic Conversation. Wiley Press,
Chichester.
Hastie, T. and Tibshirani, R. 1990. Generalized additive models. Chapman & Hall, London.
Hirzel, A., Hausser, H., Chessel, J. D., and Perrin, N. 2002. Ecological-niche factor analysis:
how to compute habitat-suitability maps without absence data. Ecology 83: 2027-2036.
Hosmer, D.W. and Lemeshow, S. 2000. Applied Logistic Regression. 2nd ed. Wiley,
Chichester and New York.

PD 577/10 Rev.1 (F)
123
Houet, T. and Hubert-Moy, L. 2006. Modelling and projecting land-use and land-cover
changes with a Cellular Automaton in considering landscape trajectories: An
improvement for simulation of plausible future states. EARSeL eProceedings 5(1): 63-
76. http://halshs.archives-ouvertes.fr/halshs-00195847, September 9, 2014.
Hutchinson, M. F. 1995. Interpolating mean rainfall using thin plate smoothing splines.
International Journal of GIS 9: 305-403.
IUCN. 2013. The IUCN Red List of Threatened Species. Version 2014.3. Gland, Switzerland
Available at http://www.iucnredlist.org.
Jensen, J. R. 1996. Introductory Digital Image Processing: A Remote Sensing Perspective
(Second edition). Prentice Hall, Inc., Upper Saddle River, New Jersey, USA.
Jolliffe I, T. 2002. Mathematics. Springer-Verlag, New York.
Kalyawongsa, S. and Hort, S. 2010. A conservation jewel. ITTO Tropical Forest Update
20(2): 20-21.
Kimmins, J. P. 2004. Forest Ecology: A Foundation for Sustainable Forest Management and
Environmental Ethics in Forestry (3rd ed.). Prentice Hall, British Columbia.
Lekagul, B. and McNeely, J. 1977. Mammals of Thailand. Kurusaphra Press, Bangkok.
Lekagul, B. and Round, P. 1991. A Guide of the Birds of Thailand. Saka Karn Bhaet Group,
Bangkok.
Lillesand, T.M., Kiefer, R.W. and Chipman, J.W. 2004. Remote Sensing and Image
Interpretation, 5th ed. Jonh Wiley and Sons, New York.
Liu, C., Berry, P. M., Dawson, T. P., and Pearson, R. G. 2005. Selecting thresholds of
occurrence in the prediction of species distributions. Ecography 28, 385-393.
Loiselle, B. A., Howell, C. A., Graham, C. H., Goerck, J. M., Brooks, T., Smith, K. G. and
Williams, P. H. 2003. Avoiding pitfalls of using species distribution models in
conservation planning. Conservation Biology 17:1591–1600.
MacDonald, G. 2003. Biogeography: Introduction to Space, Time and Life. John Wiley &
Sons, New York.
Marod, D. 2003. Management of the Pha Taem Protected Forest Complex to Promote
Cooperation for Trans-boundary Biodiversity Conservation between Thailand,
Cambodia and Laos (Phase I): Forest Ecology Final Report. Faculty of Forestry,
Kasetsart University, Bangkok, Thailand.
Matthews, R., Gilbert, N., Roach,A., Polhill, J.G. and Gotts, N.M. 2007. Agent-based land-
use models: a review of applications. Landscape Ecology 22(10):1447–1459.

PD 577/10 Rev.1 (F)
124
McGarigal, K. and B. Marks. 1995. FRAGSTATS: Spatial Pattern Analysis Program for
Quantifying Landscape Structure. Gen. Tech. Rep.PNW-GTR-351, Portland, Oregon.
Nabhitabhata, J., and Chan-ard, T. 2005. Thailand Red Data: Mammals, Reptiles and
Amphibians. Office of Natural Resources and Environmental Policy and Planning:
Bangkok.
Neter, J., Wasserman, W., Nachtsheim, C. J. and Kutner, M. H. 1996. Applied Linear
Regression Models (3rd Ed.). Irwin, Chicago.
Office of Environmental Center. 2005. Greater Mekong Subregion Biodiversity Conservation
Corridors Initiative: Strategic Framework and Technical Assessment 2005-2014. Asian
Development Bank, Bangkok.
Patton, D.R. 1992. Wildlife-habitat Relationships in Forested Ecosystems. Timber Press Inc.,
Oregon, USA.
Peterson, A. T. 2001. Predicting species’ geographical distributions based on ecological niche
modeling. Condor 103: 599-605.
Phillips, S. J., Anderson, R. P., and Schapire, R. E. 2006. Maximum entropy modeling of
species geographic distributions. Ecological Modelling 190: 231-259.
Pontius, R., Boersma, W., Castella, J.C., Clarke, K., de Nijs, T., Dietzel, C., Duan, Z.,
Fotsing, E., Goldstein, N., Kok, K., Koomen, E., Lippitt, C., McConnell, W., Mohd
Sood, A., Pijanowski, B., Pithadia, S., Sweeney, S., Trung, T., Veldkamp, A. and
Verburg, P. 2008. Comparing the input, output, and validation maps for several models
of land change. Annals of Regional Science 42:11–37.
Prommakul, P. 2003. Habitat utilization and prey of the tiger (Panthera tigris (Linnaeus)) in
the Eastern Thung Yai Naresuan Wildlife Sanctuary. Unpublished M.S. thesis (in Thai).
Kasetsart University, BangkoK, Thailand.
Purchkoon, N., Teartisup, P., Siriaroonrat, B., Sawasu, W. 2014. Wetland assessment for
carrying capacity of Eastern Sarus Crane by habitat suitability model (HSM) in
Burirum province, Thailand. Zoological Park Organization of Thailand, Bangkok.
Ranst, E.V., Tang, H., Groenemam, R. and Sinthurathat, S. 1996. A pplication of fuzzy logic
to land suitability for rubber production on peninsular Thailand. Geoderma 70: 1-19.
Reed, D. H. 2012. Distribution of clouded leopards, leopards, and tigers across Thailand:
effects of prey, habitat and intraspecific competition. Biotropica 1: 1-8.

PD 577/10 Rev.1 (F)
125
Round, P.D. 1998. Wildlife, Habitats and Priorities for Conservation in Dong Khanthung
Proposed National Biodiversity Conservation Area, Champasak Province, Lao PDR.
Department of Forestry, Lao PDR.
Royal Government of Cambodia. 2000. Interim Poverty Reduction Strategy of Cambodia. Phnom
Penh Cambodia.
Sahunalu, P., Dhanmamomda, P., Jamroenpruksa, M. and Khemnak, C. 1993. Effects of
Reforestation, Abandoned Areas and Natural Forests on Sakaerat Environment. Faculty
of Forestry, Kasetsart University, Bangkok.
SCW. 2006. Atlas of Cambodia: National Poverty and Environment Maps. Save Cambodia
Wildlife, Phnom Penh Cambodia.
Simcharoen, S., Pattanavibool, A., Ullas, K., Nichols, J. D., and Kumar, N. S. 2007. How
many tigers Panthera tigris are there in Huai Kha Khaeng Wildlife Sanctuary,
Thailand? An estimate using photographic capture-recapture sampling. Oryx 41: 447-
453.
Sobon, K., Bunthan, N. and Sinly, S. 2014. Forest Cover Assessment of Preah Vihear
Projected Forest. Forest Administration. Phnom Penh, Cambodia.
Sodhi, N.S., Koh, L.P., Brook, B. W and Ng, P.K.L. 2004. Southeast Asian: an impending
disaster. Trends in Ecology and Evolution 19: 654-660.
Srikosamatara, S. 1984. Ecology of Pileated Gibbons in south-east Thailand, pp. 242-257 in
H. Preuschoft (Ed.). The Lesser Apes: Evolutionary and Behavioural Biology.
Edinburgh. University Press, Edinburgh.
Stoms, D. M. 1992. Effects of habitat map generalization in biodiversity assessment.
Photogrametric Engineering & Remote Sensing 58 (11):1587–1591.
Sukumar, R. 2003. The Living Elephant. Oxford University Press, Oxford.
Tanakajana, N. 2003. Management of the Pha Taem Protected Forest Complex to Promote
Cooperation for Trans-boundary Biodiversity Conservation between Thailand,
Cambodia and Laos (Phase I): socio-economic technical final report. Faculty of
Forestry, Kasetsart University, Bangkok.
Trisurat, Y. 2003a. Defusing the Trans-boundary Minefield. ITTO Tropical Forest Update
13: 10-13.
Trisurat, Y. 2003b. GIS Database Final Technical Report Submitted to the Royal Forest
Department. The Management of Pha Taem Protected Forest Complex to Promote

PD 577/10 Rev.1 (F)
126
Trans-boundary Biodiversity Conservation Between Thailand, Laos and Cambodia.
ITTO/RFD.
Trisurat, Y. 2007. The Emerald Triangle Protected Forests Complex: An opportunity for
regional collaboration on trans-boundary biodiversity conservation in Indochina. In S.
Ali (Ed.). Peace Parks: Trans-boundary Issues and Conflict Resolution, pp. 141-162.
MIT Press, Washington, D.C.
Trisurat, Y. 2010. GIS Database Technical Final Report, The Emerald Triangle Protected
Forests Complex to Promote Trans-boundary Biodiversity Conservation between
Thailand, Cambodia and Laos Project (Phase II), Royal Forest
Department/International Tropical Timber Organization, Bangkok.
Trisurat, Y., Alkemade, R. and P. Verburg. 2010. Projecting land use change and its
consequences for biodiversity in Northern Thailand. Environmental Management 45:
626-639.
Trisurat, Y., Bhumpakphan, N., Kalyawongsa, S., Boonsermsuk, S., Wisupakan, K. and
Dechyosdee, U. 2014. Predicting land-use and land-cover patterns driven by different
scenarios in the Emerald Triangle Protected Forests Complex. Thai Journal of Forestry
33: 56-74.
Trisurat, Y. and P. Duengkae. 2011. Consequences of land use change on bird distribution at
Sakaerat Environmental Research Station. Journal of Ecology and Field Biology 34(2):
203-214.
Turner, M.G., R.H. Gardner and R.V. O’ Neill. 2001. Landscape Ecology: In Theory and
Practice. Springer, New York.
Verburg, P.H. and Overmars, K. 2009. Combining top-down and bottom-up dynamics in land
use modeling: exploring the future of abandoned farmlands in Europe with the Dyna-
CLUE model. Landscape Ecology 24:1167–1181.
Verburg, P.H. and Veldkamp, A. 2004. Projecting land use transitions at forest fringes in the
Philippines at two spatial scales. Landscape Ecology 19(1):77–98.
Wikramanayake, E., Boonratana, R., Rundel, P. and Aggimarangsee, N. 2000. Terrestrial
Ecoregions of the Indo-Pacific: A Conservation Assessment. Island Press, Washington,
D.C.
Wisz, M. S.Hijmans, R. J., Li, J., Peterson, A. T., Graham, C. H., and Guisan, A. 2008.
Effects of sample size on the performance of species distribution models. Diversity and
Distributions 14, 763—773.

Prof. Dr. Yongyut Trisurat
Faculty of Forestry
Kasetsart University
50 Ngamwongwan, Chatuchak
Bangkok 10900, THAILAND
Tel: 662-5790176
Fax: 662-9428107
E-mail: [email protected]
ISBN 978-616-278-215-2
Executing Agency
Royal Forest Department
61 Phaholyothin Road, Chatuchak
Bangkok 10900, THAILAND
Tel: 662-561-4292 Ext 1416
Fax: 662-561-4292 Ext 5673
E-mail: [email protected]
Printing House
Uopen Co., Ltd.
88/137 Moo 6, Soi Khun Pra
Phaholyothin Road, Klong Nueng
Pathum Thani 12120, THAILAND
Tel/Fax: 662-617-6834
E-mail: [email protected]