land-use changes in the temperate forest biome: implications for carbon-cycling dave egan emilie...
TRANSCRIPT

Land-use changes in the temperate forest biome:
Implications for carbon-cycling
Dave Egan
Emilie Grossmann
Jeanine Rhemtulla

Temperate Forests:Small in area but important biologically & politically
• Smallest forest biome• Lowest carbon content of all forest biomes• Longest history of intensive land-use• The missing sink?• Politically powerful

Small in areaSmall amount of stored carbon
(Dixon et al 1994)

Longest history of intensive land-use
• Much longer history of intensive land-use than either the tropics or boreal biomes
• Remaining old-growth:– < 1% Europe
– 2-3% Australia (temperate eucalypt forests)
– ~ 25% New Zealand
– 3 – 5 % United States(Norton 1996 & WWF 1997)

Land-use II
• China: Temperate forests are known primarily from the fossil record – most forest was cleared for intensive agriculture 4000 years ago.
• Eastern United States: Clearing for timber and agriculture started in 1750’s and swept westward thereafter.
Land Clearing in Harvard Forest, Fisher Museum Dioramas

The missing sink?
Figure credit: Woods Hole Research Center

Figure credit: Woods Hole Research Center
Missing sink II
• Forests are generally increasing in area throughout the temperate biome:– Forest aggradation in eastern U.S.– Forest restoration in China– Plantations in New Zealand
• “the coterminous United States, Europe, China, and small Eurasian countries contained one-third of the [northern hemisphere’s] forest and woodland area, but accounted for at least 80% of the observed C-sink. This disproportionate sink in temperate regions relative to boreal regions likely reflects the temperate zone’s legacy of large-scale land-use management and change over the last century, and fire-suppression policies in recent decades.” (Goodale et al. 2002)

Politically powerful
• The G8 nations (with the exception of Canada and Russia) contain primarily temperate forest.
• Much of the world’s political and financial power resides in these nations.
• Is there a policy bias that favours nations of the temperate biome?

Types of temperate forest biome
• Two major types:– Broadleaf deciduous forest– Evergreen forest

Broadleaf deciduous forest
• Most temperate forests are deciduous
• These forests occur in:– Eastern United States & adjacent Canada– Western & Central Europe– Eastern Asia, including Korea, Japan, parts
of China and Russia
Hopkins Memorial Forest, Williamstown, MA

Coniferous and broadleaf evergreen temperate forest
• Mixed evergreen forests are a much smaller component of the temperate forest biome
• They are found primarily in western North America, Chile, New Zealand, and Australia

Working definitions of “temperate”
• Biological issues:– Ecotone between boreal and temperate forests
• Geographic issues:– Europe often includes Nordic countries– China is not usually split– US & Canada are often lumped
• Consistency issues:– “mid-latitude” (Dixon et al. 1994)
– re-interpreted as “temperate” (Mahli et al. 1999)


Definitions of “forest” and “woodland”
• A forest is defined as “A plant community composed of trees the crowns of which touch, forming a continuous canopy.”
• A woodland is defined as “A plant community that includes widely spaced, mature trees the crowns of which do not touch and generally have a canopy closure of 40 percent or less.”
(The Concise Oxford Dictionary of Ecology, 1996)

Temperate Forest Area
0
50
100
150
200
250
300
350
400
450
US China NewZealand
Europe Australia Other
Are
a (1
06 h
a)
Data from Dixon et al.(1994), Goodale et al. (2002), & Fang et al. (2001)

Carbon storage in the temperate biome: State of the knowledge
• Complementary approaches:– Global/continental/regional
• Atmospheric studies• Land-use studies• Forest inventory/allometry• Meta-analysis
– Local• Eddy flux• Stand measurements

Continental-scale C storage
Total vegetation
Soils2
15 26 Dixon et al . 1994
15.3 18.9 Goodale et al 2002
17 16 Dixon et al. 1994
5.5 21 Goodale et al 2002
New Zealand 9.4 x 10⁻⁴Tate et al. 2000
9 25 Dixon et al . 1994
9.4 13 Goodale et al 2002
Australia 18 33 Dixon et al . 1994
Other3 4.7 - Goodale et al 2002
Total 52 - 64 81 - 105
Europe
China
Region References
Continental US
C-content (Pg)

Forest area vs C storage

C-flux
RegionC-flux
(Pg/year)References
0.10 - 0.25 Dixon et al. 1994
0.22 Goodale et al. 2002
-0.02 Dixon et al. 1994
0.04 Goodale et al. 2002
0.026 Fang et al. 2001
New Zealand Tate et al. 2000
0.09 - 0.12 Dixon et al. 1994
0.13 Goodale et al. 2002
Australia trace Dixon et al. 1994
Other3 0.04 Goodale et al. 2002
China
Europe
Continental US

Local controls on carbon fixation
• There has been a lot of mechanistic work done at this scale– Patterns seen at larger scales are a composite of
local phenomena– We ultimately manage, and use land at a local
scale

Controls on carbon fixation at a small scale
• Many things limit carbon fixation:– Forest age (Klopatek 2002)
– Water limitations (Irvine et al. 2002)
– Carbon dioxide limitations– Nitrogen limitations (Nadelhoffer et al. 1999)
– Ozone pollution (Ollinger et al. 2002)
– Forest type

(DeLucia et al 1999)
CO2 fertilization hypothesis
• FACE Experiment, Duke Forest
• NPP increased by 25%– (measurements included roots!)
• This study was done on a young, aggrading, temperate deciduous forest.
• This should be considered a maximum response.

Missing pieces: Below-ground
• We understand the general processes that limit soil C storage in undisturbed soil reasonably well.
• We also understand the trends of how land use change influences soil C storage, but need more field measurements.
• Moving to a larger scale requires modeling.
• We also need to synthesize this information with the data we have above-ground.

Modeled SOC
Amundson 2001: Regression derived from Post et al.’s 1982 data

Area Mean soil C MAP MAT C Inputs ResidenceLife zone (1012 m2) content (kg m-2) (mm) (C) (kg m-2 y-1)b time (y)
Boreal forest—moist 4.2 11.6 375 4.5 0.19 61
Boreal forest—wet 6.9 19.3 1250 4.5 0.681 28
Temperate forest—cool 3.4 12.7 2250 9 0.912 14
Temperate forest—warm 8.6 7.1 4250 14.5 0.826 9
Tropical forest—moist 5.3 11.4 2500 23.5 2.491 5
Globed 129.6 10.8 0.585 18.5
aAll data except C inputs are from Table 2 in Post et al (1982). MAP, mean average precipitation. MAT, mean average temperature.bC input data are from Table 1 in Jenkinson et al (1991).dTotal global soil also includes the estimates for cultivated lands and wetlands.
Table 1. Ecosystem-based distribution of global soil C pools and fluxesa
Amundson 2001

Missing pieces: Below-ground
• We understand the general processes that limit soil C storage in undisturbed soil reasonably well.
• We also understand the trends of how land use change influences soil C storage, but need more field measurements.
• Moving to a larger scale requires modeling.
• We also need to synthesize this information with the data we have above-ground.

Land Use Transitions & Soil CFrom Guo &Gifford 2002
agriculture has released 70 Gt of C to the atmosphere

Uncertainty in TransitionsPaul et al. 2002

Pasture to Plantation
This type of transition is common in New Zealand, where Pinus radiata plantations are common.
From Guo &Gifford 2002

Missing pieces: Below-ground
• We understand the general processes that limit soil C storage in undisturbed soil reasonably well.
• We also understand the trends of how land use change influences soil C storage, but need more field measurements.
• Moving to a larger scale requires modeling.
• We also need to synthesize this information with the data we have above-ground.

Scaling back up: Using models
• Models have been used to link our small scale mechanistic understanding of carbon cycling to larger scale patterns.
• Model development needs more work:
“Whether models are parameterized by biome or plant life form (or neither), use single or multiple soil layers, or include N and water limitation will all affect predicted outcomes.” (Jackson et al. 2000)

Soil C models
• Used primarily to scale up, or to feed in to carbon budget models – One such model is the Century Model, a
process-based model of soil nutrient dynamics. (Parton et al. 1994).
– It was created based on agricultural soils

Missing pieces: Below-ground
• We understand the general processes that limit soil C storage in undisturbed soil reasonably well.
• We also understand the trends of how land use change influences soil C storage, but need more field measurements.
• Moving to a larger scale requires modeling.
• We also need to synthesize this information with the data we have above-ground.

Carbon flux over time (from data in Houghton & Hackler 2002)
-300
-200
-100
0
100
200
300
400
500
1850
1860
1870
1880
1890
1900
1910
1920
1930
1940
1950
1960
1970
1980
1990
2000
Year
Car
bo
n F
lux
(Tg
C/y
r)
United States Europe China

Land use trends
• In the U.S., much of the carbon sink is due to changing land uses and subtle management effects, such as reduced fire frequency that leads to woody encroachment (Schimel et al. 2001)
• In Europe, the carbon sink is the result of both land-use changes and increased tree growth due to CO2 fertilization & N-deposition (Schimel et al. 2001)

Land-use trends II• China
– 1949: new social system established, resulting in rapidly increasing population, economic development and, therefore, forest exploitation
– 1970’s to present: Chinese government has implemented several extensive forest restoration projects
(Fang et al. 2001)
4
4.2
4.4
4.6
4.8
5
5.2
1949 1950-62 1973-76 1977-81 1984-88 1989-93 1994-98
To
tal
Fo
rest
C (
Pg
)

Land-use trends III
• New Zealand: – Increased planting of exotic forests (primarily
Pinus radiata) is the biggest land-use change in New Zealand – 84 000 ha in 1996
– Organic C in the surface mineral-soil layers is 17-40% lower under plantation forests than pasture, although this may be offset by C-accumulation in the forest floor
(Tate et al. 2000)

Future carbon trends
• Limitations to the US carbon sink? – How long will it last?
– How much C will it suck out of the atmosphere?
– What policies could limit or enhance the US carbon sink?
• Will agricultural abandonment & forest regrowth create another sink somewhere else? Or not?
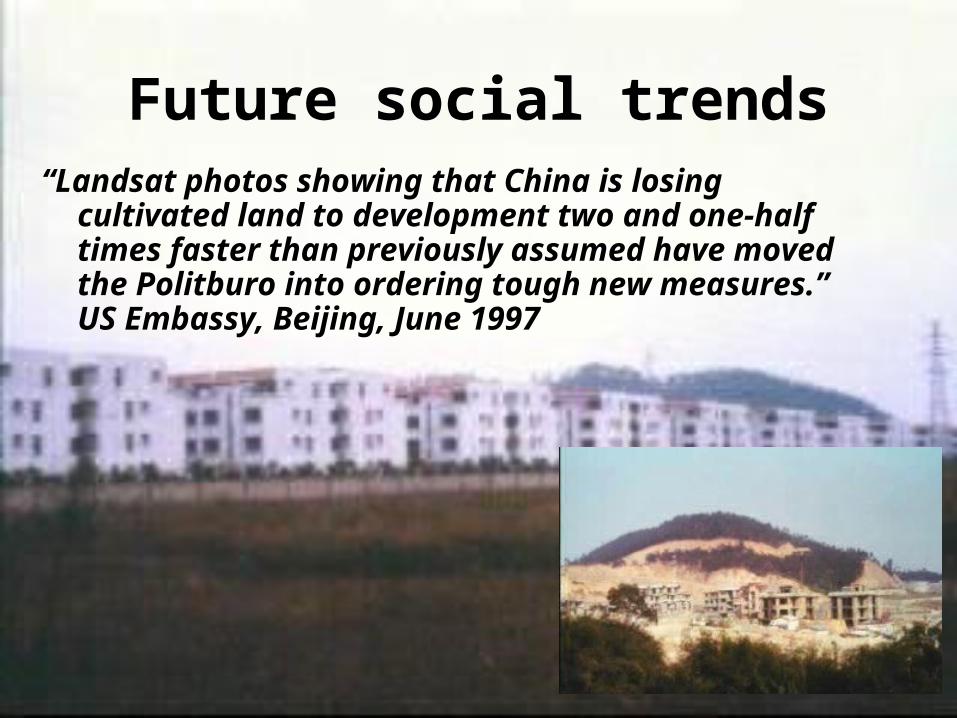
Future social trends“Landsat photos showing that China is losing cultivated
land to development two and one-half times faster than previously assumed have moved the Politburo into ordering tough new measures.” US Embassy, Beijing, June 1997