land use impacts and solutions to sea level...
TRANSCRIPT
Treasure Coastby
Peter MerrittThe Likelihood of Shore Protection, Volume 2.U.S. Environmental Protection AgencyFebruary 2010.
The following document can be cited as:
Merritt, Peter. 2010. “Treasure Coast.” In James G. Titus, Daniel L. Trescott, and Daniel E.Hudgens (editors). The Likelihood of Shore Protection along the Atlantic Coast of the UnitedStates. Volume 2: New England and the Southeast. Report to the U.S. EnvironmentalProtection Agency. Washington, D.C.
The opinions expressed herein are solely those of the authors and do not necessarily represent theofficial opinion of the Environmental Protection Agency.
The primary referring page for this document ishttp://risingsea.net/ERL/FL.html
467
Chapter 7: TREASURE COAST
by
Peter Merritt
468
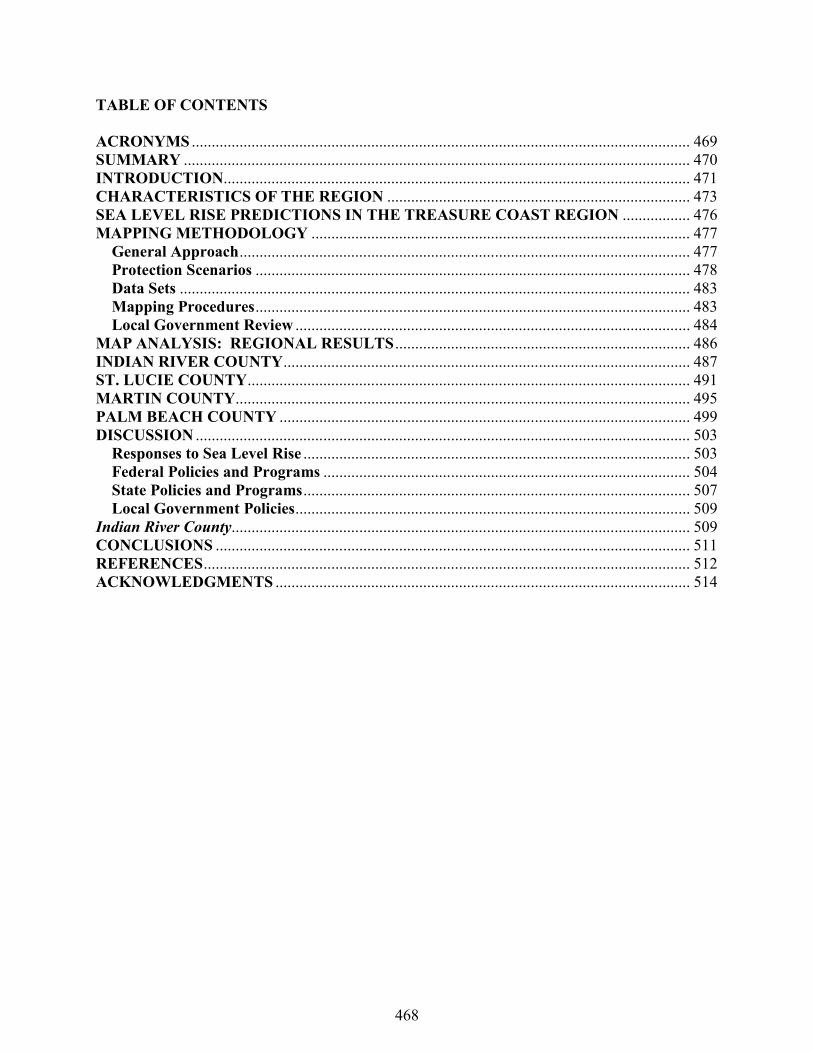
TABLE OF CONTENTS
ACRONYMS ............................................................................................................................. 469SUMMARY ............................................................................................................................... 470INTRODUCTION..................................................................................................................... 471CHARACTERISTICS OF THE REGION ............................................................................ 473SEA LEVEL RISE PREDICTIONS IN THE TREASURE COAST REGION ................. 476MAPPING METHODOLOGY ............................................................................................... 477
General Approach................................................................................................................. 477Protection Scenarios ............................................................................................................. 478Data Sets ................................................................................................................................ 483Mapping Procedures............................................................................................................. 483Local Government Review ................................................................................................... 484
MAP ANALYSIS: REGIONAL RESULTS .......................................................................... 486INDIAN RIVER COUNTY...................................................................................................... 487ST. LUCIE COUNTY............................................................................................................... 491MARTIN COUNTY.................................................................................................................. 495PALM BEACH COUNTY ....................................................................................................... 499DISCUSSION ............................................................................................................................ 503
Responses to Sea Level Rise ................................................................................................. 503Federal Policies and Programs ............................................................................................ 504State Policies and Programs................................................................................................. 507Local Government Policies................................................................................................... 509
Indian River County................................................................................................................... 509CONCLUSIONS ....................................................................................................................... 511REFERENCES.......................................................................................................................... 512ACKNOWLEDGMENTS ........................................................................................................ 514

469
ACRONYMS
BCEP Beach Erosion Control ProgramBEBR Bureau of Economic and Business ResearchCBRA Coastal Barrier Resources ActCBZ Coastal Building ZoneCCCL Coastal Construction Control LineCERP Comprehensive Everglades Restoration PlanCOE U.S. Army Corps of EngineersCZMA Coastal Zone Management ActCZMP Coastal Zone Management ProgramEAR Evaluation and Appraisal ReportEPA U.S. Environmental Protection AgencyESI Environmental Sensitive Index for CoastlinesFAC Florida Administrative CodeFDEP Florida Department of Environmental ProtectionFDOT Florida Department of TransportationFEMA Federal Emergency Management AgencyFLUCCS Florida Land Use, Cover and Forms Classification SystemFLUM Future Land Use MapFMRI Florida Marine Research InstituteFPL Florida Power and LightFS Florida StatutesGIS Geographic Information SystemICW Intracoastal WaterwayIRC Indian River CountyLIDAR Light Detection and RangingMC Martin CountyNFIP National Flood Insurance ProgramNGVD National Geodetic Vertical DatumNOAA National Oceanic and Atmospheric AdministrationPBC Palm Beach CountyRHA Rivers and Harbors ActRPC Regional Planning CouncilSFRPC South Florida Regional Planning CouncilSFWMD South Florida Water Management DistrictSJRWMD St. Johns River Water Management DistrictSLC St. Lucie CountySBMP Strategic Beach Management PlanSWFRPC Southwest Florida Regional Planning CouncilTCRPC Treasure Coast Regional Planning CouncilUSGC United States Geologic SurveyWMD Water Management District

470
SUMMARY
As part of an ongoing program evaluating global climate change, the U.S. EnvironmentalProtection Agency (EPA) initiated a nationwide project promoting planning for and awareness ofsea level rise. In 2000, the EPA issued a grant to the Southwest Florida Regional PlanningCouncil (SWFRPC) to participate in this program and coordinate the study of sea level risethroughout Florida. In 2002, the Treasure Coast Regional Planning Council (TCRPC) enteredinto a contract with SWFRPC to conduct a study of sea level rise within the Treasure CoastRegion.
This report creates maps of the Treasure Coast Region that distinguish the shores that are likelyto be protected from erosion, inundation, and flooding from those where natural shoreline retreatis likely to take place. This report supports the EPA’s national effort encouraging the long-termthinking required to deal with the issues associated with sea level rise. The ultimate goal of thisproject is to diminish losses to life and property from coastal hazards such as erosion andinundation, and to ensure the long-term survival of coastal wetlands.
This study follows the general approach of other sea level rise planning studies sponsored by theEPA. We used decision rules defined by a statewide approach for identifying likelihood of landuse protection to characterize all uplands from 0 to 10 feet in elevation and within 1,000 feet ofshoreline into the following four general categories: shore protection almost certain; shoreprotection likely; shore protection unlikely; and no shore protection. We assigned colors to thesecategories to distinguish the protection scenarios on the draft sea level rise maps prepared foreach county. We then provided the draft maps to local government planners to obtain comments.
Applying the state-wide approach for assessing the likelihood of land use protection in theTreasure Coast Region resulted in the identification of 118,905 acres (83.2 percent) of uplandsand 23,927 acres (16.8 percent) of wetlands in the study area. Regionally, the protection almostcertain category accounted for 65.7 percent of the uplands in the study area. This was followedby protection likely (15.8 percent), protection unlikely (14.0 percent), and no protection (4.4percent). A clear regional trend exists, reflecting an increase in the number of acres in theprotection almost certain category when moving north to south from Indian River County toPalm Beach County. A total of 34 municipalities in the four counties of the Treasure CoastRegion are likely to be impacted by sea level rise in the future.
This report is intended to stimulate local government planners and citizens to think about theproblem of sea level rise. The maps provided in this report depict the expected response to sealevel rise based on the best currently available knowledge. Local planners may decide in thefuture that it will be wise to retreat from lands we currently expect will be protected landsbecause of costs and environmental considerations. This project represents the first step inplanning for sea level rise in the Treasure Coast Region.

471
INTRODUCTION
The earth’s ocean levels have risen and fallen throughout geologic history. Recent measurementsfrom tidal gauges worldwide indicate that ocean levels are currently rising. During the past 100years, the global mean sea level has risen an average of about 7 inches.1 Measurements along theUnited States coast indicate that sea level is rising at a rate of 10 to 12 inches per century.2 Therate of sea level rise, however, is influenced by many factors, making it difficult to predict theexact levels over time. Twilley et al.3 reported that global projections for sea level rise rangefrom 5 to 35 inches over the next 100 years. Clearly, there is concern that sea level may rise at anaccelerated rate in the future.
The prospect of sea level rise is of particular concern to Florida because of its expansivecoastline, low elevations and flat topography , economic dependence of the tourism industry onbeaches and coastal resources, and significant public and private investment in coastal areas. The2004 population estimates indicate that Florida has about 17.5 million residents4 and the majorityof these people live and work near coastal areas. The ramifications of sea level rise in Floridacould be far reaching.5 In areas with a gently sloping shoreline, the horizontal advance of the seacan be 150 to 200 times the vertical rise.6 A rising sea can cause increased erosion, flooding, andraise the frequency and severity of storm surges. Additionally, rising sea levels can contaminatefreshwater supplies by causing saltwater intrusion into river systems, canals, groundwateraquifers, and low-lying coastal wetlands such as the Everglades ecosystem.
As part of an ongoing program evaluating global climate change, the U.S. EnvironmentalProtection Agency (EPA) initiated a nationwide project promoting planning for and awareness ofsea level rise. In 2000, the EPA issued a grant to the Southwest Florida Regional PlanningCouncil (SWFRPC) to participate in this program and coordinate the study of sea level risethroughout Florida. This nationwide project promotes planning for sea level rise by developingmaps that illustrate how communities expect to address the most fundamental question about sealevel rise: Where will we retreat and where will we hold back the sea?
1 Warrick, R.A., C.L. Provost, M.F. Meier, J. Oerlemans, and P.L. Woodworth. 1996. Changes in sea level. Pp. 359-405 In Climate change 1995: The science of climate change. (J.T. Houghton, L.G. Meira Filho, B.A. Callender, N.Harris, A. Kattenberg and K. Maskell, Eds.). Cambridge University Press, London.
2 Titus, J.G. and V.K. Narayanan. 1995. The probability of sea level rise. U.S. Environmental Protection Agency.Office of Policy, Planning, and Evaluation. EPA-230-R-95-008.
3 Twilley, R.R., E.J. Barron, H.L. Gholz, M.A. Harwell, R.L. Miller, D.J. Reed, J.B. Rose, E.H. Siemann, R.G.Wetzel, and R.J. Zimmerman. 2001. Confronting Climate Change in the Gulf Coast Region: Prospects for sustainingour ecological heritage. Union of Concerned Scientists, Cambridge, Massachusetts, and Ecological Society ofAmerica, Washington, D.C.
4 Bureau of Economic and Business Research. 2005. Projections of Florida population by county, 2004 – 2030.University of Florida, Bureau of Economic and Business Research Bulletin No. 141, Volume 38, No.2.
5 Fiedler, J., F. Mays, and J. Siry, Eds. 2001. Feeling the heat in Florida: Glogal warming on the local level. NaturalResources Defense Council and Florida Climate Alliance, New York and Orlando.
6 Leatherman, S.P., K. Zhang, and B.C. Douglas. 2000. Sea level rise shown to drive coastal erosion. EOSTransactions 81: 55-57.
472
The cooperative agreement between the EPA and South Florida Regional Planning Council(SFRPC) represents the first attempt to examine the long-term response to sea level rise throughland use planning in Florida. To comprehensively examine sea level rise issues throughout thestate, the SWFRPC has established agreements between five other RPCs in Florida to assist inthis statewide effort, and intends to coordinate with all of the coastal RPCs when funds becomeavailable. In 2002, the Treasure Coast Regional Planning Council (TCRPC) entered into acontract with SWFRPC to conduct a study of land use impacts and solutions to sea level risewithin the Treasure Coast Region. TCRPC is acting as a subcontractor to SWFRPC incompleting the project. At the same time, SWFRPC entered into an agreement with the SFRPCto conduct a similar project in the South Florida Region. As part of these agreements, SFRPC isresponsible for preparing the GIS maps for the TCRPC portion of the project.
This report creates maps of the Treasure Coast Region that distinguish the shores that are likelyto be protected from erosion, inundation, and flooding from those areas where natural shorelineretreat is likely to take place. This report, along with the sea level rise projects beingimplemented by other Florida RPCs, is designed to support the EPA’s national effortencouraging the long-term thinking required to deal with the issues associated with sea level rise.The ultimate goal of this project and the other projects being conducted elsewhere in Florida andthe Atlantic coastal states from Georgia to Massachusetts is to diminish losses to life andproperty from coastal hazards such as erosion and inundation, and to ensure the long-termsurvival of coastal wetlands.
The sea level rise planning maps provided in this document are intended for general planningpurposes. They do not represent a comprehensive program to address sea level rise, but ratherconstitute a planning baseline that decision makers can use when evaluating land use,infrastructure, wetland permits, and other decisions whose outcomes may be sensitive to futuresea level rise, flooding, and shoreline erosion. The maps are not the result of a cost-benefitanalysis, but rather the best planning judgment of the local and regional authorities responsiblefor land use planning.
Given the broad planning context of this study, an analysis of specific parcels is beyond thescope of this study. The maps are detailed enough, however, to identify the jurisdictions wherefactoring sea level rise into near-term decision making is most important. This report is intendedas a starting point to help local governments engage in a dialogue about sea level rise.Communities in the region should begin to develop goals, strategies, and policies for inclusion inlocal government comprehensive plans. Sea level rise planning issues should become part of thediscussion of all future development proposals in the coastal areas of the region.

473
CHARACTERISTICS OF THE REGION
The Treasure Coast’s four counties are along the southeastern coast of Florida. From north tosouth, the counties are Indian River, St. Lucie, Martin, and Palm Beach. The Atlantic coast andlagoon system is the most prominent physiographic feature of the region. The region hasapproximately 100 miles of Atlantic coast line. Except for the southern part of Palm BeachCounty, the region has a coastal barrier island system. The region’s barrier island coastlineconsists entirely of a sandy beach, approximately 25 percent of which is in public ownership.
Photo 1. View across Lake Worth Lagoon showing the downtown area of the City of West PalmBeach in the distance and Peanut Island in the foreground. The city’s downtown is the most denselydeveloped metropolitan area in the Treasure Coast Region. Peanut Island is home to a Palm BeachCounty Park with newly constructed recreational facilities, restored and created fish and wildlife habitat,Palm Beach Maritime Museum, historic former U.S. Coast Guard Station, and dredged materialmanagement area used by the Florida Inland Navigation District and the Port of Palm Beach. It is likelythat portions of the city will have to take adaptive measures such as constructing larger seawalls to avoidimpacts of sea level rise in future years. Similarly, Palm Beach County may need to implement landelevation and beach nourishment options to protect Peanut Island from rising seas in the future. Bothcases will require extraordinary financial and political commitments within the region.
The Indian River Lagoon lies west of the barrier island from the northern boundary of the region,south to Jupiter Inlet. This estuary is designated as an Estuary of National Significance. LakeWorth Lagoon is a 20-mile-long estuary located centrally along the east coast of Palm BeachCounty.(See Photo 1.) The Indian River and Lake Worth lagoons are connected by the AtlanticIntracoastal Waterway, an inland navigation channel that traverses the east coast of Florida. Theregion's estuaries are important because they contain highly productive natural communities and

474
ecosystems, including seagrass beds, algal beds, oyster beds, exposed sand and shell bottoms,mud flats, tidal marshes, and mangrove swamps. Mangrove communities are the most abundanttype of wetlands, with exposed vegetation bordering the estuaries of the region. Mangrovecommunities provide a nutrient base that is critical in maintaining the region's commercial andsport fish populations. The estuaries are heavily used by recreational boaters and are important tothe marine industries. The estuaries are prime locations for boat facilities, waterfrontdevelopment, and other water-related activities.
Immediately west of the lagoon system is the Atlantic coastal ridge, which parallels the presentmainland edge through the region. During the Pamlico period, approximately 100,000 years ago,the ridge was the dune line when sea level was approximately 30 feet higher than it is today. Incertain areas the sand dunes of the Atlantic coastal ridge reach elevations of greater than 90 feet.The ridge has well-drained sandy soils favored by urban development. Inland, a vast easternvalley occupies much of the interior of the northern three counties. This valley is drained by theSt. John’s, St. Lucie, and Loxahatchee rivers. Much of southern and western Palm Beach Countyis part of the Everglades ecosystem.
The estimated population for the Treasure Coast Region as of April 2004 was more than 1.7million.7 Approximately 71.7 percent of the region’s population is in Palm Beach County. Thepopulation is projected to grow by approximately 59 percent over the next 25 years, especially inthe region’s urbanized coastal communities. Of the region’s four counties and 49 municipalities ,72 percent have jurisdiction over land that is directly adjacent to the Atlantic coast, lagoonsystem, or Intracoastal Waterway. This includes four of the five local governments in IndianRiver County, all four local governments in St. Lucie County, all five local governments inMartin County, and 24 of the 38 local governments in Palm Beach County.
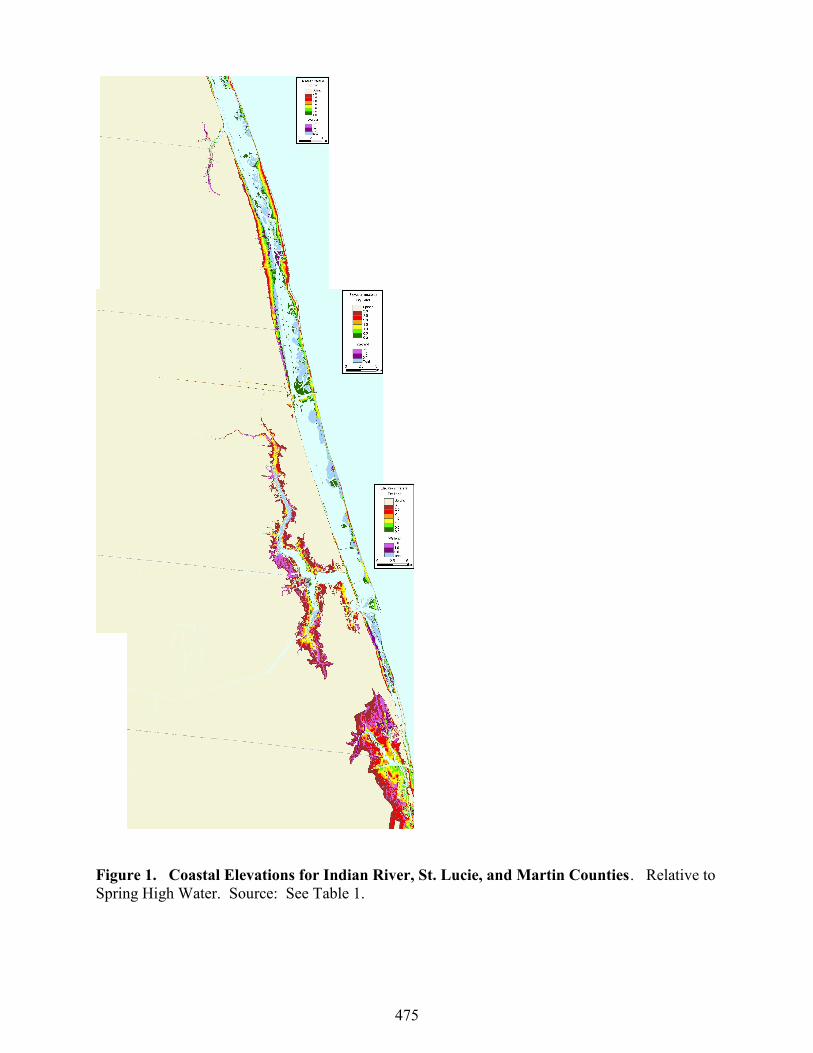
Figure 1 shows the general topography of the three northern Treasure Coast counties within threemeters (about ten feet) above spring high water (the Palm Beach map was unfortunatelygarbled). Table 1 quantifies the same area.
7 Bureau of Economic and Business Research. 2005. Projections of Florida population by county, 2004 – 2030.University of Florida, Bureau of Economic and Business Research Bulletin No. 141, Volume 38, No.2.
475
Figure 1. Coastal Elevations for Indian River, St. Lucie, and Martin Counties. Relative toSpring High Water. Source: See Table 1.
476
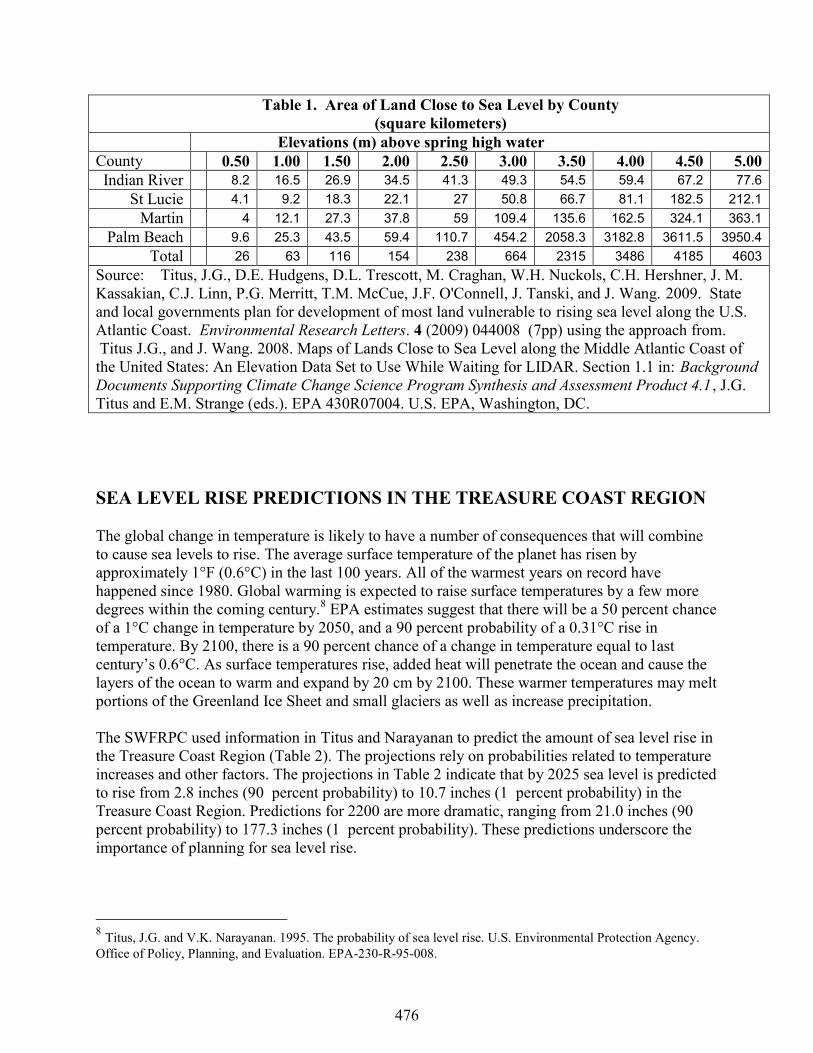
Table 1. Area of Land Close to Sea Level by County(square kilometers)
Elevations (m) above spring high waterCounty 0.50 1.00 1.50 2.00 2.50 3.00 3.50 4.00 4.50 5.00Indian River 8.2 16.5 26.9 34.5 41.3 49.3 54.5 59.4 67.2 77.6
St Lucie 4.1 9.2 18.3 22.1 27 50.8 66.7 81.1 182.5 212.1Martin 4 12.1 27.3 37.8 59 109.4 135.6 162.5 324.1 363.1
Palm Beach 9.6 25.3 43.5 59.4 110.7 454.2 2058.3 3182.8 3611.5 3950.4Total 26 63 116 154 238 664 2315 3486 4185 4603
Source: Titus, J.G., D.E. Hudgens, D.L. Trescott, M. Craghan, W.H. Nuckols, C.H. Hershner, J. M.Kassakian, C.J. Linn, P.G. Merritt, T.M. McCue, J.F. O'Connell, J. Tanski, and J. Wang. 2009. Stateand local governments plan for development of most land vulnerable to rising sea level along the U.S.Atlantic Coast. Environmental Research Letters. 4 (2009) 044008 (7pp) using the approach from.Titus J.G., and J. Wang. 2008. Maps of Lands Close to Sea Level along the Middle Atlantic Coast of
the United States: An Elevation Data Set to Use While Waiting for LIDAR. Section 1.1 in: BackgroundDocuments Supporting Climate Change Science Program Synthesis and Assessment Product 4.1, J.G.Titus and E.M. Strange (eds.). EPA 430R07004. U.S. EPA, Washington, DC.
SEA LEVEL RISE PREDICTIONS IN THE TREASURE COAST REGION
The global change in temperature is likely to have a number of consequences that will combineto cause sea levels to rise. The average surface temperature of the planet has risen byapproximately 1°F (0.6°C) in the last 100 years. All of the warmest years on record havehappened since 1980. Global warming is expected to raise surface temperatures by a few moredegrees within the coming century.8 EPA estimates suggest that there will be a 50 percent chanceof a 1°C change in temperature by 2050, and a 90 percent probability of a 0.31°C rise intemperature. By 2100, there is a 90 percent chance of a change in temperature equal to lastcentury’s 0.6°C. As surface temperatures rise, added heat will penetrate the ocean and cause thelayers of the ocean to warm and expand by 20 cm by 2100. These warmer temperatures may meltportions of the Greenland Ice Sheet and small glaciers as well as increase precipitation.
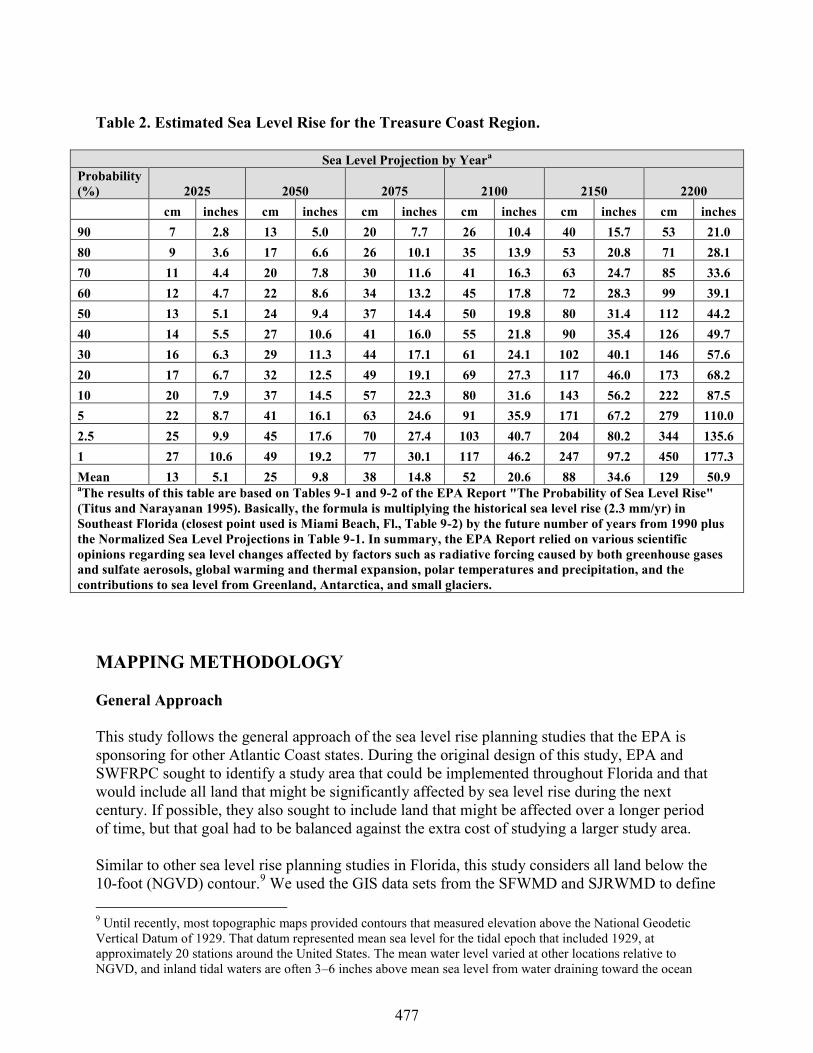
The SWFRPC used information in Titus and Narayanan to predict the amount of sea level rise inthe Treasure Coast Region (Table 2). The projections rely on probabilities related to temperatureincreases and other factors. The projections in Table 2 indicate that by 2025 sea level is predictedto rise from 2.8 inches (90 percent probability) to 10.7 inches (1 percent probability) in theTreasure Coast Region. Predictions for 2200 are more dramatic, ranging from 21.0 inches (90percent probability) to 177.3 inches (1 percent probability). These predictions underscore theimportance of planning for sea level rise.
8 Titus, J.G. and V.K. Narayanan. 1995. The probability of sea level rise. U.S. Environmental Protection Agency.Office of Policy, Planning, and Evaluation. EPA-230-R-95-008.
477
Table 2. Estimated Sea Level Rise for the Treasure Coast Region.
Sea Level Projection by Yeara
Probability(%) 2025 2050 2075 2100 2150 2200
cm inches cm inches cm inches cm inches cm inches cm inches90 7 2.8 13 5.0 20 7.7 26 10.4 40 15.7 53 21.080 9 3.6 17 6.6 26 10.1 35 13.9 53 20.8 71 28.170 11 4.4 20 7.8 30 11.6 41 16.3 63 24.7 85 33.660 12 4.7 22 8.6 34 13.2 45 17.8 72 28.3 99 39.150 13 5.1 24 9.4 37 14.4 50 19.8 80 31.4 112 44.240 14 5.5 27 10.6 41 16.0 55 21.8 90 35.4 126 49.730 16 6.3 29 11.3 44 17.1 61 24.1 102 40.1 146 57.620 17 6.7 32 12.5 49 19.1 69 27.3 117 46.0 173 68.210 20 7.9 37 14.5 57 22.3 80 31.6 143 56.2 222 87.55 22 8.7 41 16.1 63 24.6 91 35.9 171 67.2 279 110.02.5 25 9.9 45 17.6 70 27.4 103 40.7 204 80.2 344 135.61 27 10.6 49 19.2 77 30.1 117 46.2 247 97.2 450 177.3Mean 13 5.1 25 9.8 38 14.8 52 20.6 88 34.6 129 50.9aThe results of this table are based on Tables 9-1 and 9-2 of the EPA Report "The Probability of Sea Level Rise"(Titus and Narayanan 1995). Basically, the formula is multiplying the historical sea level rise (2.3 mm/yr) inSoutheast Florida (closest point used is Miami Beach, Fl., Table 9-2) by the future number of years from 1990 plusthe Normalized Sea Level Projections in Table 9-1. In summary, the EPA Report relied on various scientificopinions regarding sea level changes affected by factors such as radiative forcing caused by both greenhouse gasesand sulfate aerosols, global warming and thermal expansion, polar temperatures and precipitation, and thecontributions to sea level from Greenland, Antarctica, and small glaciers.
MAPPING METHODOLOGY
General Approach
This study follows the general approach of the sea level rise planning studies that the EPA issponsoring for other Atlantic Coast states. During the original design of this study, EPA andSWFRPC sought to identify a study area that could be implemented throughout Florida and thatwould include all land that might be significantly affected by sea level rise during the nextcentury. If possible, they also sought to include land that might be affected over a longer periodof time, but that goal had to be balanced against the extra cost of studying a larger study area.
Similar to other sea level rise planning studies in Florida, this study considers all land below the10-foot (NGVD) contour.9 We used the GIS data sets from the SFWMD and SJRWMD to define
9 Until recently, most topographic maps provided contours that measured elevation above the National GeodeticVertical Datum of 1929. That datum represented mean sea level for the tidal epoch that included 1929, atapproximately 20 stations around the United States. The mean water level varied at other locations relative toNGVD, and inland tidal waters are often 3–6 inches above mean sea level from water draining toward the ocean
478
the study area by identifying all locations that have an elevation of less than 10 feet. Therationale for the 10-foot elevation criterion is that 1) this detail of topographic information can begathered statewide, and 2) tidal influences can extend almost to the 5-foot contour, which meansthe 10-foot contour is approximately the highest elevation that might be inundated by tides if sealevel rises several feet over current levels. Although the land below 5 feet is the most vulnerable,limiting the study area to such low land would exclude many areas that are potentially vulnerableto sea level rise during the next century. Statewide, most of the land between 5 and 10 feet isalready below the base flood elevation for a 100-year storm, and hence will experience greaterflooding as sea level rises. Furthermore, topographic contours are only estimates. Under theNational Mapping Standards, up to 10 percent of the land can be higher or lower than the mapindicates by more than one-quarter of the contour interval. Thus a substantial amount of landdepicted as between 5 and 10 feet may in reality be between 3 and 4 feet; using the 10-footcontour to delineate the study area helps ensure that this very low land is considered.
The study area also includes all land within 1000 feet of the shore, even if it is above the 10-footcontour, for two reasons. First, rising sea level and other coastal processes can cause beaches,dunes, bluffs, and other land to erode even though they may have sufficient elevation to avoiddirect inundation by rising water levels. The 1000-foot extension is somewhat arbitrary; wechose that distance primarily to be consistent with similar studies in other states. Second,extending the study area 1000 feet inland also ensures that the study area is large enough to beseen along the entire shore on the county-scale maps produced by this study.
Protection Scenarios
Creation of the final project maps followed closely the criteria laid out in the statewide approachfor identifying likelihood of land use protection (Table 3). This table represents a summary of theapproaches taken by other states but adapted for use in Florida by SWFRPC and EPA with inputfrom the other regional planning councils. We used this approach to characterize all uplandsfrom 0 to 10 feet in elevation and within 1000 feet of shoreline into the following four generalcategories: Protection almost certain, Protection likely, Protection Unlikely, and No Protection.We assigned colors to these categories to distinguish the protection scenarios on the draft sealevel rise maps prepared for each county. We then gave the draft maps to the local governmentsto obtain any general or site-specific corrections to the maps. The protection scenarios shown onthe maps in this study illustrate the areas that planners within this region expect will beprotected, or not protected, from erosion and inundation in the
through these rivers and bays. Because sea level has been rising, mean sea level is above NGVD29 almosteverywhere along the U.S. Atlantic Coast

479
Table 3. State-wide approach for identifying likelihood of land use protection.
Likelihood ofProtection2 Land Use Category1 Source Used to Identify Land Area
Protectionalmost certain(brown)
Existing developed land (FLUCCS Level 1-100 Urbanand Built-up) within extensively developed areasand/or designated growth areas.
Developed lands identified from watermanagement districts (WMDs) existingFlorida Land Use, Cover and FormsClassification System (FLUCCS) asdefined by Florida Department ofTransportation Handbook (January1999); growth areas identified fromplanner input and local comprehensiveplans.
Future development within extensively developed areasand/or designated growth areas(residential/office/commercial/industrial).
Generalized future land use maps fromlocal comprehensive plans, local plannerinput, and WMDs.
Extensively used parks operated for purposes other thanconservation and have current protection 3 or aresurrounded by brown colored land uses.
County-owned, state-owned, andfederally owned lands (based on localknowledge) or lands defined as 180Recreational on the Level 1 FLUCCS,local planner input, and Florida MarineResearch Info System (FMRIS) forcurrent protection measures.
Mobile home developments outside of coastal highhazard,4 expected to gentrify, or connected to centralsewer and water.
Local planner input and current regionalhurricane evacuation studies.
Protectionlikely (red)
Existing development within less densely developedareas, outside of growth areas.
Developed lands identified from WMDexisting FLUCCS; growth areasidentified from local planner input, localcomprehensive plans, and currentregional hurricane evacuation studies.
Mobile home development within a coastal high hazardarea that is neither anticipated to gentrify nor on centralwater and sewer.
Local comprehensive plans and currentregional hurricane evacuation studies.
Projected future development outside of growth areascould be estate land use on future land use map.
Local planner input
Moderately used parks operated for purposes other thanconservation and have no current protection or aresurrounded by red colored land uses.
County-owned, state-owned, andfederally owned lands (based on localknowledge) or lands defined as 180Recreational on the Level 1 FLUCCS,local planner input, and FMRIS.
Coastal areas that are extensively developed but areineligible for beach nourishment funding due to CBRA(or possibly private beaches unless case can be madethat they will convert to public)
Flood Insurance Rate Maps for CBRA,local knowledge for beach nourishment.
Undeveloped areas where most of the land will bedeveloped, but a park or refuge is also planned, and theboundaries have not yet been defined so we are unableto designate which areas are brown and which aregreen; so red is a compromise between.
Local planner input
Agricultural areas where development is not expected,but where there is a history of erecting shore protectionstructures to protect farmland.
Local planner input
Dredge spoil areas likely to continue to receive spoilsor be developed, and hence unlikely to convert to tidalwetland as sea level rises
Local planner input
Military lands in areas where protection is not certain. FLUCCS Level 173

480
Likelihood ofProtection2 Land Use Category1 Source Used to Identify Land Area
Protectionunlikely (blue)
Undeveloped privately owned lands that are in areasexpected to remain sparsely developed (i.e., not in adesignated growth area and not expected to bedeveloped) and there is no history of erecting shoreprotection structures to protect farms and forests.
Undeveloped lands identified fromWMD existing FLUCCS Level 1- 160mining, 200 Agriculture, 300 Rangeland,400 Upland Forest, 700 barren land ;Nongrowth areas identified from plannerinput, local comprehensive plans, FloodInsurance Rate Maps for CBRA, andcurrent regional hurricane evacuationstudies.
Unbridged barrier island and CBRA areas or within acoastal high hazard area that are not likely to becomedeveloped enough to justify private beach nourishment.
Flood Insurance Rate Maps for CBRA,local knowledge for beach nourishment,and local planner input.
Minimally used parks operated partly for conservation,have no current protection or are surrounded by bluecolored land uses, but for which we can articulate areason for expecting that the shore might be protected.
County-owned, state-owned, andfederally owned lands (based on localknowledge) or lands defined as preserveon future land use map, local plannerinput, and FMRIS.
Undeveloped areas where most of the land will be partof a wildlife reserve, but where some of it will probablybe developed; and the boundaries have not yet beendefined so we are unable to designate which areas arebrown and which are green; so blue is a compromisebetween red and green.
Local planner input
Dredge spoil areas unlikely to continue to receivespoils or be developed, and hence likely to convert totidal wetland as sea level rises
Local planner input
Conservation easements (unless they preclude shoreprotection)
Local planner input
No protection(light green)
Private lands owned by conservation groups (when dataavailable)
Private conservation lands
Conservation easements that preclude shore protection Local planner inputWildlife refuges, portions of parks operated forconservation by agencies with a policy preference forallowing natural processes (e.g. National Park Service)
Local planner input
Publicly owned natural lands or parks with little or noprospect for access for public use.
County-owned, state-owned, andfederally owned lands (based on localknowledge) defined as preserve on thefuture land use map and local plannerinput.
Notes:1. These generalized land use categories describe typical decisions applied in the county studies. County-specificdifferences in these decisions and site-specific departures from this approach are discussed in the county-specificsections of this report.2. Colored line file should be used in areas where less than 10 feet elevations exist within 1,000 feet of the rising seaor color cannot be seen on ledger paper map.3. Current protection may include sea walls, rock revetments, beach renourishment, levees, spreader swales, or dikes.4. Coastal High Hazard Area defined in Rule 9J-5 FAC as the Category 1 hurricane evacuation zone and/or stormsurge zone.
481
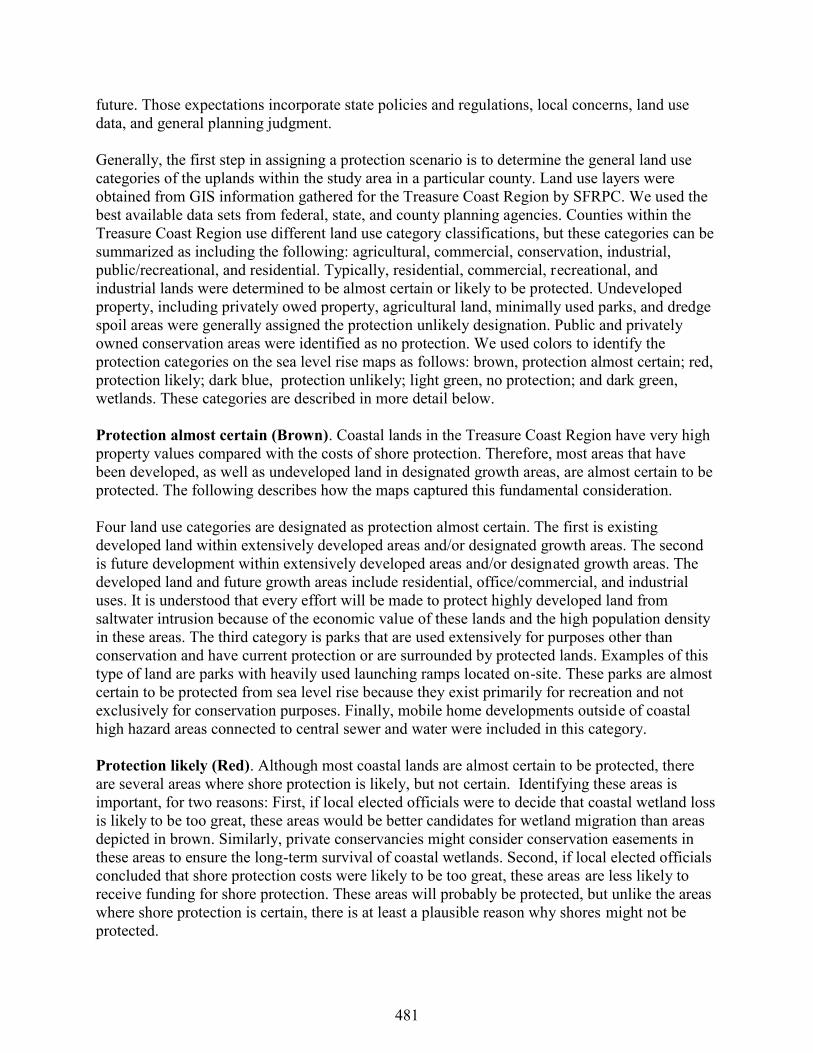
future. Those expectations incorporate state policies and regulations, local concerns, land usedata, and general planning judgment.
Generally, the first step in assigning a protection scenario is to determine the general land usecategories of the uplands within the study area in a particular county. Land use layers wereobtained from GIS information gathered for the Treasure Coast Region by SFRPC. We used thebest available data sets from federal, state, and county planning agencies. Counties within theTreasure Coast Region use different land use category classifications, but these categories can besummarized as including the following: agricultural, commercial, conservation, industrial,public/recreational, and residential. Typically, residential, commercial, recreational, andindustrial lands were determined to be almost certain or likely to be protected. Undevelopedproperty, including privately owed property, agricultural land, minimally used parks, and dredgespoil areas were generally assigned the protection unlikely designation. Public and privatelyowned conservation areas were identified as no protection. We used colors to identify theprotection categories on the sea level rise maps as follows: brown, protection almost certain; red,protection likely; dark blue, protection unlikely; light green, no protection; and dark green,wetlands. These categories are described in more detail below.
Protection almost certain (Brown). Coastal lands in the Treasure Coast Region have very highproperty values compared with the costs of shore protection. Therefore, most areas that havebeen developed, as well as undeveloped land in designated growth areas, are almost certain to beprotected. The following describes how the maps captured this fundamental consideration.
Four land use categories are designated as protection almost certain. The first is existingdeveloped land within extensively developed areas and/or designated growth areas. The secondis future development within extensively developed areas and/or designated growth areas. Thedeveloped land and future growth areas include residential, office/commercial, and industrialuses. It is understood that every effort will be made to protect highly developed land fromsaltwater intrusion because of the economic value of these lands and the high population densityin these areas. The third category is parks that are used extensively for purposes other thanconservation and have current protection or are surrounded by protected lands. Examples of thistype of land are parks with heavily used launching ramps located on-site. These parks are almostcertain to be protected from sea level rise because they exist primarily for recreation and notexclusively for conservation purposes. Finally, mobile home developments outside of coastalhigh hazard areas connected to central sewer and water were included in this category.
Protection likely (Red). Although most coastal lands are almost certain to be protected, thereare several areas where shore protection is likely, but not certain. Identifying these areas isimportant, for two reasons: First, if local elected officials were to decide that coastal wetland lossis likely to be too great, these areas would be better candidates for wetland migration than areasdepicted in brown. Similarly, private conservancies might consider conservation easements inthese areas to ensure the long-term survival of coastal wetlands. Second, if local elected officialsconcluded that shore protection costs were likely to be too great, these areas are less likely toreceive funding for shore protection. These areas will probably be protected, but unlike the areaswhere shore protection is certain, there is at least a plausible reason why shores might not beprotected.
482
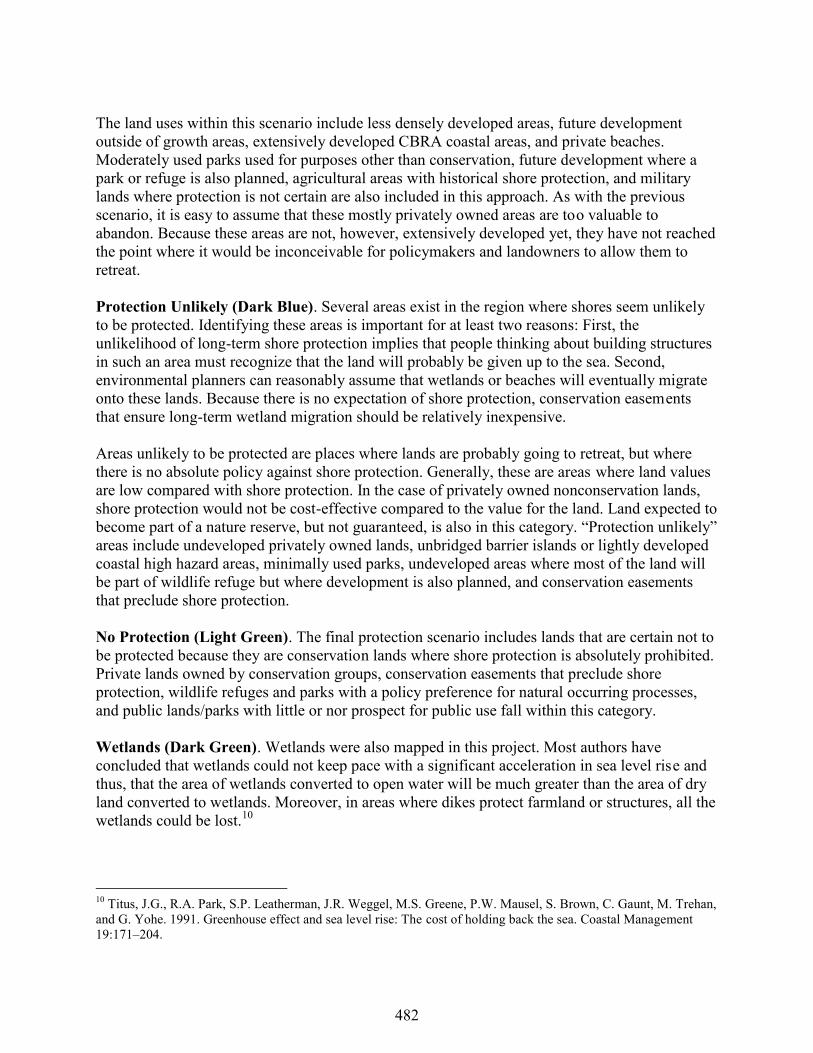
The land uses within this scenario include less densely developed areas, future developmentoutside of growth areas, extensively developed CBRA coastal areas, and private beaches.Moderately used parks used for purposes other than conservation, future development where apark or refuge is also planned, agricultural areas with historical shore protection, and militarylands where protection is not certain are also included in this approach. As with the previousscenario, it is easy to assume that these mostly privately owned areas are too valuable toabandon. Because these areas are not, however, extensively developed yet, they have not reachedthe point where it would be inconceivable for policymakers and landowners to allow them toretreat.
Protection Unlikely (Dark Blue). Several areas exist in the region where shores seem unlikelyto be protected. Identifying these areas is important for at least two reasons: First, theunlikelihood of long-term shore protection implies that people thinking about building structuresin such an area must recognize that the land will probably be given up to the sea. Second,environmental planners can reasonably assume that wetlands or beaches will eventually migrateonto these lands. Because there is no expectation of shore protection, conservation easementsthat ensure long-term wetland migration should be relatively inexpensive.
Areas unlikely to be protected are places where lands are probably going to retreat, but wherethere is no absolute policy against shore protection. Generally, these are areas where land valuesare low compared with shore protection. In the case of privately owned nonconservation lands,shore protection would not be cost-effective compared to the value for the land. Land expected tobecome part of a nature reserve, but not guaranteed, is also in this category. “Protection unlikely”areas include undeveloped privately owned lands, unbridged barrier islands or lightly developedcoastal high hazard areas, minimally used parks, undeveloped areas where most of the land willbe part of wildlife refuge but where development is also planned, and conservation easementsthat preclude shore protection.
No Protection (Light Green). The final protection scenario includes lands that are certain not tobe protected because they are conservation lands where shore protection is absolutely prohibited.Private lands owned by conservation groups, conservation easements that preclude shoreprotection, wildlife refuges and parks with a policy preference for natural occurring processes,and public lands/parks with little or nor prospect for public use fall within this category.
Wetlands (Dark Green). Wetlands were also mapped in this project. Most authors haveconcluded that wetlands could not keep pace with a significant acceleration in sea level rise andthus, that the area of wetlands converted to open water will be much greater than the area of dryland converted to wetlands. Moreover, in areas where dikes protect farmland or structures, all thewetlands could be lost.10
10 Titus, J.G., R.A. Park, S.P. Leatherman, J.R. Weggel, M.S. Greene, P.W. Mausel, S. Brown, C. Gaunt, M. Trehan,and G. Yohe. 1991. Greenhouse effect and sea level rise: The cost of holding back the sea. Coastal Management19:171–204.
483
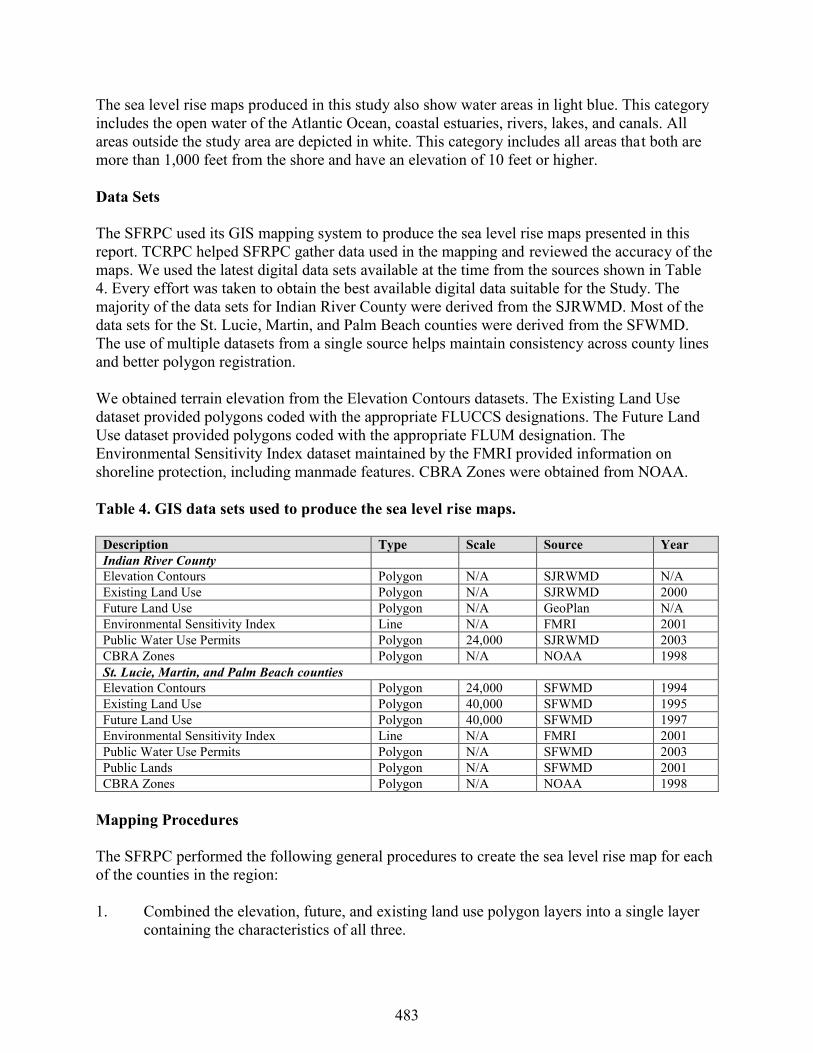
The sea level rise maps produced in this study also show water areas in light blue. This categoryincludes the open water of the Atlantic Ocean, coastal estuaries, rivers, lakes, and canals. Allareas outside the study area are depicted in white. This category includes all areas that both aremore than 1,000 feet from the shore and have an elevation of 10 feet or higher.
Data Sets
The SFRPC used its GIS mapping system to produce the sea level rise maps presented in thisreport. TCRPC helped SFRPC gather data used in the mapping and reviewed the accuracy of themaps. We used the latest digital data sets available at the time from the sources shown in Table4. Every effort was taken to obtain the best available digital data suitable for the Study. Themajority of the data sets for Indian River County were derived from the SJRWMD. Most of thedata sets for the St. Lucie, Martin, and Palm Beach counties were derived from the SFWMD.The use of multiple datasets from a single source helps maintain consistency across county linesand better polygon registration.
We obtained terrain elevation from the Elevation Contours datasets. The Existing Land Usedataset provided polygons coded with the appropriate FLUCCS designations. The Future LandUse dataset provided polygons coded with the appropriate FLUM designation. TheEnvironmental Sensitivity Index dataset maintained by the FMRI provided information onshoreline protection, including manmade features. CBRA Zones were obtained from NOAA.
Table 4. GIS data sets used to produce the sea level rise maps.
Description Type Scale Source YearIndian River CountyElevation Contours Polygon N/A SJRWMD N/AExisting Land Use Polygon N/A SJRWMD 2000Future Land Use Polygon N/A GeoPlan N/AEnvironmental Sensitivity Index Line N/A FMRI 2001Public Water Use Permits Polygon 24,000 SJRWMD 2003CBRA Zones Polygon N/A NOAA 1998St. Lucie, Martin, and Palm Beach countiesElevation Contours Polygon 24,000 SFWMD 1994Existing Land Use Polygon 40,000 SFWMD 1995Future Land Use Polygon 40,000 SFWMD 1997Environmental Sensitivity Index Line N/A FMRI 2001Public Water Use Permits Polygon N/A SFWMD 2003Public Lands Polygon N/A SFWMD 2001CBRA Zones Polygon N/A NOAA 1998
Mapping Procedures
The SFRPC performed the following general procedures to create the sea level rise map for eachof the counties in the region:
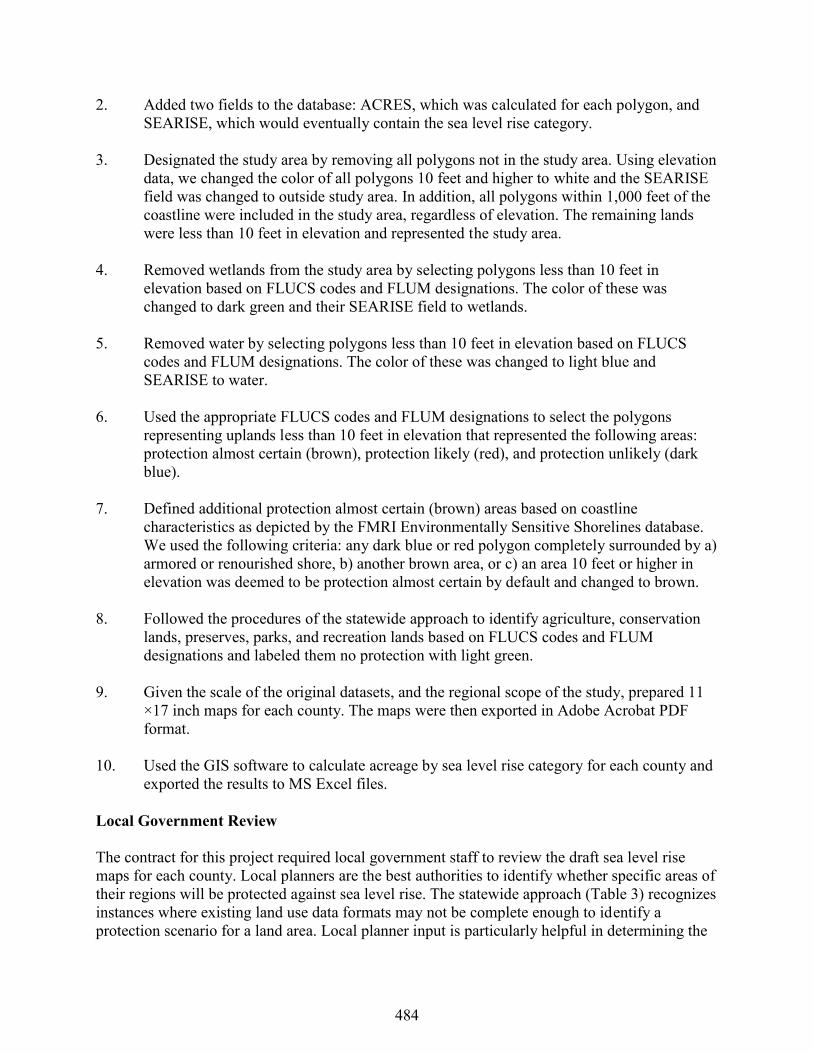
1. Combined the elevation, future, and existing land use polygon layers into a single layercontaining the characteristics of all three.
484
2. Added two fields to the database: ACRES, which was calculated for each polygon, andSEARISE, which would eventually contain the sea level rise category.
3. Designated the study area by removing all polygons not in the study area. Using elevationdata, we changed the color of all polygons 10 feet and higher to white and the SEARISEfield was changed to outside study area. In addition, all polygons within 1,000 feet of thecoastline were included in the study area, regardless of elevation. The remaining landswere less than 10 feet in elevation and represented the study area.
4. Removed wetlands from the study area by selecting polygons less than 10 feet inelevation based on FLUCS codes and FLUM designations. The color of these waschanged to dark green and their SEARISE field to wetlands.
5. Removed water by selecting polygons less than 10 feet in elevation based on FLUCScodes and FLUM designations. The color of these was changed to light blue andSEARISE to water.
6. Used the appropriate FLUCS codes and FLUM designations to select the polygonsrepresenting uplands less than 10 feet in elevation that represented the following areas:protection almost certain (brown), protection likely (red), and protection unlikely (darkblue).
7. Defined additional protection almost certain (brown) areas based on coastlinecharacteristics as depicted by the FMRI Environmentally Sensitive Shorelines database.We used the following criteria: any dark blue or red polygon completely surrounded by a)armored or renourished shore, b) another brown area, or c) an area 10 feet or higher inelevation was deemed to be protection almost certain by default and changed to brown.
8. Followed the procedures of the statewide approach to identify agriculture, conservationlands, preserves, parks, and recreation lands based on FLUCS codes and FLUMdesignations and labeled them no protection with light green.
9. Given the scale of the original datasets, and the regional scope of the study, prepared 11×17 inch maps for each county. The maps were then exported in Adobe Acrobat PDFformat.
10. Used the GIS software to calculate acreage by sea level rise category for each county andexported the results to MS Excel files.
Local Government Review
The contract for this project required local government staff to review the draft sea level risemaps for each county. Local planners are the best authorities to identify whether specific areas oftheir regions will be protected against sea level rise. The statewide approach (Table 3) recognizesinstances where existing land use data formats may not be complete enough to identify aprotection scenario for a land area. Local planner input is particularly helpful in determining the

485
future status of currently undeveloped areas. Whether an undeveloped area outside of a growtharea will be developed in the future is a determinant of the protection status of the locale. Localplanner information is also invaluable in determining whether park areas or conservation landsshould be protected against sea level rise.
TCRPC planning staff first met with the planning staff of the SFRPC on December 6, 2002, todiscuss the data collection, mapping procedures, and analysis of the data. Upon receipt of thefirst round of draft maps for the project, TCRPC performed an internal review of the maps withregional planners on October 13, 2003. Upon receipt of revised maps, TCRPC arranged a seriesof individual meetings to solicit input from local government planners in each of the counties inthe Treasure Coast Region. The first round of meetings took place in November 2003. Councilstaff met with planners in Palm Beach County on November 12, 2003; Martin County onNovember 13, 2003; Indian River County on November 14, 2003; and St. Lucie County onNovember 25, 2003. The planning directors and key county staff members participated inreviewing the draft sea level rise maps.
After the meetings to solicit input from local government planners in 2003, the SWFRPC andEPA modified the mapping procedures for the sea level rise project. This resulted in the creationof a new set of maps for the region. TCRPC received the first draft of the modified maps in2004. After regional review, these maps were revised again in 2005. The latest revisions of thesea level rise maps were received by TCRPC in June 2005. TCRPC staff scheduled a secondround of meetings to get additional input from local government planners. TCRPC staff met withplanners in Martin County on August 31, 2005; St. Lucie County on September 1, 2005; PalmBeach County on September 1, 2005; and Indian River County on September 2, 2005. Localgovernment planners provided comments on the statewide planning approach, draft sea level risemaps, and other coastal management issues. The individual planners that participated in thesemeetings are identified in the Acknowledgments section of this report. Comments from localgovernment planners are summarized in the Map Analysis section of this report.

486
MAP ANALYSIS: REGIONAL RESULTS
Using the statewide approach for assessing the likelihood of land use protection in the TreasureCoast Region, we identified 118,905 acres (83.2 percent) of uplands and 23,927 acres (16.8percent) of wetlands in the study area (Table 5). The study area includes the entire barrier islandsystem throughout the region as well as properties directly adjacent to the lagoons, major riversystems, and the ICW. Regionally, the protection almost certain category accounted for 65.7percent of the uplands in the study area. This was followed by protection likely (15.8 percent),protection unlikely (14.0 percent), and no protection (4.4 percent). A clear regional trend exists,reflecting an increase in the number of acres in the protection almost certain category whenmoving north to south from Indian River County to Palm Beach County.
Table 5. Acres of each sea level rise category in the Treasure Coast Region.
Jurisdiction
ProtectionAlmostCertain(Brown)
ProtectionLikely(Red)
ProtectionUnlikely(Dark Blue)
No Protection(Light Green)
Wetlands(Dark Green)
Indian River County 3,507 6,620 5,581 175 4,896St Lucie County 10,589 5,317 371 1,376 7,556Martin County 12,781 3,475 9,047 3,531 7,474Palm Beach County 51,256 3,404 1,696 179 4,001Regional Total 78,133 18,816 16,695 5,261 23,927
The entire study area has approximately five times the area of dry land as the area of tidalwetlands. Given that the tidal wetlands are generally below 3 feet in elevation and that dry landranges from 3 to 10 feet, sea level rise would cause a net gain of wetlands if the area wasundeveloped, even if wetlands were unable to vertically accrete as sea level rises. The area ofpotential wetland creation (protection unlikely and no protection), however, is only about 91.8percent of the area of existing tidal wetlands. This suggests that a net loss of wetlands is likely.There is, however, substantial regional variation in that assessment. Perhaps more important,whether that loss is modest or near total appears to depend on land use decisions that have notyet been made. Most of the potential for wetland creation lies in lands classified as protectionunlikely rather than no protection.
Throughout the region, the barrier island system and uplands east of the ICW are some of themost vulnerable lands subject to impacts of sea level rise. Yet, these areas have significantinfrastructure resulting from public and private investment and are of local, regional, and stateimportance in terms of tourism, recreation, and marine industries. Given the importance of thebarrier island system, we assume that actions will be taken to protect existing infrastructure andland uses where possible. If sea level continues to rise, a system of bridges and causeways mayneed to be constructed to provide access to development and facilities located on higherelevations. Such a system might be similar to the infrastructure that is already in place in theFlorida Keys. The following sections describe how sea level rise impacts may affect each of thecounties in the region.

487
INDIAN RIVER COUNTY
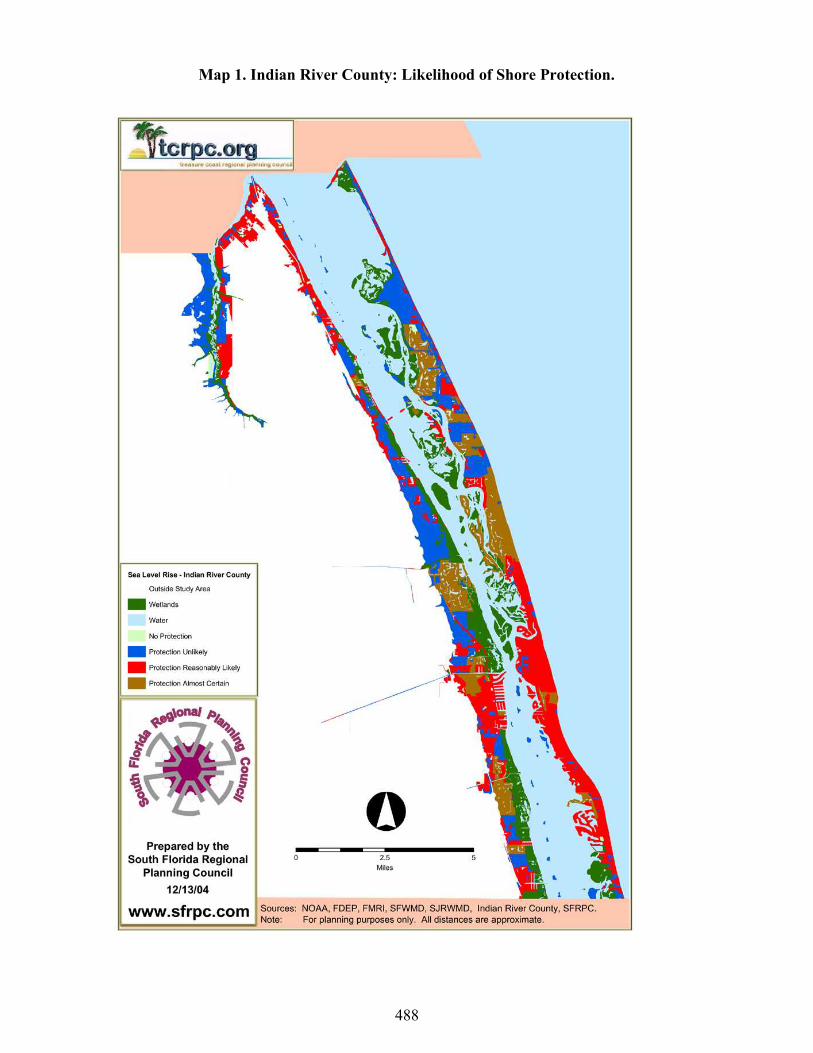
A total of 15,883 acres of uplands and 4,896 acres of wetlands were identified in the IndianRiver County portion of the study area (Map 1). Indian River County is the only county in theregion where the protection almost certain category did not include the largest acreage. However,the combination of the protection almost certain and protection likely categories accounts forabout 63.8 percent of the uplands in the study area in this county.
The upland areas most likely to be affected by sea level rise represent about 4.9 percent of thetotal county area. The main areas of impact are expected on the barrier island, on the shorelinesof the Indian River Lagoon and Sebastian River, and within islands in the lagoon and riversystems. The county and four of the five municipalities in the county have jurisdiction over landuse planning in the study area. The affected municipalities are the City of Vero Beach, City ofSebastian, Town of Indian River Shores, and Town of Orchid.
Barrier Island. The barrier island in Indian River County is known as Orchid Island. Thenorthern end of Orchid Island is Sebastian Inlet State Park, which is dominated by wetlands. Thenarrowest part of the island is the stretch just south of the park. Because of its narrow width, thisarea is the portion of the island that is most susceptible to being breached by a hurricane. Thecreation of a new inlet in this area would interrupt State Road A1A. Local planners indicated thatthey generally expect the highway will be protected. This may be accomplished by closing anynew inlet that forms and maintaining a sufficient buffer to protect the integrity of the road.Alternatively, the road could be maintained by a bridge over the new inlet. The narrow strip ofland in this area is classified protection likely, indicating that the road is likely to be maintainedin this area.
The largest dark blue area on the Orchid Island is part of Pelican Island National WildlifeRefuge. Local planners indicated that it would be more appropriate for this area to be light green,signifying no protection because much of it is in conservation. Planners, however, indicated thatState Road A1A would be protected at all locations on the barrier island.
The brown area signifying protection almost certain south of Pelican Island National WildlifeRefuge is the Town of Orchid. The larger brown area to the south is the Town of Indian RiverShores. Between Orchid and Indian River Shores, our maps show communities that are almostcertain to be protected interspersed with areas where protection is less likely. The brown areas onthe barrier island primarily represent residential areas with significant land value. Local plannershave noted that the extensive red area on southern half of the barrier island should also be brown.This entire area is primarily residential and has water and sewer service by the City of VeroBeach.
Mainland along the Sebastian River. The western shore of the Sebastian River is primarilydark blue, signifying protection unlikely. This area is now part of the St. Sebastian RiverPreserve State Park. Local planners have indicated it would be more appropriate for this area tobe light green, signifying no protection, because this is a conservation area. This is the largestarea in the county where the inland migration of wetlands could take place as sea level rises.
Map 1. Indian River County: Likelihood of Shore Protection.
488
489
The eastern shore of the Sebastian River is primarily red, signifying protection likely. This areaincludes a number of low-lying residential communities. Local planners indicated that the redclassification seems appropriate in this area.
Mainland along the Indian River Lagoon. The northern shore of the lagoon is primarily red,signifying protection likely for the areas surrounding and on the outskirts of the City ofSebastian. Local planners indicated that this classification seems appropriate. South of this areathe shoreline of the Indian River Lagoon is primarily dark blue, signifying protection unlikely.Smaller areas of red signifying protection likely and numerous dark green areas signifyingwetlands also exist in this area. Local planners indicated that most of the dark blue areas on thewest shore of the Indian River Lagoon were previously in agriculture. Many of these areas wererecently developed or are being developed. These new residential areas have well-designeddrainage systems to help protect the lagoon. It would be more appropriate for this area to bebrown, signifying protection almost certain.
The largest brown area east of the lagoon is the Grand Harbor development. The next largestbrown area to the south is the downtown area of the City of Vero Beach. Local plannersindicated that most of the dark blue areas north of the City of Vero Beach on the mainland havefilled in with development. It would be more appropriate for these areas to be brown. South ofthe downtown area of the City of Vero Beach is primarily red. The areas west of Indian RiverBoulevard south to the county line should probably be brown. The areas east of Indian RiverBoulevard are very low-lying areas that should probably remain red.
Planner Review Summary. Indian River County planners had the following commentsconcerning the statewide approach for identifying likelihood of land use protection (Table 3) andthe Indian River County shore protection map (Map 1):
The land use in much of the study areas has changed very dramatically in the last 4–5years. Many areas that were previously vacant are now developed. It would be desirableif the study could be based on more current land use data.
The area where the barrier island is most likely to be breached is near the north endwhere it very narrow. If the island is breached it is almost certain that State Road A1Awould be maintained through protection of the land or construction of a bridge.
The extensive red area on the southern half of the barrier island should probably bebrown. This entire area is primarily residential and has water and sewer service by theCity of Vero Beach.
The large dark blue area on the north end of the barrier island is part of Pelican IslandNational Wildlife Refuge. It would be more appropriate for this area to be light green.
Another dark blue area south of Pelican Island National Wildlife Refuge on the barrierisland is Captain Forster Hammock Preserve. It would be more appropriate for this areato be light green.
The dark blue area on the west side of the South Prong of the Sebastian River is part ofthe Sebastian Creek State Preserve. It would be more appropriate for this area to be lightgreen.
490
The red areas along the east shore of the South Prong of the Sebastian River and alongthe west side of the Indian River Lagoon in the northern part of the county are primarilyolder residential areas. The classification of protection likely is appropriate in these areas.
Most of the dark blue areas north of the Grand Harbor development on the west shore ofthe Indian River Lagoon are areas that were previously agriculture. Most of these areaswere recently converted or being converted to residential. These new residential areashave well-designed drainage systems to help protect the lagoon. It would be moreappropriate for this area to be brown.
The area south of Grand Harbor to the downtown area of the City of Vero Beach isprimarily dark blue and red. Because of recent development, it would be moreappropriate for this area to be brown.
The majority of the dark blue areas north of the City of Vero Beach on the mainland havefilled in with development. It would be more appropriate for these areas to be brown.
The area south of the downtown area of the City of Vero Beach along the west shore ofthe Indian River Lagoon is primarily red. The areas west of Indian River Boulevard southto the county line should probably be brown. The areas east of Indian River Boulevardare very low lying areas that should probably remain red.
There are several upland areas designated as conservation along the west shore of theIndian River Lagoon in the south end of the county. These areas appear to be dark blueon the map. It would be more appropriate for this area to be light green.
The county does not currently have policies specifically dealing with sea level rise. The county will be updating the comprehensive plan through the EAR process in 2008. County planners will consider adding new policies dealing with sea level rise in the next
major update to the comprehensive plan.

491
ST. LUCIE COUNTY
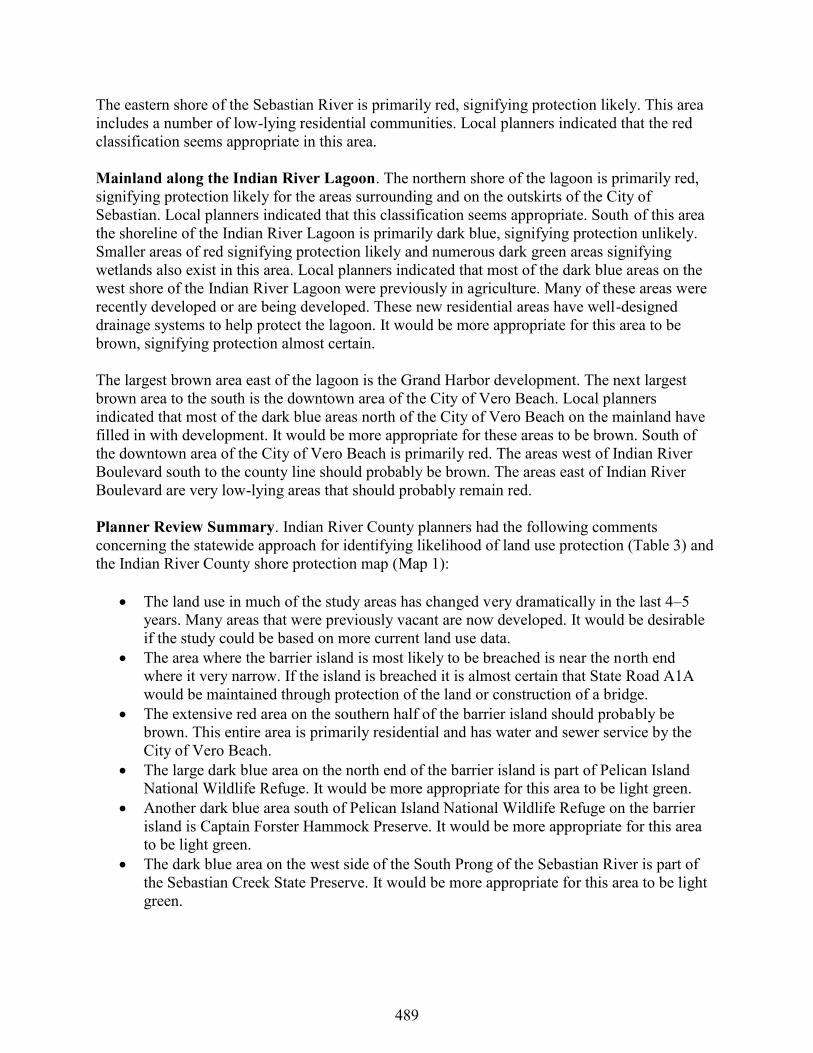
A total of 17,653 acres of uplands and 7,556 acres of wetlands were identified in the St. LucieCounty portion of the study area (Map 2). The Protection almost certain category accounts forthe largest percentage (60 percent) of the uplands in the study area in St. Lucie County. Thecombination of the protection almost certain and protection likely categories accounts for 90.1percent of the uplands in the study area in this county. St. Lucie County has almost no areasclassified as protection unlikely because most of the agricultural land adjacent to the coastalwaterways has already been developed or protected in conservation areas.
St. Lucie County has the greatest acreage of wetlands in the four counties examined. Thiswetland acreage accounts for 31.7 percent of the regional study area wetlands. The main areasclassified as wetlands are located along the eastern shoreline of the Indian River Lagoon and inthe North Fork of St. Lucie River. Most of these wetland areas have limited or no opportunity forthe inland migration as the sea level rises because they are adjacent to developed areas.
The upland areas most likely to be affected by sea level rise represent about 4.8 percent of thetotal area of St. Lucie County. The main areas of impact are expected on the barrier island, onthe shorelines of the Indian River Lagoon and North Fork of the St. Lucie River, and withinislands in the lagoon and river systems. The county and all three of the municipalities in thecounty have jurisdiction over land use planning in the study area. The affected municipalities arethe City of Port St. Lucie, City of Fort Pierce, and Town of St. Lucie Village.
Barrier Islands. The barrier islands in St. Lucie are known as North Hutchinson Island north ofthe Fort Pierce Inlet and South Hutchinson Island south of the inlet. Avalon Beach State Park isnear the north end of North Hutchinson Island. This park includes the largest area of light green,signifying no protection, on the barrier island system in the county. Areas south of the park areprimarily low- density residential and high-rise multifamily buildings. These areas are red,signifying protection likely, and brown, signifying protection almost certain. The area near theInlet is Fort Pierce Inlet State Recreation Area, which also includes some areas of light green.Local government planners noted that the island has numerous narrow areas where it could bebreached by a hurricane. If the island is breached at any location, it is almost certain that StateRoad A1A would be maintained through protection of the land or construction of a bridge.Maintenance of the road is important to provide access to recreational facilities and foremergency evacuations.
The north end of South Hutchinson Island is connected to a causeway on the south side of theFort Pierce Inlet. The causeway includes the Smithsonian Institute, U.S. Coast Guard Station,historical museum, and a variety of other commercial and public uses. Local planners indicatedthat the use of brown is appropriate in this area. Residential areas in Fort Pierce extend southalong the barrier Island from the inlet. These areas are red and brown. Local planners indicatedthat South Hutchinson Island has numerous narrow areas where it could be breached by ahurricane. If the island is breached at any location it is almost certain that State Road A1A wouldbe maintained through protection of the land or construction of a bridge.
Map 2. St. Lucie County: Likelihood of Shore Protection.
492

493
The land lying east of A1A, however, on the barrier island is very vulnerable. These areas shouldbe considered for relocation in the event of destruction by a hurricane.
The central portion of South Hutchinson Island contains the most significant critical facility inSt. Lucie County, the FPL St. Lucie nuclear power plant. This area is brown, signifyingProtection almost certain. Local planners indicated that it is critical that the road be maintained inthis area through protection of the land or construction of a bridge. The road is necessary forhurricane evacuation and evacuation in the event of an emergency at the plant.
The areas to the south of the power plant on South Hutchinson Island are primarily multifamilyresidential on both sides of State Road A1A. Also, there are two mobile home areas along thelagoon, including Nettles Island, which extends into the lagoon. Nettles Island and the areasdominated by high rise developments are shown in brown. Local planners noted that NettlesIsland is very low and seems very vulnerable to sea level rise. It is not clear how or if this areawill be protected from sea level rise.
Mainland along the Indian River Lagoon. The upland areas of the northern shore of the lagoonare primarily red, signifying protection likely and brown, signifying protection almost certain.The northernmost brown area is the Harbor Branch Oceanographic Institution. The red areasnorth of this area are primarily residential. The red areas south of Harbor Branch south to FortPierce include a variety of commercial, industrial, and residential uses. This also includes thehistoric district of the Town of St. Lucie Village. Local planners indicated that because of theimportance of this area it should be brown.
The most densely populated urban center in the county is the City of Fort Pierce. A portion of thecity is classified as protection almost certain, but much of the downtown area is classified asprotection likely. Critical facilities in the downtown Fort Pierce include the Fort Pierce municipalpower plant and the Port of Fort Pierce. The power plant is an older facility that may be replacedin future years. The port is an under developed facility that is likely to be expanded in futureyears. Sea level rise issues should play an important role in the future planning of both of thesefacilities. Local planners indicated that it would be more appropriate for this area to be brown.
The western shoreline of the Indian River Lagoon south of Fort Pierce is classified protectionalmost certain and protection likely. The mapped categories in this area are narrow because theelevations are very steep along this stretch of the lagoon. In spite of relatively high elevationabove sea level, the narrow road on the bluff in this area suffered from storm erosion during thehurricanes in 2004. The county is actively working to repair the storm damage and armor theseareas to prevent erosion in the future. Local planners indicated that the red areas south of FortPierce on the west side of the Indian River Lagoon should be brown because the county hasalready made a commitment to protect the shoreline.
Mainland along the North Fork of the St. Lucie River. The largest area in the countyclassified as Protection almost certain is on both sides of the North Fork of the St. Lucie River.This area is primarily residential development in the City of Port St. Lucie. The area classified asProtection likely at the northern reaches of this river system represents more sparse developmentin this area. Local planners indicated that the red area at the upper reaches of the North Fork of
494
the St. Lucie River has some recent residential development. It would be more appropriate forthese areas to be brown. Local planners indicated that sea level rise may convert some of thefresh water wetland systems along the North Fork of the St. Lucie River to estuarine systems.The wetland areas along the river north of about Midway Road are primarily fresh water systemsthat may be affected.
Planner Review Summary. St. Lucie County planners had the following comments concerningthe statewide approach for identifying likelihood of land use protection (Table 3) and the St.Lucie County sea level rise map (Map 2):
The barrier island has numerous narrow areas where it could be breached by a hurricane.If the island is breached at any location it is almost certain that State Road A1A would bemaintained through protection of the land or construction of a bridge. The road isnecessary for hurricane evacuation and evacuation in the event of an emergency at theFPL St. Lucie nuclear power plant.
Nettles Island is very low and seems very vulnerable to sea level rise. It is not clear howor if this area will be protected from sea level rise.
In general, the land east of A1A on the barrier island is very vulnerable. These areasshould be considered for relocation in the event of destruction by a hurricane.
The area in brown on the south side of the Fort Pierce inlet includes the SmithsonianInstitute, U.S. Coast Guard Station, historical museum, and a variety of other commercialand public uses. The use of brown is appropriate in this area.
The red area north of Fort Pierce is the historic district of St. Lucie Village. This areashould be brown.
The red areas south of Fort Pierce on the west side of the Indian River Lagoon should bebrown. The county has already made a commitment to protect the shoreline after erosionfrom the hurricanes in 2004.
The county has few places where wetlands will be able to migrate inland as sea levelrises. Avalon Beach State Park is one of the largest areas where this could occur.
Sea level rise may convert some of the fresh water wetland systems along the North Forkof the St. Lucie River to estuarine systems. The wetland areas along the river north ofabout Midway Road are primarily fresh water systems that may be affected.
Many of the mangrove systems in the Indian River Lagoon could persist in place as thesea level rises. Management of the impounded mangrove systems for mosquito controlmay need to be adjusted to compensate for changes in sea level.
The extensive brown area along the North Fork of the St. Lucie River is primarilyresidential development in the City of Port St. Lucie. The use of brown is appropriate inthis area.
The red area at the upper reaches of the North Fork of the St. Lucie River has had somerecent residential development. It would be more appropriate for these areas to be brown.
The county does not currently have policies specifically dealing with sea level rise. The county will be updating the comprehensive plan through the EAR process in 2007. County planners will consider adding new policies dealing with sea level rise in the next
major update to the comprehensive plan.

495
MARTIN COUNTY
A total of 28,834 acres of uplands and 7,474 acres of wetlands were identified in the MartinCounty portion of the study area. The Protection almost certain category accounts for 44.3percent of the uplands in the study area in Martin County (Map 3). The combination of theProtection almost certain and Protection likely categories accounts for 56.4 percent of theuplands in the study area in this county. Martin County contains the largest acreage of theProtection Unlikely category in the four counties examined.
Relatively large areas classified as wetlands are located along the shoreline of the Indian RiverLagoon. The wetlands in these areas are primarily mangrove forest. The other relatively largeareas classified as wetlands are at the upper reaches of the South Fork of the St. Lucie River,North Fork of the Loxahatchee River, and Northwest Fork of the Loxahatchee River. Thesewetland systems currently transition from mangrove forests to freshwater forested systems.
The upland areas most likely to be affected by sea level rise represent about 7.2 percent of thetotal area of Martin County. The main areas of impact are expected on the barrier islands; alongthe shorelines of the Indian River Lagoon, St. Lucie, and Loxahatchee rivers; and within islandsin the lagoon and river systems. The affected municipalities are the City of Stuart, Town ofSewall’s Point, Town of Ocean Breeze Park, and Town of Jupiter Island.
Barrier Islands. The barrier islands in Martin County are Hutchinson Island north of the St.Lucie Inlet and Jupiter Island south of the inlet. State Road A1A extends south on HutchinsonIsland into Martin County from St. Lucie County. This portion of Martin County is primarilybrown, signifying protection almost certain, with dark green identifying wetlands. The developedareas are predominately residential. MacArthur Boulevard extends to a development known asSailfish Point at the south end of Hutchinson Island. This is an extremely narrow portion of theBarrier Island, and the roadway was damaged during the 2004 hurricane season. The county hasrepaired the road and armored this area to protect it from future storms. Local planners indicatedthat the roads on the barrier islands are expected to be maintained in the event of breaching. Theroads are important to reach recreational areas and for hurricane evacuation.
The entire north end of Jupiter Island consists of the St. Lucie Inlet Preserve State Park and HobeSound National Wildlife Refuge. These areas consist primarily of mangrove wetlands and sandybeaches and dunes. The uplands are identified in light green, signifying No Protection. Thenarrowest point of Jupiter Island is near Peck Lake. Local planners indicated that if Jupiter Islandis breached near Peck Lake, it is likely that the new inlet would remain. This area is part of HobeSound National Wildlife Refuge and does not currently have a road. A breach in any other partof Jupiter Island with a road would be repaired and protected.

Map 3. Martin County: Likelihood of Shore Protection.
496
497
Most of the southern portion of Jupiter Island is brown, signifying protection almost certain. Thisarea is primarily a residential area in the Town of Jupiter Island. The light green area at the southend of the island is The Nature Conservancy’s Blowing Rocks Preserve. If this area were to bebreached, local planners indicated that the main road through Jupiter Island would be protected.
Mainland along the Indian River Lagoon. The upland areas of the northern shore of the lagoonare primarily brown. North of the St. Lucie River these areas include the Town of Ocean BreezePark and the Town of Sewall’s Point. South of the St. Lucie River, the lagoon shoreline is brownwhere the area is dominated by residential development. A large expanse of wetlands occurs onthe shore of the lagoon directly west of St. Lucie Inlet State Preserve. This area is part ofSeabranch Preserve State Park. Most of the areas on the western shore of the lagoon south of thispoint are brown, signifying Protection, or dark blue, signifying Protection Unlikely. Most of thebrown represents residential areas with significant infrastructure. Some of the dark blue areasappear to be uplands associated with county parks and the Hobe Sound National WildlifeRefuge. It would be more appropriate for these areas to be light green, signifying No Protection.The very southern segment of the western shore of the lagoon shows up as red, signifyingProtection likely. This area is a mix of commercial and residential development. Local plannersindicated that it would be more appropriate for these areas to be brown.
Mainland along the St. Lucie River. The upland areas of the shores of the St. Lucie River areprimarily brown. This area includes a mix of residential, office, commercial, and marine uses inand near the City of Stuart. This is the most populated area in Martin County. Several of theseareas are red; however, it would be more appropriate for these areas to be brown. The southernreaches of the South Fork of the St. Lucie River have extensive fresh water wetland systems.These areas are very susceptible to conversion to a salt water system, which would result inmajor ecological changes.
Mainland along the Loxahatchee River. The North and Northwest Forks of the LoxahatcheeRiver enter Martin County in the extreme southeastern portion of the county. The majorexpanses of light green and dark green in this area occur in Jonathan Dickinson State Park. Thered areas to the south of the park are primarily residential. Local planners indicated that parts ofthis area currently may be on wells and septic tanks, but much of this area is slated to be hookedup to public water and wastewater facilities. It would be more appropriate for these areas to bebrown.
The Loxahatchee River has extensive freshwater wetlands that may be impacted by sea levelrise. The Northwest Fork of the Loxahatchee River is designated as a National Wild and ScenicRiver.11,12 The SFWMD and FDEP are currently preparing a restoration plan designed to reducecurrent levels of salt water intrusion up the river. The SFWMD and COE are also addressing this
11 Treasure Coast Regional Planning Council. 1999. Loxahatchee River basin wetland planning project for PalmBeach County. Technical Summary Document, U.S. EPA Cooperative Agreement X994652-94-7, Treasure CoastRegional Planning Council, Stuart, Florida.
12 Florida Department of Environmental Protection and South Florida Water Management District. 2000.Loxahatchee River National Wild and Scenic River management plan, plan update. South Florida WaterManagement District, West Palm Beach, Florida.
498
salt water intrusion issue through the CERP. Options for increasing freshwater flows down theriver and placing salinity barriers at critical locations are being evaluated. Planning for sea levelrise may be critical in these restoration efforts. Current restoration plans to protect the river fromsalt water intrusion may reduce the potential for wetland migration up the Northwest Fork of theLoxahatchee River.
Planner Review Summary. Martin County planners had the following comments concerningthe state-wide approach for identifying likelihood of land use protection (Table 3) and the MartinCounty sea level rise map (Map 3):
The red and brown areas seem similar enough that a distinction between them may beunwarranted. Both areas represent developed areas that are likely be protected. There isvalue in distinguishing between developed and undeveloped areas.
The main focus should be identifying all land within the10-foot corridor so that planningissues can focus on concerns related to sea level rise.
The red area at the south end of Jonathan Dickinson Sate Park is primarily single-familyresidential. Parts of this area currently may be on wells and septic tanks, but much of thisarea is slated to be hooked up to public water and wastewater facilities. It would be moreappropriate for these areas to be brown.
There are several areas where the barrier island is extremely narrow and could bebreached by a hurricane. If the island is breached north of the inlet, State Road A1A andthe road to Sailfish Point will be maintained. In fact, the road to Sailfish Point wasrepaired and armored after being damaged in the 2004 hurricane season.
If Jupiter Island is breached near Peck Lake, it is likely that the new inlet would remain.This area is part of Hobe Sound National Wildlife Refuge and does not currently have aroad. A breach in any other part of Jupiter Island with a road would be repaired andprotected. The roads are important to reach recreational areas and for hurricaneevacuation.
Martin County already made a significant financial commitment to repair and armorIndian River Drive after it was damaged by erosion in the 2004 hurricane season.
The Loxahatchee River and South Fork of the St. Lucie River have extensive fresh waterwetland systems. These areas are very susceptible to conversion to a salt water system,which would result in major ecological changes.
The county does not currently have policies specifically dealing with sea level rise. The county will be updating the comprehensive plan through the EAR process in 2008. County planners will consider adding new policies dealing with sea level rise in the next
major update to the comprehensive plan.

499
PALM BEACH COUNTY
A total of 56,535 acres of uplands and 4,001 acres of wetlands were identified in the Palm BeachCounty portion of the study area (Map 4). The protection almost certain category in this countyaccounts for about 43.3 percent of the uplands in the study area within the region, and 90.7percent of the uplands in the study area in Palm Beach County. The combination of theprotection almost certain and protection likely categories accounts for 96.7 percent of theuplands mapped in this county. The wetlands remaining in the Palm Beach County portion of thestudy area account for only 16.8 percent of the wetlands identified in the region. The county hasno significant concentrations of areas classified as wetlands, and there are little or noopportunities for the inland migration of wetlands in Palm Beach County.
The upland areas most likely to be affected by sea level rise represent about 4.3 percent of thetotal area of Palm Beach County. The main areas of impact are expected on the barrier islandsand areas east of the ICW; shorelines of the Indian River Lagoon, Lake Worth Lagoon, and otherestuaries; shorelines of the Loxahatchee River; shorelines of several inland waterways; andwithin islands in the lagoon and river systems. The municipalities that boarder the ICW orAtlantic Ocean have the greatest potential to be affected by sea level rise. These include thefollowing 23 municipalities in Palm Beach County:
City of Boca Raton City of Boynton Beach Town of Briny Breezes City of Delray Beach Town of Gulf Stream Town of Highland Beach Town of Hypoluxo Town of Juno Beach Town of Jupiter Town of Jupiter Inlet Colony Town of Lake Park City of Lake Worth Town of Lantana Town of Manalapan Village of North Palm Beach Town of Ocean Ridge Town of Palm Beach City of Palm Beach Gardens Town of Palm Beach Shores City of Riviera Beach Town of South Palm Beach Village of Tequesta City of West Palm Beach

Map 4. Palm Beach County: Likelihood of Shore Protection.
500
Barrier Islands. The barrier islands in Palm Beach County are Jupiter Island north of the JupiterInlet, Singer Island north of the Lake Worth Inlet, and Palm Beach Island south of the LakeWorth Inlet. The portion of Jupiter Island in Palm Beach County is red. This area includes singlefamily residential in the Town of Jupiter Inlet Colony and several high-rise residential buildingsin the Village of Tequesta. Local planners have indicated that this area should be brown.
Nearly the entire shoreline along the Atlantic Coast, lagoon systems, and inland waterways ofPalm Beach County is developed and classified as protection almost certain. An exception justsouth of the Jupiter Inlet is Carlin Park, which is red. To the south is another red area, which isthe largest area of red on the map. This area includes some developed areas in the Town of JunoBeach and the Juno Hills Natural Area, which is owned and managed by Palm Beach County forconservation. It would be more appropriate if the developed areas could be separated andclassified protection almost certain and the Juno Hills Natural Area be shown as light green,signifying no protection.
The barrier island is light green at MacArthur Beach State Park. This is an area where the BarrierIsland is very narrow. It would be possible for the island to be breached at this location withoutinterrupting travel on State Road A1A, which runs on the west side of the island. If the islandwere breached in the park without affecting State Road A1A, it is likely that the breach would beallowed to remain. Local planners indicated however, that the road would be repaired andprotected if it were damaged by a hurricane.
The red area on the south end of Singer Island is the Town of Palm Beach Shores. This area isprimarily residential. Local planners have indicated that this area should be identified as brown.Similarly, the only sizable red area on Palm Beach Island is along the southeastern shore of theTown of South Palm Beach. This is a highly developed area that should be identified as brown.
Peanut Island. The only sizable dark blue area, signifying Protection Unlikely, in the county isPeanut Island, which is located adjacent to the Lake Worth Inlet. Peanut Island is home to a PalmBeach County Park, with newly constructed recreational facilities, restored and created fish andwildlife habitat, Palm Beach Maritime Museum, historic former U.S. Coast Guard Station, anddredged material management area used by the Florida Inland Navigation District and the Port ofPalm Beach. Local planners indicated that the dark blue seems appropriate because much of it isused for recreation. The low-lying historic structures in the red area on the south side of theisland would probably be protected.
Mainland along ICW and Lagoon Systems. Nearly the entire length of the county is classifiedas brown on the western shore of the ICW and lagoon systems. This includes a portion of thedowntown area of the City of West Palm Beach, the most urbanized portion of the county. Thisarea also includes two main critical facilities, the Port of Palm Beach and FPL Riviera powerplant, which are both located on the western shore of Lake Worth Lagoon in the City of RivieraBeach. Sea level rise issues should play an important role in the future planning for thesefacilities.
Inland along the Canal Systems. The sea level rise map for Palm Beach County identifies theareas adjacent to several inland canal systems as brown. These freshwater canals are managed by
502
the SFWMD for flood control purposes. For example, the C-17 canal typically has a dischargeelevation set from 8 to 9 feet above sea level; the C-51, C-16, and C-15 canals are typicallycontrolled at from 8.5 to 9.5 feet; and the Hillsborough canal is typically controlled at anelevation from 7.5 to 8.5 feet. These areas were included in the mapping because the dischargeelevations of these canals are below 10 feet above sea level. The land adjacent to these canalsystems, however, is generally above 10 feet in elevation. The mapping procedure that causedthese areas to be included in the study area should be evaluated. Similarly, the adequacy of theflood control structures in these canals should also be examined as part of long range planningfor sea level rise.
Planner Review Summary. Palm Beach County planners had the following commentsconcerning the state-wide approach for identifying likelihood of land use protection (Table 3)and the Palm Beach County sea level rise map (Map 4):
The maps would be more useful if one could zoom in to see more details on a computer. The maps would be improved if they contained the main roads and municipal boundaries. The barrier island is very narrow at several locations. If the island is breached it would
likely be repaired and the road would be maintained. The road is very important forhurricane evacuation.
The dark blue signifying protection unlikely on much of Peanut Island seems appropriatebecause much of it is used for recreation. The low-lying historic structures on the PeanutIsland would probably be protected.
The developed areas identified in red on the barrier island should be brown. Most of theseareas have public water and sewer service. These areas include the Town of Palm BeachShores and parts of the Town of Juno Beach shown in red. The Town of Jupiter InletColony is still on septic tanks, but receives its water service from the Village of Tequesta.
The county does not currently have policies specifically dealing with sea level rise. The county will be updating the comprehensive plan through the EAR process in 2009. County planners will consider adding new policies dealing with sea level rise in the next
major update to the comprehensive plan.
503
DISCUSSION
Responses to Sea Level Rise
Many coastal management, construction, and planning and zoning guidelines can preparecitizens and governments for rising sea levels. The Coastal Zone Management Subgroup ofIntergovernmental Panel on Climate Change Response Strategies Working Group13 described thethree basic pathways for responding to sea level rise. The strategies of retreat, accommodation,and protection are described below:
Retreat. This is the strategy of abandoning lands and structures in coastal zones and allowingmarine ecosystems to move inland. In this response, there is no effort to protect the land from sealevel rise. Governments exercising the retreat option generally prevent development in proneareas, allow development with conditions for abandonment (e.g., rolling easement), or withdrawsubsidies for construction in danger zones. Governments can restrict development in coastalareas through a variety of policies. These approaches usually include land acquisitions, setbacks,low densities, planning and zoning restrictions on coastal land use, and bans on redevelopment ofdamaged structures.
Accommodation. This strategy allows for land use and occupancy of vulnerable areas tocontinue, but with no attempts to prevent flooding or inundation. It is a hybrid of retreat andprotection, because structures are protected while floodplains and shorelines advance fartherinland. Governments favoring accommodation can strengthen flood preparations, prohibitactivities that may destroy protective coastal resources, or deny government flood insurancecoverage of inhabitants of vulnerable areas. Strengthened flood preparations may includecountering rising seas and high winds through building code requirements, improvement ofdrainage, and education. Like retreat, accommodation requires advance planning by localgovernments. Local governments must also accept that valuable land may be lost to rising seas.Although accommodation is a common short-term response, it may be less useful in the long run.Although it may be practical in some circumstances to maintain habitable homes as wetlandsadvance onto people’s yards, eventually the wetlands would become inundated and homes wouldbe standing in the water.
Protection. This strategy involves using structural, defensive measures to protect the land fromthe sea, so that land use can continue. Shores can be protected by hard structures such asseawalls, revetments, and dikes, or by soft structural techniques like beach nourishment andelevating land surfaces with fill. Unlike the first two options, protection has a dramatic impact onboth the immediate environment and ecosystems beyond the immediate area. The costs towetlands, unprotected uplands, and offshore fisheries must be assessed before protectivemeasures are constructed.
13 Dronkers, J; J. T. E. Gilbert, L.W. Butler, J.J. Carey, J. Campbell, E. James , C. McKenzie, R. Misdorp, N. Quin,K.L. Ries, P.C. Schroder, J.R. Spradley, J.G. Titus, L. Vallianos, and J. von Dadelszen. 1990. Strategies forAdaption to Sea Level Rise. Report of the IPCC Coastal Zone Management Subgroup: Intergovernmental Panel onClimate Change. Ministry of Transport and Public Works, The Hague, Netherlands.

504
Federal Policies and Programs
Although a few federal policies specifically deal with the problems of sea level rise, severalpolicies address the same effects of sea level rise, such as flooding, erosion, and wetland loss.These policies are included in the Coastal Zone Management Act, the Coastal Barrier ResourcesAct, the Clean Water Act, the Rivers and Harbors Act, and the National Flood Insurance Act.
The Coastal Zone Management Act of 1972 is the federal law that created and guides the UnitedStates’ coastal management programs. Congress created the CZMA to deal with the threats to thecountry’s coastal zone caused by increasing and competing demands on the land and water of thezone. The CZMA establishes the coastal management policy of the United States as preserving,protecting, developing, and, where possible, restoring or enhancing the resources of the nation'scoastal zone by encouraging and assisting the states to exercise to develop and implement theirown coastal management programs. Congress also specifically addressed the issue of sea levelrise in the act:
Because global warming may result in a substantial sea level rise with serious adverse effects inthe coastal zone, coastal states must anticipate and plan for such an occurrence.
The Congress finds and declares that it is the national policy . . . the management of coastaldevelopment to minimize the loss of life and property caused by improper development in flood-prone, storm surge, geological hazard, and erosion-prone areas and in areas likely to be affectedby or vulnerable to sea level rise, land subsidence, and saltwater intrusion, and by the destructionof natural protective features such as beaches, dunes, wetlands, and barrier islands.
The provisions of the CZMA are realized through the Coastal Zone Management Program(CZMP), which is administered by NOAA. The CZMP is a voluntary federal-state partnershipthat provides cost-sharing grants to states to develop and implement their own coastal zonemanagement plans. The CZMP bases eligibility for federal approval of state plans on severalfactors. Each state’s plan is required to define boundaries of the state’s coastal zone and identifyuses within the area to be regulated by the state plan, the criteria for regulations such uses andthe guidelines for priorities of uses within the coastal zone. After NOAA approves the plan,grants are awarded for implementation of the state’s coastal management plan. In addition toproviding financial assistance, the CZMP also supports states by offering mediation, technicalservices and information, and participation in priority state, regional, and local forums. Thirty-four states and territories with federally approved coastal management programs are participantsin the CZMP. almost all of the nation’s shoreline (99.9 percent) is currently managed by theCZMP. The main effect of the CZMA on the issue of sea level rise is to make state policymakersaware of the matter when they create their own coastal management plans.
Another piece of federal legislation that has a bearing on coastal management policies is theCoastal Barrier Resources Act (CBRA), which was enacted in 1982. CBRA was designed toprotect barrier islands along the nation’s coast. Coastal barrier islands are located off of themainland coast and protect the mainland by receiving the majority of the ocean’s energycontained in winds, waves, and tides. Coastal barriers also protect and maintain productiveecosystems that exist within this protective zone. In drafting the law, Congress found that certainactions and programs of the federal government have subsidized and permitted development on
505
coastal barriers and the result has been the loss of barrier resources, threats to human life, health,and property, and the expenditure of millions of tax dollars each year.
CBRA established a Coastal Barrier Resources System, which designated various undevelopedcoastal barrier islands for inclusion in the system. The boundaries of the system are contained onmaps kept on file by the Department of the Interior. CBRA prohibits various federal actions andpolicies on islands within the system. The act places several restrictions on federal governmentspending on expenditures that encourage development or modification of a coastal barrier. Nonew expenditures or federal assistance can be used on coastal barrier islands for the followingprojects:
1) The construction or purchase of any structure, appurtenance, facility, or relatedinfrastructure.
2) The construction or purchase of any road, airport, boat landing facility, or other facilityon, or bridge or causeway to, any system unit.
3) The carrying out of any project to prevent the erosion of, or to otherwise stabilize, anyinlet, shoreline, or inshore area, except that such assistance and expenditures may bemade available on (certain designated units) for purposes other than encouragingdevelopment and, in all units, in cases where an emergency threatens life, land, andproperty immediately adjacent to that unit.
Notwithstanding the previous restrictions, CBRA does provide exceptions to limitations on avariety of expenditures with the barrier system. These include military and Coast Guardactivities; maintenance of federal navigation channels; maintenance of certain publicly ownedroads, structures, and facilities; scientific research; and nonstructural projects for shorelinestabilization that mimics, enhances, or restores a natural stabilization system. Nonstructural shoreerosion control projects usually use bioengineering to create protective vegetative buffersstabilizing stream banks and shorelines and creating near-shore habitats for aquatic species andwaterfowl. Another feature of the act is the prohibition of national flood insurance or HUDassistance to any projects within the barrier system that facilitate an activity that is not consistentwith CBRA’s provisions. CBRA is a good start in the prevention of development in areas thatwill be most affected by the effects of sea level rise.
The National Flood Insurance Program (NFIP) is another important component of federal coastalmanagement policy. The NFIP is administered by the Federal Emergency Management Agency(FEMA), with its primary goals being to save lives and reduce future property losses fromflooding. The NFIP is a voluntary program based on a mutual agreement or partnership betweenthe federal government and local communities. This partnership provides that the federalgovernment will make federally backed flood insurance available to home and business ownersin communities that agree to adopt and enforce comprehensive floodplain management standardsdesigned to reduce flood damages. NFIP transfers most of the costs of private property floodlosses from the taxpayers to people that choose to live within floodplains through insurancepremiums and increased construction standards.
506
Community response to this requirement involves the adoption of land use, zoning, and buildingcode standards that, at a minimum, include the design and construction standards of the NFIP.The minimum NFIP design and construction standards are applicable to all new construction,substantial damages and substantial improvements to existing structures located in Special FloodHazard Areas or in Special Flood Hazard Areas that have not yet been identified by FEMA. TheSpecial Flood Hazard Areas represent the statistical chance of a 100-year flood occurring in anygiven year. The 100-year flood has a 1 percent chance of occurring in any given year.
NFIP imposes stricter requirements on communities in the V-Zones of Flood Insurance RateMaps. These are locales in coastal high hazard areas located along coastlines that are subject tohigh water levels, wave action, and erosion from strong storms and hurricanes. The wind andresultant waves and tidal surges from these storms cause water moving at high velocities tosweep over nearby land. Generally, the V-Zone indicates the inland extent of a 3-foot breakingwave atop a storm surge. These areas are extremely hazardous to life and property.
The NFIP requires a number of building requirements for new construction or substantialimprovements in coastal high hazard areas to be able to withstand wind and waves. Newbuildings and improvements must:
Obtain and maintain the elevation of the bottom of the lowest horizontal structuralmember of the lowest floor;
Be located landward of mean high tide and no new construction is allowed over water;
Be elevated so that the bottom of the lowest horizontal structural member of the lowestfloor is at or above the base flood elevation on a pile or column foundation;
Allow the space below the lowest elevated floor to be free of obstruction or must beenclosed with nonsupporting breakaway walls, open lattice-work, or insect screeningdesigning to collapse under wind and water loads without causing damage to structuralsupports or the elevated structure;
Not use fill for structural support of buildings; and
Prohibit manmade alteration of sand dunes and mangrove stands that would increasepotential flood damage.
As previously noted, the CBRA prohibits new NFIP coverage for new or substantially improvedstructures in any coastal barrier in the CBRA system.
The Clean Water Act of 1972 is another federal law that has an impact on the health of ournation’s coastal areas and wetlands. Section 404 of the Clean Water Act sets national policy forthe discharge of dredged or fill material into the nation’s navigable waters and adjacent wetlands.The act has even been interpreted to have authority over inland wetlands. Section 404 givesjurisdictional responsibility for issuing dredge permits to the COE. The EPA has responsibilityfor developing and interpreting the criteria used in permit issuances.
507
The Clean Water Act prohibits the discharge of dredged or fill material at a specific site if thereis a practicable alternative to the proposed discharge that would have less adverse impact on theaquatic ecosystem or if the discharge will cause or contribute to significant degradation of U.S.waters. Practicable alternatives under the Clean Water Act include activities that do not include adischarge into U.S. waters or discharges into waters other than the specific site requested.Degradation caused to U.S. waters is deemed to be significant adverse effects to human health orwelfare, aquatic life stages and ecosystems, ecosystem diversity and productivity, andrecreational, aesthetic, and economic values. Discharges from established and ongoing farming,ranching, and forestry activities are exempt from Section 404 provisions.
To receive a permit to discharge dredge materials, the applicant must prove to the COE that theyhave taken steps to avoid wetland impacts where practicable, minimized potential impacts towetlands, and provided compensation for any remaining, unavoidable impacts through activitiesto restore or create wetlands. States also have a role in Section 404 decisions, through stateprogram general permits, water quality certification, or program assumption.
An additional federal law that gives the COE additional authority over construction in navigablewaters and wetlands is the Rivers and Harbors Act (RHA). Sections 9 and 10 of the act authorizethe COE to regulate the construction of any structure or work within navigable waters of theUnited States. The types of structures the RHA allows the COE to regulate include the following:wharves, breakwaters, or jetties; bank protection or stabilization projects; permanent mooringstructures, vessels, or marinas; intake or outfall pipes; canals; boat ramps; aids to navigation; orother modifications affecting the course, location condition, or capacity of navigable waters.
When issuing permits for construction of the aforementioned structures, the COE must considerthe following criteria: (1) the public and private need for the activity, (2) reasonable alternativelocations and methods, and (3) the beneficial and detrimental effects on the public and privateuses to which the area is suited. The COE is also required to consult with the U.S. Fish andWildlife Service and the National Marine Fisheries Service to protect and conserve wildliferesources.
State Policies and Programs
As with federal policies, few Florida policies specifically address the issue of sea level rise.However, state coastal guidelines that cover beach management policies can be used to respondto sea level rise concerns. These policies are included in the Coastal Construction Line Program,the Beach Erosion Control Program, and the Coastal Building Zone and Strategic BeachManagement Plans.
The Florida Beach and Shore Preservation Act was enacted by the state legislature to preserveand protect Florida’s beach and dune system. Beaches and dunes are the first line of defenseagainst storms, acting as a buffer between the sea and coastal development. One of the programsauthorized by the Beach and Shore Preservation Act to be an essential element in the protectioneffort is the Coastal Construction Control Line (CCCL) Program (Beach and Shore PreservationAct, Florida Statutes Chapter 161).

508
The CCCL Program was designed to protect Florida’s beach and dune system from irresponsibleconstruction that could weaken, damage, or destroy the health of the dune system. Structures thatare built too close to the sea can inhibit the beach and dune system from its natural recoveryprocesses and can cause localized erosion. Improperly constructed structures are a threat to othernearby coastal structures should they be destroyed by storms. The CCCL Program gives the Statethe jurisdiction to apply stringent siting and design criteria to construction projects within thecontrol line. The CCCL is not a setback line, but is rather a demarcation line of the State’sauthority.
The CCCL is marked at the landward limit of coastal areas that are subject to the effects of a100-year storm surge. Although wind and flooding may intrude farther inward than the 100-yearstorm surge area, effects landward of the CCCL are considerably less than within the CCCL.Within the CCCL, the State prohibits the construction or siting of structures that would cause asignificant adverse impact to the beach and dune system, result in the destabilization of thesystem, or destroy marine turtle habitat. To meet these requirements, structures are required to belocated a sufficient distance from the beach and frontal dune and must also be sited in a way thatdoes not remove or destroy natural vegetation. The CCCL also requires all structures to beconstructed to withstand the wind and water effects of a 100-year storm surge event. Thisinvolves creating structures that meet American Society Civil Engineering 7-88 Sect. 6 winddesign standards for 110 mph winds and 115 mph for the Florida Keys. Water standards includea foundation design to withstand a 100-year storm event, including the effects of surge, waves,and scouring. There is no prohibition of rebuilding under the CCCL Program. Because of theeffects of erosion, the CCCL Program discourages the construction of rigid coastal armoring(seawalls) and instead encourages property owners’ use of other protection methods such asfoundation modification, structure relocation, and dune restoration.
Another similar endeavor to regulate coastal construction is the Coastal Building Zone (CBZ).The CBZ was established as part of the Coastal Protection Act of 1985 to protect coastal areasand to protect life and property. The CBZ is similar to the CCCL Program in that it is aregulatory jurisdiction rather than a setback line. The CBZ envelops land from the seasonal highwater line to 1,500 feet landward of the CCCL. In those areas fronting on the ocean but notincluded within an established CCCL, the CBZ includes the land area seaward of the mostlandward V-Zone line, as established by NFIP’s flood maps. The V-Zone is an area likely toexperience a wave greater than 3 feet high with storm surge or areas within the 100-year stormevent used by the CCCL program. Local governments enforce the Coastal Building Zone, as apart of their building codes.
Within the CBZ, new construction is required to meet the Standard Building Code 1997 winddesign standard of 110 mph and 115 mph for the Florida Keys. As for water standards, structuresare required to meet National Flood Insurance Program requirements or local flood ordinancerequirements, whichever are stricter. Foundations must also be designed to withstand a 100-yearstorm surge. CBZ construction standards are less stringent than CCCL standards because NFIPflood maps have lower base flood elevations for 100-year storm events than do CCCL studies.
509
Another state effort to protect Florida’s beaches, authorized by the Beach and Shore PreservationAct, is the Beach Erosion Control Program (BCEP). The BECP is the primary program thatimplements the Florida Department of Environmental Protection’s beach managementrecommendations. The BCEP was created to coordinate the efforts of local, state, and federalgovernments in protecting, preserving, and restoring Florida’s coastal resources. One of theactivities of this program is the offering of financial assistance to counties, local governments,and other special districts for shore protection and preservation efforts. The BECP will provideup to 50 percent of project costs. The mix between federal, state, and local funds is different foreach project.
Beach management activities eligible for funding from the BECP include beach restoration andnourishment activities, project design and engineering studies, environmental studies andmonitoring, inlet management planning, inlet sand transfer, dune restoration and protectionactivities, and other beach erosion prevention related activities.
Another endeavor of the BECP is the development and maintenance of a Strategic BeachManagement Plan (SMBP) for Florida. The SBMP is a multiyear repair and maintenancestrategy to carry out the proper state responsibilities of a comprehensive, long-range, statewideprogram of beach erosion control; beach preservation, restoration, and nourishment; and stormand hurricane protection. The SBMP is divided into specific beach management plans forFlorida’s coastal regions.
Local Government Policies
All of the counties in the region have comprehensive plans that contain coastal managementelements. None of the counties in the region has policies specifically dealing with sea level rise.Each of the counties, however, has goals, objectives, and policies that are related to sea level riseissues. Some of these objectives most relevant to sea level rise are summarized below.
Indian River County
Objective 4: Beaches and Dunes. By 1998, all natural functions of the beach and dune systemin Indian River County shall be protected and no unmitigated human-related disturbance of theprimary dune system shall occur.
Objective 5: Limiting Public Expenditures in the Coastal High-Hazard Area. Through 2004,there will be no expansion of infrastructure within the Coastal High Hazard Area other than thatwhich is deemed necessary to maintain existing levels-of-service.
Objective 11: Limit Densities in the Coastal High Hazard Area. Through 2020, there will be noincrease in the density of land use within the Coastal High Hazard Area.
St. Lucie County
Objective 7.1.1: Future Development in the Coastal Area. St. Lucie County shall continue toprotect the natural resources of the coastal area from adverse impacts caused by future
510
development through the implementation and strengthening of existing environmentally relatedlaws and the assignment of appropriate Future Land Use designations.
Objective 7.1.5: Beaches and Dunes. St. Lucie County shall provide for the protection andrestoration of beaches and dunes. A comprehensive beach and dune management program shallbe adopted by 2003 which enhances the natural functioning of the beach-dune system whilereducing unnatural disturbances of the primary dune.
Objective 7.2.1: The County shall address development and redevelopment in the coastal area inthe County’s Hurricane Evacuation Plan.
Martin County
Objective. Beach and Dune and Off-Shore Systems. To develop procedures and standards toprotect, enhance and restore beach and dune systems and minimize construction-related impacts
Objective. Hazard Mitigation and Coastal High Hazard Area. To limit public expenditures inthe designated coastal high hazard area to necessary public services in order not to subsidize newdevelopment in this area.
Objective. Direct Population Away from Coast. Encourage low density land uses within thecoastal high hazard area in order to direct population concentrations away from this area.
Palm Beach County
Objective 1.2: Shoreline Protection. Palm Beach County shall protect, enhance and restore thebeaches and dunes through implementation and maintenance of the Palm Beach CountyShoreline Protection Plan.
Objective 2.2: Public Subsidy of New Coastal Development. Palm Beach County shall notsubsidize new or expanded development in the coastal area.
Objective 2.3: Development in High Hazard Area. Palm Beach County shall direct populationconcentrations away from known or predicted coastal high-hazard areas and shall not approveincreases in population densities n the coastal high hazard area.
Proposed Policies
Planners in each of the counties in the Treasure Coast Region indicated a willingness to considerthe adoption of policies specifically related to sea level rise. The following policy statements areoffered for consideration by local governments in coastal areas:
Policy 1: Consider the impact of sea level rise in all land use amendments in coastal areas lessthan 10 feet in elevation.
511
Policy 2: Obtain detailed topographic maps showing one foot contours in the coastal zone toassist in planning for sea level rise.
Policy 3: Develop a plan to protect or relocate all critical public facilities that are located in areasprojected to be impacted by sea level rise in the next 50 years.
Policy 4: Closely monitor updates to sea level rise forecasts and predictions.
Policy 5: Develop a sea level rise response plan that specifically identifies the areas whereretreat, accommodation and protection will be implemented.
CONCLUSIONS
This report is intended to stimulate local government planners and citizens to think about theproblem of sea level rise. Although this project covers a timeframe of 200 years, planning for sealevel rise should begin now. The sea is already rising and some shores are already eroding.Moreover, an effective response may require a lead time of many decades. If we develop areaswhere wetland migration is preferred in the long run, it might take a lead time of 50-100 years torelocate the development. Even in areas that we protect, shore protection measures can takedecades to plan and implement.
The relevance of planning for sea level rise can also be seen by the events of 2004 hurricaneseason. The Treasure Coast Region suffered extensive damage from storm surges, wind anderosion. With strong hurricane seasons projected to continue into the future, because of warmerocean waters, the events of the 2004 hurricane season are likely to reoccur.
The rate of development and increase in population in the Treasure Coast Region are otherimportant factors in starting the preliminary stages of planning for sea level rise now. As sealevels continue to rise, much of the currently developed increasingly populated area can beexpected to be flooded. Planners must begin to decide which land areas in their counties andmunicipalities will be protected against sea level rise, and what the cost will be to holding backthe sea. Citizens living in these areas must also know the costs associated with protection againstsea level rise.
The sea level rise maps provided in this report only depict the expected response scenarios to sealevel rise based on the best currently available knowledge. Local planners may decide in thefuture that it will be wise to retreat from lands currently deemed to be protected lands, due tocosts and environmental considerations. This project represents the first step in planning for sealevel rise in the Treasure Coast Region.
512
REFERENCES
Bureau of Economic and Business Research. 2005. Projections of Florida population by county,2004 – 2030. University of Florida, Bureau of Economic and Business Research Bulletin No.141, Volume 38, No.2.
J. Dronkers, J. T. E. Gilbert, L.W. Butler, J.J. Carey,
J. Campbell, E. James , C. McKenzie, R. Misdorp, N. Quin, K.L. Ries, P.C. Schroder, J.R.Spradley, J.G. Titus, L. Vallianos, and J. von Dadelszen. 1990. Strategies for Adaption to SeaLevel Rise. Report of the IPCC Coastal Zone Management Subgroup: Intergovernmental Panelon Climate Change. Ministry of Transport and Public Works, The Hague, Netherlands.
Fiedler, J., F. Mays, and J. Siry, Eds. 2001. Feeling the heat in Florida: Glogal warming on thelocal level. Natural Resources Defense Council and Florida Climate Alliance, New York andOrlando.
Florida Department of Environmental Protection and South Florida Water Management District.2000. Loxahatchee River National Wild and Scenic River management plan, plan update. SouthFlorida Water Management District, West Palm Beach, Florida.
Florida Department of Transportation. 1999. Florida land use, cover and forms classificationsystem. Third edition. Florida Department of Transportation Surveying and Mapping Office,Geographic Mapping Section, Tallahassee, Florida.
Indian River County. 1998. Indian River County 2020 comprehensive plan. Indian River County,Vero Beach, Florida.
Leatherman, S.P., K. Zhang, and B.C. Douglas. 2000. Sea level rise shown to drive coastalerosion. EOS Transactions 81: 55-57.
Martin County. 1990. Martin County comprehensive growth management plan. Martin County,Stuart, Florida.
Palm Beach County. 1989. Comprehensive plan. Palm Beach County, West Palm Beach, Florida.
St. Lucie County. 2002. St. Lucie County comprehensive plan. St. Lucie County, Fort Pierce,Florida.
Titus, J.G., D.E. Hudgens, D.L. Trescott, M. Craghan, W.H. Nuckols, C.H. Hershner, J. M.Kassakian, C.J. Linn, P.G. Merritt, T.M. McCue, J.F. O'Connell, J. Tanski, and J. Wang. 2009.State and local governments plan for development of most land vulnerable to rising sea levelalong the U.S. Atlantic Coast. Environmental Research Letters. 4 (2009) 044008 (7pp).
Titus, J.G., and J. Wang. 2008. Maps of Lands Close to Sea Level along the Middle AtlanticCoast of the United States: An Elevation Data Set to Use While Waiting for LIDAR. Section 1.1in: Background Documents Supporting Climate Change Science Program Synthesis andAssessment Product 4.1, J.G. Titus and E.M. Strange (eds.). EPA 430R07004. U.S. EPA,Washington, DC.
Titus, J.G., R.A. Park, S.P. Leatherman, J.R. Weggel, M.S. Greene, P.W. Mausel, S. Brown, C.Gaunt, M. Trehan, and G. Yohe. 1991. Greenhouse effect and sea level rise: The cost of holdingback the sea. Coastal Management 19:171–204.

513
Titus, J.G. 1998. Rising seas, coastal erosion and the takings clause: How to save wetlands andbeaches without hurting property owners. Maryland Law Review 57: 1279-1399.
Titus, J.G. and V. Narayanan. 1995. The Probability of Sea Level Rise. Washington, D.C.:U.S. Environmental Protection Agency.
Titus J.G., and J. Wang. 2008. Maps of lands close to sea level along the Middle Atlantic coastof the United States: an elevation data set to use while waiting for LIDAR. Section 1.1 in:Background Documents Supporting Climate Change Science Program Synthesis and AssessmentProduct 4.1, J.G. Titus and E.M. Strange (eds.). EPA 430R07004. U.S. EPA, Washington, DC.
Treasure Coast Regional Planning Council. 1995. Strategic Regional Policy Plan. Treasure CoastRegional Planning Council, Stuart, Florida.
Treasure Coast Regional Planning Council. 1999. Loxahatchee River basin wetland planningproject for Palm Beach County. Technical Summary Document, U.S. EPA CooperativeAgreement X994652-94-7, Treasure Coast Regional Planning Council, Stuart, Florida.
Twilley, R.R., E.J. Barron, H.L. Gholz, M.A. Harwell, R.L. Miller, D.J. Reed, J.B. Rose, E.H.Siemann, R.G. Wetzel, and R.J. Zimmerman. 2001. Confronting Climate Change in the GulfCoast Region: Prospects for sustaining our ecological heritage. Union of Concerned Scientists,Cambridge, Massachusetts, and Ecological Society of America, Washington, D.C.
Yohe, G. 1990. The cost of not holding back the sea. Toward a national sample of economicvulnerability. Coastal Management 18:403-431.
Warrick, R.A., C.L. Provost, M.F. Meier, J. Oerlemans, and P.L. Woodworth. 1996. Changes insea level. pp. 359-405. In Climate change 1995: The science of climate change. (J.T. Houghton,L.G. Meira Filho, B.A. Callender, N. Harris, A. Kattenberg and K. Maskell, Eds.). CambridgeUniversity Press, London.
Intergovernmental Panel on Climate Change. 2001. Climate Change 2001: The Scientific Basis,Technical Summary of Working Group 1. Cambridge University Press, New York and London.
Titus, J.G. 2000. “Does the U.S. Government Realize that the Sea Is Rising?” Golden GateUniversity Law Review, Vol. 30:4:717–778.

514
ACKNOWLEDGMENTS
TCRPC offers its gratitude to the other RPCs in Florida for sharing information and jointlydeveloping language as a statewide report on sea level rise is developed. Appreciation isextended to Daniel L. Trescott of the SWFRPC and James G. Titus of the EPA for coordinatingthe statewide planning effort in Florida. Special thanks go to Manuel Cela of the SFRPC forproducing the sea level rise maps for the Treasure Coast Region, and John E. Hulsey of theSFRPC for sharing planning ideas. This report benefited from discussions about sea level risewith local government planners, including Bob Keating, Roland DeBlois, Sasan Rohani, KenOristaglio, and Andy Sobczak with Indian River County; David Kelly, Diana Waite, VanessaBessey, and Donald B. West with St. Lucie County; Nicki van Vonno and Ross Wilcox withMartin County; and Lorenzo J. Aghemo, Isaac Hoyos, Michael R. Howe, Etim S. Udoh, and ErinFitzhugh with Palm Beach County. The project manager for TCRPC and principal author of thisdocument is Peter G. Merritt, Regional Ecologist with TCRPC.