landcover dynamics in west lampung, sumatra, indonesia · land cover dynamics in west lampung,...
TRANSCRIPT

Land cover Dynamics in West Lampung, Sumatra, Indonesia 1
LANDCOVER DYNAMICS IN WEST LAMPUNG,
SUMATRA, INDONESIA
Technical report submitted for ICRAF Internal Workshop: “Impact Study of ICRAF Land and Tree Tenure Programme”, Bogor 1-2 August 2005
By: Andree Ekadinata1, Koen Kusters2, Atiek Widayati1, David Gaveau3, and Aslan3
1World Agroforestry Center (ICRAF)
2 Center for International Forestry Research (CIFOR) 3 Wildlife Conservation Society (WCS)
Land cover Dynamics in West Lampung, Sumatra, Indonesia 2
Table of Content
1. Introduction.................................................................................................................................................... 4 2. Acknowledgements ....................................................................................................................................... 4 3. Objectives ...................................................................................................................................................... 4 4. Study Area ..................................................................................................................................................... 4 5. Materials......................................................................................................................................................... 5
5.1 Training and Reference Area ............................................................................................................... 5 5.2 Satellite Images ..................................................................................................................................... 6 5.3 Forest Cover Classification .................................................................................................................. 6 5.4 Additional Maps.................................................................................................................................... 6
6. Landcover Types in Study Area ................................................................................................................... 7 7. Methods.......................................................................................................................................................... 9
7.1 Classification scheme.................................................................................................................................. 9 7.2 Accuracy assessment.................................................................................................................................10 7.3 Land cover change analysis .....................................................................................................................11
8. Results..........................................................................................................................................................11 8.2 Landcover map 1997.................................................................................................................................11 8.3 Landcover map 2002.................................................................................................................................13 8.4 Accuracy asessment of 2002 landcover map...........................................................................................15 8.5 Landcover change 1997-2002 ..................................................................................................................16
9. Discussion....................................................................................................................................................16 9.1 Overall Analysis of Forest Cover Data....................................................................................................16 9.2 Land cover dynamics within BBSNP and the buffer function of damar agroforests............................17 9.3 Dynamics of damar agroforests within and outside KDTI area.............................................................19
10. Conclusions .............................................................................................................................................22 11. References................................................................................................................................................22

Land cover Dynamics in West Lampung, Sumatra, Indonesia 3
List of Figures
Figure 4.1. Study area in west Lampung.............................................................................................................. 5 Figure 5.1. Additional maps used in this study, Limited production forest and national park maps (left
panel) and KDTI maps (right panel) ............................................................................................................ 7 Figure 6.1. Some of the land cover types in West Lampung area: forest (upper left panel), damar agroforest
(middle left panel), simple shade coffee agroforest (lower left panel), oilpam (upper right panel), coconut (middle right panel), and ricefield (lower right panel). ................................................................. 9
Figure 7.1. Classification scheme. ......................................................................................................................10 Figure 7.2. A sample of accuracy matrix (Congalton et. al, 1999)...................................................................11 Figure 7.3. Post classification comparison process ...........................................................................................11 Figure 8.1 Land cover map of west Lampung area in 1997. Forest class was derived from forest cover .....12 data of Gaveau, 2005...........................................................................................................................................12 Figure 8.2 Land cover proportion of west Lampung area in 1997...................................................................13 Figure 8.3 Land cover map of west Lampung area in 2002 .............................................................................14 Figure 8.4 Land cover proportion of west Lampung area in 2002 ...................................................................15 Figure 8.5 Land cover change over west Lampung area in 1997-2002. ..........................................................16 Figure 9.2. Land cover change within BBS national park boundary in 1997-2002........................................18 Figure 9.3 Deforestation in the study area between 1997-2002 .......................................................................19 Figure 9.4. Damar growth and loss between 1997 and 2002...........................................................................20 Figure 9.5. Proportion of land cover which has replaced area of damar between 1997-2002......................21 Figure 9.6. Landcover within KdTI area in 1997 (left panel) and 2002 (right panel).....................................21 Annex 1. Comparison of old land cover map of Krui with 2002 maps resulted from satellite image
interpretation................................................................................................................................................23
Land cover Dynamics in West Lampung, Sumatra, Indonesia 4
1. Introduction
The southwestern part of Sumatra, Indonesia, has been subject to drastic forest cover change. A study committed by the Wildlife Conservation Society, PHKA and EU-ILRC in 2005 showed that 699,000 ha of primary forest in 1972 decreased to nearly half (343,748 ha) in 2002. This study also revealed that 26,161 ha of primary forest inside the Bukit Barisan Selatan (BBS) National Park have been converted to coffee plantations. The agroforestry systems in Southwest Sumatra range from sun and simple shaded coffee gardens to complex systems such as the damar-based agroforest. No recent study has quantified the landcover types outside of the BBS National Park, that have replaced forest cover in the area. Bukit Barisan Selatan (BBS) National Park, the third largest national park in Sumatra is located in the western part of the area, covering a straight line of almost 537 km along the coastline. Parts of the damar agroforests located northwest of the park fall under the Kawasan Dengan Tujuan Istimewa (KDTI) decree. The decree was signed in 1998, and acknowledges the right of damar farmers to use the damar forests located on state forest lands. With this study we aim to provide insight in the effects of the KdTI decree of 1998. To do so, we will identify the land cover changes that occurred in the Bukit Barisan Selatan National Park and KDTI area between 1997 and 2002.
2. Acknowledgements
This is a joint study between World Agroforestry Centre (ICRAF), Wildlife Conservation Society (WCS) and Centre International Forestry Research (CIFOR). All basic GIS data, including the 1997 satellite imagery, are property of the Wildlife Conservation Society. The 2002 satellite imagery was provided by the World Wildlife Fund.
3. Objectives By using remote sensing technology, this study will try to identify the landcover dynamics in BBS area and its surroundings. The objectives are to assess: 1) the dynamics of damar agroforests within and outside the KdTI zone; and 2) the role of agroforests located in the KdTI area in preventing encroachment in the National Park.
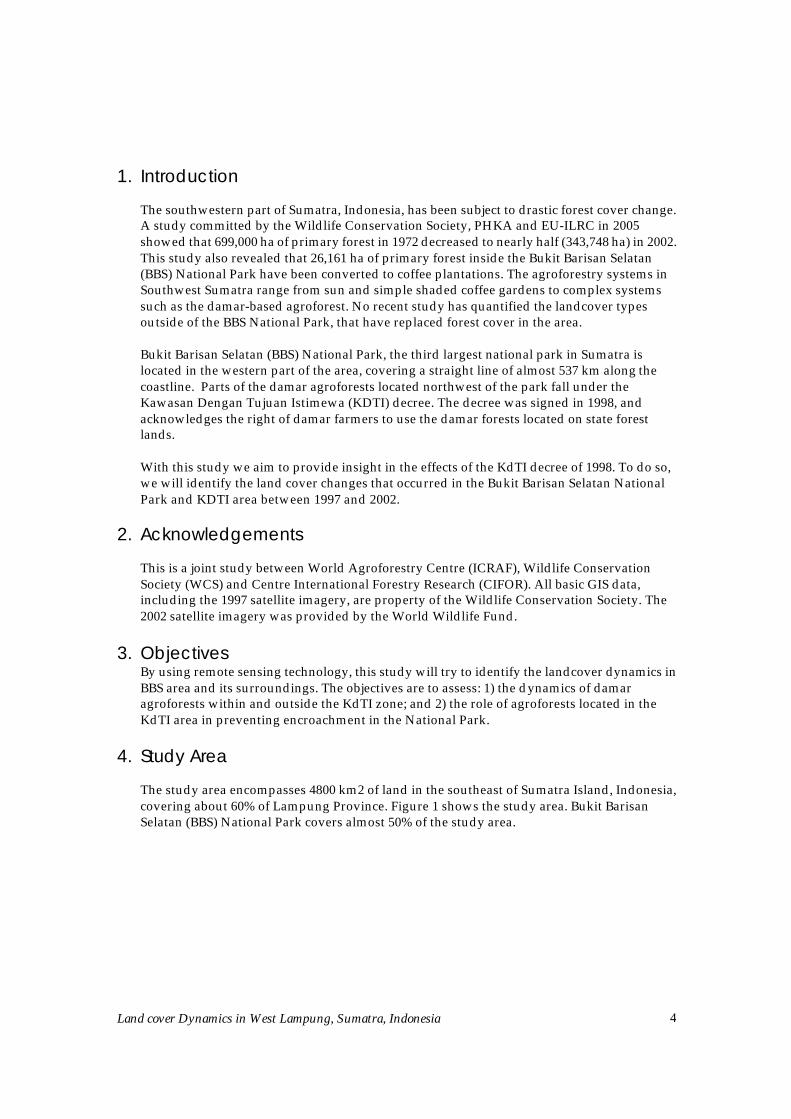
4. Study Area
The study area encompasses 4800 km2 of land in the southeast of Sumatra Island, Indonesia, covering about 60% of Lampung Province. Figure 1 shows the study area. Bukit Barisan Selatan (BBS) National Park covers almost 50% of the study area.
Land cover Dynamics in West Lampung, Sumatra, Indonesia 5
Figure 4.1. Study area in west Lampung
5. Materials
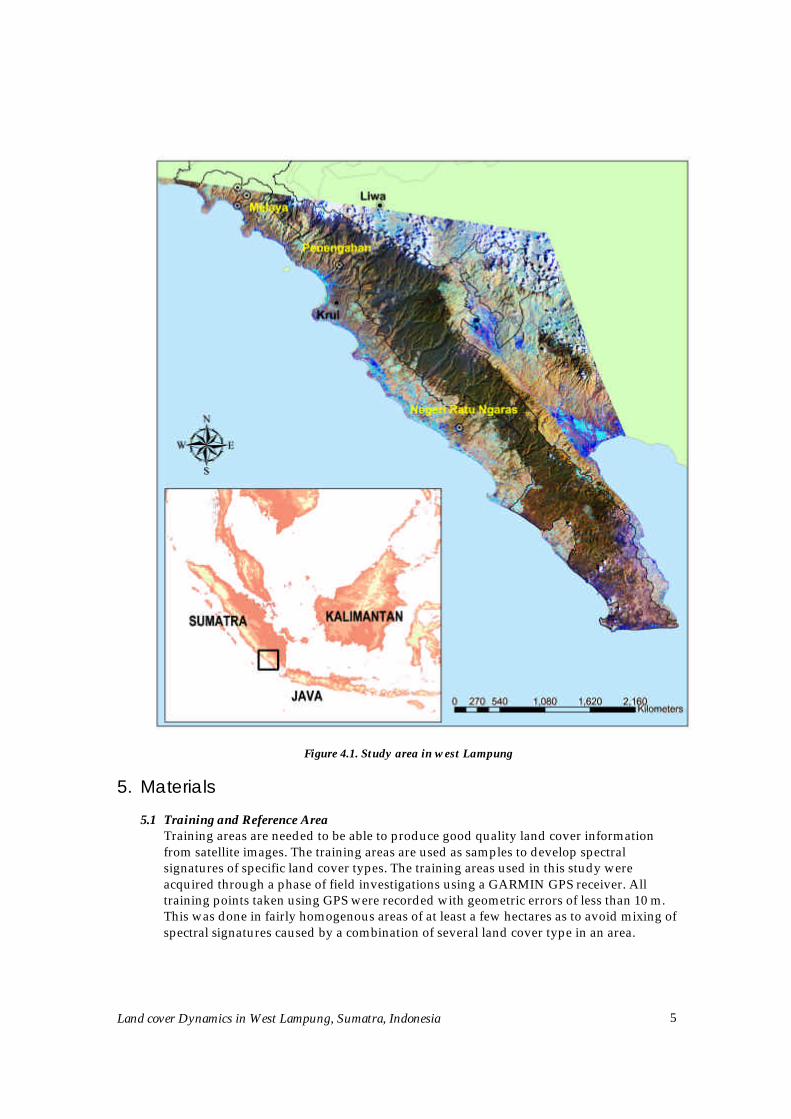
5.1 Training and Reference Area Training areas are needed to be able to produce good quality land cover information from satellite images. The training areas are used as samples to develop spectral signatures of specific land cover types. The training areas used in this study were acquired through a phase of field investigations using a GARMIN GPS receiver. All training points taken using GPS were recorded with geometric errors of less than 10 m. This was done in fairly homogenous areas of at least a few hectares as to avoid mixing of spectral signatures caused by a combination of several land cover type in an area.

Land cover Dynamics in West Lampung, Sumatra, Indonesia 6
Reference areas are sets of pixels which are used to assess the level of accuracy in the final land cover map. The reference areas are different in locations from the training areas to avoid bias in the accuracy assessment. Similar to the training areas, reference areas were registered using GPS set to acquire a good precision of geometric position.
5.2 Satellite Images Time series of Landsat images were used in this study. Landsat images have 30m spatial resolution where 1 pixel represents approximately 0.1 hectares in the earth surface. This resolution is considered to be relatively detailed as most of the landcover features in the study area are larger than 0.1 hectares.
5.3 Forest Cover Classification Most of the effort on this study will be focused on analyzing the dynamics of non-forest land cover types in study area. To be able to identify the non-forest area, time series forest cover classification of 1997 and 2002 from Gaveau, 2005 were used in this study. The forest cover was identify using the same Landsat images as the one used in this study. Accuracy of the forest cover map was analyzed using almost 10000 reference points generated from 1m-IKONOS images. The accuracy of forest cover was found to be 97% (Gaveau, 2005)
5.4 Additional Maps Additional maps were used as supporting information during the analysis of image classification results. Maps that were used are: a. KDTI boundary maps
KDTI boundary was digitized from 1:250000-Ministry of Forestry maps made in 23 January 1998 based on Ministry of Forestry decree No. 47/KPK-II/1998.
b. Limited Production Forest/Protection Forest (HPT/HL) Boundary HPT boundary was digitized from TGHK maps of Forestry Department. The digital map was adjusted to Bukit Barisan Selatan boundary.
c. Bukit Barisan Selatan National Park Boundary The national park boundaries were made by Wildlife Conservation Society in 2005. The maps was GPS field coordinates of the national park marking points.

Land cover Dynamics in West Lampung, Sumatra, Indonesia 7
Figure 5.1. Additional maps used in this study, Limited production forest and national park maps (left
panel) and KDTI maps (right panel)
6. Landcover Types in Study Area
Land cover can be defined as the observed (bio)physical cover on the earth's surface. When considering land cover in a pure and strict sense it should be confined to describe vegetation and man-made features (Di Gregorio and Jansen, 2000). In some cases, land cover is confused with the term of land use. FAO (2000) defined land use as the arrangements, activities and inputs people undertake in a certain land cover type to produce, change or maintain it. Definition of land use in this way establishes a direct link between land cover and the actions of people in their environment. In this study we use the term land cover rather than land use.
Based on a field campaign, 8 major land cover types in the study area were identified: a. Forest
Forest is defined as non-anthropogenic forest areas of old-growth vegetation dominated by close canopy cover (Gaveau, 2005). The forest cover classification derived from Gaveau, 2005 data also include natural shrub as a part of forest area.
b. Damar Agroforest Damar agroforest is an area dominated by damar trees (Shorea javanica) combined with different types of fruit trees, and other useful plants (e.g., plants with medicinal properties). Damar trees usually represent about 60 percent of the tree community and constitute the major canopy ensemble (Michon et al., 1998)
c. Multistrata coffee Agroforest Coffee grows under the shade of trees such as Erythrina lithosperma, Leucaena glauca, Albizzia falcata, and different types of fruit trees. These agroforests usually also include vegetables and medicinal plants.

Land cover Dynamics in West Lampung, Sumatra, Indonesia 8
d. Simple shade coffee Coffee plants are combined with dadap tree (Erythrina lithosperma), but simple shade coffee gardens have a much less dense canopy cover than multistrata coffee agroforests. The dadap tree is also used as a supporting tree for pepper. This class also includes sun coffee gardens, which have no shade trees. Over time, simple shade coffee gardens may evolve into multistrata coffee agroforests or damar agroforests.
e. Oil palm plantation Oil palm plantations are usually large-scale, intensively managed plantations. Oil palm plantations are characterized by a homogenous canopy structure with single dominant species, large even-aged stands, and regular spatial network of road and clear-cut boundaries with the neighboring vegetation. In the classification of Landsat 1997, the oilpalm class also include area of cleared land which has become oilpalm in 2002. The assumption used in this matter is that cleared land might represent oilpalm palm in the youngest age.
f. Shrub The term shrubs refer to areas covered by woody herbs, grass and non-woody herbs. These areas usually correspond to recently opened areas – the first phase of land conversion into estate plantation such as rubber and oil palm. These areas are usually represented by spectral signature close to cleared land.
g. Ricefield Rice fields include irrigated and non-irrigated rice field. These areas usually occur close to settlement areas.
h. Coconut Coconut fields are commonly found along the coastline. Coconut trees are usually grown in monocultures. Sometimes they are combined with other crops such as coffee, cocoa, and oil palm.

Land cover Dynamics in West Lampung, Sumatra, Indonesia 9
Figure 6.1. Some of the land cover types in West Lampung area: forest (upper left panel), damar agroforest
(middle left panel), simple shade coffee agroforest (lower left panel), oilpam (upper right panel), coconut (middle right panel), and ricefield (lower right panel).
7. Methods
7.1 Classification scheme We use a hierarchical classification system. The hierarchical classification accommodates different levels of information, starting with structured broad-level classes which allow further systematic subdivision into more detailed subclasses. At each level the defined classes are mutually exclusive. The classification process was conducted using object-based image classification approach. In contrast to traditional pixel-based image classification approach, the basic processing

Land cover Dynamics in West Lampung, Sumatra, Indonesia 10
units of object-based image classification are image-objects or segments, and not single pixels. Extraction of real world objects, proper in shape and proper in classification, is difficult with common, pixel-based approaches. Figure 7.1 shows the hierarchical classification scheme.
Figure 7.1. Classification scheme.
On the first level, we used the forest cover map produced by a previous study by the Wildlife Conservation Society (Gaveau et al.,2005) to distinguish forest and non-forest classes . The non-forest classes were then classified into high-density vegetation and low density vegetation based on Normalized Difference Vegetation Index (NDVI) value. NDVI is a comparison of near infra red spectral channels which are sensitive to the amount of green vegetation and visible spectral channels which mostly represent non vegetation signatures on the earth’s surface. After that, the classes were further distinguished into 8 major landcover types in the study area, using nearest neighborhood algorithm based on the spectral signatures obtained in the training areas.
7.2 Accuracy assessment Accuracy assessment determines the quality of information derived from remotely sensed data. The purpose of accuracy assessment is the identification and measurement of map errors. Quantitative accuracy assessment involves the comparison of a site on the map against reference information for the same site. The reference data are assumed to be correct. The assessment will be conducted using an error matrix. An error matrix compares information from reference sites to information on the map for a number of sampling areas. The matrix is a square array of numbers set out in rows and columns that express the labels of samples assigned to a particular category in one classification relative to the labels of samples assigned to a particular category in another classification.

Land cover Dynamics in West Lampung, Sumatra, Indonesia 11
1973 image 1988 image
Classification Classification
The matrix diagonal will show the agreement in terms of pixels between classified and reference data. ‘Overall accuracy’ resulting from the error matrix is often used as an indication of accuracy of the classified image. It should be noted, however, that the accuracy result is sample-based, so it depends on the sampling technique and the number of samples.
Figure 7.2. A sample of accuracy matrix (Congalton et. al, 1999)
7.3 Land cover change analysis
Landcover change analysis was conducted using post classification comparison methods. The methods compared thematic information derived from time series satellite imagery. Figure 7.3 shows the change detection method. The disadvantage of this approach is that it relies heavily on the precision and accuracy of the classified images. But the approach has the following advantages compared to other land cover detection methods: 1. Avoids errors caused by radiometric difference between remote sensing sensors.
Since all images are independently classified, radiometric difference can be eliminated.
2. Enables more detailed detection of landcover changes, even though this will depend on the quality of image classification process and the number of landcover classes for the multitemporal data (Sunar, 1998).
Figure 7.3. Post classification comparison process
8. Results
8.2 Landcover map 1997
The result of image classification on Landsat 1997 is shown in figure 8.1. Damar agroforest area encompassed 9% or about 44,500 ha of the study area. Damar agroforests are concentrated on the western coastline of Lampung province. Coffee agroforest in multistrata or simple shade systems covered almost 138,000 ha or about 30% of the whole

Land cover Dynamics in West Lampung, Sumatra, Indonesia 12
study area. Oil palm plantations occur in the southwestern part of the study area and covers almost 12,000 ha or 2.5% of the whole landscape.
Figure 8.1 Land cover map of west Lampung area in 1997. Forest class was derived from forest cover
data of Gaveau, 2005
Land cover Dynamics in West Lampung, Sumatra, Indonesia 13
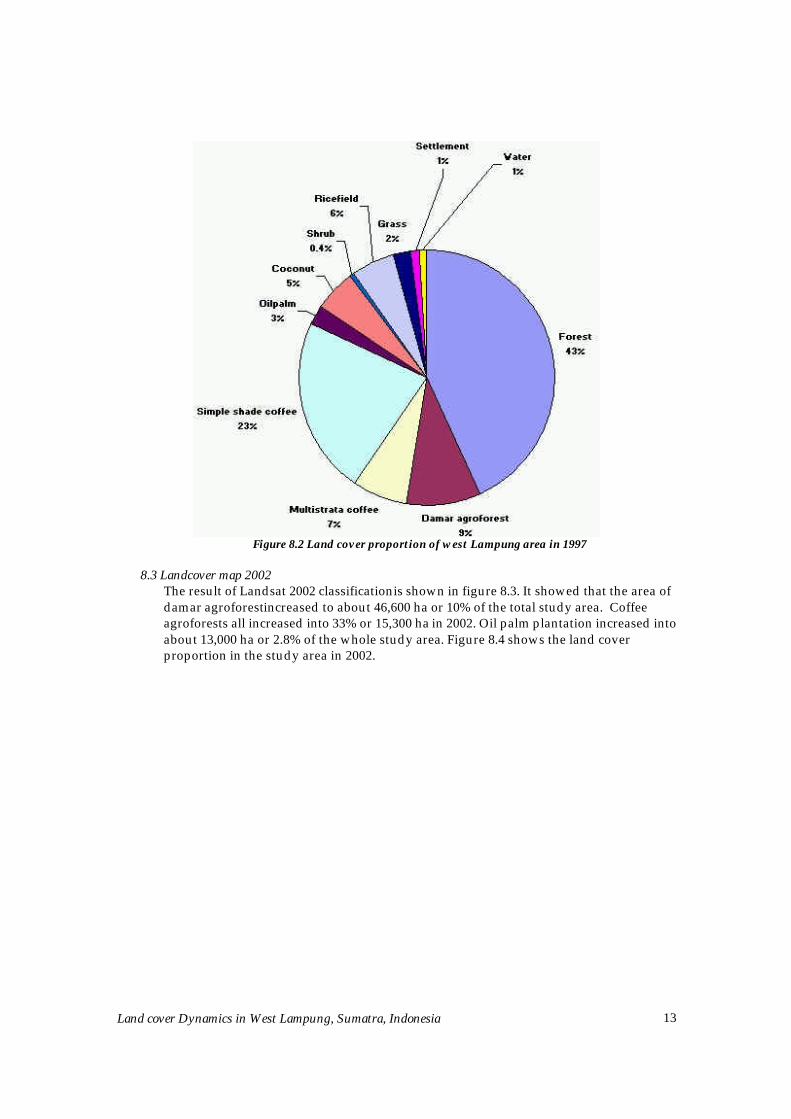
Figure 8.2 Land cover proportion of west Lampung area in 1997
8.3 Landcover map 2002
The result of Landsat 2002 classificationis shown in figure 8.3. It showed that the area of damar agroforestincreased to about 46,600 ha or 10% of the total study area. Coffee agroforests all increased into 33% or 15,300 ha in 2002. Oil palm plantation increased into about 13,000 ha or 2.8% of the whole study area. Figure 8.4 shows the land cover proportion in the study area in 2002.

Land cover Dynamics in West Lampung, Sumatra, Indonesia 14
Figure 8.3 Land cover map of west Lampung area in 2002

Land cover Dynamics in West Lampung, Sumatra, Indonesia 15
Figure 8.4 Land cover proportion of west Lampung area in 2002
8.4 Accuracy asessment of 2002 landcover map
The accuracy assessment was conducted using 369 reference points taken using a Garmin GPS receiver during a ground truthing field visit. Overall accuracy obtained for the non-forest classes is 86.2%. Table 8.1 shows the confusion matrix that resulted from the accuracy assessment. Accuracy of each land cover class is shown in table 8.2. Accuracy assessment was only conducted for the 2002 land cover map, since there is no data available to analyze the accuracy of 1997 maps.
Table 8.1 Error matrix of 2002 land cover maps

Land cover Dynamics in West Lampung, Sumatra, Indonesia 16
Table 8.2 Class accuracy of 2002 land cover maps
8.5 Landcover change 1997-2002 Land cover change analysis was conducted using post classification comparison. Figure 8.5 shows the overall land cover change in the area.
Figure 8.5 Land cover change over west Lampung area in 1997-2002.
9. Discussion
9.1 Overall Analysis of Forest Cover Data The forest cover data from Gaveau , 2005 shows a decrease of forest in the area within 1997-2002. About 15681 ha forest area, or approximately 8% of the total forest area in 1997 was disappeared in 2002. About 8017 ha within BBSNP inside study area disappeared within 5 years, which roughly means more than 1500 ha per year. In a longer period of observation, Gaveau et al, 2005, stated that in BBSNP 18 % forest was lost in 30 years (1972-2002),

Land cover Dynamics in West Lampung, Sumatra, Indonesia 17
averaging 0.62% per year. Post classification comparison analysis conducted on the area that was stated as deforestation in Gaveau , 2005 showed that most of forest was converted in to coffee classes.
Figure 9.1. Proportion of land cover which has replaced forest area between 1997-2002
9.2 Land cover dynamics within BBSNP and the buffer function of damar agroforests
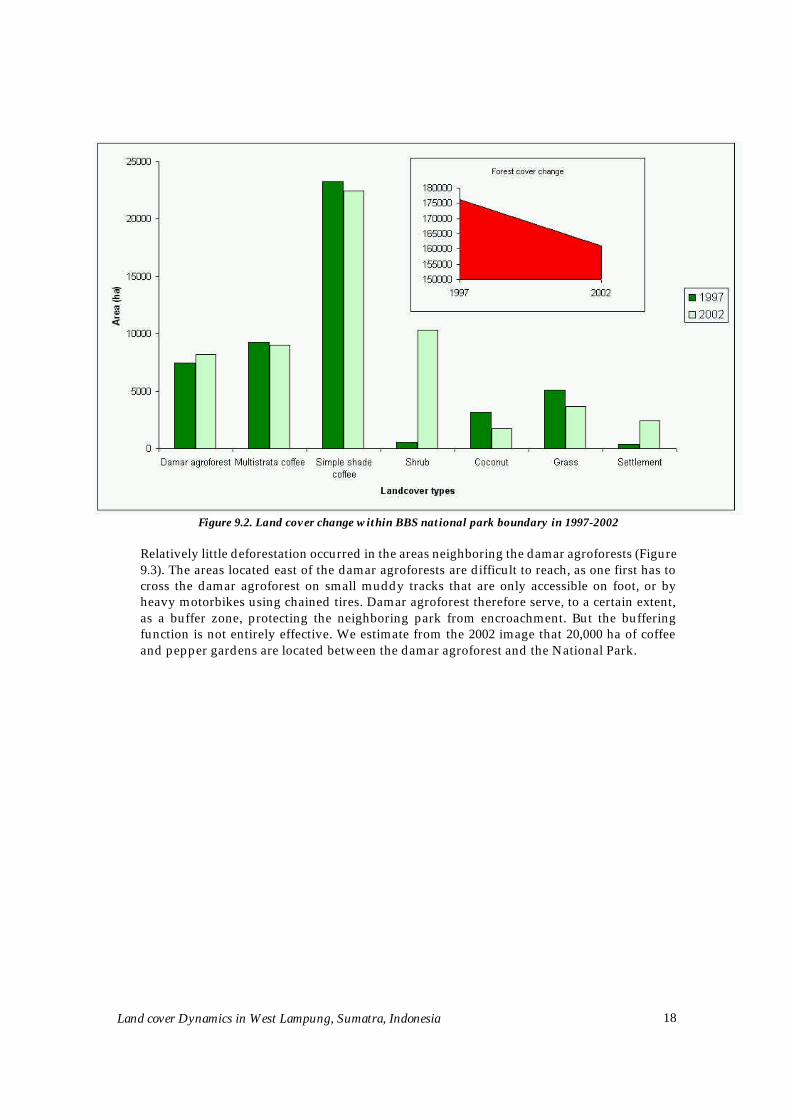
Figure 9.2 shows the land cover changes between 1997 and 2002 inside the Bukit Barisan Selatan National Park. Coffee agroforest areas appeared to decrease from 1997 to 2002. However, this result is not very accurate because some of the coffee areas in BBSNP were covered by cloud in 2002. Some damar agroforest is located within the BBSNP’s boundaries – mostly in central Pesisir. The area of damar agroforest increased by 800 ha from 1997 to 2002. This increase is considered as insignificant considering the error margin of the image classification for damar class (12 %) and the fact that the accuracy of 1997 classified image was not checked.
Land cover Dynamics in West Lampung, Sumatra, Indonesia 18
Figure 9.2. Land cover change within BBS national park boundary in 1997-2002
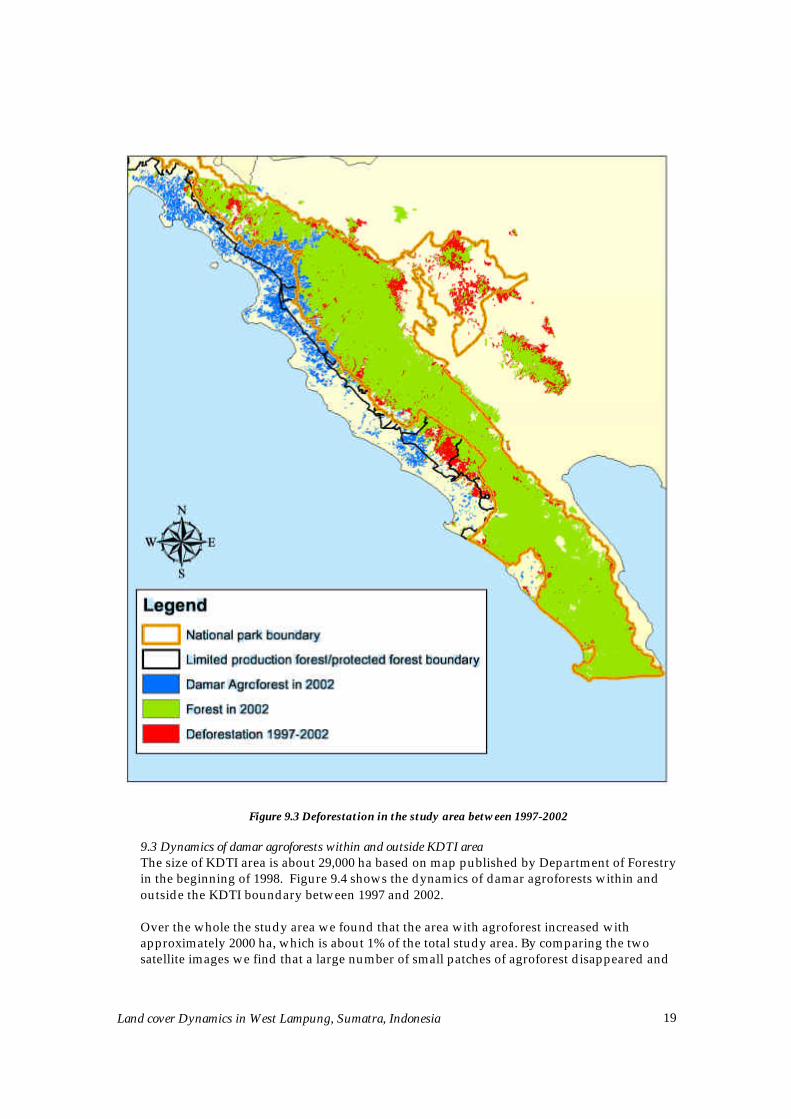
Relatively little deforestation occurred in the areas neighboring the damar agroforests (Figure 9.3). The areas located east of the damar agroforests are difficult to reach, as one first has to cross the damar agroforest on small muddy tracks that are only accessible on foot, or by heavy motorbikes using chained tires. Damar agroforest therefore serve, to a certain extent, as a buffer zone, protecting the neighboring park from encroachment. But the buffering function is not entirely effective. We estimate from the 2002 image that 20,000 ha of coffee and pepper gardens are located between the damar agroforest and the National Park.
Land cover Dynamics in West Lampung, Sumatra, Indonesia 19
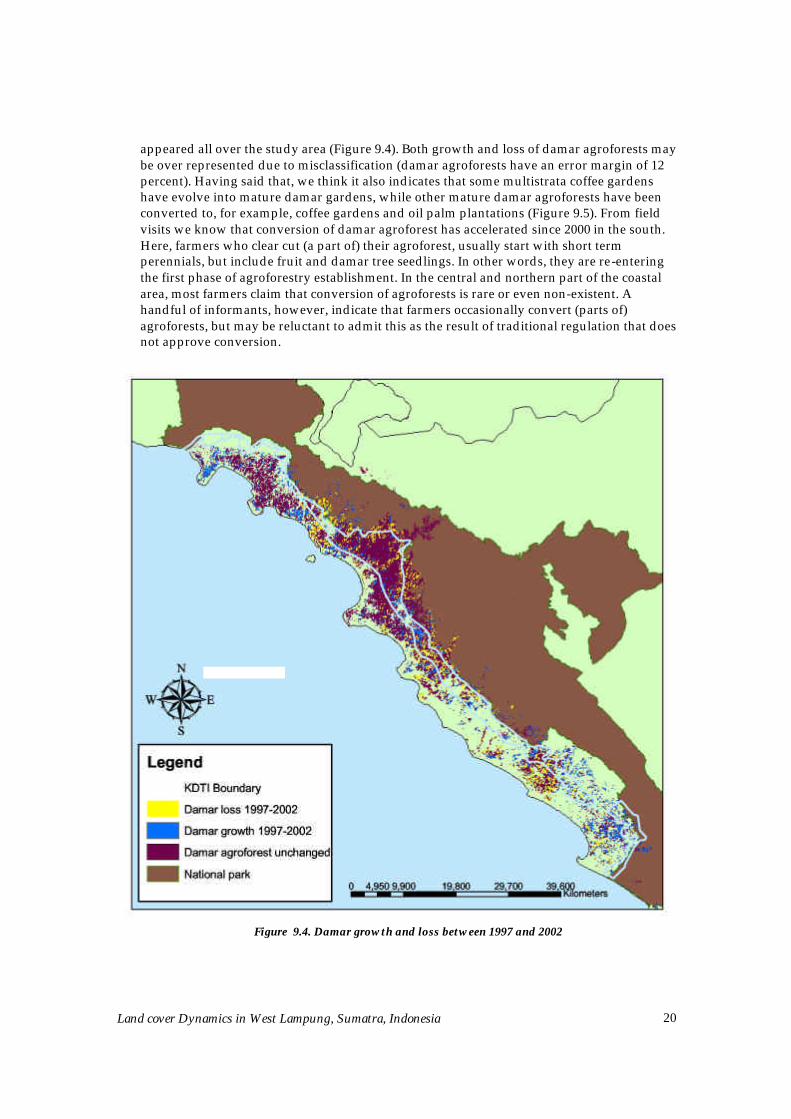
Figure 9.3 Deforestation in the study area between 1997-2002 9.3 Dynamics of damar agroforests within and outside KDTI area The size of KDTI area is about 29,000 ha based on map published by Department of Forestry in the beginning of 1998. Figure 9.4 shows the dynamics of damar agroforests within and outside the KDTI boundary between 1997 and 2002. Over the whole the study area we found that the area with agroforest increased with approximately 2000 ha, which is about 1% of the total study area. By comparing the two satellite images we find that a large number of small patches of agroforest disappeared and
Land cover Dynamics in West Lampung, Sumatra, Indonesia 20
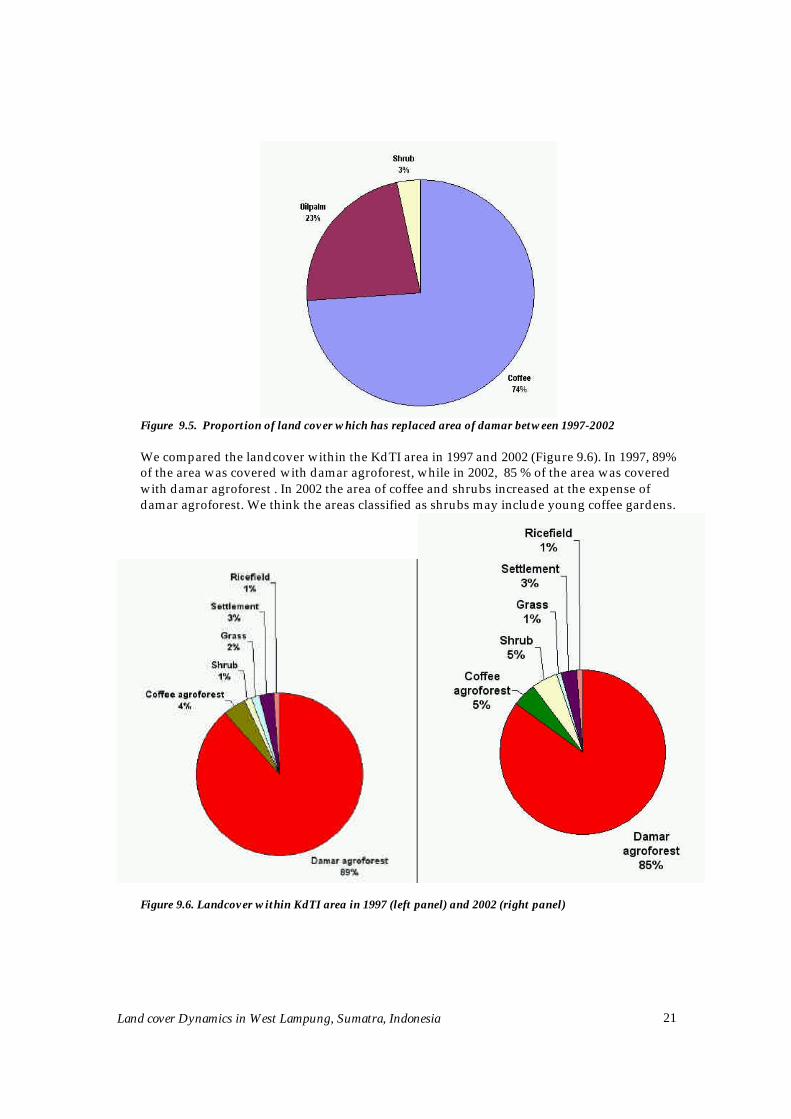
appeared all over the study area (Figure 9.4). Both growth and loss of damar agroforests may be over represented due to misclassification (damar agroforests have an error margin of 12 percent). Having said that, we think it also indicates that some multistrata coffee gardens have evolve into mature damar gardens, while other mature damar agroforests have been converted to, for example, coffee gardens and oil palm plantations (Figure 9.5). From field visits we know that conversion of damar agroforest has accelerated since 2000 in the south. Here, farmers who clear cut (a part of) their agroforest, usually start with short term perennials, but include fruit and damar tree seedlings. In other words, they are re-entering the first phase of agroforestry establishment. In the central and northern part of the coastal area, most farmers claim that conversion of agroforests is rare or even non-existent. A handful of informants, however, indicate that farmers occasionally convert (parts of) agroforests, but may be reluctant to admit this as the result of traditional regulation that does not approve conversion.
Figure 9.4. Damar growth and loss between 1997 and 2002
Land cover Dynamics in West Lampung, Sumatra, Indonesia 21
Figure 9.5. Proportion of land cover which has replaced area of damar between 1997-2002
We compared the landcover within the KdTI area in 1997 and 2002 (Figure 9.6). In 1997, 89% of the area was covered with damar agroforest, while in 2002, 85 % of the area was covered with damar agroforest . In 2002 the area of coffee and shrubs increased at the expense of damar agroforest. We think the areas classified as shrubs may include young coffee gardens.
Figure 9.6. Landcover within KdTI area in 1997 (left panel) and 2002 (right panel)
Land cover Dynamics in West Lampung, Sumatra, Indonesia 22
10. Conclusions
?? Relatively, only small deforestation occurred in the forest neighboring the damar agroforest area. We think this is partly related to the buffer function of the damar agroforest. The damar agroforest is, however, not 100% effective as bufferzone, as there are several areas in the Pesisir where coffee gardens are being established by opening the forest adjacent to the damar agroforest.
?? According to our assessment of the landcover changes the area of damar agroforest within the official boundaries of the KdTI decree has decreased with 4%, while the area of damar agroforest in the total study area increased slightly. In other words, the KdTI decree may not have prevented conversion of damar agroforest within its official boundaries, but, overall, the damar agroforestry system seems stable.
?? There are indications that the damar system is best viewed as a dynamic system, with coffee gardens maturing into damar agroforests, while other patches of mature damar gardens are being converted. The extend to which this is happening is hard to asses based on the satellite images, because we deal with small patches susceptible to misclassification. Farmers seem to be reluctant to admit conversion of damar agroforest. It is important for future research to assess in the field to what extend farmers are treating there agroforest as permanent systems, or as extended fallows.
11. References
Congalton, R. G. and K. Green. 1999. Assessing the accuracy of remotely sensed data: Principles and practices. Lewis Publishers, Boca Raton.
Di Gregorio. FAO Land Cover Classification: A Dichotomous, Modular-Hierarchical Approach. paper presented at the US Federal Geographic Data Committee (FGDC) Vegetation Subcommittee and Earth Cover Working Group meeting in Washington, DC 15-17 October 1996. [online] URL: http://www.fao.org/waicent/faoinfo/agricult/AGL/AGLS/FGDCFAO.HTM
Gaveau,David L.A., Wandono, Hagnyo, Setiabudi,Firman , Aslan.(2005). Three Decades of Deforestation in Southwest Sumatra: did Protected Areas Halt Forest Degradation and Facilite Regeneration? Wildlife Conservation Society Report.
Louisa J.M. Jansen (FAO/AGLS) and Antonio Di Gregorio (GCP/RAF/287/ITA Africover East Africa Project, SDRN). From Land Cover and Land Use Information Systems for European Policy Needs: Proceedings, Eurostat Seminar, 21-23 January 1998, Luxembourg
Michon, G.; de Foresta, H.; Kusworo, A. & Levang, P. 1998. The damar agroforest of Krui, Indonesia: justice for forest farmers. In C. Zerner, ed. People, plants and justice. Columbia, USA, Columbia University Press.
Sunar, F. 1998. An Analysis of Changes in a Multi Date Dataset : a Case Study in Ikitelli Area, Istambul Turkey. International Journal of Remote Sensing 19:2, 225-235.
Verbist, Bruno, Eka Dinata Putra, Andree and Budidarsono,Suseno . 2005. Driving factors of land use change and its effects on watershed functions in a coffee agroforestry system in Sumberjaya (Lampung, Sumatra). Agroforestry System.
Land cover Dynamics in West Lampung, Sumatra, Indonesia 23
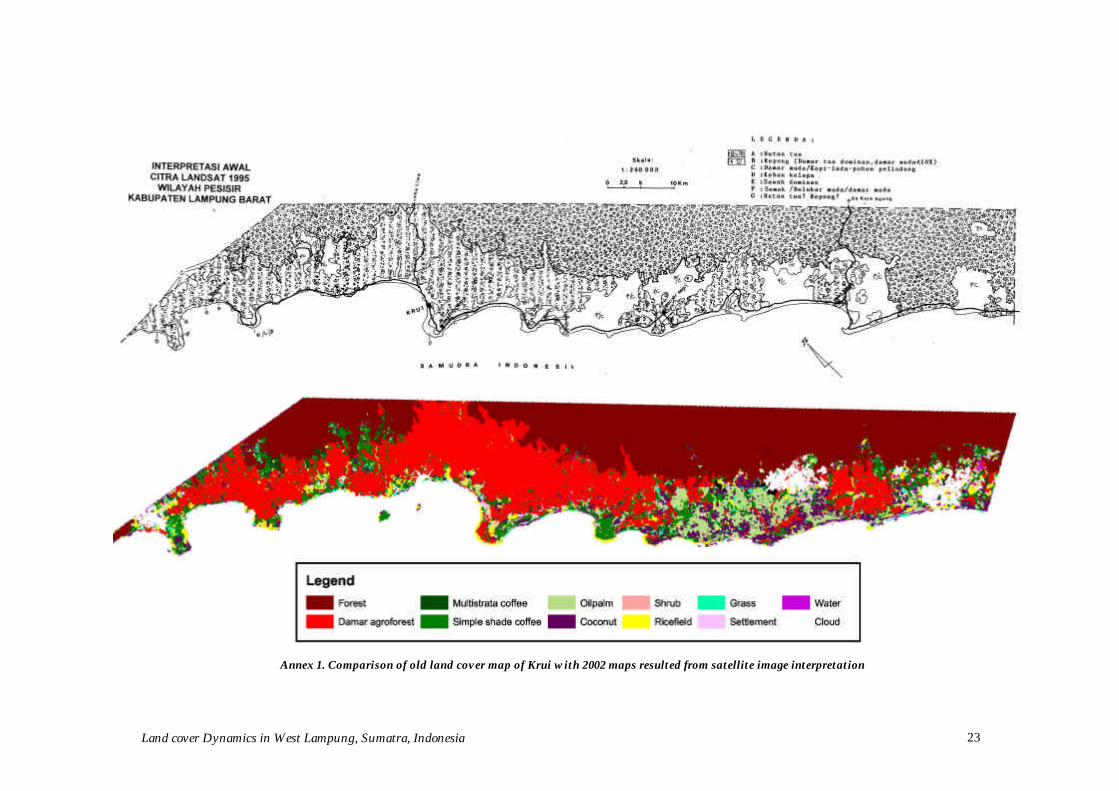
Annex 1. Comparison of old land cover map of Krui with 2002 maps resulted from satellite image interpretation

Land cover Dynamics in West Lampung, Sumatra, Indonesia 24

Land cover Dynamics in West Lampung, Sumatra, Indonesia 25