landdffiillll eccoovverrss:: wwaatteerr baa llaannccee,, … web/22nd... · 2018-12-18 · peea at...
TRANSCRIPT
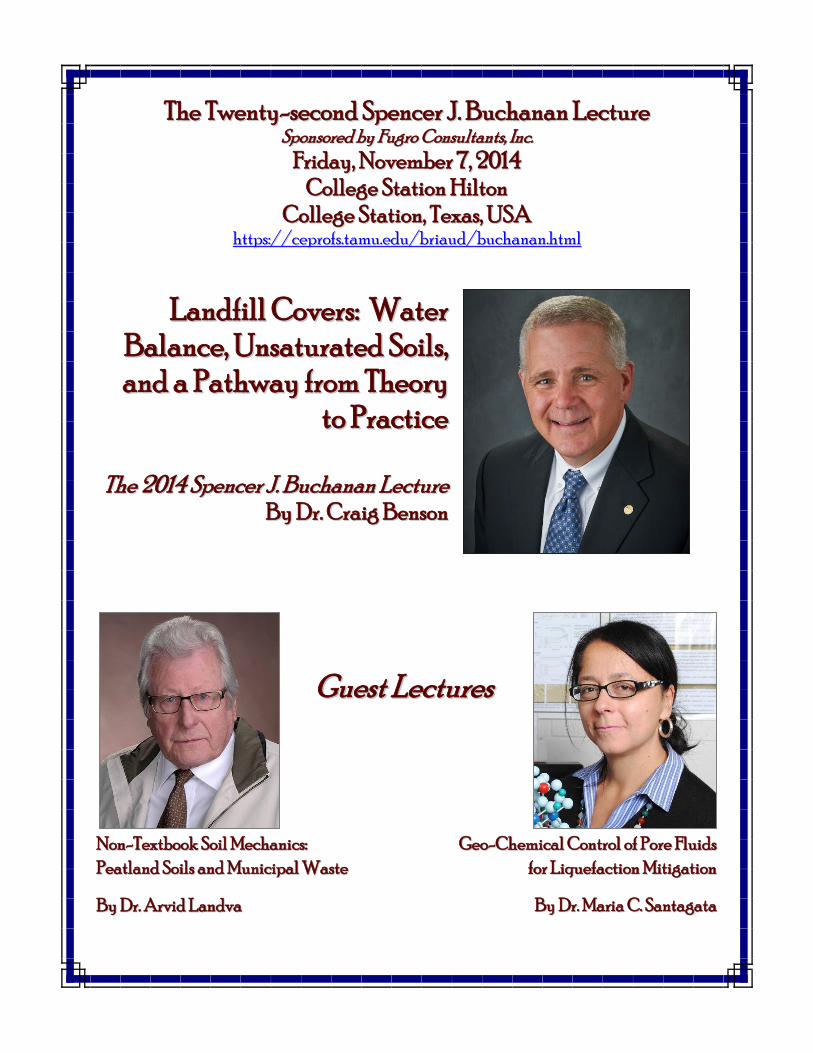
TThhee TTwweennttyy--sseeccoonndd SSppeenncceerr JJ.. BBuucchhaannaann LLeeccttuurree SSppoonnssoorreedd bbyy FFuuggrroo CCoonnssuullttaannttss,, IInncc..
FFrriiddaayy,, NNoovveemmbbeerr 77,, 22001144
CCoolllleeggee SSttaattiioonn HHiillttoonn
CCoolllleeggee SSttaattiioonn,, TTeexxaass,, UUSSAA hhttttppss::////cceepprrooffss..ttaammuu..eedduu//bbrriiaauudd//bbuucchhaannaann..hhttmmll
LLaannddffiillll CCoovveerrss:: WWaatteerr
BBaallaannccee,, UUnnssaattuurraatteedd SSooiillss,,
aanndd aa PPaatthhwwaayy ffrroomm TThheeoorryy
ttoo PPrraaccttiiccee
TThhee 22001144 SSppeenncceerr JJ.. BBuucchhaannaann LLeeccttuurree
BByy DDrr.. CCrraaiigg BBeennssoonn
NNoonn--TTeexxttbbooookk SSooiill MMeecchhaanniiccss::
PPeeaattllaanndd SSooiillss aanndd MMuunniicciippaall WWaassttee
BByy DDrr.. AArrvviidd LLaannddvvaa
GGuueesstt LLeeccttuurreess
GGeeoo--CChheemmiiccaall CCoonnttrrooll ooff PPoorree FFlluuiiddss
ffoorr LLiiqquueeffaaccttiioonn MMiittiiggaattiioonn
BByy DDrr.. MMaarriiaa CC.. SSaannttaaggaattaa

Table of Contents
Spencer J. Buchanan 1
Donors 3
Spencer J. Buchanan Lecture Series 6
Agenda 7
Biographies
Dr. Craig Benson, 2014 Spencer J. Buchanan Lecturer
Dr. Arvid Landva, Guest Lecturer
Dr. Maria Caterina C. Santagata, Guest Lecturer
8
“Landfill Covers: water balance, unsaturated soils, and a pathway
from theory to practice”
Dr. Craig Benson
12
“Non-textbook soil mechanics: peatland soils and municipal
waste”
Dr. Arvid Landva
46
“Geo-chemical control of pore fluids for liquefaction mitigation” Dr. Maria Caterina Santagata
48
Pledge Information 55

SPENCER J. BUCHANAN
Spencer J. Buchanan, Sr. was born in 1904 in Yoakum, Texas. He graduated from Texas A&M University with a degree in Civil Engineering in 1926, and earned graduate
and professional degrees from the Massachusetts Institute of Technology and Texas A&M University.
He held the rank of Brigadier General in the U.S. Army Reserve, (Ret.), and
organized the 420th Engineer Brigade in Bryan-College Station, which was the only such unit in the Southwest when it was created. During World War II, he served the U.S. Army Corps of Engineers as an airfield engineer in both the U.S. and throughout the islands of the
Pacific Combat Theater. Later, he served as a pavement consultant to the U.S. Air Force and during the Korean War he served in this capacity at numerous forward airfields in the combat zone. He held numerous military decorations including the Silver Star. He was
founder and Chief of the Soil Mechanics Division of the U.S. Army Waterways Experiment Station in 1932, and also served as Chief of the Soil Mechanics Branch of the Mississippi
River Commission, both being Vicksburg, Mississippi.
Professor Buchanan also founded the Soil Mechanics Division of the Department of Civil Engineering at Texas A&M University in 1946. He held the title of Distinguished Professor of Soil Mechanics and Foundation Engineering in that department. He retired
from that position in 1969 and was named professor Emeritus. In 1982, he received the College of Engineering Alumni Honor Award from Texas A&M University.
He was the founder and president of Spencer J. Buchanan & Associates, Inc., Consulting Engineers, and Soil Mechanics Incorporated in Bryan, Texas. These firms were
involved in numerous major international projects, including twenty-five RAF-USAF airfields in England. They also conducted Air Force funded evaluation of all U.S. Air
Training Command airfields in this country. His firm also did foundation investigations for downtown expressway systems in Milwaukee, Wisconsin, St. Paul, Minnesota; Lake Charles, Louisiana; Dayton, Ohio, and on Interstate Highways across Louisiana. Mr.
Buchanan did consulting work for the Exxon Corporation, Dow Chemical Company, Conoco, Monsanto, and others.
Professor Buchanan was active in the Bryan Rotary Club, Sigma Alpha Epsilon
Fraternity, Tau Beta Pi, Phi Kappa Phi, Chi Epsilon, served as faculty advisor to the Student
Chapter of the American Society of Civil Engineers, and was a Fellow of the Society of American Military Engineers. In 1979 he received the award for Outstanding Service from the American Society of Civil Engineers.
Professor Buchanan was a participant in every International Conference on Soil Mechanics and Foundation Engineering since 1936. He served as a general chairman of the International Research and Engineering Conferences on Expansive Clay Soils at Texas
A&M University, which were held in 1965 and 1969.
Spencer J. Buchanan, Sr., was considered a world leader in geotechnical engineering, a Distinguished Texas A&M Professor, and one of the founders of the Bryan Boy’s Club. He died on February 4, 1982, at the age of 78, in a Houston hospital after an
illness, which lasted several months.
The Spencer J. Buchanan ’26 Chair in Civil Engineering
The College of Engineering and the Department of Civil Engineering gratefully recognize the
generosity of the following individuals, corporations, foundations, and organizations for their part in helping to establish the Spencer J. Buchanan ’26 Professorship in Civil Engineering. Created in 1992 to honor a world leader in soil mechanics and foundation engineering, as well as a
distinguished Texas A&M University professor, the Buchanan Professorship supports a wide range of enriched educational activities in civil and geotechnical engineering. In 2002, this professorship became the Spencer J. Buchanan ’26 Chair in Civil Engineering.
Donors
Founding Donor
Mr. C. Darrow Hooper ‘53
Benefactors ($5,000+)
Mr. Douglas E. Flatt ’53
ETTL Engineers and Consultants, Inc.
Fugro Consultants, Inc.
Patrons ($1,000-$4,999)
Aviles Engineering Corporation
Dr. Dionel E. Aviles ‘53
Dr. Rudolph Bonaparte
Dr. Mark W. Buchanan
Mr. & Mrs. Spencer J. Buchanan, Jr. ‘53
The Dow Chemical Foundation
Dr. Wayne A. Dunlap ‘51
Br. Gen. John C.B. Elliott
ExxonMobil Foundation
Mr. Perry G. Hector ‘54
Dr. Allen Marr
Dr. Jose M. Roesset
Spencer J. Buchanan Associates, Inc.
Dr. Kenneth H. Stokoe
Dr. Lyle A. Wolfskill ’53
Fellows ($500-$999)
Mr. & Mrs. John R. Birdwell ‘53
R.R. & Shirley Bryan
Mr. Joe L. Cooper ‘56
Mr. George D. Cozart ’74
Mr. & Mrs. Peter C. Forster ‘63
Harvey J. Haas, Col USAF (Ret) ‘59
Mr. Conrad S. Hinshaw ‘39
O’Malley & Clay, Inc.
Mr. Robert S. Patton ‘61
Mr. Donald R. Ray ‘68
Mr. Alton T. Tyler ‘44

Members ($100-$499)
Adams Consulting Engineers, Inc.
Lt. Col. Demetrios A. Armenakis ‘58
Mr. Eli F. Baker ‘47
Mr. & Mrs. B.E. Beecroft ‘51
Dean Fred J. Benson ‘36
Mr. & Mrs. Willy F. Bohlmann, Jr. ‘50
Mr. Craig C. Brown ‘75
Mr. Donald N. Brown ‘43
Ronald C. Catchings, LTC USA (Ret) ‘65
Mr. Ralph W. Clement ‘57
Coastal Bend Engineering Associates
Mr. & Mrs. James T. Collins
Mr. John W. Cooper, III ‘46
Mr. George W. Cox ‘35
Mr. Murray A. Crutcher, Jr. ‘68
Dodd Geotechnical Engineering
Mr. Donald D. Dunlap ‘58
Enterprise Engineers, Inc.
Edmond L. Faust, Jr. Col (Ret) ‘47
Mr. David T. Finley ‘82
Mr. Charles B. Foster, Jr. ‘38
Mr. Benjamin D. Franklin ‘57
Mr. Thomas E. Frazier ‘77
G.R. Birdwell Construction, L.P.
Mr. William F. Gibson ‘59
Dr. Anand V Govindasamy '09
Mr. Cosmo F. Guido ‘44
Joe G. Hanover, Gen (Ret) ‘40
Mr. & Mrs. John L. Hermon ‘63
William & Mary Holland
Dr. W. Ronald Hudson ‘54
Mr. Homer A. Hunter ‘25
Ms. Lyllis Lee Hutchin
Mr. & Mrs. Walter J. Hutchin ‘47
Mr. & Mrs. Shoudong Jiang ‘01
Brig. Gen. Hubert O. Johnson, Jr. ‘41
Lt. Col. William T. Johnson, Jr. ‘50
Mr. Homer C. Keeter, Jr. ‘47
Mr. Richard W. Kistner ‘65
Mr. Donald W. Klinzing
Andrew & Bobbie Laymay
Dr. YanFeng Li ‘04
Frank Lane Lynch, Col USA (Ret) ‘60
Marathon Oil Company
Major General Charles I McGinnis ‘49
Mr. Jes D. McIver ‘51
Mr. Charles B. McKerall, Jr. ‘50
Morrison-Knudsen Co., Inc.
Dr. James D. Murff ‘70
Mr. & Mrs. Frank H. Newnam, Jr.
Mr. & Mrs. Jack R. Nickel ‘68
Northrup Grumman Foundation
Mr. Roy E. Olson
Dr. Nicholas & Martha Paraska ‘47
Mr. & Mrs. Daniel E. Pickett ‘63
Pickett-Jacobs Consultants, Inc.
Mr. Richard C. Pierce ‘51
Mr. & Mrs. Robert J. Province ‘60
Mr. David B. Richardson ‘76
LTC David E. Roberts ‘61
Mr. Walter E. Ruff ‘46
Mr. Weldon Jerrell Sartor ‘58
Mr. Charles S. Skillman, Jr. ‘57
Soil Drilling Services
Mr. Louis L. Stuart, Jr. ‘52
Mr. Ronald G. Tolson, Jr. ‘60
Mr. & Mrs. Hershel G. Truelove ‘52
Mr. Kenneth C. Walker ‘78 Mr. & Mrs. Thurman Wathen Mr. Donald R. Wells ‘70
Williams Gas Pipelines-Transco
Mr. Andrew L. Williams, Jr. ‘50
Dr. James T.P. Yao
Associates ($25-$99)
Mr. & Mrs. John Paul Abbott
Mr. & Mrs. Charles A. Arnold ‘55
Bayshore Surveying Instruments Co.
Colonel Carl F. Braunig, Jr. ‘45
Mrs. E. D. Brewster
Mr. Robert P. Broussard
Mr. & Mrs. Norman J. Brown ‘49
Mr. Kenneth W. Korb ‘67
Dr. & Mrs. George W. Kunze
Mr. Larry K. Laengrich ‘86
Mr. Monroe A. Landry ‘50
Lawrence & Margaret Laurion
Mr. & Mrs. Charles A Lawler
Mrs. John M. Lawrence, Jr.

Mr. Stewart E. Brown
John Buxton, LTC USA (Ret) ‘55
Caldwell Jewelers
Lawrence & Margaret Cecil
Mr. & Mrs. Howard T. Chang ‘63
Mrs. Lucille Hearon Chipley
Mr. & Mrs. Joseph R. Compton
Caroline R. Crompton
Harry M. & Josephine Coyle
Mr. Robert J. Creel ‘53
Maj Gen Robert E. Crosser ‘49
Mr. O. Dexter Dabbs
Guy & Mary Bell Davis
Robert & Stephanie Donaho
Mr. Charles A. Drabek
Mr. & Mrs. Stanley A. Duitscher ‘55
Mr. & Mrs. Nelson D. Durst
Mr. George H. Ewing ‘46
Virginia & Edmond Faust
First City National Bank of Bryan
Mr. & Mrs. Neil E. Fisher ‘75
Mr. & Mrs. Albert R. Frankson
Maj. Gen Guy & Margaret Goddard
Lt. Col. John E. Goin ‘68
Mr. & Mrs. Dick B. Granger
Col. Howard J. Guba ‘63
Halliburton Foundation, Incorporated
James & Doris Hannigan
Mr. Scott W. Holman III ‘80
Lt. Col. & Mrs. Lee R. Howard ‘52
Mrs. Jack Howell
Col. Robert & Carolyn Hughes
Mr. & Mrs. William V. Jacobs ‘73
Mr. Ronald S. Jary ‘65
Richard & Earlene G. Jones
Stanley R. Kelley, COL USA (Ret) ‘47
Mr. Elmer E. Kilgore ‘54
Mr. Kenneth W. Kindle ‘57
Mr. Tom B. King
Lt. Col. Walter A. Klein ‘60
Lockwood, Andrews, & Newman, Inc.
Lt. Col. Linwood E. Lufkin ‘63
Robert & Marilyn Lytton
W.T. McDonald
James & Maria McPhail
Mr. & Mrs. Clifford A. Miller
Minann, Inc.
Jack & Lucille Newby
Leo Odom
Mr. & Mrs. Bookman Peters
Mr. Charles W. Pressley, Jr. ‘47
Mr. & Mrs. D.T. Rainey
Maj. Gen. & Mrs. Andy Rollins
Mr. J. Jack Rollins
Mr. & Mrs. John M. Rollins
Mr. & Mrs. J.D. Rollins, Jr.
Brig. Gen. Allen D. Rooke, Jr. ‘46
Mr. Paul D. Rushing ‘60
Schrickel, Rollins & Associates, Inc.
William & Mildred H. Shull
S.K. Engineering
Mr. Milbourn L. Smith ‘60
Southwestern Laboratories
Mr. & Mrs. Homer C. Spear
Mr. & Mrs. Robert F. Stiles ‘79
Mr. & Mrs. Robert L. Thiele, Jr.’63
W. J. & Mary Lea Turnbull
Mr. & Mrs. John P. Tushek
Mr. Edward Varela ‘88
Troy & Marion Wakefield
Ms. Constance H. Wakefield
Mr. & Mrs. Allister M. Waldrop
Mr. Robert R. Werner ‘57
Mr. & Mrs. William M. Wolf, Jr. ‘65
Mr. & Mrs. John S. Yankey III ‘66
Dr. Congpu Yao ‘13
H.T. Youens, Sr
Mr. William K. Zickler ‘83
Mr. Ronald P. Zunker ‘62
Every effort was made to ensure the accuracy of this list. If you feel there is an error, please contact
the Engineering Development Office at 979-845-5113. A pledge card is enclosed on the last page
for potential contributions.

Spencer J. Buchanan Lecture Series
1993 Ralph B. Peck “The Coming of Age of Soil Mechanics: 1920 - 1970”
1994 G. Geoffrey Meyerhof “Evolution of Safety Factors and Geotechnical Limit State Design”
1995 James K. Mitchell “The Role of Soil Mechanics in Environmental Geotechnics”
1996 Delwyn G. Fredlund “The Emergence of Unsaturated Soil Mechanics”
1997 T. William Lambe “The Selection of Soil Strength for a Stability Analysis”
1998 John B. Burland “The Enigma of the Leaning Tower of Pisa”
1999 J. Michael Duncan “Factors of Safety and Reliability in Geotechnical Engineering”
2000 Harry G. Poulos “Foundation Settlement Analysis – Practice Versus Research”
2001 Robert D. Holtz “Geosynthetics for Soil Reinforcement”
2002 Arnold Aronowitz “World Trade Center: Construction, Destruction, and Reconstruction”
2003 Eduardo Alonso “Exploring the Limits of Unsaturated Soil Mechanics: the Behavior of
Coarse Granular Soils and Rockfill”
2004 Raymond J. Krizek “Slurries in Geotechnical Engineering”
2005 Tom D. O’Rourke “Soil-Structure Interaction Under Extreme Loading Conditions”
2006 Cylde N. Baker “In Situ Testing, Soil-Structure Interaction, and Cost Effective Foundation
Design”
2007 Ricardo Dobry “Pile response to Liquefaction and Lateral Spreading: Field Observations
and Current Research”
2008
Kenneth Stokoe
"The Increasing Role of Seismic Measurements in Geotechnical
Engineering"
2009 Jose M. Roesset “Some Applications of Soil Dynamics”
2010 Kenji Ishihara “Forensic Diagnosis for Site-Specific Ground Conditions in Deep
Excavations of Subway Constructions”
2011 Rudolph Bonaparte “Cold War Legacy – Design, Construction, and Performance of a Land-
Based Radioactive Waste Disposal Facility”
2012 W. Allen Marr “Active Risk Management in Geotechnical Engineering”
2013 Andrew J. Whittle “ Importance of Undrained Behavior in the Analysis of Soil-Structure
Interaction”
2014 Craig H. Benson “Landfill Covers: Water Balance, Unsaturated Soils, and a Pathway from
Theory to Practice”
The texts of the lectures and a DVD’s of the presentations are available by contacting:
Dr. Jean-Louis Briaud
Spencer J. Buchanan ’26 Chair Professor
Zachry Department of Civil Engineering
Texas A&M University
College Station, TX 77843-3136, USA
Tel: 979-845-3795
Fax: 979-845-6554
E-mail: [email protected]
https://ceprofs.civil.tamu.edu/briaud/buchanan%20web/lecture_series.htm

AGENDA
The Twenty-second Spencer J. Buchanan Lecture
Friday, November 7, 2014
College Station Hilton
2:00 p.m. Introduction by Jean-Louis Briaud
2:05 p.m. Katherine Banks – Dwight Look College of Engineering
2:10 p.m. Robin Autenrieth – Zachry Department of Civil Engineering
2:15 p.m. Gary Gregory – ASCE Geo Institute
2:20 p.m. Introduction of Arvid Landva by Jean-Louis Briaud
2:25 p.m. “Non-Textbook Soil Mechanics: Peatland Soils and Municipal
Waste”
Lecture by Arvid Landva
2:55 p.m. Introduction of Maria Caterina Santagata by Jean-Louis Briaud
3:00 p.m. “Geo-Chemical Control of Pore Fluids for Liquefaction
Mitigation”
Lecture by Maria Caterina Santagata
3:30 p.m. Introduction of Craig Benson by Jean-Louis Briaud
3:35 p.m. “Landfill Covers: Water Balance, Unsaturated Soils, and a
Pathway from Theory to Practice”
The 2014 Buchanan Lecture by Craig Benson
4:35 p.m. Discussion
4:50 p.m. Closure with Jean-Louis Briaud
5:00 p.m. Photos followed by a Reception at the home of Jean-Louis and
Janet Briaud

BBiiooggrraapphhiieess

Craig H. Benson, Ph.D., PE, NAE Wisconsin Distinguished Professor
Director of Sustainability Research & Education, UW-Madison Chair, Civil & Environmental Engineering, Geological Engineering
Dr. Benson is a Distinguished Professor at the University of
Wisconsin-Madison (UW-Madison), where he serves as
Director of Sustainability Research and Education and Co-
Director of the Office of Sustainability. He is also Chair of
the Departments of Civil and Environmental Engineering
and Geological Engineering. He is an international expert
in geoenvironmental engineering and a member of the US
National Academy of Engineering. Dr. Benson has a BS
from Lehigh University and MSE and PhD degrees from the
University of Texas at Austin, all in Civil Engineering with
an emphasis in geoenvironmental, geotechnical, and
geological engineering.
Dr. Benson has been conducting experimental and
analytical research related to protection of the
environment for nearly three decades, with a primary focus on beneficial use of industrial
byproducts; environmental containment of solid, hazardous, radioactive, and mining wastes;
and sustainable infrastructure. His research includes laboratory studies, large-scale field
experiments, and computer modeling. In the Office of Sustainability, Dr. Benson is responsible
for coordinating all sustainability related education on the UW-Madison campus and for
facilitating the interdisciplinary sustainability research enterprise across the UW-Madison
campus.
Dr. Benson has received several awards for his work, including the Ralph Peck Award, the
Huber Research Prize, the Alfred Noble Prize, and the Croes (twice), Middlebrooks Award
(twice), Collingwood Award, and Casagrande Award from the American Society of Civil
Engineers and the Award of Merit and the Best Practical Paper Award from ASTM
International. Dr. Benson is a former Editor-in-Chief of the Journal of Geotechnical and
Geoenvironmental Engineering. He is a past President of the ASCE Geo-Institute and past
Vice Chair of the Executive Committee of ASTM Committee D18 on Soil and Rock. Dr. Benson
is a member of the Academy of Distinguished Alumni at the University of Texas at Austin.

Arvid O. Landva, Ph.D. Professor Emeritus
University of New Brunswick, Canada
B.Sc., University of Strathclyde, Civil Engineering
Dr.ing., Norwegian Institute of Technology and
Norwegian Geotechnical Institute, dissertation on the
geotechnical behaviour and testing of soft quick clays
(supervisors Dr. L. Bjerrum, Dr. N. Janbu and Dr. R.
Selmer-Olsen)
Ph.D., Université Laval, dissertation on the geotechnical
behaviour and testing of peats (supervisor Dr. P. La
Rochelle, external advisor Dr. N.W. Radforth,
University of New Brunswick)
Main research topics
The geotechnical behaviour of -
Norwegian and Canadian quick clays
peats and organic soils
bonded New Brunswick clayey silt of constant or increasing water content with
depth
incinerated waste as compacted embankment fill
municipal solid waste
hazardous wastes

Maria Caterina C. Santagata, Ph.D. Associate Professor of Civil Engineering
Purdue University
Dr. Santagata is an Associate Professor in the School of
Civil Engineering at Purdue University. She holds a “Laurea in Ingegneria Civile” from the University of Ancona in Italy, and MS and PhD degrees in Civil and
Environmental Engineering from MIT. Dr. Santagata’s research interests and contributions are founded on fundamental studies of the behavior of a broad range of
soils and of their interaction with other materials, relying on experimental investigations that probe the materials
of interest at different scales. Recent research efforts have focused on: earthquake induced soil liquefaction, rheology and microstructure of clay dispersions,
lubrication properties of drilling fluids, mineral surface-water interactions in clay minerals, behavior and improvement of soils with high organic content, stress-strain-strength response of sensitive
carbonatic clays. At Purdue, Dr. Santagata routinely teaches the introductory geotechnical engineering course, and graduate courses devoted to the fundamentals of soil behavior and geotechnical testing.
Dr. Santagata is the Chair of the Committee on Soil Properties and Modeling of the Geo-
Institute of ASCE, and serves on the G-I’s Awards Committee. She is a member of the Committees on Soils and Rock Instrumentation and on Cementitious Stabilization of TRB. She served as an Associate Editor for ASCE’s Journal of Geotechnical and Geoenvironmental
Engineering between 2005 and 2013, and is currently a member of the Editorial Board of Rivista Italiana di Geotecnica.
Dr. Santagata received the National Science Foundation CAREER Grant in 2007 and Purdue University’s Faculty Fellowship for Study in a Second Discipline in 2009. At Purdue her work has been recognized with the Roy E. & Myrna G. Wansik Excellence in Research
Award (2007), the Edmund M. Burke Outstanding Professor Award from Chi Epsilon (2006), the Ross Judson Buck '07 Memorial Award for Undergraduate Counseling (2006) and the
Harold Munson Award for Outstanding Teacher in the School of Civil Engineering (2004). Dr. Santagata is a registered professional engineer in Italy.

LLaannddffiillll CCoovveerrss:: WWaatteerr BBaallaannccee,,
UUnnssaattuurraatteedd SSooiillss,, aanndd aa PPaatthhwwaayy
ffrroomm TThheeoorryy ttoo PPrraaccttiiccee
TThhee 22001144 SSppeenncceerr JJ.. BBuucchhaannaann LLeeccttuurree BByy DDrr.. CCrraaiigg BBeennssoonn

LANDFILL COVERS: WATER BALANCE, UNSATURATED SOILS, AND A
PATHWAY FROM THEORY TO PRACTICE
By Craig H. Benson1 and Christopher A. Bareither
2
1 Wisconsin Distinguished Professor and Director of Sustainability Research and Education,
University of Wisconsin-Madison, Madison, WI USA 53706 USA, [email protected] 2 Asst. Professor, Civil & Environmental Engineering, Colorado State Univ., Fort Collins,
CO, USA 80523 USA, [email protected]
ABSTRACT
This paper describes key steps in the design process for water balance covers using a
case history at a municipal solid waste landfill in Missoula, Montana, USA as an
example. The intent is to illustrate how state-of-the-art concepts can be applied in the
state-of-the-practice. The process begins by understanding the design objective
(including regulatory requirements) and investigating lines of evidence indicating that
a water balance cover is likely to function satisfactorily at the design location. Data
from two other instrumented water balance covers in the region are used to evaluate
efficacy along with historical meteorological data and information contained in a
prior unsuccessful submittal for a water balance cover at the Missoula landfill. Site
characterization is conducted to define properties of the soil resources and vegetation
at the site for preliminary cover sizing and numerical modeling of the water balance.
A numerical model is used with various design metrological conditions as input to
evaluate whether the cover will meet the design goal under realistic conditions. The
final design consists of a monolithic cover comprised of a 1.22-m storage layer
overlain by a 0.15-m topsoil layer. A field test with a fully instrumented lysimeter
was constructed and monitored to confirm that the cover performs as anticipated in
the design.
INTRODUCTION
Final covers for waste containment that rely on principles of variably saturated flow
to control percolation into underlying waste have become accepted as a viable
methodology for long-term isolation of waste, particularly in semi-arid and arid
regions where precipitation is favorably balanced by the energy available for
evaporation (Khire et al. 2000, Zornberg et al. 2003, Albright et al. 2004, Malusis and
Benson 2006). These covers are referred to using various names, including water
balance covers, store-and-release covers, evapotranspirative (or “ET”) covers, and

alternative covers. The nomenclature “water balance cover” is used by the authors
because this term represents the basic principle on which these covers function – the
ability to balance storage of water corresponding to an acceptable level of percolation
with the ability of plants and the atmosphere to remove stored water and replenish the
water storage capacity of the cover profile. The authors specifically do not use the
“ET cover” nomenclature because evapotranspiration is the predominant component
of the water balance in nearly all cover systems, and thus is not particularly
descriptive. The balance between water balance quantities is the feature that makes
water balance covers unique.
Monolithic barriers and capillary barriers are the most common forms of water
balance covers (Benson 2001, Ogorzalek et al. 2007, Bohnhoff et al. 2009) (Fig. 1).
Monolithic barriers consist of a thick layer of fine-textured soil that is engineered and
placed with appropriate compaction specifications so that the cover stores infiltrating
water with little drainage while unsaturated. Capillary barriers generally consist of a
two-layer system comprised of an overlying fine-textured storage layer similar to a
monolithic cover that is underlain by a clean coarse-grained layer that provides a
contrast in unsaturated hydraulic properties. The “capillary break” formed at the
interface of the two layers enhances the storage capacity of the fine-textured layer
(Stormont and Morris 1998, Khire et al. 2000), and can also promote lateral diversion
of water in the fine-textured layer (Stormont 1995). For both types of covers,
thickness of the storage layer is selected to have adequate capacity to store infiltrating
water during the wet season while ensuring the cover meets the design percolation
rate (Benson 2001). A surface layer of topsoil normally is placed over the storage
layer of either type of cover to provide a hospitable environment for the plant
community. Storage capacity of the topsoil layer generally is ignored during design.
Waste Waste
Capillary
Barrier
Monolithic
Barrier
Coarse Soil
Fine
Textured
Soil
Fine
Textured
Soil
Top Soil Top Soil
FIG. 1. Schematic of monolithic and capillary barriers.
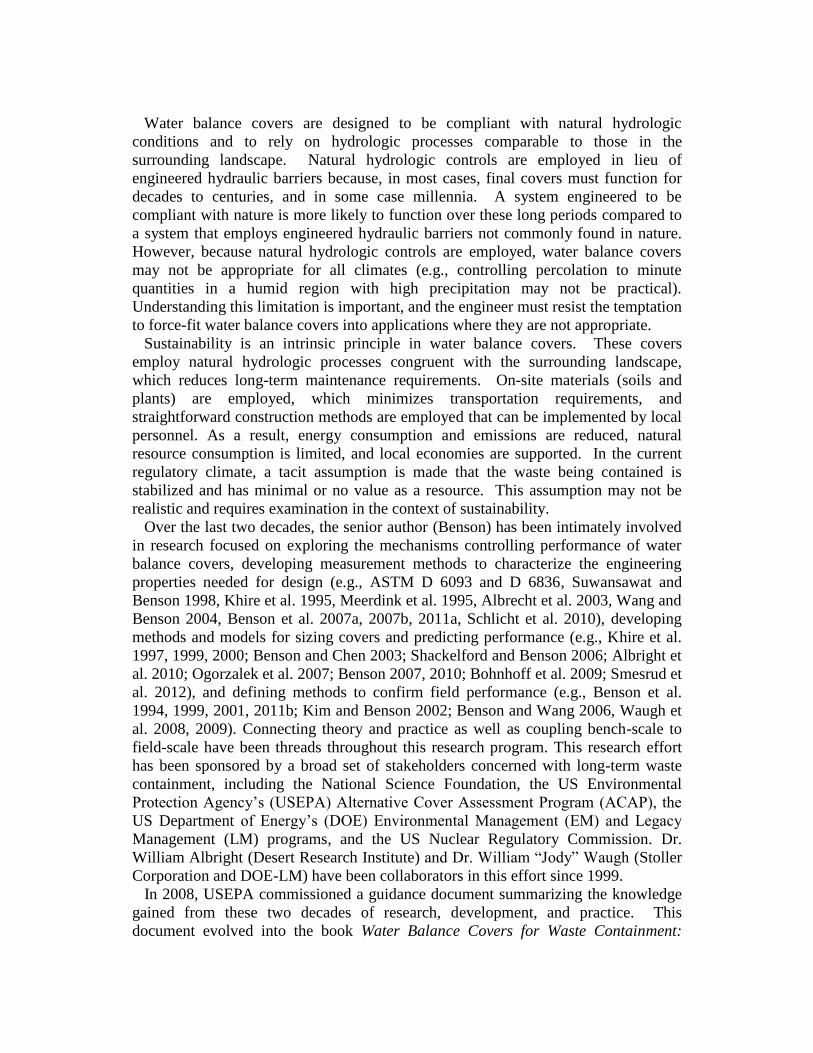
Water balance covers are designed to be compliant with natural hydrologic
conditions and to rely on hydrologic processes comparable to those in the
surrounding landscape. Natural hydrologic controls are employed in lieu of
engineered hydraulic barriers because, in most cases, final covers must function for
decades to centuries, and in some case millennia. A system engineered to be
compliant with nature is more likely to function over these long periods compared to
a system that employs engineered hydraulic barriers not commonly found in nature.
However, because natural hydrologic controls are employed, water balance covers
may not be appropriate for all climates (e.g., controlling percolation to minute
quantities in a humid region with high precipitation may not be practical).
Understanding this limitation is important, and the engineer must resist the temptation
to force-fit water balance covers into applications where they are not appropriate.
Sustainability is an intrinsic principle in water balance covers. These covers
employ natural hydrologic processes congruent with the surrounding landscape,
which reduces long-term maintenance requirements. On-site materials (soils and
plants) are employed, which minimizes transportation requirements, and
straightforward construction methods are employed that can be implemented by local
personnel. As a result, energy consumption and emissions are reduced, natural
resource consumption is limited, and local economies are supported. In the current
regulatory climate, a tacit assumption is made that the waste being contained is
stabilized and has minimal or no value as a resource. This assumption may not be
realistic and requires examination in the context of sustainability.
Over the last two decades, the senior author (Benson) has been intimately involved
in research focused on exploring the mechanisms controlling performance of water
balance covers, developing measurement methods to characterize the engineering
properties needed for design (e.g., ASTM D 6093 and D 6836, Suwansawat and
Benson 1998, Khire et al. 1995, Meerdink et al. 1995, Albrecht et al. 2003, Wang and
Benson 2004, Benson et al. 2007a, 2007b, 2011a, Schlicht et al. 2010), developing
methods and models for sizing covers and predicting performance (e.g., Khire et al.
1997, 1999, 2000; Benson and Chen 2003; Shackelford and Benson 2006; Albright et
al. 2010; Ogorzalek et al. 2007; Benson 2007, 2010; Bohnhoff et al. 2009; Smesrud et
al. 2012), and defining methods to confirm field performance (e.g., Benson et al.
1994, 1999, 2001, 2011b; Kim and Benson 2002; Benson and Wang 2006, Waugh et
al. 2008, 2009). Connecting theory and practice as well as coupling bench-scale to
field-scale have been threads throughout this research program. This research effort
has been sponsored by a broad set of stakeholders concerned with long-term waste
containment, including the National Science Foundation, the US Environmental
Protection Agency’s (USEPA) Alternative Cover Assessment Program (ACAP), the
US Department of Energy’s (DOE) Environmental Management (EM) and Legacy
Management (LM) programs, and the US Nuclear Regulatory Commission. Dr.
William Albright (Desert Research Institute) and Dr. William “Jody” Waugh (Stoller
Corporation and DOE-LM) have been collaborators in this effort since 1999.
In 2008, USEPA commissioned a guidance document summarizing the knowledge
gained from these two decades of research, development, and practice. This
document evolved into the book Water Balance Covers for Waste Containment:
Principles and Practice, by Albright, Benson, and Waugh, which was published by
ASCE Press in 2010 (Albright et al. 2010). The objective of the guidance document
and book was to facilitate the transition from state-of-the-art to state-of-the-practice.
Practitioners and environmental regulatory agencies in the US and abroad have
adopted the principles and strategies described in this book.
A case history is described in this paper where state-of-the-art principles described
in the book were employed in the state-of-the-practice to evaluate, design, and
demonstrate the viability of a water balance cover for an operating municipal solid
waste (MSW) landfill in Missoula, Montana. While this case study applies to MSW
containment in a semi-arid climate, the principles are universal and can be (and have
been) adapted to design covers for other types of waste and in other climates. The
discussion contained herein is brief to meet publication constraints; more detailed
discussion of each of the issues is covered in the book. Moreover, the extensive
citations common in academic scholarship have been forgone. The book serves as the
primary reference, and within the book numerous citations are included.
PROCESS
The procedure for designing and evaluating a water balance cover consists of five
steps, which can be summarized as follows (Albright et al. 2010):
1. Preliminary assessment – determine the performance goal and seek lines of
evidence that a water balance cover may be successful at the proposed location.
Understand the expectations of the overseeing regulatory authority and
constraints required by the owner.
2. Site characterization – characterize the soils and vegetation available for the
water balance cover.
3. Storage assessment – estimate the required thickness of the water balance cover
by determining the amount of water that must be stored and the capacity of the
cover to store the water.
4. Water balance modeling – predict the performance of the cover identified in the
storage assessment for realistic meteorological data using a numerical model that
simulates variably saturated flow and root water uptake in a multilayer system
with a climatic flux boundary at the surface; refine the cover thickness if
necessary.
5. Performance demonstration – conduct a performance demonstration to validate
that the design meets the performance goal by instrumenting the actual cover or
constructing a full-scale test section.
Each of these steps was conducted when evaluating, designing, and demonstrating the
water balance cover for the site in Missoula.

PRELIMINARY ASSESSMENT
The preliminary assessment addresses two fundamental questions:
What is the design goal for the project?
What evidence exists that the design goal can be achieved with the climate, soils,
and vegetation at the site?
Both of these questions need to be addressed during the preliminary assessment.
The first question seems obvious, but is often overlooked until the project is far
along. The second question is particularly important. If strong evidence is not
available indicating a water balance cover will be successful, the engineer must
carefully consider whether the design process should continue.
Discussions with the Montana Department of Environmental Quality (MDEQ, the
regulatory agency with jurisdiction over the site), and review of MDEQ’s Draft
Alternative Final Cover Guidance (v. 9-11), indicated that the water balance cover
for the Missoula landfill must be hydraulically equivalent to the conventional cover
required in Montana for MSW landfill cells containing a composite liner. The
conventional cover consists of a composite barrier with a compacted soil barrier
having a saturated hydraulic conductivity no more than 10-5
cm/s overlain by a
geomembrane and a vegetated surface layer (Fig. 2).
0 mm
300 mm
600 mm
900 mm
1200 mm
1500 mm
1800 mm
Helena
(ACAP)
Polson
(ACAP)
Conventional
Cover
2002
Missoula
Cover
SMSC
ML
SM
GP
SC
-
CH
SC
2100 mm
Topsoil/ Vegetative Layer
Storage Layer
Interim Cover
Silty sand
GravelGP
Compacted Soil Barrier
Geomembrane
SM
SM
FIG. 2. Cover profiles at Missoula (conventional cover and 2002 Missoula
Cover) and water balance cover profiles in Polson and Helena, MT. Soil
classification based on Unified Soil Classification System.
MDEQ does not stipulate statewide equivalent percolation rates for conventional
covers. Owners are required to propose an equivalent percolation rate for
consideration and possible concurrence by MDEQ. For this project, the design
percolation rate recommended by ACAP for conventional composite covers (3 mm/yr
average percolation rate, Benson 2001) was proposed, and accepted by MDEQ as the
design goal. The rate is reported in units of length/time, which corresponds to units

of volume/time per area. The equivalency criterion for this project is similar to, but
slightly less than the recommendation in Apiwantragoon (2007) for covers with
composite barriers (4 mm/yr). North Dakota also stipulates 4 mm/yr for an
equivalent percolation rate.
Supporting Evidence
Evidence was sought to determine if a design percolation rate of 3 mm/yr was
realistic for the Missoula landfill. Field data from other projects in similar climates
and with similar soils and vegetation generally comprise the best evidence. In this
case, water balance covers had been evaluated at MSW landfills in Polson and
Helena, Montana as part of ACAP (Albright et al. 2004, Apiwantragoon 2007).
These sites are 115 km north (Polson) and 185 km east (Helena) of Missoula. Index
and hydraulic properties of the cover soils were available for both sites (Benson et al.
2011a) as well as data from an ACAP-style lysimeter (Apiwantragoon 2007) used to
characterize the water balance and verify the percolation rate. At both landfills, the
water balance cover evaluated with the ACAP lysimeter was deployed as final cover.
Profiles of the water balance covers evaluated in Polson and Helena by ACAP are
shown in Fig. 2. Both included a capillary break. At Polson, however, the contrast
between the layers was modest because the underlying sand contained fines. At
Helena, the storage layer was thick and had relatively high air entry pressure.
Consequently, the water balance covers at Polson and Helena functioned like
monolithic covers, even though they included a break in soil texture (Apiwantragoon
2007). For this analysis, the covers at Polson and Helena were assumed to function
as monolithic covers.
The covers at Polson and Helena functioned remarkably well, with average
percolation rates of 0.5 mm/yr (Polson) and 0.0 mm/yr (Helena) during the ACAP
monitoring period (2000-04) (Apiwantragoon 2007). Thus, these covers provided a
good benchmark for assessing the viability of a water balance cover in Missoula.
That is, if the climate in Missoula is sufficiently similar to the climates in Polson and
Helena, then a water balance cover for Missoula should function comparable to the
covers in Polson and Helena, provided the cover in Missoula has similar available
water storage capacity relative to the required storage capacity.
Additional information was available from an application made by the landfill
owner in 2002 (Miller 2002) to deploy a water balance cover with a 0.91-m-thick
storage layer (Fig. 2). This application was based primarily on findings from a
numerical modeling exercise using on-site soil hydraulic properties. The modeling
indicated that percolation would be nil for typical meteorological conditions. The
application was not approved because the site characterization was limited, wetter
than normal conditions were not assessed, and no provision was made to demonstrate
performance at full scale. This proposed cover is referred to henceforth as the “2002
Missoula Cover,” although a cover was never constructed based on this design.
The data from Polson and Helena were evaluated in the context of the conditions in
Missoula to determine if these sites could be used as analogs, and to determine if the
design goal for Missoula was realistic given the meteorological conditions at the site,
the soil resources available, and the local vegetation. Soil hydraulic properties
reported in Miller (2002) were used for this preliminary assessment.

Climate Assessment
Meteorological data for Missoula were obtained from the National Weather Service.
Climate type, average annual precipitation, and average high and low temperatures
for Missoula, Polson, and Helena are summarized in Table 1. The data correspond to
the period 1952-2010, for which a complete record of precipitation and temperature
was available for all three sites.
Missoula and Helena have semiarid climates based on the definitions in UNESCO
(1999), whereas Polson is subhumid. Polson has the highest average annual
precipitation (380 mm) and the highest ratio of annual precipitation (P) to annual
potential evapotranspiration (PET). The ratio P/PET is a measure of the amount of
water to be managed (a fraction of P) relative to the energy available to manage water
via evapotranspiration. Lower P/PET corresponds to greater aridity and higher
confidence in managing precipitation with minimal percolation; i.e., the likelihood of
achieving a percolation goal increases as annual P/PET decreases. Annual
precipitation at all three locations was close to average during 2000-04, when data
were collected from the ACAP-style lysimeters at Polson and Helena (Table 1).
Thus, the water balance data from Polson and Helena during this period represent
typical conditions.
Table 1. Climatic data for Missoula, Helena, and Polson, Montana.
Site Climate
Avg.
Annual
Precip.
(mm)
Avg.
Annual
P/PET
Avg.
Annual
Precip.
During
ACAP
(mm)
Avg. Air Temperature
(°C)
High with
Month
Low with
Month
Missoula Semi-
arid 337 0.40 333 30 (July) -10 (Jan.)
Helena Semi-
arid 289 0.44 270 29 (July) -13 (Jan.)
Polson Sub-
humid 380 0.58 362 29 (July) -7 (Jan.)
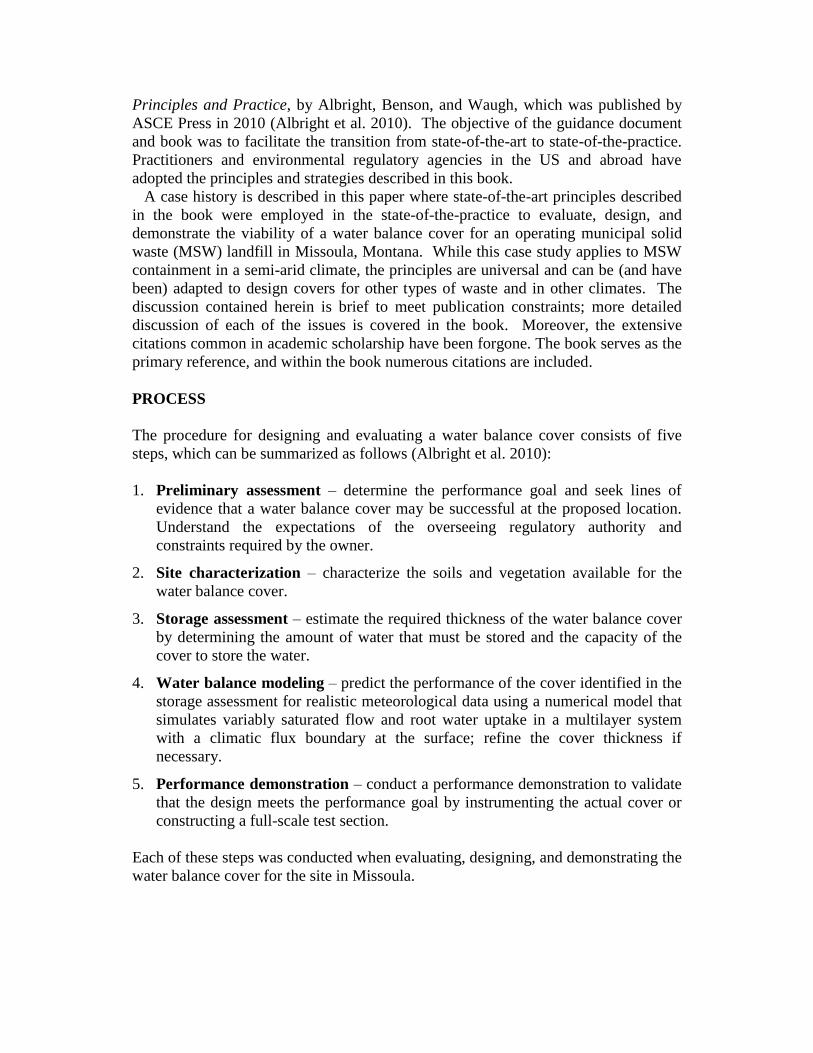
Daily average precipitation is shown in Fig. 3a for Missoula, Polson, and Helena.
The annual precipitation pattern is similar for all three sites, with the wettest period
occurring at the end of spring and beginning of summer, followed by a much drier
period in mid summer and a wetter period in late summer and early fall. Fall and
winter are the driest seasons. Daily precipitation at Missoula is more similar to
precipitation in Polson than Helena. However, Missoula is drier than Polson,
particularly in the spring. Missoula is wetter than Helena in the winter and spring,
and comparable in the summer (Fig. 3a).
Daily average minimum and maximum air temperatures at all three sites (Fig. 3b)
show similar seasonality. Missoula has slightly higher maximum daily air
temperatures than Polson and Helena, except in late fall and winter. The daily
average minimum air temperature tends to be cooler in Missoula than Polson and
Helena during late spring, summer, and early fall (Fig. 3b), which is indicative of a
clearer sky and lower humidity during the summer. Polson exhibits the least seasonal
variation in temperature of the three sites, and a slightly smaller difference between
daily maximum and minimum temperature, due to buffering provided by Flathead
Lake (adjacent to Polson).
0.0
0.5
1.0
1.5
2.0
2.5
Daily Aveage
Precipitation
1971 - 2000
MissoulaHelenaPolson
Aver
age D
aily
Pre
cip
itati
on (
mm
)
(a)
SpringWinter Summer Fall
-20
-10
0
10
20
30
40
0 50 100 150 200 250 300 350 400
Daily Average
Temperature
1971 - 2000
Missoula
HelenaPolson
Av
erag
e D
aily
Max
imum
and M
inim
um
Tem
per
ature
(oC
)
Julian Day
(b)
SpringWinter Summer Fall
FIG. 3. Daily average precipitation (a) and daily average maximum and
minimum temperature (b) between 1971 and 2000 for Missoula, Helena,
and Polson.

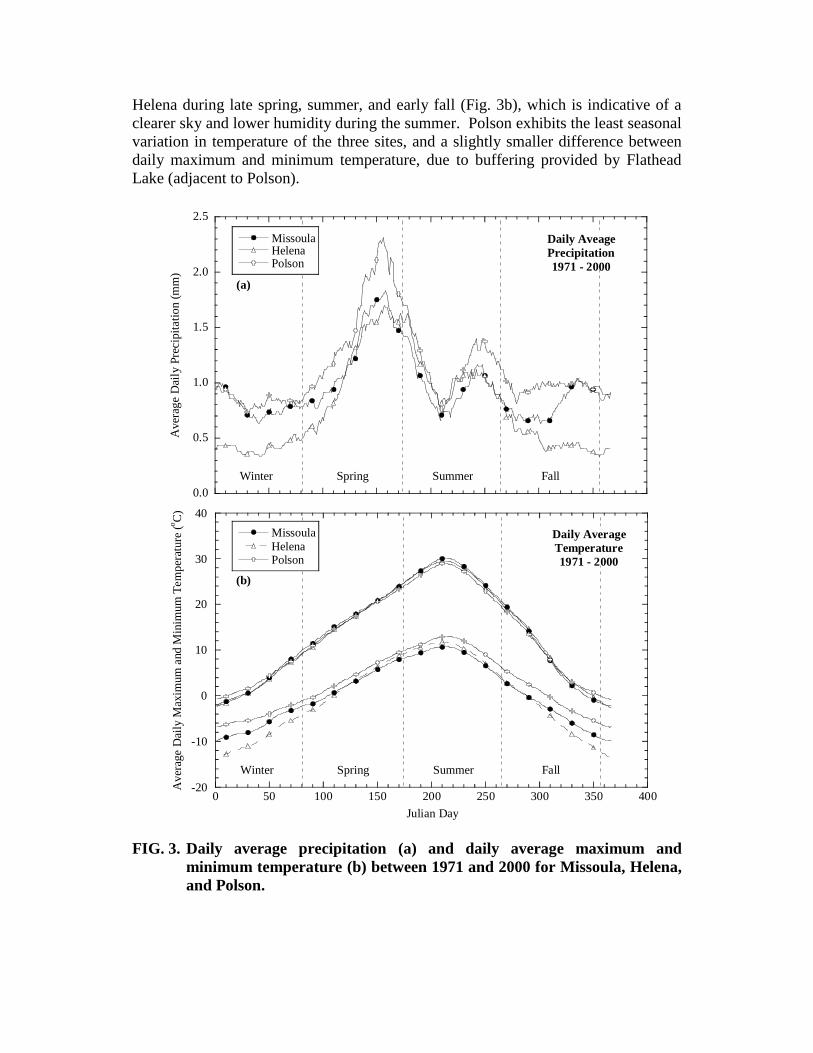
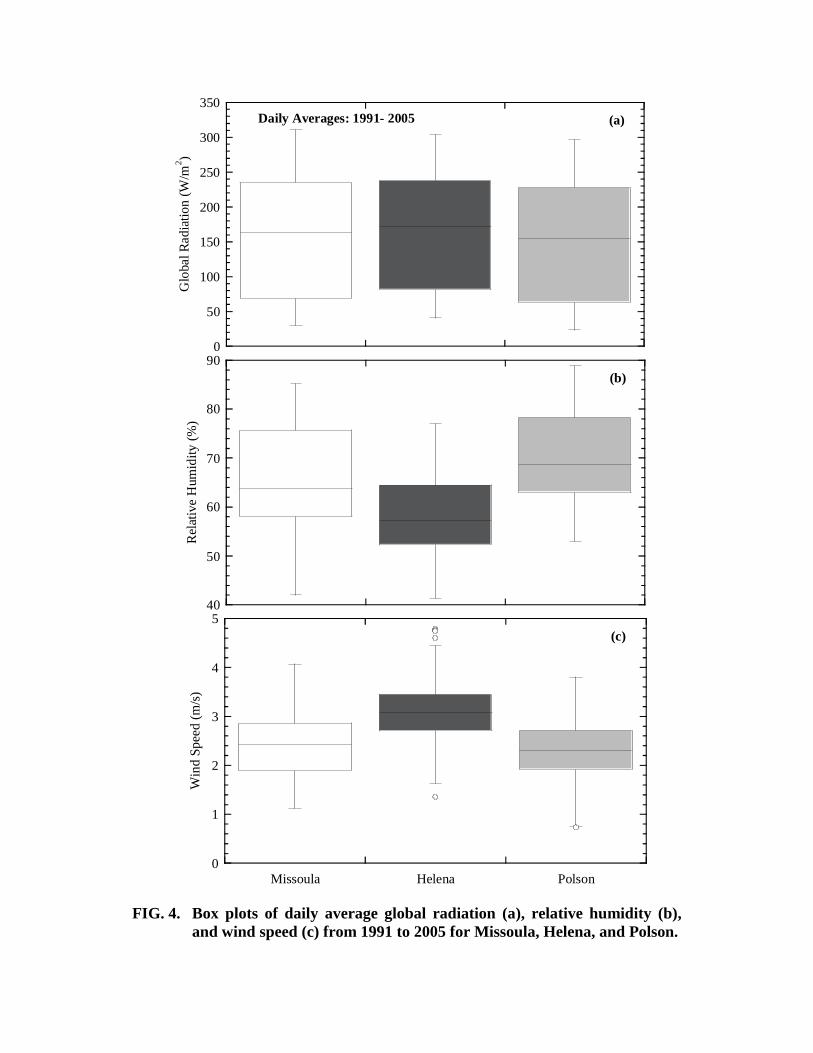
Annual daily average solar radiation, relative humidity, and wind speed (all
affecting ET) for the period 1991-2005 for Missoula, Polson, and Helena (period for
which complete data are available for all three sites) are shown in Fig. 4 using box
plots. The centerline of the box is the median, the outer boundaries represent the
interquartile range (i.e., 25th
and 75th
percentile), and the upper and lower whiskers
represent the 10th
and 90th
percentiles of the data. Outliers are shown as individual
data points above or below the whiskers (e.g., Fig. 4c). Solar radiation at each site is
comparable since the three locations are at similar latitude. Polson is the most humid
site, due to the proximity of Flathead Lake. Helena is the least humid and windiest
site (Fig. 4b and c). Missoula falls between Polson and Helena for all three
meteorological parameters.
Soil Resource Assessment
Index properties of the soil proposed by Miller (2002) for the 2002 Missoula Cover
are summarized in Table 2 along with the properties of the storage layers in Polson
and Helena. The Missoula soil is a broadly graded silty sand with gravel (SM). The
storage layer at Polson has an upper layer of lean clay (CL-ML) over a lower layer of
silty sand (SM). At Helena, the storage layer is silty clay (SC). The soils at Polson
and Helena contain less gravel ( 6%) than the Missoula soil reported by Miller
(2002) (33% gravel, Table 2).
Table 2. Composition and classification of storage layer soils at Missoula
(Miller 2002) and Polson and Helena (Albright et al. 2004).
Site Unified Soil
Classification
Particle Size Distribution (%) Atterberg Limits
Gravel Sand Fines 2 m
Clay
Liquid
Limit
Plasticity
Index
Missoula SM 33 34 33 NR NR NR
Helena SC 2 54 44 30 67 47
Polson SM 6 54 42 5 NP NP
CL-ML 0.8 6.1 93.2 18 28 7
Notes: NR = not reported; NP = non-plastic as defined in ASTM D 2487; particle sizes based on
definitions in the Unified Soil Classification System (ASTM D 2487): gravel > 4.8 mm, 4.8 mm >
sand > 0.75 mm, fines < 0.75 mm
The silty clay at Helena has a similar distribution of predominant particle sizes as
the silty clay at Polson (Table 2), but the Helena soil has moderately plastic fines and
a larger clay fraction (30% vs. 5%). Although Atterberg limits were not reported for
the Missoula soil by Miller (2002), the high percentage of sand and gravel and the
relatively high saturated hydraulic conductivity (see subsequent discussion), suggests
that the Missoula soil probably is non-plastic.
Saturated and unsaturated hydraulic properties reported by Miller (2002) for the
Missoula soil are in Table 3 along with properties for covers in Polson and Helena.
The hydraulic properties at Polson and Helena were measured during construction as
well as 9 yr after the covers had been in service (cited as the “in-service” condition
0
50
100
150
200
250
300
350
Daily Averages: 1991- 2005
Glo
bal
Rad
iati
on
(W
/m2)
(a)
40
50
60
70
80
90
Rel
ativ
e H
um
idit
y (
%)
(b)
0
1
2
3
4
5
Missoula Helena Polson
Win
d S
pee
d (
m/s
)
(c)
FIG. 4. Box plots of daily average global radiation (a), relative humidity (b),
and wind speed (c) from 1991 to 2005 for Missoula, Helena, and Polson.

henceforth). The saturated hydraulic conductivities (Ks) of the Missoula soil and the
as-built silty sand at Polson (4.2x10⁻⁵
to 4.9x10⁻⁵
cm/s) are comparable. The silty
clay at Polson and clayey sand at Helena were less permeable when constructed (Ks =
1.5x10⁻⁷
to 4.0x10⁻⁷
cm/s). However, samples collected after 9 yr of service indicated
that pedogenesis had altered the soils (Ks = 2x10⁻⁶
to 8x10⁻⁶
cm/s), making them
nearly as permeable as the Missoula soil. (Benson et al. 2007, 2011a).
Soil water characteristic curves (SWCC) for the soils at Polson, Helena, and
Missoula (as described in Miller 2002) are shown in Fig. 5. van Genuchten’s (1980)
equation was used to describe the SWCC:
m
n
rs
r
)(α1
1
θθ
θθ
ψ (1)
where and n are fitting parameters, s is the saturated volumetric water content, r
is the residual water content, and m = 1-1/n. The fitted parameters are summarized in
Table 3 for as-built conditions in Polson and Helena, and laboratory-compacted
conditions for the Missoula soil as reported by Miller (2002). The SWCCs in Fig. 5
correspond to the as-built and in-service conditions for Polson and Helena, and the
laboratory-compacted Missoula soil reported by Miller (2002).
Table 3. Hydraulic properties of storage layers at Polson and Helena and
for 2002 Missoula Cover.
Site Soil Hydraulic Properties
Ks (cm/s) (kPa-1
) n s r
2002 Missoula
Cover SM 4.9x10
-5 0.052 1.28 0.34 0.00
Helena SC 1.5x10⁻⁷
0.0018 1.19 0.34 0.00
Polson SM 4.2x10
-5 0.0010 1.40 0.35 0.00
CL-ML 4.0x10⁻⁷
0.0027 1.27 0.30 0.00
The as-built soils for Polson and Helena and the Missoula soil have similar s and r
(Table 3), but the parameter reported by Miller (2002) for the Missoula soil is more
than one order of magnitude larger than the as-built for the soils at Polson and
Helena (0.0010-0.0027 1/kPa). However, the in-service for both Polson and Helena
(0.01-0.05 1/kPa, Benson et al. 2011a) after 9 yr of service is similar to for the
Missoula soil reported by Miller (2002). All of the soils have similar n (1.19 to 1.40)
in the as-built and in-service conditions (Benson et al. 2011a).
Storage Assessment
Available Soil Water Storage Capacity. Available soil water storage capacity (SA)
was computed for the covers in Polson and Helena along with the profile proposed
previously for the 2002 Missoula Cover (Miller 2002) using:
SA = L (FC – WP) (2)

10-1
100
101
102
103
104
105
2002 Missoula Cover
Laboratory Compacted
Su
ctio
n (
kP
a)
= 1500 kPa
= 33 kPa
(a)
10-1
100
101
102
103
104
105
Helena
As BuiltIn Service
Su
ctio
n (
kP
a)
= 1500 kPa
= 33 kPa
(b)
10-1
100
101
102
103
104
105
0.0 0.1 0.2 0.3 0.4 0.5 0.6
Polson
SM - Initial
SM - In Service
CL-ML - As Built
CL-ML - In Service
Su
ctio
n (
kP
a)
Volumetric Water Content
CL-ML
SM
= 1500 kPa
= 33 kPa
(c)
FIG. 5. Soil water characteristic curves (SWCCs) for Missoula (a), Helena (b),
and Polson (c).
where L is the thickness of the storage layer, FC is the field capacity, and WP is the
wilting point (Albright et al. 2010). Available soil water storage capacity is reported
in units of length (volume per unit area = length). Field capacity (FC) is the water
content at which drainage becomes negligible under gravity and is estimated from the
SWCC as the volumetric water content ( at = 33 kPa. The wilting point (WP),
the water content at which transpiration ceases, was estimated as at = 1500 kPa.
In semi-arid regions such as western Montana, wilting points can be as high as 5-7
MPa (Apiwantragoon 2007). Thus, defining WP based on 1500 kPa underestimates
available storage (a conservative estimate).
The following SA were computed: Polson – 90/166 mm, Helena – 82/164 mm, and
2002 Missoula – 134 mm (the latter SA for Polson and Helena correspond to in-
service conditions). The increase in SA at Polson and Helena is due to pedogenic
changes in the SWCC, which are known to increase s and (Benson et al. 2007a,
2011a). For these soils, the increase in available storage due to the increase in s was
more significant than the reduction in available storage due to the increase in .
When the in-service condition is considered for Polson and Helena, the 2002
Missoula Cover has approximately 30 mm less storage than the covers in Polson and
Helena, and therefore could transmit more percolation.
Required Soil Water Storage. Required soil water storage (SR) was computed for
the 2002 Missoula Cover and the covers in Polson and Helena using Eq. 3 and the
procedures outlined in Albright et al. (2010):
6 12
r FW,m SS,m
m 1 m 7
S S S (3)
where SFW,m is monthly accumulation of soil water storage in fall and winter (m = 1-
6 corresponding to October through March):
FW,m m FW m FWS P PET (4)
and SSS,m is monthly accumulation of soil water storage in spring and summer (m =
7-12, April through September).
SS,m m SS m SSS P PET (5)
In Eqs. 4 and 5, Pm is monthly precipitation and PETm is monthly PET for the mth
month, ij is the ratio of ET to PET for fall-winter (FW) or spring-summer (SS)
conditions, and ij is the water balance residual (runoff, percolation, and internal
lateral flow, if any) for fall-winter (FW) or spring-summer (SS) conditions. For sites
with snow and frozen ground, FW = 0.37, SS = 1.00, FW = 0, and SS = 168
(Albright et al. 2010). PET was computed using methods presented in Allen et al.
(1998). For months when P/PET was less than 0.51 (fall and winter months) or 0.32
(spring and summer months), the monthly accumulation was set at zero, as
recommended in Albright et al. (2010). In addition, if SFW,m or SSS,m computed
with Eqs. 4-5 was less than zero for any m, the monthly accumulation was set to zero
for that month as recommended in Albright et al. (2010).
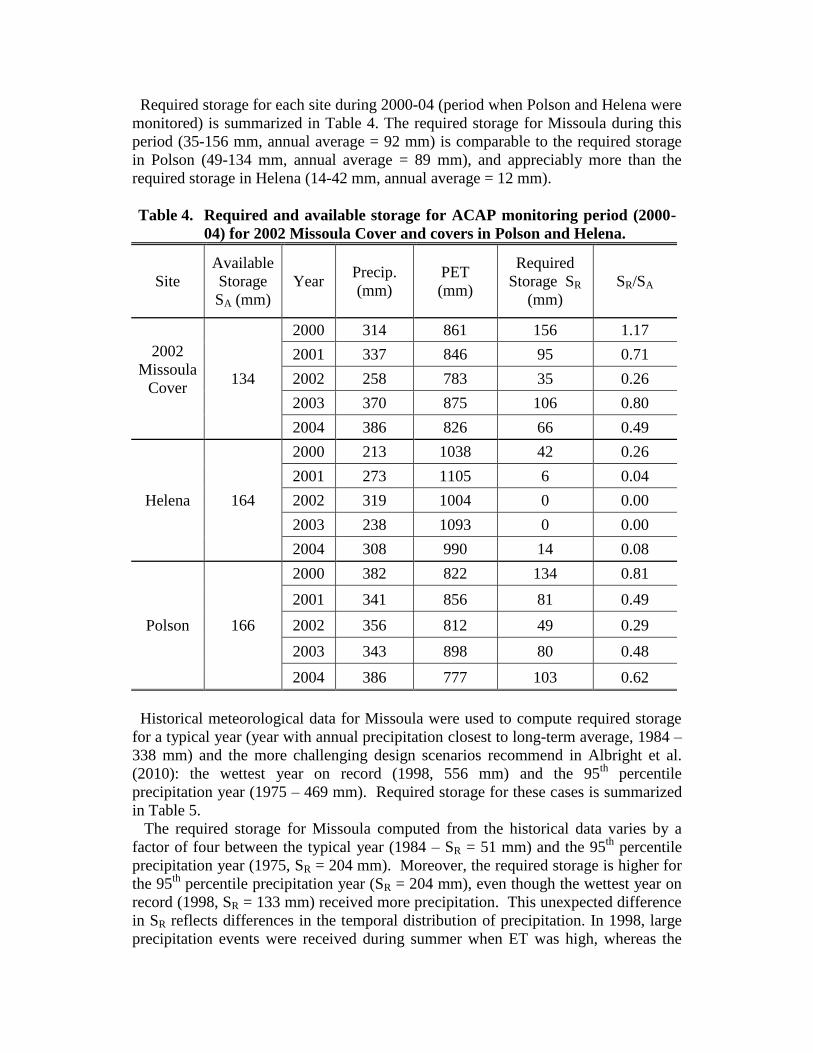
Required storage for each site during 2000-04 (period when Polson and Helena were
monitored) is summarized in Table 4. The required storage for Missoula during this
period (35-156 mm, annual average = 92 mm) is comparable to the required storage
in Polson (49-134 mm, annual average = 89 mm), and appreciably more than the
required storage in Helena (14-42 mm, annual average = 12 mm).
Table 4. Required and available storage for ACAP monitoring period (2000-
04) for 2002 Missoula Cover and covers in Polson and Helena.
Site
Available
Storage
SA (mm)
Year Precip.
(mm)
PET
(mm)
Required
Storage SR
(mm)
SR/SA
2002
Missoula
Cover
134
2000 314 861 156 1.17
2001 337 846 95 0.71
2002 258 783 35 0.26
2003 370 875 106 0.80
2004 386 826 66 0.49
Helena 164
2000 213 1038 42 0.26
2001 273 1105 6 0.04
2002 319 1004 0 0.00
2003 238 1093 0 0.00
2004 308 990 14 0.08
Polson 166
2000 382 822 134 0.81
2001 341 856 81 0.49
2002 356 812 49 0.29
2003 343 898 80 0.48
2004 386 777 103 0.62
Historical meteorological data for Missoula were used to compute required storage
for a typical year (year with annual precipitation closest to long-term average, 1984 –
338 mm) and the more challenging design scenarios recommend in Albright et al.
(2010): the wettest year on record (1998, 556 mm) and the 95th
percentile
precipitation year (1975 – 469 mm). Required storage for these cases is summarized
in Table 5.
The required storage for Missoula computed from the historical data varies by a
factor of four between the typical year (1984 – SR = 51 mm) and the 95th
percentile
precipitation year (1975, SR = 204 mm). Moreover, the required storage is higher for
the 95th
percentile precipitation year (SR = 204 mm), even though the wettest year on
record (1998, SR = 133 mm) received more precipitation. This unexpected difference
in SR reflects differences in the temporal distribution of precipitation. In 1998, large
precipitation events were received during summer when ET was high, whereas the
large precipitation events in 1975 occurred in late fall and winter, when ET was low
and water was accumulating in the cover. A wetter winter also occurred in 1975.
Thus, the wettest year is not necessarily the worst-case scenario for Missoula.
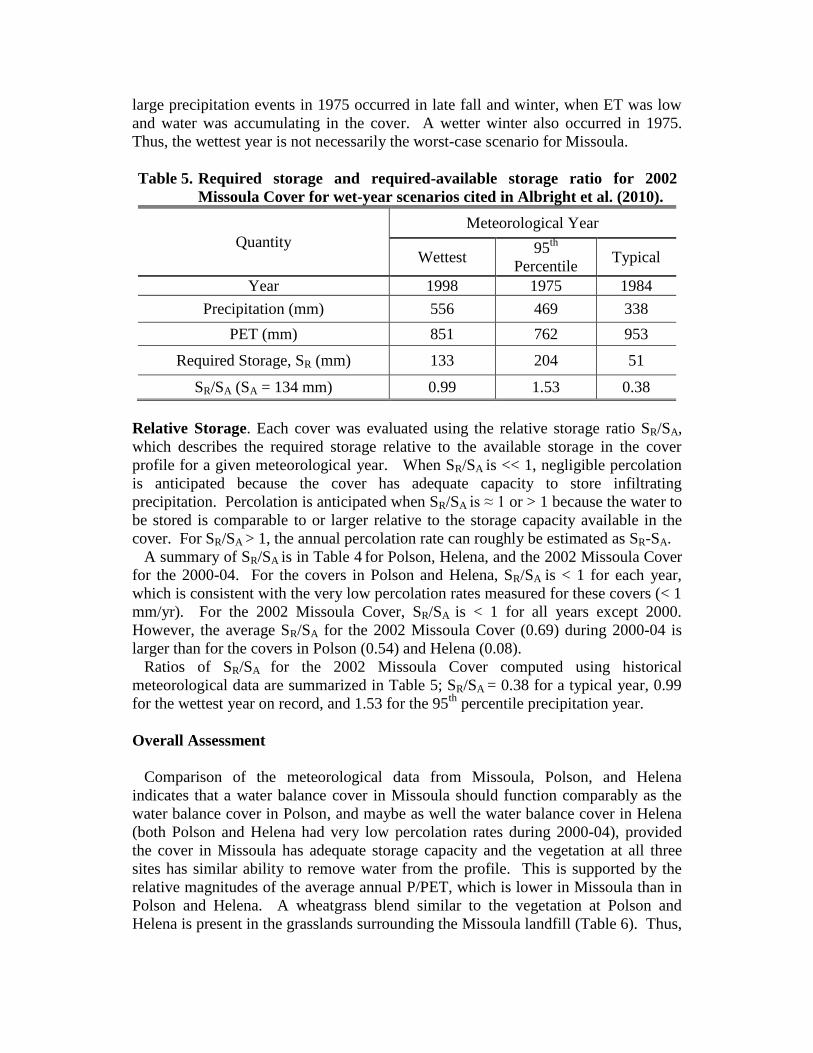
Table 5. Required storage and required-available storage ratio for 2002
Missoula Cover for wet-year scenarios cited in Albright et al. (2010).
Quantity
Meteorological Year
Wettest 95
th
Percentile Typical
Year 1998 1975 1984
Precipitation (mm) 556 469 338
PET (mm) 851 762 953
Required Storage, SR (mm) 133 204 51
SR/SA (SA = 134 mm) 0.99 1.53 0.38
Relative Storage. Each cover was evaluated using the relative storage ratio SR/SA,
which describes the required storage relative to the available storage in the cover
profile for a given meteorological year. When SR/SA is << 1, negligible percolation
is anticipated because the cover has adequate capacity to store infiltrating
precipitation. Percolation is anticipated when SR/SA is ≈ 1 or > 1 because the water to
be stored is comparable to or larger relative to the storage capacity available in the
cover. For SR/SA > 1, the annual percolation rate can roughly be estimated as SR-SA.
A summary of SR/SA is in Table 4 for Polson, Helena, and the 2002 Missoula Cover
for the 2000-04. For the covers in Polson and Helena, SR/SA is < 1 for each year,
which is consistent with the very low percolation rates measured for these covers (< 1
mm/yr). For the 2002 Missoula Cover, SR/SA is < 1 for all years except 2000.
However, the average SR/SA for the 2002 Missoula Cover (0.69) during 2000-04 is
larger than for the covers in Polson (0.54) and Helena (0.08).
Ratios of SR/SA for the 2002 Missoula Cover computed using historical
meteorological data are summarized in Table 5; SR/SA = 0.38 for a typical year, 0.99
for the wettest year on record, and 1.53 for the 95th
percentile precipitation year.
Overall Assessment
Comparison of the meteorological data from Missoula, Polson, and Helena
indicates that a water balance cover in Missoula should function comparably as the
water balance cover in Polson, and maybe as well the water balance cover in Helena
(both Polson and Helena had very low percolation rates during 2000-04), provided
the cover in Missoula has adequate storage capacity and the vegetation at all three
sites has similar ability to remove water from the profile. This is supported by the
relative magnitudes of the average annual P/PET, which is lower in Missoula than in
Polson and Helena. A wheatgrass blend similar to the vegetation at Polson and
Helena is present in the grasslands surrounding the Missoula landfill (Table 6). Thus,

the vegetation at Missoula should have similar ability to remove stored water as the
vegetation at Polson and Helena.
Table 6. Vegetation at Missoula, Polson, and Helena as reported in Miller
(2002), Roesler et al. (2002), and Albright et al. (2004).
Site Vegetation
Missoula Critana thickspike, sodar streambank, and pryor slender wheatgrass,
sheep fescue, yellow sweetclover.
Helena Bluebunch, slender, and western wheatgrass, sandburg bluegrass, sheep
fescue, blue gamma, green needlegrass, needle-and-thread.
Polson
Thickspike, bluebunch, slender, and crested wheatgrass, mountain
brome, Idaho fescue, prairie junegrass, needle-and-thread, meadow
brome, Canada and Kentucky bluegrasses, yarrow, fringed sagewort,
alfalfa, rubber rabbitbrush, prickly rose, arrowleaf, balsamroot, dolted
gayfeather, lewis flax, silky lupine, cicer milkvetch.
The 2002 Missoula Cover profile should be adequate under typical conditions,
which is consistent with the predictions made by Miller (2002). However, a thicker
cover profile is needed to provide sufficient storage capacity for wetter conditions.
For example, SR/SA exceeds 1 for the Missoula cover when the meteorological data
from 2000 are used to compute SR (Table 4). For this same year, SR/SA = 0.81 for
Polson and 0.26 for Helena. The year 2000 was wetter than the other years during the
2000-04 monitoring period in Polson and Helena, but was not exceptionally wet.
Thus, in wetter years, the 2002 Missoula cover has a higher likelihood of transmitting
percolation than the covers at Polson or Helena. MDEQ agreed with this assessment,
and concurred that a thicker cover was necessary.
Path Forward
Based on the preliminary assessment, MDEQ was satisfied that a properly sized
water balance cover could function satisfactorily at Missoula. However, discussions
with MDEQ indicated that approval for a water balance cover would require more
comprehensive analysis and design, including (i) more comprehensive evaluation of
soil resources, (ii) site-specific assessment of vegetation properties, (iii) additional
modeling to evaluate wetter conditions, and (iv) a full-scale demonstration to validate
that the cover functions as designed. These requirements from MDEQ are consistent
with their Draft Alternative Final Cover Guidance (v. 9-11) and the approach
recommended in Albright et al. (2010). The following steps were conducted to
addresses these concerns:
a soil resource evaluation was conducted and the saturated and unsaturated
hydraulic properties were measured for potential cover soils,
vegetation at the site was sampled and the leaf area index (LAI) and root density
function were measured,

data describing the phenology of the wheatgrass blend in the region were obtained
from the literature,
preliminary design was conducted to estimate the required thickness of the
storage layer under wetter conditions (wettest year on record and 95th
percentile
precipitation year) using soil hydraulic properties from the soil resource
evaluation,
percolation from the cover identified in preliminary design was predicted using a
numerical model employing site-specific meteorological data, soil properties, and
vegetation properties as input; meteorological data for typical and much wetter
conditions were employed,
a test section was constructed so that the water balance (particularly the
percolation rate) could be measured at field scale to confirm the sufficiency of the
design.
SOIL RESOURCES
A soil resource evaluation was conducted to determine the suitability of the on-site
soils. Ten soil samples were collected from test pits excavated at four sites (Sites 1-
4) where soil was available for the cover. Sites 1-3 were soil stockpiles excavated
from previous cell construction. Native ground was sampled at Site 4, and at Site 1 in
an area adjacent to the soil stockpile at Site 1. Topsoil was sampled at Sites 3 and 4.
The site has an abundance of soil and availability of soil is not an issue. Thus, the
characterization focused on identifying soils that were suitable for the cover and not
the volume of each soil that was available.
Test pits were excavated with a backhoe at each sampling site. Each test pit was
inspected visually to assess homogeneity of the borrow source. Disturbed samples
were collected with hand tools and placed in 20-L buckets. All buckets were sealed
with plastic lids containing rubber gaskets.
Particle Size Distribution
Particle size analyses were conducted on each sample following ASTM D 422. The
particle size distributions are shown in Fig. 6. Atterberg limits were not measured.
The average particle size fractions for the stockpile soils (gravel = 39%, sand = 27%,
and fines = 32%) are comparable to those for the Missoula soil cited in Miller (2002).
Five soils were selected for additional testing (solid symbols and solid lines in Fig.
6). These soils included three stockpile soils, one at each of Sites 1-3 (S1-XX to S3-
XX; XX is an identifier), the topsoil at Site 3 (S3-TS), and the finer-textured native
ground from Site 4 (S4-NG-1). Topsoil at Site 3 was selected to define topsoil
properties for use in water balance modeling. The topsoil at Site 3 was coarser than
the topsoil at Site 4, and was expected to provide a conservative representation of
topsoil available for the cover. The three stockpile soils constitute a broad range in
particle size distribution (Fig. 6), and were selected to define a range of anticipated
hydraulic properties. The fine-grained native ground soil (S4-NG-1 in Fig. 6) was
selected for comparison with the stockpile soils.

Compaction Properties
Compaction tests were conducted on the five soils using ASTM D 698 (standard
Proctor). All soils were scalped on a 9.5-mm sieve, and a coarse-fraction correction
was applied to account for particles larger than 9.5 mm using the procedure in ASTM
D 4718. Compaction curves for the three stockpile soils were comparable, with
maximum dry unit weight (dmax) ranging between 18.3 and 20.1 kN/m3 and optimum
water content (wopt) ranging between 8.2 and 11.4% (Benson and Bareither 2011).
The compaction curve reported by Miller (2002) for the 2002 Missoula Cover also
falls in this range (dmax = 19.9 kN/m3, wopt = 9.6%).
0
20
40
60
80
100
0.010.1110100
S1-SP-1
S1-SP-2
S1-NG
S2-SP
S3-TS
S3-SP-1
S3-SP-2
S4-TS
S4-NG-1
S4-NG-2
Per
cent
Pas
sing (
%)
Particle Size (mm)
FIG. 6. Particle size distribution curves for 10 soils sampled at Missoula landfill.
Solid symbols correspond to soils selected for hydraulic property
characterization; SP = stockpile, TS = topsoil, and NG = native ground.
Hydraulic Properties
Saturated hydraulic conductivity was determined on each of the five soils following
the procedure in ASTM D 5084. Specimens were compacted to 85% of dmax at wopt
per ASTM D 698 in 150-mm-diameter molds. Relatively low compaction is used to
ensure that the cover soils provide a hospitable environment for root growth (Albright
et al. 2010). The effective stress was set at 15 kPa and the hydraulic gradient at 10 to
represent conditions existing in a cover.
Soil water characteristic curves (SWCCs) were measured on specimens prepared to
the same compaction conditions as specimens for the hydraulic conductivity tests.

Procedures described in ASTM D 6836 were followed. The wet end of each SWCC
was measured using a pressure plate extractor and the dry end with a chilled mirror
hygrometer. Eq. 1 was fit to the SWCC data using non-linear least-squares
optimization (Fig. 7).
10-1
100
101
102
103
104
105
0.0 0.1 0.2 0.3 0.4 0.5 0.6
S1-SP-1S2-SPS3-TSS3-SP-1S4-NG-1
Suct
ion (
kP
a)
Volumetric Water Content
Symbols:
Solid = pressure plate
Open = hygrometer
FIG. 7. SWCCs for stockpile soils from Sites 1, 2, and 3, Site 3 topsoil, and Site 4
native ground.
Saturated hydraulic conductivities and van Genuchten parameters for the SWCCs
are summarized in Table 7. Saturated hydraulic conductivity of the stockpile soils
varies in a narrow range from 3.7x10⁻⁶
cm/s to 6.0x10⁻⁵
cm/s. The SWCCs for the
stockpile soils are also comparable (Fig. 8), with ranging from 0.0958 to 0.145
1/kPa, n ranging from 1.27 to 1.28, and s ranging from 0.35 to 0.41. Similar
hydraulic properties were reported in Miller (2002) for the storage layer of the 2002
Missoula Cover (Table 3).
VEGETATION
Vegetation samples were collected for measurement of site-specific properties for
input to the numerical model. Four locations in the surrounding grassland were
selected that had mature vegetation representative of the area surrounding the landfill.
A test pit was excavated in each location for root samples and a sampling area was
selected for collecting surface biomass. Root samples were collected at 150-mm
intervals from the sidewall of each test pit using the modified Weaver-Darland

method described in Benson et al. (2007b) and placed in evacuated re-sealable plastic
bags. Samples of surface biomass were collected from four 1-m2 areas by removing
all biomass with shears. Surface biomass samples were placed in evacuated plastic
bags that were sealed in the field. All of the samples were stored in a refrigerator at 4 oC prior to analysis.
Table 7. Saturated hydraulic conductivity and unsaturated hydraulic
properties for soils sampled from Missoula Landfill.
Sample Sampling
Site KS (cm/s) (1/kPa) n s r
S1-SP-2 1 6.0x10⁻⁵
0.126 1.27 0.36 0.0
S2-SP 2 3.7x10⁻⁶
0.0958 1.28 0.35 0.0
S3-TS 3 2.8x10⁻⁶
0.0496 1.33 0.50 0.0
S3-SP-1 3 1.2x10⁻⁵
0.145 1.28 0.41 0.0
S4-NG-1 4 1.6x10⁻⁶
0.115 1.24 0.45 0.0
2002 Miss.
Cover - 4.9x10
-5 0.520 1.28 0.34 0.0
Notes: KS = saturated hydraulic conductivity; and n = fitting parameters for van Genuchten equation
(Eq. 1); s = saturated volumetric water content; r = residual volumetric water content; SP = stockpile;
TS = topsoil; NG = native ground.
Leaf area of the clippings was measured using a LI-COR LI-3100C leaf area meter
and leaf area index (LAI) was computed as the quotient of the total leaf area and the
sampling area (1 m2). The following LAIs were obtained: 1.46, 1.61, 1.86, and 1.99.
Root densities were measured by soaking each root sample in tap water for 48 h,
separating the roots from the soil particles, and air drying the root mass as described
in Benson et al. (2007b). Normalized root density profiles for the four pits are shown
in Fig. 8. The root profiles in each pit were remarkably similar, and a single root
density function was fit to the combined data set from all four pits using least-squares
regression.
STORAGE ANALYSIS
A storage analysis was conducted to determine the required thickness of the storage
layer (L). This consisted of equating SR (Eqs. 3-5) and SA (Eq. 2) and solving for L:
L = SR/(FC – WP) (6)
SWCCs corresponding to the combinations of s, r, , and n yielding the highest and
lowest available storage capacity were used to define FC and WP. Computations
were made using two required storage capacities (SR): (1) SR = 133 mm for the
wettest year on record and (2) SR = 204 mm for the 95th
percentile precipitation year.
Accounting for pedogenesis increased SA for the Polson and Helena sites. Thus,
pedogenesis was not included when computing the storage layer thickness with Eq. 4.
In addition, pedogenesis is known to make cover soils more similar (Benson et al.

2007a, 2011a), and the hydraulic properties from the soil resource evaluation are
similar to the in-service soils for Polson and Helena. Thus, adjusting the hydraulic
properties of the Missoula soils obtained from the soil resource evaluation for
pedogenesis probably would have been unrealistic.
0.0
0.2
0.4
0.6
0.8
1.0
1.2
1.4
0.0 0.2 0.4 0.6 0.8 1.0
Pit 1
Pit 2
Pit 3
Pit 4
Dep
th -
z (
m)
Normalized Root Density - R
R = 3.12·e(-16.32·z)
+ 0.002
FIG. 8. Normalized root densities from the four test pits at Missoula landfill.
The required storage layer thicknesses (Table 8) ranged from 740-950 mm for SR =
133 mm (average = 840 mm) and from 1190-1560 mm for SR = 204 mm (average =
1370 mm), with thicker layers required for the soil with lower storage capacity.
Based on this analysis, a preliminary design was selected with a 1.22-m-thick storage
layer overlain by a 0.15-m-thick topsoil layer. This cover was expected to provide
acceptable storage capacity under most meteorological conditions for typical soils on
site. A thicker cover could have been proposed to address worst case conditions, but
the assumptions were conservative and increasing the thickness would have raised
construction costs an unacceptable amount.
Table 8. Storage layer thicknesses for required storage (SR)
representing wettest year on record (SR = 133 mm) and
95th
percentile precipitation year (SR = 204 mm).
Storage Layer Capacity Storage layer thickness (mm)
SR = 133 mm SR = 204 mm
Lower Bound Storage Capacity1 950 1560
Upper Bound Storage Capacity2 740 1190
1 = 0.145 1/kPa, n = 1.27, s = 0.35, r = 0.0;
2 = 0.096 1/kPa, n = 1.28, s =
0.41, r = 0.

WATER BALANCE MODELING
The variably saturated flow model WinUNSAT-H was used to predict the water
balance for the proposed water balance cover. WinUNSAT-H (and its DOS
counterpart UNSAT-H), is the most widely used numerical model for simulating the
hydrology of water balance covers (Benson 2007). When properly parameterized,
WinUNSAT-H provides a reliable prediction of the water balance of covers, and over
predicts the percolation rate modestly in most cases (Khire et al. 1997, Ogorzalek et
al. 2007, Bohnhoff et al. 2009). WinUNSAT-H simulates variably saturated flow,
root water uptake, and climatic interactions (Benson 2007, 2010).
Soil Properties
Hydraulic properties used in the design were selected so that the percolation would
not be under-predicted, and likely would be over predicted. The topsoil layer was
assigned the hydraulic properties associated with Soil S3-TS (Table 7), except the
saturated hydraulic conductivity was increased one order of magnitude to account for
pedogenesis and to ensure that runoff comprised no more than 10% of the annual
water balance, as recommended in Albright et al. (2010). Saturated hydraulic
conductivity of the storage layer was set at 6x10⁻⁵
cm/s, the highest of the saturated
hydraulic conductivities (Soil S1-SP-2, Table 7) measured during the site
characterization. The SWCC was defined using the combination of van Genuchten
parameters measured during site characterization yielding the lowest storage capacity.
Vegetation
The vegetation was assigned the minimum LAI (1.46) and the root density function
(Fig. 8) obtained from the site characterization. Phenology and water stress
parameters described previously (from Roesler et al. 2002) were input.
Meteorological Data
Four meteorological data sets were used for the simulations: the typical year (1984),
the wettest year on record, the 95th
percentile precipitation year, and the 10-yr period
with the highest precipitation (1977-1986). The 10-yr period with the highest
precipitation is recommended for design in MDEQ’s Draft Alternative Final Cover
Guidance.
The simulations were conducted in two phases. The first phase consisted of a 5-yr
simulation using meteorological data for the typical year for each year of the
simulation (i.e., typical year repeated 5 times). This simulation had two purposes: (i)
to create a realistic initial condition for the simulations conducted with the 10-yr
record with the highest precipitation and (ii) to define a ‘typical’ percolation rate for
the cover, as defined in Albright et al. (2010). The second phase followed
immediately after the first phase, and consisted of one of the following: (i) the wettest
year on record run 5 times sequentially, (ii) the 95th
percentile precipitation year run 5

times sequentially, and (iii) the complete 10-yr record with the highest average
precipitation. All three of these scenarios are suggested in Albright et al. (2010).
The simulations with the wettest year and the 95th
percentile precipitation year are
relatively simple to conduct, and are expected to be very conservative (the likelihood
over 5 sequential very wet years is very small). Many engineers believe this design
strategy is unrealistic and too conservative. The record for the 10-yr wettest period is
realistic, but is more difficult and time consuming to simulate.
Water Balance Predictions
Annual water balances predicted by WinUNSAT-H are summarized in Table 9 for
each year of the 10-yr period with highest precipitation along with the average water
balance over the 10-yr period, the typical year, the wettest year on record, and the
95th
percentile precipitation year. Predictions for the five-year repetitive simulations
are for the final year. The maximum annual runoff was 6.6% (95th
percentile
precipitation year), indicating that nearly all precipitation reaching the surface
became infiltration. Thus, the water balance predictions met the runoff criterion (<
10% of annual water balance) suggested in Albright et al. (2010), which applies to
arid and humid climates.
Table 9. Predicted water balance quantities for water balance cover with 1.22-
m-thick storage layer and 0.15-m-thick topsoil layer.
Year
Annual Water Balance Quantity
Cum-
ulative
Precip.
(mm)
Cum-
ulative
Runoff
(mm)
Cum-
ulative ET
(mm)
Cum-
ulative
Percolation
(mm)
Avg. Soil
Water
Storage
(mm)
Runoff
(% Precip.)
1977 322 0.0 276 1.1 203 0.0
1978 299 0.0 330 7.1 242 0.0
1979 263 0.0 268 4.3 228 0.0
1980 483 16 446 5.7 246 3.3
1981 441 1.5 422 3.0 223 0.3
1982 390 7.8 367 15.9 270 2.0
1983 424 0.0 417 6.6 244 0.0
1984 339 0.1 387 4.2 224 0.0
1985 318 0.3 338 1.5 195 0.1
1986 425 0.0 406 1.5 206 0.0
Avg.
(77-86) 370 2.5 366 5.1 228 0.7
Typ.
(1984) 338 0.0 366 1.1 197 0.0
Wettest
(1998) 556 19.0 522 21.3 285 3.4
95th
%
(1975) 469 30.8 410 36.4 294 6.6

The annual percolation rate during the wettest 10-yr period ranged from 1.1 to 15.9
mm/yr, with an average of 5.1 mm/yr. The percolation rate was no more than 3.0
mm/yr for four years in the 10-yr period, and no more than 1.5 mm/yr for three years.
For the typical year, the percolation rate was 1.1 mm/yr. Much higher percolation
rates were obtained from the 5-yr repetitive simulations using the wettest year on
record (21.3 mm/yr) and the 95th
percentile precipitation year (36.4 mm/yr). The
higher percolation rate predicted for the 95th
percentile precipitation year is consistent
with the findings from the storage assessment.
The water balance graphs for the typical, wettest, and 95th
percentile precipitation
years are shown in Fig. 9. These graphs illustrate that differences in the total amount
of precipitation, as well as the time when precipitation is received, are responsible for
the wide range of percolation rates transmitted for these meteorological conditions.
During the typical year (Fig. 9a), most of the precipitation occurs in spring and
summer (≈ Julian days 100-300), when ET is high. All of the precipitation during
this period along with water stored in the cover is returned to the atmosphere, as
evinced by a nearly monotonic drop in soil water storage during this period. Storage
begins to climb again in mid-fall when ET begins to diminish (> Julian day 300), but
the increase in storage is modest because the precipitation is small.
During the wettest year, the majority of the precipitation occurs in spring and early
summer (≈ Julian days 90-190) (Fig. 9b). The precipitation between Julian days 130-
190 is so heavy at times that soil water storage increases periodically during this
period, even though ET is high. In mid-summer to early fall, however, the
precipitation rate is low again and the soil water storage diminishes to 223 mm,
although not to the very low storage (181 mm) in mid fall of the typical year. Heavy
precipitation in late fall raises the soil water storage at the end of the year to 302 mm,
106 mm more than soil water storage at the end of the typical year. This additional
storage, when combined with heavy precipitation during the first 25 d of the new
year, results in peak storage of 341 mm that persists through spring. At this level of
soil water storage, percolation is transmitted and continues through summer.
The 95th
percentile precipitation year received less precipitation than the wettest
year on record, but more precipitation (26 mm) was received during the fall than
occurred in the fall of the wettest year (Fig. 9c). As a result, soil water storage was
325 mm at the end of the year, i.e., higher than at the end of the wettest year on
record (302 mm). This high soil water storage, coupled with heavy precipitation
during the first 40 d of the new year (100 mm, vs. 50 mm during the same period
during the wettest year), resulted in a peak soil water storage of 380 mm at Julian day
49. Percolation began earlier in the year due to the high soil water storage at the end
of the previous year, increased significantly as the soil water storage reached its peak,
and continued through summer.
Comparison of the water balance graphs in Fig. 9 to the water balance graph in Fig.
10 for the 10-yr period with the most precipitation illustrates that high levels of soil
water storage at the end of the previous year, combined with wetter than normal
conditions in the winter and spring, consistently give rise to the highest percolation
rates. The highest percolation rate predicted in the 10-yr simulation was in 1982 (15.9
mm/yr), which occurred in response to a sustained period of frequent and less intense
precipitation beginning in late Fall 1981 and continuing into early Fall 1982. This
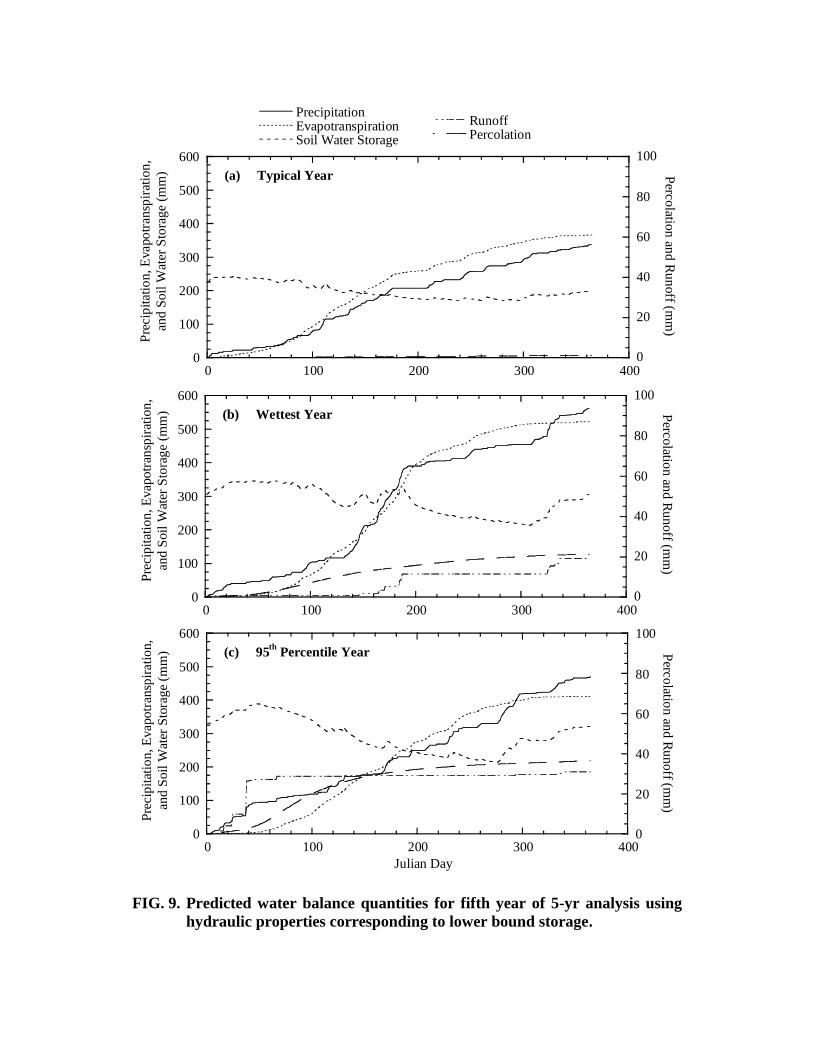
0
100
200
300
400
500
600
0
20
40
60
80
100
0 100 200 300 400
PrecipitationEvapotranspirationSoil Water Storage
RunoffPercolation
Pre
cip
itat
ion
, E
vapo
tran
spir
atio
n,
and
Soil
Wat
er S
tora
ge
(mm
) Perc
olatio
n an
d R
un
off (m
m)
(a) Typical Year
0
100
200
300
400
500
600
0
20
40
60
80
100
0 100 200 300 400
Pre
cip
itat
ion
, E
vap
otr
ansp
irat
ion
,
and
Soil
Wat
er S
tora
ge
(mm
) Perc
olatio
n an
d R
un
off (m
m)
(b) Wettest Year
0
100
200
300
400
500
600
0
20
40
60
80
100
0 100 200 300 400
Pre
cip
itat
ion
, E
vap
otr
ansp
irat
ion,
and
Soil
Wat
er S
tora
ge
(mm
) Perc
olatio
n an
d R
un
off (m
m)
Julian Day
(c) 95th
Percentile Year
FIG. 9. Predicted water balance quantities for fifth year of 5-yr analysis using
hydraulic properties corresponding to lower bound storage.

0
1000
2000
3000
4000
0
100
200
300
400
1977 1978 1979 1980 1981 1982 1983 1984 1985 1986 1987
Precipitation Evapotranspiration Soil Water Storage Runoff Percolation
Cum
ula
tive
Pre
cip
itat
ion a
nd E
vap
otr
ansp
irat
ion (
mm
)S
oil W
ater Sto
rage an
d
Cum
ulativ
e Runoff an
d P
recipitaio
n (m
m)
FIG. 10. Water balance predictions for 10-yr period with highest average precipitation made with WinUNSAT-H using
hydraulic properties corresponding to lower bound on storage properties.

condition led to a very large increase in storage during the winter of 1982, even
though four years during the 10-yr period (1980, 1981, 1983, and 1986) had higher
annual precipitation than 1982.
The second highest annual percolation rate (7.1 mm/yr) occurred in 1978, even
though this year was drier than average (299 mm precipitation vs. 337 mm, on
average) and only one year during the 10-yr record had less annual precipitation (263
mm in 1979). Like 1982, percolation in 1978 occurred in response to a large increase
in soil water storage in late Fall 1977 and Winter 1978 that was caused by a sustained
period of frequent and less intense precipitation. Thus, the timing of precipitation and
the sequencing from one year to the next has a critical impact on the accumulation of
storage and the amount of percolation that occurs.
The timing and sequencing of precipitation is represented realistically using actual
multi-year time series, whereas repetitive simulations with the wettest year on record
or the 95th
percentile year probably are unrealistic. As shown in Fig. 10, very wet
years generally are not sequential, and the likelihood of five very wet years occurring
sequentially is very small.
Implications
None of the modeling predictions confirm that the design objective (3 mm/yr average
percolation rate) will be accomplished. The percolation rate for the typical year (1.1.
mm/yr) is lower than the design objective, but the average percolation rate over the
10-yr period with highest precipitation (5.1 mm/yr) exceeds the design objective.
Percolation rates greatly in excess of the design objective were obtained from the 5-yr
repetitive simulations, but these simulations are considered unrealistic.
The long-term percolation rate could be evaluated by simulating the entire 50-yr
meteorological record or a very long record generated with a synthetic weather
generator based on meteorological statistics for Missoula. However, either simulation
would be very time consuming and computationally costly, and probably would not
be practical for most projects. This type of simulation was considered impractical for
the Missoula landfill.
The average of the percolation rate from the typical year and from the 10-yr
simulation is 3.1 mm/yr, which is slightly larger than the design objective. Given
that the 10-yr record used in the simulation is the wettest decade on record, and that
periods of drought will also occur along with typical conditions, the long-term
average percolation rate is likely to be less than 3.1 mm/yr. Thus, the design
objective likely will be met, and MDEQ concurred that this conclusion is reasonable.
Based on this assessment, and the favorable monitoring data from the covers in
Polson and Helena, the final design consisted of a 1.22-mm-thick storage layer
overlain by 0.15 m of topsoil.
TEST SECTION
A field demonstration of the cover is being conducted using an ACAP-style test
section constructed following the methods described in Benson et al. (1999). The test
section slopes at 3% to simulate the actual top deck slope for the landfill, and faces

north to receive the greatest snow accumulation and lowest solar radiation (i.e., worst
case orientation). The test section includes a 10 m x 20 m pan-type lysimeter (Fig.
11) for direct measurement of the water balance, including surface runoff, soil water
storage, and percolation. The base and sidewalls of the lysimeter are comprised of
linear low-density polyethylene geomembrane, and the base is overlain with a
geocomposite drainage layer to protect the geomembrane and to transmit percolation
to a zero-storage sump. Diversion berms are placed on the surface to prevent run-on
and collect run-off.
Cover
Soils
Instrument
NestDiversion
Berm
Geomembrane
Liner
Geocomposite
DrainInterim
Cover
Soil
Root
Barrier
Surface
Runoff
Percolation
Diversion
Berm
FIG. 11. Schematic of test section for evaluating performance of the water
balance cover (not to scale).
Instrumentation
Percolation and surface runoff are routed by pipes to basins equipped with a pressure
transducer, tipping bucket, and float switch (triple redundancy) capable of measuring
flows with a precision better than 0.1 mm/yr (Benson et al. 2001). Soil water content
is measured in three nests located at the quarter points along the centerline. Each nest
contains 5 low-frequency (40 MHz) time domain reflectometry (TDR) probes in a
vertical stack. Soil water storage is determined by integration of the point
measurements of water content. Each probe includes a thermistor for monitoring soil
temperature along with water content. Soil-specific calibration of the TDR probes
was conducted using the method in Benson and Wang (2006).
Meteorological data (precipitation, air temperature, relative humidity, solar
radiation, wind speed, and wind direction) are measured with a weather station
mounted on the test section. Data are collected and recorded by a datalogger every 15
min and are stored on one-hour intervals. At times of intense activity (e.g., an intense
rain event with high surface runoff), data are stored at time intervals as short as every
15 s. Data from the test section are stored on a server equipped with a screening level
quality assurance (QA) algorithm. Detailed QA checks are conducted quarterly. At
the time this paper was prepared, the duration of the monitoring period was too short
to present the monitoring data in a useful manner.

Placement of Cover Profile
Prior to constructing the cover profile, a layer of soil simulating the existing interim
cover was placed on top of the geocomposite drainage layer. The interim cover layer
was overlain with a root barrier (thin nonwoven geotextile studded with nodules
containing trifluralin, a root inhibitor) to prevent root intrusion into the geocomposite
drainage layer and the percolation collection system. Inclusion of the root barrier
results in less water being transpired than might occur in an actual cover, where roots
can grow through the interim cover and into the waste (Albright et al. 2004).
However, the root barrier prevents plants from having access to water retained in the
collection and measurement system that would otherwise become deep drainage in an
actual application.
The storage layer was constructed with soil from Site 3, which was placed over the
root barrier using a bulldozer in three 0.41-m-thick lifts. The dry unit weight was
required to be 80-90% of maximum dry unit weight per standard Proctor and the
water content was required to be no wetter than optimum water content, as
recommended in Albright et al. (2010). Thick lifts were used to minimize the
potential for over compaction of the soil, as is common in practice during
construction of water balance covers.
Topsoil stripped from Site 3 was placed on the surface and fertilized to stimulate
growth. Seed was not added; the natural seed bank within the topsoil serves as the
source of seed. This “live haul” approach creates a more realistic and sustainable
plant community that is consistent with the surroundings.
SUMMARY AND CONCLUSIONS
The key steps required to design and demonstrate a water balance cover have been
illustrated in this paper using a case history where a cover was designed for a MSW
landfill in Missoula, Montana. This design process evolved from two decades of
research. The state-of-the-art developed through research is now being applied as
state-of-the-practice.
The process begins by understanding the design objective (including regulatory
requirements) and investigating lines of evidence indicating that a water balance
cover is likely to function satisfactorily at the design location. For the Missoula case
history, regional data from two instrumented water balance covers were used along
with meteorological data to illustrate that a water balance cover could be successful in
Missoula if sized properly. Site characterization was then conducted to define
properties of the soil resources and vegetation at the site for preliminary cover sizing
and numerical modeling of the water balance. A preliminary design was created using
semi-empirical analytical methods and the design was evaluated by simulation with a
numerical model using several design meteorological conditions as input.
The numerical modeling illustrated that predictions made with an actual multiyear
time series (e.g., wettest 10-yr period in the meteorological record) are more realistic
than predictions from 5-yr repetitive simulations using a worst case design year,
which have been recommended historically and have become common in practice.
The multiyear simulations preserve realistic sequencing of seasonal precipitation

patterns, which have a strong influence on soil water storage and percolation rate. The
drawback is that multiyear simulations are more cumbersome and time consuming to
conduct.
The final design for the Missoula landfill is a monolithic water balance cover
comprised of a 1.22-m storage layer overlain by a 0.15-m topsoil layer. A field
demonstration with a fully instrumented lysimeter was deployed in October 2011 to
confirm that the cover performs as anticipated in the design.
ACKNOWLEDGEMENT
The US Environmental Protection Agency, the National Science Foundation, the US
Department of Energy (DOE), the US Nuclear Regulatory Commission, Republic
Services, Inc., Waste Connections Inc., Waste Management Inc., Monsanto
Corporation, and Benson’s Wisconsin Distinguished Professorship have provided
financial support for Professor Benson’s research program on water balance covers.
A portion of the support from DOE has been provided through the DOE Landfill
Partnership within the Consortium for Risk Evaluation with Stakeholder Participation
(CRESP) awarded to Vanderbilt University. The opinions, findings, conclusions, or
recommendations expressed herein are those of the authors and do not necessarily
represent the views of the US Department of Energy, Vanderbilt University, or any of
the other sponsors. Republic Services Inc. provided financial support for the case
history described in this paper. GSE Inc. provided the geosynthetics for the test
section. William Albright, Jiannan Chen, Brad Lyles, Jose Llobell Ruvira, Jhan
Sorenson, and Xiaodong Wang assisted with construction of the test section.
REFERENCES
Albrecht, B., Benson, C., and Beuermann, S. (2003), Polymer Capacitance Sensors
for Measuring Soil Gas Humidity in Drier Soils, Geotech. Testing J., 26(1) 3-12.
Albright, W. H., Benson, C. H., and Waugh, W. J. (2010). Water Balance Covers for
Waste Containment, Principles and Practice, American Society of Civil Engineers,
ASCE Press, Reston, Virginia.
Albright, W. H., Benson, C. H., Gee, G. W., Roesler, A C., Abichou, T.,
Apiwantragoon, P., Lyles, B. F., and Rock, S. A. (2004). Field Water Balance of
Landfill Final Covers, J. Environmental Quality, 33(6), 2317-2332.
Allen, R. G., Pereira, L. S., Raes, D., and Smith, M. (1998). Crop Evapotranspiration
– Guidelines for Computing Crop Water Requirements, FAO Irrigation and
Drainage Paper 6, Food and Agriculture Organization of the United Nations, Rome.
Apiwantragoon, P. (2007). Field Hydrologic Evaluation of Final Covers for Waste
Containment, PhD Dissertation, University of Wisconsin, Madison, WI.
Benson, C. (2001), Waste Containment: Strategies and Performance, Australian
Geomechanics, 36(4), 1-25.
Benson, C. (2007), Modeling Unsaturated Flow and Atmospheric Interactions,
Theoretical and Numerical Unsaturated Soil Mechanics, T. Schanz, Ed., Springer,
Berlin, 187-202.

Benson, C. (2010), Predictions in Geoenvironmental Engineering: Recommendations
for Reliable Predictive Modeling, GeoFlorida 2010, Advances in Analysis,
Modeling, and Design, Geotechnical Special Publication No. 199, D. Fratta, A.
Puppula, and B. Muhunthan, eds., ASCE, Reston, VA, 1-13.
Benson, C., Abichou, T., Albright, W., Gee, G., and Roesler, A. (2001), Field
Evaluation of Alternative Earthen Final Covers, International J. Phytoremediation,
3(1), 1-21.
Benson, C., Abichou, T., Wang, X., Gee, G., and Albright, W. (1999), Test Section
Installation Instructions – Alternative Cover Assessment Program, Environmental
Geotechnics Report 99-3, Dept. of Civil & Environmental Engineering, University
of Wisconsin-Madison.
Benson, C., Albright, W., Fratta, D., Tinjum, J., Kucukkirca, E., Lee, S., Scalia, J.,
Schlicht, P., Wang, X. (2011a), Engineered Covers for Waste Containment:
Changes in Engineering Properties & Implications for Long-Term Performance
Assessment, NUREG/CR-7028, Office of Research, U.S. Nuclear Regulatory
Commission, Washington.
Benson, C. and Bareither, C. (2011), Design and Performance Demonstration of a
Water Balance Cover at Missoula Landfill in Missoula, Montana, Geotechnics
Report No. 11-21, Wisconsin Geotechnics Laboratory, University of Wisconsin,
Madison, WI.
Benson, C., Bosscher, P., Lane, D., and Pliska, R. (1994), Monitoring System for
Hydrologic Evaluation of Landfill Final Covers, Geotech. Testing J., 17(2), 138-
149.
Benson, C. and Chen, C. (2003), Selecting the Thickness of Monolithic Earthen
Covers for Waste Containment, Soil and Rock America 2003, Verlag Gluck auf
GMBH, Germany, 1397-1404.
Benson, C. and Khire, M. (1995), Earthen Covers for Semi-Arid and Arid Climates,
Landfill Closures, ASCE, GSP No. 53, J. Dunn and U. Singh, eds., 201-217.
Benson, C., Sawangsuriya, A., Trzebiatowski, B., and Albright, W. (2007a), Post-
Construction Changes in the Hydraulic Properties of Water Balance Cover Soils, J.
Geotech. Geoenvironmental Eng., 133(4), 349-359.
Benson, C., Thorstad, P., Jo, H., and Rock, S. (2007b), Hydraulic Performance of
Geosynthetic Clay Liners in a Landfill Final Cover, J. Geotech. Geoenvironmental
Eng., 133(7), 814-827.
Benson, C., Waugh, W., Albright, W., Smith, G., and Bush, R. (2011), Design and
Installation of a Disposal Cell Cover Field Test, Proc. Waste Management ‘11,
Phoenix, AZ.
Bohnhoff, G., Ogorzalek, A., Benson, C., Shackelford, C., and Apiwantragoon, P.
(2009), Field Data and Water-Balance Predictions for a Monolithic Cover in a
Semiarid Climate, J. Geotech. Geoenvironmental Eng., 135(3), 333-348.
Khire, M., Benson, C., and Bosscher, P. (1997), Water Balance Modeling of Earthen
Final Covers, J. Geotech. Geoenvironmental Eng., 123(8), 744-754.
Khire, M., Benson, C., and Bosscher, P. (1999), Field Data from a Capillary Barrier
in Semi-Arid and Model Predictions with UNSAT-H, J. Geotech.
Geoenvironmental Eng., 125(6), 518-528.

Khire, M., Benson, C., and Bosscher, P. (2000), Capillary Barriers: Design Variables
and Water Balance, J. Geotech. Geoenvironmental Eng., 126(8), 695-708.
Khire, M., Meerdink, J., Benson, C., and Bosscher, P. (1995), Unsaturated Hydraulic
Conductivity and Water Balance Predictions for Earthen Landfill Final Covers, Soil
Suction Applications in Geotechnical Engineering Practice, ASCE, GSP No. 48,
W. Wray and S. Houston, eds., 38-57.
Malusis, M. and Benson, C. (2006), Lysimeters versus Water-Content Sensors for
Performance Monitoring of Alternative Earthen Final Covers, Unsaturated Soils
2006, ASCE Geotechnical Special Publication No. 147, 1, 741-752.
Meerdink, J., Benson, C., and Khire, M. (1995), Unsaturated Hydraulic Conductivity
of Two Compacted Barrier Soils, J. Geotech. Eng., 122(7), 565-576.
Miller (2002), Alternative Final Cover Evaluation, Missoula Landfill, Missoula
Landfill, report prepared by Miller Engineers and Scientists, Sheboygan, WI.
Ogorzalek, A., Bohnhoff, G., Shackelford, C., Benson, C., and Apiwantragoon, P.
(2007), Comparison of Field Data and Water-Balance Predictions for a Capillary
Barrier Cover." J. Geotech. Geoenvironmental Eng., 134(4), 470-486.
Roesler, A., Benson, C., and Albright, W. (2002), Field Hydrology and Model
Predictions for Final Covers in the Alternative Cover Assessment Program – 2002,
Geo Engineering Report 02-08, University of Wisconsin-Madison.
Schlicht, P., Benson, C., Tinjum, J., and Albright, W. (2010), In-Service Hydraulic
Properties of Two Landfill Final Covers in Northern California, GeoFlorida 2010,
Advances in Analysis, Modeling, and Design, Geotechnical Special Publication No.
199, D. Fratta et al., eds., ASCE, Reston, VA, 2867-2877.
Shackelford, C. and Benson, C. (2006), Selected Factors Affecting Water-Balance
Predictions for Alternative Covers Using Unsaturated Flow Models, Geotechnical
Engineering in the Information Technology Age, D. DeGroot, J. DeJong, J. Frost,
and L. Baise, eds., ASCE.
Smesrud, J., Benson, C., Albright, W., Richards, J., Wright, S., Israel, T., and
Goodrich, K. (2012), Using Pilot Test Data to Refine an Alternative Cover Design
in Northern California, International J. Phytoremediation, in press.
Stormont, J. (1995), The Effect of Constant Anisotropy on Capillary Barrier
Performance, Water Resources Research, 32(3), 783-785.
Stormont, J. and Morris, C. (1998), Method to Estimate Water Storage Capacity of
Capillary Barriers, J. Geotech. Geoenviron. Eng. ASCE, 124(4), 297-302.
Suwansawat, S. and Benson, C. (1998), Cell Size for Water Content-Dielectric
Constant Calibrations for Time Domain Reflectometry, Geotechnical Testing J.,
22(1), 3-12.
UNESCO (1999), Map of the World Distribution of Arid Regions. MAB Tech. Notes
No. 7, United Nations Educational, Scientific and Cultural Organization, Paris
van Genuchten, M. T. (1980). A closed-form equation for predicting the hydraulic
conductivity of unsaturated soils, Soil Science Society of America J., 44(5), 892-
898.
Wang, X. and Benson, C. (2004), Leak-Free Pressure Plate Extractor for Measuring
the Soil Water Characteristic Curve, Geotech. Testing J., 27(2), 1-10.
Waugh, W., Benson, C., and Albright, W. (2008), Monitoring the Performance of an
Alternative Landfill Cover Using a Large Embedded Lysimeter, Proceedings,
Global Waste Management Symposium 2008, Penton Media, Orlando, 1-10.
Waugh, W., Benson, C., and Albright, W. (2009), Sustainable Covers for Uranium
Mill Tailings, USA: Alternative Design, Performance, and Renovation, Proc. 12th
International Conference on Environmental Remediation and Radioactive Waste
Management, ICEM2009, ASME, 11-15 October 2009, Liverpool, UK.
Zornberg, J., LaFountain, L., and Caldwell, J. (2003). Analysis and Design of
Evapotranspirative Cover for Hazardous Waste Landfill. J. Geotech. Geoenviron.
Eng., ASCE, 129(6), 427-436.
NNoonn--TTeexxttbbooookk SSooiill MMeecchhaanniiccss::
PPeeaattllaanndd SSooiillss aanndd MMuunniicciippaall WWaassttee
GGuueesstt LLeeccttuurreerr DDrr.. AArrvviidd LLaannddvvaa

Non-texbook soil mechanics: peatland soils
and municipal waste
Professor Arvid Landva
ABSTRACT:
A peatland soil could be anything from an extremely coarse-fibrous woody matting
containing an insignificant amount of inorganic constituents to a gyttja-like and extremely
soft soil containing up to 80% minerals (the Swedish term gyttja comprises dead
microscopic animals decomposed to a flocculent substance in which the mineral particles
are embedded). With such a large range of composition it follows that it is important to
describe the peatland soil in detail. A case record or specification for construction on
peatland is of little value without such detailed description. In a fibrous peat with little
inorganic content most of the primary compression takes place during construction.
Interparticle and intraparticle waters in the peat are expulsed simultaneously because the
peat structure is open at all common degrees of humification. The main geotechnical
problem in fibrous peat is settlement rather than strength. In gyttja-like soils the
consolidation is similar to that in soft clays; in addition, secondary consolidation is often
quite prominent. Another major problem in gyttja-like soils is their very low strength.
Municipal waste is another non-textbook material, generally highly fibrous (as placed),
heterogeneous, erratic, highly compressible, and displaying significant long-term
settlement caused by plastic creep and decomposition. Neither undisturbed sampling nor
field testing is practical. And despite the relatively widespread use of laboratory tests for
the purpose of determining strength properties, laboratory testing of artificially prepared
samples must also be considered questionable. This is so because the structure of the waste
in the field is really indeterminate and cannot therefore be reliably duplicated in the
laboratory. Also, sampling of undecomposed or partly decomposed waste can be expected
to lead to changes in the particle size distribution, while sampling of strongly decomposed
waste may not be possible because of caving problems. Another important consideration,
generally overlooked by the profession, is the fact that the waste is subject to decomposition
and that the stipulation of constant strength parameters like cohesion and friction may
therefore not be valid.
Recommendations are offered for what the author considers a rational approach to dealing
with the geotechnical behaviour and testing of non-textbook soils.

GGeeoo--CChheemmiiccaall CCoonnttrrooll ooff PPoorree FFlluuiiddss ffoorr
LLiiqquueeffaaccttiioonn MMiittiiggaattiioonn
GGuueesstt LLeeccttuurreerr DDrr.. MMaarriiaa CCaatteerriinnaa CC.. SSaannttaaggaattaa
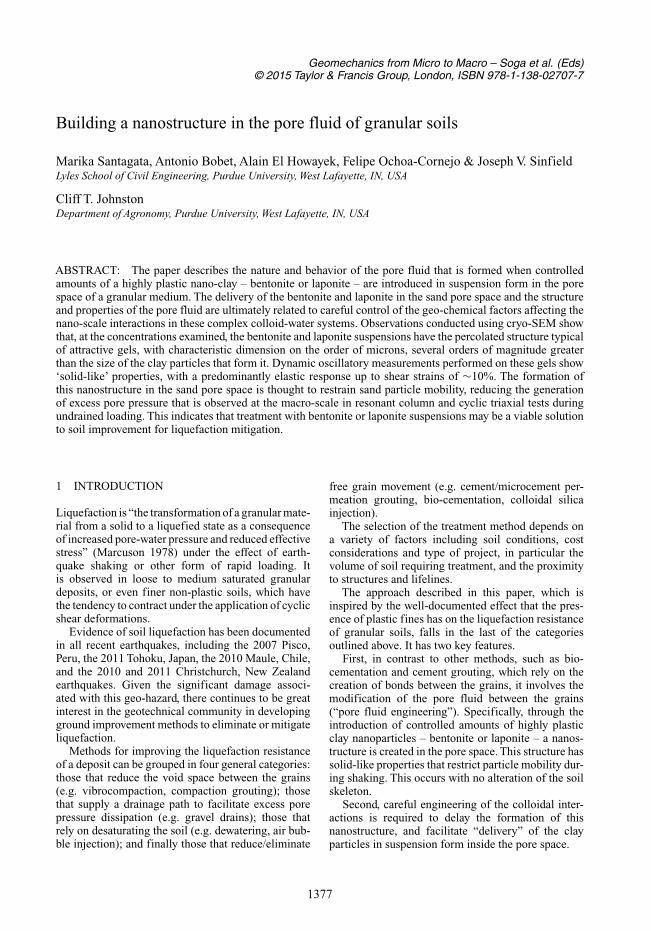
Geomechanics from Micro to Macro – Soga et al. (Eds)© 2015 Taylor & Francis Group, London, ISBN 978-1-138-02707-7
Building a nanostructure in the pore fluid of granular soils
Marika Santagata, Antonio Bobet, Alain El Howayek, Felipe Ochoa-Cornejo & Joseph V. SinfieldLyles School of Civil Engineering, Purdue University, West Lafayette, IN, USA
Cliff T. JohnstonDepartment of Agronomy, Purdue University, West Lafayette, IN, USA
ABSTRACT: The paper describes the nature and behavior of the pore fluid that is formed when controlledamounts of a highly plastic nano-clay – bentonite or laponite – are introduced in suspension form in the porespace of a granular medium. The delivery of the bentonite and laponite in the sand pore space and the structureand properties of the pore fluid are ultimately related to careful control of the geo-chemical factors affecting thenano-scale interactions in these complex colloid-water systems. Observations conducted using cryo-SEM showthat, at the concentrations examined, the bentonite and laponite suspensions have the percolated structure typicalof attractive gels, with characteristic dimension on the order of microns, several orders of magnitude greaterthan the size of the clay particles that form it. Dynamic oscillatory measurements performed on these gels show‘solid-like’ properties, with a predominantly elastic response up to shear strains of ∼10%. The formation ofthis nanostructure in the sand pore space is thought to restrain sand particle mobility, reducing the generationof excess pore pressure that is observed at the macro-scale in resonant column and cyclic triaxial tests duringundrained loading. This indicates that treatment with bentonite or laponite suspensions may be a viable solutionto soil improvement for liquefaction mitigation.
1 INTRODUCTION
Liquefaction is “the transformation of a granular mate-rial from a solid to a liquefied state as a consequenceof increased pore-water pressure and reduced effectivestress” (Marcuson 1978) under the effect of earth-quake shaking or other form of rapid loading. Itis observed in loose to medium saturated granulardeposits, or even finer non-plastic soils, which havethe tendency to contract under the application of cyclicshear deformations.
Evidence of soil liquefaction has been documentedin all recent earthquakes, including the 2007 Pisco,Peru, the 2011 Tohoku, Japan, the 2010 Maule, Chile,and the 2010 and 2011 Christchurch, New Zealandearthquakes. Given the significant damage associ-ated with this geo-hazard, there continues to be greatinterest in the geotechnical community in developingground improvement methods to eliminate or mitigateliquefaction.
Methods for improving the liquefaction resistanceof a deposit can be grouped in four general categories:those that reduce the void space between the grains(e.g. vibrocompaction, compaction grouting); thosethat supply a drainage path to facilitate excess porepressure dissipation (e.g. gravel drains); those thatrely on desaturating the soil (e.g. dewatering, air bub-ble injection); and finally those that reduce/eliminate
free grain movement (e.g. cement/microcement per-meation grouting, bio-cementation, colloidal silicainjection).
The selection of the treatment method depends ona variety of factors including soil conditions, costconsiderations and type of project, in particular thevolume of soil requiring treatment, and the proximityto structures and lifelines.
The approach described in this paper, which isinspired by the well-documented effect that the pres-ence of plastic fines has on the liquefaction resistanceof granular soils, falls in the last of the categoriesoutlined above. It has two key features.
First, in contrast to other methods, such as bio-cementation and cement grouting, which rely on thecreation of bonds between the grains, it involves themodification of the pore fluid between the grains(“pore fluid engineering”). Specifically, through theintroduction of controlled amounts of highly plasticclay nanoparticles – bentonite or laponite – a nanos-tructure is created in the pore space. This structure hassolid-like properties that restrict particle mobility dur-ing shaking. This occurs with no alteration of the soilskeleton.
Second, careful engineering of the colloidal inter-actions is required to delay the formation of thisnanostructure, and facilitate “delivery” of the clayparticles in suspension form inside the pore space.
1377

Figure 1. A multi-scale approach to liquefaction mitigation.
Figure 1 illustrates the different scales involved inthe problem: the nano-scale, at which the colloidalinteractions occur; the micron scale, which as dis-cussed below, describes the characteristic length scaleof the structure formed in the pore space; the mm sizescale of the pores; and finally, the cm to m scale atwhich liquefaction is observed. It also illustrates thevision behind this work, i.e. how a large-scale geotech-nical problem can be addressed by controlling thebehavior/interactions over a range of scales.
The following sections provide some detail on theproposed approach to soil improvement for liquefac-tion mitigation, highlighting the scale based effectsthat ultimately enable the observed macro behavior.After introducing the materials used in this study (Sec-tion 2), Section 3 describes how the concept of creatinga structured pore fluid is founded on fundamental con-siderations of colloidal interactions supported by novelobservations of the structure of clay gels, and mea-surements of the mechanical properties of these softmaterials. Section 4 goes on to illustrate how deliveryof the targeted amounts of bentonite or laponite insidethe pore space requires further exploitation of existingknowledge of colloidal interactions. Finally, Section5 briefly examines how the observations conducted atthe nano and micro scales relate to the macroscopicbehavior observed in element tests.
2 BENTONITE AND LAPONITE, HIGHLYPLASTIC NANO-CLAYS
Two nano-clays, both belonging to the smectite groupare discussed in this paper: bentonite and laponite.
Bentonite is a clay mostly formed by Na-montmorillonite that is widely used in geotechnicalapplications. The clay used in this study is a commer-cialWyoming sodium bentonite offered byVOLCLAY.It has at least 85% passing the No. 200 sieve, specificgravity of 2.65, and liquid and plastic limits equal to397% and 41%, respectively.
Laponite RD, herein referred to as laponite is asynthetic trioctahedral hectorite produced by South-ern Clay Products, Inc., Texas. Laponite particles havea fairly uniform disk shape, with 1 nm thickness, anddiameter of approximately 25 nm, 5–10 times smaller
than bentonite. The specific gravity of laponite isreported to be about 2.57 (Rockwood Additives Ltd.2011). Determinations of the liquid and plastic lim-its performed immediately after mixing the clay withwater yielded values of 1280% and 180%, respectively(El Howayek et al. 2011).
3 A CLAY BASED MECHANICALLYPERCOLATED PORE FLUID
3.1 Attractive gel state of clay-water suspensions
Clay-water suspensions are complex systems withstructure and properties that, for the same clay, dependon a variety of factors including solid concentra-tion, type and concentration of the cations and anionspresent in solution in the water, and pH. This is illus-trated in Figure 2, which presents “phase diagrams”previously obtained for a purified Wyoming Na-montmorillonite and laponite RD by other researchers.These figures show that for both of these materialsthere exists a region in which the suspensions form anattractive gel. As summarized by Tanaka et al. (2004),an attractive gel has the following characteristics:
– it is in a nonergodic state,– it has a percolated network structure that originates
from attractive interactions between the colloidalparticles,
– the characteristic length of the network is muchlarger than the size of the colloidal particle.
A schematic diagram of an attractive gel is shownin Figure 2c, in which the clay particles are repre-sented by black thick lines, while the gray regionsidentify the double layer. For comparison purposesFigure 2d shows a repulsive gel, a colloidal systemwhose response is controlled by caging effects, andwith characteristic length scale on the order of theinterparticle distance.
3.2 Direct observation of bentonite and laponiteattractive gel structure
The phase diagrams shown in Figure 2 were developedbased on rheological and/or osmometric measure-ments.
1378

Figure 2. Phase diagram of (a) Wyoming bentonite and (b)laponite RD; and schematics of (c) attractive gel and (d) repul-sive glass (adapted from Abend & Lagaly 2000 and Tanakaet al. 2004).
Direct observations of the percolated structure ofbentonite and laponite gels have been performed bythe authors using cryo-scanning electron microscopy(Cryo-SEM). In cryo-SEM the sample is cooledrapidly in nitrogen slush, sublimated at −85◦C toremove the unbound water and imaged under cryo-genic conditions (∼−130◦C). Thus it remains close toits natural state and dehydration is prevented. More-over, the rapid cooling process avoids the artifacts dueto water crystallization (Negre et al. 2004).This is idealfor materials such as the laponite and bentonite sus-pensions described here, which have very high watercontents (>1000%) and a delicate structure that wouldbe damaged as a result of volumetric changes to itswater fraction.
Figure 3 shows images obtained making use of theFEI NOVA nanoSEM in Purdue University’s Life Sci-ence Microscopy facility for two gels prepared withdeionized water: an 11% suspension of a rawWyomingbentonite and a 3% laponite RD suspension (concen-trations expressed as mass of clay over total mass ofthe suspension).
Note that the concentration of the raw bentonitesuspension used for the cryo-SEM (and for the testsbelow) is much greater than the values shown in Fig-ure 2a.This is because the phase diagram was obtainedfor a purified Na-montmorillonite (prepared from theraw bentonite following a multi-step treatment process
Figure 3. Cryo-SEM of (a)–(b) 11% Wyoming bentoniteand (c)–(d) 3% laponite gels (Solomon 2006, El Howayek2011).
that included sodium saturation, size fractionation, anddialysis to remove all impurities). In the case of a rawbentonite, the formation of an attractive gel is shiftedto much higher values of clay concentration (Huang2013).
The micrographs in Figures 3a, b show that theclay particles form a percolated network aroundcells occupied by water. Measurements by Solomon(2006) indicate that the average cell size is 3.9 µm(+1.9 µm). This dimension greatly exceeds the size ofthe bentonite particles, confirming that the suspensionstructure is that of an attractive gel.
A networked structure is observed also in the imagesof the laponite suspension. Figure 3c shows a structurein which parallel elongated cells are grouped into smalldomains. Each domain contains several cells that havethe same orientation (Figure 3c), which differs fromthat of the neighboring domains, resulting in an overallisotropic structure. Measurements by El Howayek etal. (2014) indicate that the width and the length of theelongated cells range from 5 to 10 µm, and 80 µm to200 µm, respectively. Both of these dimensions exceedthe size of the laponite particle by several orders ofmagnitude.
3.3 Rheology of attractive gel
Dynamic oscillatory measurements conducted usingan advanced rheometer (Physica MCR 301) revealthe mechanical response of the concentrated ben-tonite and laponite suspensions shown in Figure 3.In these tests, which measure the visco-elastic prop-erties with increasing shear strain (also referred toas “strain sweeps”), the suspension is subjected toan oscillatory shear strain (γ = γ0sin[ωt]) of increas-ing amplitude at constant frequency (ω = 1 Hz) whilemeasuring the resulting shear stress τ, which, in gen-eral, is shifted by a phase angle δ with respect tothe strain wave. τ can also be expressed as the sumof an elastic (solid) component in phase with the
1379

Figure 4. Results of dynamic oscillatory tests on concen-trated (a) bentonite and (b) laponite suspensions.
applied strain, and an out-of-phase viscous compo-nent: τ = γ0{G′sin(ωt) + G′′cos(ωt)}, where G′ andG′′ are termed the storage (elastic) and loss (viscous)moduli, respectively (e.g. Barnes et al. 1989).
Figure 4a shows an example of the results of a strainsweep test conducted on a 10% Wyoming bentonitesuspension 2 days after mixing (see Section 4 for adiscussion of the effect of time). The figure showsplots of storage modulus (G′), loss modulus (G′′),and phase angle (δ) as a function of shear strain γ .For γ as large as 1–2%, G′ remains basically con-stant. As reflected also by the value of δ very closeto zero, in this region G′ � G′′, i.e. the response ofthe material is essentially elastic, typical of solid-likebehavior, and consistent with the attractive gel struc-ture observed in the cryo-SEM images. Comparableresults are reported in Figure 4b for a 2 day old 3.25%laponite suspension, which, despite the ∼3 times lowerclay concentration, has similar mechanical propertiesto the 10% bentonite suspension.
For both suspensions, once the shear strain exceedsa critical value, the storage modulus drops signif-icantly, and the behavior of the material becomesincreasingly viscous. With continued shearing, thereis significant degradation in G’ (while the viscousmodulus, G′′ increases), but the material continues toexhibit essentially solid-like behavior (i.e. G′ > G′′) upto shear strains exceeding 10%.This suggests that up tothese magnitudes of the shear strain, the clay gel willbe able to restrain any movement of the sand grainsduring cyclic loading.
Moreover, Santagata et al. (2014) and El Howayek(2011) show that even after significant and repeatedstraining, as a result of their thixotropic nature, boththe bentonite and the laponite suspensions exam-ined in this work immediately recover their orig-inal solid-like response, and with time recuperatethe intact mechanical properties. This suggests that,if effective in mitigating soil liquefaction, the pro-posed treatment with laponite or bentonite suspensionswould be self-healing, i.e. would be expected to resist
Figure 5. Flow curve for a 3% laponite suspension 15minutes after mixing.
multiple earthquakes, even after undergoing localizedstraining.
4 ENGINEERING NANO-SCALEINTERACTIONS TO ENABLE TREATMENTDELIVERY
For bentonite and laponite to be practical solutions fortreating a sand deposit susceptible to liquefaction itbecomes necessary to find the means to deliver thesenano-clays inside the sand pores. However, deliveryof the amounts of bentonite or laponite identified inSection 3 in the sand pore space in suspension formposes significant practical challenges, as it requiresthat on the short term the suspensions have rheologicalproperties (no yield stress and low viscosity) and solrather than gel structure that allow their permeationinside a porous medium; but that once inside the sandpores, the suspensions regain the gel-like nature andsolid-like properties observed in Figures 3–4.
From this point of view, laponite offers an advan-tage over bentonite, in that, for concentrations up to∼3.25%, the suspensions display an initial Newtonianbehavior and a naturally retarded gelation process. Asan example, the data in Figure 5 from a constant shearrate ramp test on a 3% laponite suspension, performed15 minutes after mixing the clay with water, show thatthe behavior of the suspension is similar to that of aNewtonian fluid, with an almost constant value of theviscosity, about 4 times that of water. This reflects that,at this time, the suspension is in form of a sol.
With continued time, the suspension displaysincreasing viscosity (e.g. at 1 hour the viscosity is dou-bled), and after 1.5 hours, oscillatory measurementsshow a transition from sol to gel state. As a result,within this time window it is possible to permeate thesuspensions at least at the laboratory scale with noadditional treatment. Similar observations are reportedby El Howayek (2011) for a 3.25% laponite RD sus-pension, although the initial viscosity is higher (7 vs.4 mPa·s) and the sol-gel transition time is reduced to0.4 hours.
1380

Figure 6. Variation of storage modulus with time for ben-tonite and laponite suspensions.
The evolution of the mechanical response of thelaponite suspension is illustrated in Figure 6, whichreports the storage modulus (G′) measured at smallstrains as a function of time for concentrations of 3 and3.25%. At early ages, G′ falls below G′′ (not shown),reflecting the liquid-like behavior of the suspension.With time G′ increases and the suspension developsa solid like response, with a value of the phase anglevery close to zero (see Figure 4b for the behavior after2 days).
The above is not true for bentonite, and for this pur-pose, a methodology was developed (Santagata et al.2014) to chemically modify the rheology of bentonitesuspensions through the use of sodium pyrophosphatedecahydrate (Na4P2O7.10H2O), or SPP. The anionof SPP, which has a negative charge of −4, has ahigh affinity for the broken edges of clay minerals,and once sorbed onto these positively charged sites,imparts them a negative charge. This effectively limitsedge to face interactions, preventing the formation ofa gel and reducing the viscosity of the suspension.
This is illustrated in Figure 6, which shows thechange in storage modulus measured over time fora 10% bentonite suspension treated with 0.5% SPP(by mass of the clay). This is the minimum dosage ofSPP that allows permeation of the concentrated sus-pension inside a laboratory column of Ottawa sandwith height of ∼45 cm (El Mohtar et al. 2013). Forreference the figure also shows the variation in G′of an untreated 10% bentonite suspension. As shownin Figure 6, at very short times, the addition of SPPcauses the storage modulus (and the viscosity) of thesuspension to decrease by several orders of magni-tude, allowing permeation into a porous medium. Overtime, by a mechanism that is not completely under-stood, the effect of the SPP disappears. As a result, G′increases, eventually leading to the formation of a gelstructure with behavior similar to that of Figure 4a, andwith thixotropic properties that allow rapid healing ofthe gel structure, as described above for the untreatedlaponite and bentonite gels.
Compared to the laponite suspensions, the recov-ery of the storage modulus is much slower (with 7months required for the 0.5% SPP suspension to reachthe value attained by the 3% laponite suspension after7 days). Similar behavior is observed for suspensions
Figure 7. Results of resonant column tests on clean sandand laponite-permeated sand specimens.
Figure 8. Cryo-SEM image of laponite-permeated sand.
treated with higher dosages of SPP. The greater theSPP%, the greater the reduction in viscosity and stor-age modulus, but also the more delayed the formationof the gel, and the weaker structure of the gel formedat a given time.
5 RELATIONSHIP TO MACRO-RESPONSE
The effects of the presence of the bentonite or lapnitegel on the response of treated sand are illustrated inthe results of tests performed on specimens of Ottawasand permeated in the laboratory with concentratedsuspensions of laponite or bentonite.
Figure 7 shows data obtained from two resonantcolumns tests: one conducted on a specimen of cleanOttawa sand with Dr = 22%, the other on an identicalspecimen permeated with a 3.25% laponite suspen-sion. Both specimens were consolidated to 100 kPaand tested undrained. The laponite-permeated spec-imen was tested after 72 hours of aging to allowdevelopment of the gel structure. The data show thatthe laponite-permeated specimen exhibits a retardedgeneration of excess pore pressure and a less signifi-cant reduction in shear stiffness at any strain level.Thiscan be attributed to the restraining action provided bythe laponite gel, which, as shown in the cryo-SEMimage presented in Figure 8, forms a dense networkaround the sand particles.
Under cyclic shearing this effect is manifested asan increase in the number of cycles sustained under
1381

Figure 9. Results of cyclic triaxial tests (adapted from ElMohtar et al. 2013).
a given cyclic stress ratio (CSR). This is illustrated inFigure 9, which presents data for clean Ottawa sandspecimens and for specimens of the same sand and thesame relative density, permeated with a 10% bentonitesuspension treated with 0.5% SPP by dry mass of theclay, and aged for 20 days (to allow formation of thegel structure). It is seen that under a CSR of 0.11 thebentonite permeated specimen can sustain over 1000cycles, relative to only 5 for the untreated sand.
6 CONCLUSIONS
The paper has addressed some fundamental aspects ofa novel approach to soil improvement for liquefactionmitigation that is based on engineering the pore fluidof a sand through the introduction, in suspension form,of controlled amounts of two smectitic nano-clays:bentonite, a material widely used in the geotechnicalcommunity, and laponite a synthetic clay with diameter5–10 times smaller than that of bentonite.
The work presented demonstrates the influence ofnano and micro level interactions on the observedmacro behavior. At the core of the proposed approachis the formation in the sand pore space of an attrac-tive gel that has solid-like rheological characteristics.Its presence enables a clear reduction in the genera-tion of excess pore pressure during undrained loading,leading to an increased cyclic shear resistance, andindicating that this may be a viable approach to lique-faction mitigation. The overall benefits are believed tobe realizable in practice due to the demonstrated abil-ity to control the sol-to-gel transition of the nano-claysuspensions, enabling introduction of the engineeredpore fluid into the soil matrix with no disturbance.
ACKNOWLEDGEMENTS
This research was partially funded by the NationalScience Foundation, Geomechanics and Geotechni-cal Systems Program, under grants CMS-0408739 andCMS-0928679.
REFERENCES
Abend, S. & Lagaly, G. 2000. Sol-gel transitions of sodiummontmorillonite dispersions, Applied Clay Science, 16,(3–4): 201–227.
Barnes, H. A., Hutton, J.F., Walters, K. 1989. An Introductionto Rheology. Amsterdam: Elsevier Science Publ.
El Howayek, A. 2011. Characterization, rheology andmicrostructure of laponite suspensions. MS Thesis,School of Civil Eng., Purdue University, West Lafayette,IN.
El Howayek, A., Bobet, A., Johnston, C. T., Santagata, M.,Sinfield, J. V. 2014. Microstructure of sand-laponite-watersystems using cryo-SEM. In Abu-Farsakh et al. (ed.) Geo-congress 2014, Technical Papers: Geocharacterizationand Modeling for Sustainability,Atlanta, February 23–26,2014. New York: ASCE.
El Mohtar, C.S., Bobet A., Santagata M.C., Drnevich, V.P.,Johnston, C. 2013. Liquefaction mitigation using ben-tonite suspensions. J. Geotechnical & GeoenvironmentalEngineering 139(8): 1369–1380.
Huang, P.T. 2013. Rheology and lubrication properties ofclay-based fluids for trenchless technologies applica-tions. PhD Thesis, School of Civil Engineering, PurdueUniversity, West Lafayette, IN
Marcuson, W. F. III 1978. Definition of terms related toliquefaction.’ J. Geotech. Engrg. Div., ASCE, 104(9):1197–1200.
Negre, M., Leone, P., Trichet, J., Defarge, C., Boero, V., Gen-nari, M. 2004. Characterization of model soil colloidsby cryo-scanning electron microscopy. Geoderma 121(1–2):1–16.
Rockwood Additives Ltd. 2011. Laponite performanceaddtives. Specification sheet.
Santagata, M., Clarke, J.P., Bobet, A., Drnevich, V.P., ElMohtar, C.S., Huang, P.T., Johnston, C. 2014. Rheol-ogy of concentrated bentonite dispersions treated withsodium pyrophoshate for application in mitigating earth-quake induced liquefaction.” Applied Clay Science – inpress.
Solomon, W. 2006. Investigations of microstructure in aque-ous colloid dispersions: Na-montmorillonite as a casematerial. MS Thesis, School of Civil Engineering, PurdueUniversity, West Lafayette, IN.
Tanaka, H., Meunier, J., Bonn, D. 2004. Nonergodic states ofcharged colloidal suspensions: Repulsive and attractiveglasses and gels. Physical Review, E, 69(3): 031404-1-6.
1382