landscape and visual - erm · mine pv solar power facility, ... landscape and visual impact maps...
TRANSCRIPT

Annex E3
Landscape and Visual
ENVIRONMENTAL RESOURCES MANAGEMENT SOUTH DEEP SOLAR PV EIA

LANDSCAPE AND VISUAL IMPACT ASSESSMENT
FOR THE PROPOSED GOLD FIELDS SOUTH DEEP
MINE PV SOLAR POWER FACILITY,
GAUTENG PROVINCE,
SOUTH AFRICA
Date: 15th August 2017
Document prepared for ERM (Pty) Ltd.
Visual Resource Management Africa cc
P O Box 7233, George, 6531
Cell: +27 (83) 560 9911
E-Mail: [email protected]
Web: www.vrma.co.za

Gold Fields South Deep Mine PV LVIA
2
TABLE OF CONTENTS
2 NON-TECHNICAL SUMMARY ........................................................................................... 7
3 BACKGROUND ................................................................................................................ 10 3.1 STUDY TEAM ............................................................................................................................... 10 3.2 SCOPE OF STUDY ........................................................................................................................ 10 3.3 PROJECT DESCRIPTION AND LOCATION ......................................................................................... 11 3.4 ASSESSMENT OF ALTERNATIVES ................................................................................................... 13
4 LEGAL FRAMEWORK ..................................................................................................... 14 4.1 LEGISLATION AND POLICIES .......................................................................................................... 14 4.2 INTERNATIONAL GOOD PRACTICE ................................................................................................. 15
4.2.1 Guidelines for Landscape and Visual Impact Assessment, Second Edition ...................... 16 4.2.2 Guideline for Involving Visual and Aesthetic Specialists in the EIA Process ..................... 16 4.2.3 Performance Standard 6 (PS6): Biodiversity Conservation and Sustainable Management of Living Natural Resources .................................................................................... 17
5 APPROACH AND METHODS .......................................................................................... 18 5.1 INTRODUCTION ............................................................................................................................ 18
5.1.1 Objectives ........................................................................................................................ 18 5.1.2 Approach .......................................................................................................................... 18 5.1.3 Methods and Activities ...................................................................................................... 18 5.1.4 Assumptions and Limitations ............................................................................................ 20
5.2 SURVEYS AND DATA ANALYSIS ..................................................................................................... 20 5.2.1 Sampling Sites/ Areas ...................................................................................................... 20
5.3 IMPACT ASSESSMENT METHODOLOGY ........................................................................................... 22
6 BASELINE ENVIRONMENT ............................................................................................ 22 6.1 AREA OF INFLUENCE .................................................................................................................... 22 6.2 VISUAL BASELINE ENVIRONMENT .................................................................................................. 23
6.2.1 Visual Receptors .............................................................................................................. 23 6.2.2 Broad Landscape Descriptions ......................................................................................... 26 6.2.3 Visual Resources ............................................................................................................. 27 6.2.4 Visual Resource Management Classes ............................................................................ 30 6.2.5 Threats to Scenic Quality ................................................................................................. 31
7 IMPACT ASSESSMENT .................................................................................................. 32 7.1 VISUAL AND LANDSCAPE .............................................................................................................. 32
7.1.1 Reduction in visual resources for the Northern Receptors due to the construction of the solar PV facility ............................................................................................... 32 7.1.2 Reduction in visual resources for the Western Receptors due to the construction of the solar PV facility ............................................................................................... 33 7.1.3 Reduction in visual resources for the Southern Receptors due to the construction of the solar PV facility ............................................................................................... 35 7.1.4 Degradation of the landscape to due to the construction and operation of the solar PV facility ............................................................................................................................ 36
8 ESMP ................................................................................................................................ 38 8.1 VISUAL AND LANDSCAPE MANAGEMENT PLAN ................................................................................ 38 8.2 MONITORING ............................................................................................................................... 39
8.2.1 Construction and Operational Phases .............................................................................. 39
9 OPPORTUNITIES AND CONSTRAINTS ......................................................................... 40 9.1 OPPORTUNITIES ........................................................................................................................... 40 9.2 CONSTRAINTS.............................................................................................................................. 40
10 REFERENCES ............................................................................................................... 41

Gold Fields South Deep Mine PV LVIA
3
11 ANNEXURE A: LANDSCAPE AND VISUAL IMPACT MAPS ....................................... 42
12 ANNEXURE B: PHOTOMONTAGES ............................................................................. 53
13 ANNEXURE C: SPECIALIST INFORMATION ............................................................... 54 13.1 DECLARATION OF INTEREST ........................................................................................................ 54 13.2 CURRICULUM VITAE ................................................................................................................... 55
14 ANNEXURE D: VRM CHECKLISTS AND TERMINOLOGY .......................................... 61
15 ANNEXURE E: GENERAL LIGHTS AT NIGHT GUIDELINES ...................................... 64
TABLE OF FIGURES
FIGURE 1: TYPICAL PV ARRAY INDICATING THE LINEAR AND DARK COLOUR NATURE OF THE PROPOSED PV
PROJECT (ERM (PTY) LTD, 2017)..................................................................................................................................... 12 FIGURE 2: TYPICAL INVERTER ENCLOSURE (ERM (PTY) LTD, 2017) ........................................................................................ 12 FIGURE 3: TYPICAL POWER TRANSFORMER (ERM (PTY) LTD, 2017) ....................................................................................... 13 FIGURE 4: PANORAMIC PHOTOGRAPH TAKEN SOUTHEAST FROM SAMPLE POINT 1 OF THE GRASSLANDS,
ALIEN TREES AND THE SOUTH DEEP TWIN SHAFT MINE IN THE BACKGROUND AND THE D12324 ROAD
ADJACENT TO THE PROPOSED SITE. ............................................................................................................................... 21 FIGURE 5: PHOTOGRAPH TAKEN SOUTHWEST FROM SAMPLE POINT 2 OF THE GRASSLANDS, AND SLIGHTLY
UNDULATING TERRAIN................................................................................................................................................... 21 FIGURE 6: PHOTOGRAPH TAKEN SOUTHEAST FROM SAMPLE POINT 2 OF THE GRASSLANDS, AND SLIGHTLY
UNDULATING TERRAIN................................................................................................................................................... 21 FIGURE 7: VIEW OF THE D12324 ROAD LOCATED ADJACENT TO THE PROPOSED PV SITE. ................................................... 24 FIGURE 8: ZOOMED VIEW OF THE NORTHERN FARMSTEAD AS SEEN FROM THE PROPOSED SITE AT 1.2 KM
DISTANCE. ...................................................................................................................................................................... 25 FIGURE 9: ZOOMED VIEW OF THE WESTERN FARMSTEAD AS SEEN FROM THE PROPOSED SITE AT 1.3 KM
DISTANCE. ...................................................................................................................................................................... 25 FIGURE 10: ZOOMED VIEW OF THE SOUTH-WESTERN FARMSTEAD LOCATED AMONGST THE TREES AS SEEN
FROM THE PROPOSED SITE AT 1.6 KM DISTANCE. ......................................................................................................... 26 FIGURE 11: ECOPARTNER VEGETATION TYPES MAP (ERM (PTY) LTD, 2017) ......................................................................... 27 FIGURE 12: EXAMPLE OF LOW GLARE EFFECT FROM LOW ANGLE SUNLIGHT. ..................................................................... 31 FIGURE 13: PERCENTAGE SCALE OF LIGHT REFLECTING OF A VARIETY OF SURFACES. ......................................................... 32 FIGURE 14: PROJECT LOCALITY MAP IN RELATION TO THE GOLD FIELD’S SOUTH DEEP MINE. ............................................ 43 FIGURE 15: PROJECT PREFERRED PROPOSED SITE OVERLAY ONTO SA 1:50 000 TOPOCADASTRAL MAPS
SHEETS. ........................................................................................................................................................................... 44 FIGURE 16: PROJECT PRELIMINARY LAYOUT PLAN INDICATING THE PV ARRAYS AND 11 KV EMERGENCY
TRANSMISSION LINE. ..................................................................................................................................................... 45 FIGURE 17: WEST RAND DISTRICT MUNICIPALITY ENVIRONMENTAL OPPORTUNITIES MAPPING WITH
APPROXIMATE PROJECT LOCATION DEPICTED (BLUE ARROW). .................................................................................... 46 FIGURE 18: WEST RAND DISTRICT MUNICIPALITY ENVIRONMENTAL OPPORTUNITIES HERITAGE MAPPING
WITH APPROXIMATE PROJECT LOCATION DEPICTED. ................................................................................................... 47 FIGURE 19: REGIONAL DIGITAL ELEVATION AND PROFILE LOCALITY MAP ............................................................................ 48 FIGURE 20: NORTH TO SOUTH (ABOVE) AND WEST TO EAST (BELOW) PROFILES WITH THE YELLOW AND
GREEN LINES REPRESENTING THE PROPOSED PROJECT EXTENTS AND THE RED LINES REPRESENTING
THE DISTANCE BUFFERS. ................................................................................................................................................ 49 FIGURE 21: DEEP SOUTH MINE PV APPROXIMATE VIEWSHED AND ANTICIPATED AREA OF INFLUENCE MAP ..................... 50 FIGURE 22: DEEP SOUTH MINE PV KEY OBSERVATION POINT MAP ...................................................................................... 51 FIGURE 23: DEEP SOUTH MINE PV SITE LANDSCAPE CHARACTERISATION MAPPING WITH THE AREA MAINLY
DEFINED AS HIGHVELD GRASSLANDS ............................................................................................................................ 52

Gold Fields South Deep Mine PV LVIA
4
FIGURE 24: PANORAMIC PHOTOGRAPH AMENDMENT INDICATING THE APPROXIMATE EXTENT OF THE
PROPOSED PV FOOTPRINT. ............................................................................................................................................ 53
LIST OF TABLES
TABLE 1: AUTHORS AND CONTRIBUTORS TO THIS REPORT. .................................................................................................. 10 TABLE 2: PROPERTY NAME PER WIND FARM PORTION .......................................................................................................... 11 TABLE 3: SUMMARY DESCRIPTION OF PV ARRAY PROJECT COMPONENTS............................................................................ 13 TABLE 4: LEGISLATION AND POLICY TABLE ............................................................................................................................. 15 TABLE 5: VRM CLASS MATRIX TABLE ...................................................................................................................................... 19 TABLE 6: LIST OF SAMPLING SITES WHERE LANDSCAPE AND AESTHETIC SURVEY WAS CONDUCTED ................................... 20 TABLE 7: LANDSCAPE IMPACT SIGNIFICANCE RATING TABLE ................................................................................................. 22 TABLE 8: VISUAL IMPACT SIGNIFICANCE RATING TABLE ........................................................................................................ 22 TABLE 9: SCENIC QUALITY AND RECEPTOR SENSITIVITY TABLE .............................................................................................. 29 TABLE 10: PRE-MITIGATION VISUAL IMPACTS FOR THE REDUCTION IN VISUAL RESOURCES FOR THE
NORTHERN RECEPTORS DUE TO THE CONSTRUCTION OF THE SOLAR PV FACILITY ...................................................... 33 TABLE 11: PRE-MITIGATION VISUAL IMPACTS FOR THE REDUCTION IN VISUAL RESOURCES FOR THE
WESTERN RECEPTORS DUE TO THE CONSTRUCTION OF THE SOLAR PV FACILITY ......................................................... 34 TABLE 12: PRE-MITIGATION VISUAL IMPACTS FOR THE REDUCTION IN VISUAL RESOURCES FOR THE
SOUTHERN RECEPTORS DUE TO THE CONSTRUCTION OF THE SOLAR PV FACILITY ...................................................... 35 TABLE 13: PRE-MITIGATION IMPACT SIGNIFICANCE RATING FOR THE DEGRADATION OF THE LANDSCAPE TO
DUE TO THE CONSTRUCTION AND OPERATION OF THE SOLAR PV FACILITY ................................................................. 36 TABLE 14: VRM AFRICA PROJECTS ASSESSMENTS TABLE ....................................................................................................... 56 TABLE 15: SCENIC QUALITY CHECKLIST ................................................................................................................................... 61 TABLE 16: SENSITIVITY LEVEL RATING CHECKLIST .................................................................................................................. 62 TABLE 17: VRM TERMINOLOGY TABLE ................................................................................................................................... 63

Gold Fields South Deep Mine PV LVIA
5
GLOSSARY
Best Practicable Environmental Option (BPEO)
This is the option that provides the most benefit, or causes the least damage, to the
environment as a whole, at a cost acceptable to society, in the long, as well as the short,
term.
Cumulative Impact
The impact on the environment, which results from the incremental impact of the action
when added to other past, present, and reasonably foreseeable future actions, regardless
of what agency or person, undertakes such other actions. Cumulative impacts can result
from individually minor, but collectively significant, actions taking place over a period of
time.
Impact (visual)
A description of the effect of an aspect of a development on a specified component of the
visual, aesthetic or scenic environment, within a defined time and space.
Issue (visual)
Issues are concerns related to the proposed development, generally phrased as
questions, taking the form of “what will the impact of some activity be on some element of
the visual, aesthetic or scenic environment?”
Key Observation Points (KOPs)
KOPs refer to receptors (people affected by the visual influence of a project) located in the
most critical locations surrounding the landscape modification, who make consistent use of
the views associated with the site where the landscape modifications are proposed. KOPs
can either be a single point of view that an observer/evaluator uses to rate an area or
panorama, or a linear view along a roadway, trail or river corridor.
Management Actions
Actions that enhance the benefits of a proposed development, or avoid, mitigate, restore or
compensate for, negative impacts.
Receptors
Individuals, groups or communities who would be subject to the visual influence of a
particular project.
Sense of Place
The unique quality or character of a place, whether natural, rural or urban.
Scenic Corridor
A linear geographic area that contains scenic resources, usually, but not necessarily,
defined by a route.
Scoping
The process of determining the key issues, and the space and time boundaries, to be
addressed in an environmental assessment.
Viewshed
The outer boundary defining a view catchment area, usually along crests and ridgelines.
Similar to a watershed. This reflects the area in which, or the extent to which, the
landscape modification is likely to be seen.
Zone of Visual Influence (ZVI)
The ZVI is defined as ‘the area within which a proposed development may have an
influence or effect on visual amenity.’
Glare and Glint

Gold Fields South Deep Mine PV LVIA
6
Glare is defined in the Oxford dictionary (http://www.oxforddictionaries.com) as ‘shine with
a strong or dazzling light’. Glint is defined as the circumstance relating to ‘reflect small
flashes of light’
LIST OF ACRONYMS
APHP Association of Professional Heritage Practitioners
BLM Bureau of Land Management (United States)
BPEO Best Practicable Environmental Option
CALP Collaborative for Advanced Landscape Planning
DEA Department of Environmental Affairs (National)
DEA&DP Department of Environmental Affairs and Development Planning (Western
Cape Province)
DEM Digital Elevation Model
DoC Degree of Contrast
EIA Environmental Impact Assessment
EMP Environmental Management Plan
GIS Geographic Information System
I&APs Interested and Affected Parties
IEMA Institute of Environmental Management and Assessment (United Kingdom)
IEMP Integrated Environmental Management Plan
KOP Key Observation Point
MAMSL Metres above mean sea level
NELPAG New England Light Pollution Advisory Group
PSDF Provincial Spatial Development Framework
SAHRA South African National Heritage Resources Agency
SDF Spatial Development Framework
SEA Strategic Environmental Assessment
VAC Visual Absorption Capacity
VIA Visual Impact Assessment
VRM Visual Resource Management
ZVI Zone of Visual Influence

Gold Fields South Deep Mine PV LVIA
7
2 NON-TECHNICAL SUMMARY
Visual Resource Management Africa CC (VRMA) was appointed by ERM (Pty) Ltd to
undertake a LEVEL 3 Landscape and Visual Impact Assessment for the proposed Gold
Fields South Deep Mine PV Solar Energy Facility (SEF). The Level 3 LVIA included a site
visit, viewshed mapping and a landscape and visual impact assessment. Photomontages
were not generated due to the semi-industrial and mining nature of the existing
surrounding landscapes.
The finding of the Landscape and Visual Impact Assessment is that the site and local
visual resources will not be significantly degraded by the proposed PV Solar Energy
Facility landscape modification. Risks to the land degradation from cumulative landscape
and visual effects is rated Low. This is due to the low visual resources of the proposed site
in relation to the existing mining landscape context of the region, and the contained visual
extent of the project.
Baseline Phase
Based on the viewshed analysis, and the site visit, the Areas of Influence (AoI) of the
proposed project was mapped. This area is mainly located within the Foreground extent
(up to three kilometres) due to the following reasons:
The location of the low hills and ridgelines located to the north, west and east of the
proposed site.
The location of the Deep South mine dumps to the east of the proposed site.
Higher ground to the south.
Although the viewshed does extend outside of the Foreground (2 km) distance buffers, it is
very likely that vegetation and atmospheric influence would reduce the visual intensity of
the landscape effects. The mine landscapes adjacent to the site also increase the visual
absorption capacity of the area, reducing visual contrast to some degree. A such the
visual AoI of the proposed project is defined as Local and the zone of visual influence is
likely to be contained to the Foreground / Middle ground (6km) distance zone.
The field survey confirmed the grassland biome landscape, but also found that
transformation has taken place which includes old settlement areas and cultivation, alien
tree species, road access modifications as well as illegal dumping. The two broad
vegetation dominated landscapes are thus defined as:
Rand Highveld Grassland.
Transformed Rand Highveld Grassland.
The main landscape finding is that the two broad brush landscape types are similar in
character and the overall site Scenic Quality is graded Low. This is predominantly due
to the lack of uniqueness of the site, the homogeneity of the vegetation and the degraded
nature of the adjacent mine landscapes. The Landform is predominantly of shallow
gradient, located on a low ridge running along the length of the proposed site. The
vegetation is predominantly grassland but is modified with alien tree species, and some

Gold Fields South Deep Mine PV LVIA
8
access roads from previous farm related settlement. There are no visible water bodies on
site to add visual focus areas and colours are vegetation dominated, specifically the muted
browns of the grasslands. The grassland landscape is not a scarce feature in the
landscape and to the south of the proposed site is a common landscape. Adjacent
landscapes to the east are strongly mine infrastructure dominated, including mine
headgear, large structures, mine dumps and quarry landscapes. Adjacent landscapes to
the west include small farmstead settlements, small-holdings and road / power line
infrastructure which, although interesting in the setting, are not unique. Man-made
modifications on site include access roads associated with previous farming practices,
alien trees as well as illegal dumping which degrade the landscape to some degree.
The expected Receptor Sensitivity of the two landscapes is also graded Medium to Low
for both landscape types. During the public participation process, no landscape change
issues were raised. Local residents did indicate a concern relating to possible glare
impacts, which were addressed in the impact assessment phase. Due to the adjacent
Gold Field’s mines, the Type of Users in the area are mainly going to be mine related, with
some medium exposure views from the west related to farm / small-holding settlements.
Due to the residential nature of the western farming areas, the Type of User is rated as
Medium. The mine and adjacent access road result in a large volume of traffic utilising the
area and the Amount of Use is defined as High. Due to the predominant mining
landscapes of the adjacent lands, as well as the uniformity of the site which has no unique
landscape features, Public Interest is likely to be Low. Adjacent Land Users do not include
any tourists and are rated Low. The site has no legal protection and as such is rated Low
in terms of the Special Area category.
The existing built nature of the mine landscape, which increases the visual absorption
capacity of the site, in conjunction with the lower visual resources of the areas, result in a
Class IV visual objective being assigned to the proposed development area. The Class IV
objective is to provide for management activities that require major modifications to
the existing character of the landscape.
Impact Phase
The Visual impacts assessed related to changes that arise in the composition of available
views as a result of changes to the landscape, to people’s response to any changes, and
the overall impacts with respect to visual amenity. These include the colour change and a
massing effect created by the PV panels covering a large area, limited early morning glare
and some security lights at night. Based on the Area of Influence mapping, four receptor
locations were captured and evaluated in terms of the Key Observation Point Status. As
all the identified receptors are located with the Medium to High Exposure distance zone,
where views of the proposed PV landscape modification would be clearly visible all the
receptors view points were included as KOPs as visual impact points. The KOPs include:
Northern Farmstead.
Western Farmsteads.
South-western Farmstead.
The Construction and Operation Phase Pre-Mitigation Landscape and Visual
Significance is rated Minor due to Medium Resource Magnitude and Medium to Low

Gold Fields South Deep Mine PV LVIA
9
Receptor Sensitivity to landscape change. As the site is strongly associated with an
existing mining landscape, which includes mine head-gear, large structures, mine dumps
and movement of vehicles, landscape resources are rated Medium. As no visual concerns
(other than glare) were raised during the public participation process, it is likely that
receptor sensitivity to landscape change is likely to be Medium to Low. Due to the limited
mitigations measures required or available for this development, Residual Landscape and
Visual Impacts reflect the same rating as Pre-Mitigation Landscape Impacts.

Gold Fields South Deep Mine PV LVIA
10
3 BACKGROUND
Visual Resource Management Africa CC (VRMA) was appointed by ERM (Pty) Ltd to
undertake a LEVEL 3 Landscape and Visual Impact Assessment for the proposed Gold
Fields South Deep Mine PV Solar Energy Facility (SEF). A Level 3 assessment includes a
site visit, which was undertaken on the 8th of June 2016, viewshed mapping and impact
assessment. Photomontages were not required due to the semi-industrial nature of the
existing surrounding landscapes.
As defined in the draft scoping study, “Gold Fields in collaboration with Enel Green Power (EGP) is proposing a solar PV plant at their South Deep Gold mine near Westonaria, Gauteng. EGP will build, own and operate the solar plant. South Deep Joint Venture (SDJV), an unincorporated joint venture between GFI Joint Venture Holdings (Pty) Ltd and Gold Fields Operations Ltd, proposes to establish two solar photovoltaic (PV) power plants to:
Supplement power supply with “green/ clean” energy;
Diversify the Mine’s energy mix to reduce the mines reliance on fossil fuels and
include renewable energy; and
Contribute to the Mine’s strategic objective to reduce energy costs and decrease
the environmental footprint of the mine. (ERM (Pty) Ltd, 2017)
3.1 Study Team
Contributors to this study are summarised in Table 1 below.
Table 1: Authors and Contributors to this Report.
Aspect Person Organisation /
Company Qualifications
Landscape and Visual Assessment (author of this report)
Stephen Stead B.A (Hons) Human Geography, 1991 (UKZN, Pietermaritzburg)
VRMA Accredited with the Association of Professional
Heritage Practitioner and
16 years of experience in visual assessments including
renewable energy, powerlines, roads, dams across
southern Africa.
Undertook visual assessment studies of 45 renewable
energy projects in South Africa.
Contrast rating and editing.
Lisa Schultz B.A Fine Art 1989 (UKZN, Pietermaritzburg)
VRMA 8 years of experience in contrast ratings.
3.2 Scope of Study The scope of work for the visual study required the following:
Literature and policy review and mapping.
Preparation of visual baseline.
Assessment of viewshed landscape context.
Identification and Assessment of main receptors.
Assessment of site scenic quality of landscape.
Contrast rating from Key Observation Points.

Gold Fields South Deep Mine PV LVIA
11
Impact assessment as per defined criteria.
Describe relevant and implementable mitigation measures to reduce, avoid, or
minimise negative impacts and enhance positive impacts and recommendations.
Review of I&AP / Relevant Authority comments.
3.3 Project Description and Location
According to the scoping report, Enel Green Power has proposed the development of a 2x20MW solar photovoltaic (PV) power facility to supply power to the Gold Field South Deep Gold Mine. Photovoltaic Solar Panel technology is being proposed which will occupy up to a maximum of 120 ha (1.2 km2) for the 2x20MW Solar PV Plants. Motivation for the project by Gold Field’s is based on electricity prices that started to rise steeply from 2007 and have increased by 328% up to 2015 / 16 which presents a significant strain on the financial viability of operations at the Gold Field’s South Deep Gold Mine. Electricity costs constitute almost 11% of South Deep Gold Mine’s operating costs. As a result, Gold Fields Limited (GFL) “intend to make renewable energy a key part of their future energy mix at their South Deep Mine operations, especially given that the life of mine is more than 70 years”. GFL is also motivated by the need to reduce the carbon footprint of the mine by introducing renewable energy and this solar project. The ERM scoping report indicates that proposed project is to be developed on a green field site owned by Goldfields South Africa located on the Gold Field South Deep Gold Mine property near Westonaria in the Gauteng Province (Figure 12). The proposed site is located approximately 50 kilometres south-west of Johannesburg, South Africa. The GPS coordinates are 26°24’44” South and 27°40’ 30” East. As can be seen on the map, the site is located adjacent to existing mining operations but the site has not been used for mining activities or development. Table 2: Property Name per Wind Farm Portion
Property Attribute SG Number
Farm Name 347 Doornpoort
Portion Number 2,7,12 and 34
Parcel Number
SG21 codes T0IQ000000000347000002 T0IQ000000000347000007 T0IQ000000000347000012 T0IQ000000000347000034
The proposed PV SEF includes the following project components:
PV arrays
Invertors
Transformer
Power evacuation
Required road infrastructure
The PV modules are c-Si (Multicrystalline Silicon) which will be mounted on a single axis tracker. Central inverters with unit transformers will be used and the voltage level is 1500V. The panels will be mounted a 00 angle and the tracking angle will be 450. The expected maximum height of the PV Arrays is 4m above ground (see Photographs in Figure 1 below). The invertors will be enclosed and will not be visually dominating due to the size of the enclosure being smaller than the PV Array, as well as being located within the PV

Gold Fields South Deep Mine PV LVIA
12
Array (see Photographs in Figure 2 below). A single Power Transformer (see Photographs in Figure 3 below) will be required on site as well as power lines to evacuate the power from the facility. According to the scoping report, there is an existing 11 kV emergency overhead power line that connects to both South shaft with Twin shaft. As this line is not being utilised, it is proposed that this line be used to supply 20 MW to South shaft and 20 MW to Twin shafts by the solar plant cables “looping in and looping out” (LILO) of this existing power line. The reports also states that due to the importance of this line during a power outage, it is anticipated that two ‘loop in, loop out’ tie-in configurations will be used, one for each PV solar plant. Due to the close proximity of the existing 11 kV line, the two LILO routings will be less than one kilometre each and will be located between the proposed PV Array and the existing mine.
Figure 1: Typical PV Array indicating the linear and dark colour nature of the proposed PV
project (ERM (Pty) Ltd, 2017)
Figure 2: Typical Inverter Enclosure (ERM (Pty) Ltd, 2017)

Gold Fields South Deep Mine PV LVIA
13
Figure 3: Typical Power Transformer (ERM (Pty) Ltd, 2017)
Table 3: Summary Description of PV Array project components Feature Details
PV Array Area ##
PV Array Height
Road access
Length of powerline
Power line Height
Power Transformer Height
3.4 Assessment of Alternatives The scoping report indicates that consideration was undertaken of five alternative sites for the development of the Solar PV plant based on proximity to the existing Gold Fields Facilities. In terms of the technical alternatives assessment three of the sites were deemed as not technically suitable due to their smaller size. The most northern site was deemed technically suitable but was ranked as a No-Go due to biodiversity concerns raised during the environmental and social assessment. As the northern site was not a viable option in the final integrated assessment, the three other sites too small, Site 1 was selected for further assessment. The key considerations in the assessment of the preferred site were as follows:
Positives:
o The site is a greenfields site;

Gold Fields South Deep Mine PV LVIA
14
o Site 1 is located next to the mine’s main access road, no permissions
required from outside agencies for access roads;
o The entire 40MW plant (2 X 20MW) can be accommodated;
o The site is reasonably flat;
o Ease of Interconnection with Mine network; and
o The site is close to existing Mine infrastructure.
Negatives:
o Localized areas with dense bushes and trees to be cleared. This will
however not be problematic; and
o Selected outcrop can affect the installation of the solar panel steel supports
(possible localized drilling and / or excavation). (ERM (Pty) Ltd, 2017)
4 LEGAL FRAMEWORK
4.1 Legislation and Policies
In order to comply with the Visual Resource Management requirements, it is necessary to
clarify which planning policies govern the proposed property area to ensure that the scale,
density and nature of activities or developments are harmonious and in keeping with the
sense of place and character of the area. The proposed landscape modifications must be
viewed in the context of the planning policies from the following West Rand District
Municipality (WRDM) – Regional Growth and Development Strategy (West Rand District
Municipality, 2012) guidelines:

Gold Fields South Deep Mine PV LVIA
15
Table 4: Legislation and Policy Table
Legislation Requirements
West Rand District
Municipality (WRDM) – Regional Growth and Development Strategy (March 2012)
Environmental Opportunities
The West Rand District does have very valuable environmental assets and opportunities, which includes the following:
Ridges with high aesthetic and ecological values Agricultural potential Heritage (West Rand District Municipality, 2012)
The proposed project is located in an area that does include hilly terrain, but mapping in the WRDM Regional Growth and Development Strategy indicates the ridgelines in the Westonaria area to the north of the proposed site as having Class 1 aesthetic value, and ridgelines to the west as Class 2. Agricultural potential is also indicated as Medium or Low Potential in the mapping, and a Heritage mapping indicated that no important heritage sites lie within the proposed project area (refer to maps in Appendix A).
West Rand District
Municipality (WRDM) – Regional Growth and Development Strategy (March 2012)
Environmental Management
“It is the intention of the District (as part of the 2016 vision) to become the greenest district in South Africa, and have committed themselves to this goal through the Green IQ. Therefore, the District should focus on taking advantage of new opportunities in the knowledge and green economies as stated in the new National Growth Path. The following emerging issues were identified for consideration within the District”:
Biofuel Alternative energies (such as photovoltaic) Hazardous and new waste types Mine water pollution (e.g. Acid Mine Drainage) Nanotechnology Land Degradation
As indicated above, the WRDM environmental strategic planning does include alternative energies, which does include photovoltaic. Care should be taken to ensure that further land degradation does not take place.
4.2 International Good Practice For cultural landscapes, the following documentation provides good practice guidelines, specifically:
Guidelines for Landscape and Visual Impact Assessment (LVIA), Second Edition; (The
Landscape Institute, 2003);
Guideline for Involving Visual and Aesthetic Specialists in EIA Processes; (Oberholzer,
2005);
International Finance Corporation (IFC) Performance Standard 6 – Biodiversity
Conservation and Sustainable Management of Living Natural Resources; (IFC, 2012).

Gold Fields South Deep Mine PV LVIA
16
4.2.1 Guidelines for Landscape and Visual Impact Assessment, Second Edition
The Landscape Institute and the Institute of Environmental Management and Assessment have compiled a book outlining best practice in landscape and visual impact assessment. This has become a key guideline for LVIA in the United Kingdom. “The principal aim of the guideline is to encourage high standards for the scope and context of landscape and visual impact assessments, based on the collegiate opinion and practice of the members of the Landscape Institute and the Institute of Environmental Management and Assessment. The guidelines also seek to establish certain principles and will help to achieve consistency, credibility and effectiveness in landscape and visual impact assessment, when carried out as part of an EIA” (The Landscape Institute, 2003: pg 4). In the introduction, the guideline states that ‘Landscape encompasses the whole of our external environment, whether within village, towns, cities or in the countryside. The nature and pattern of buildings, streets, open spaces and trees – and their interrelationships within the built environment – are an equally important part of our landscape heritage” (The Landscape Institute, 2003: pg 9). The guideline identified the following reasons why landscape is important in both urban and rural contexts, in that it is:
An essential part of our natural resource base;
A reservoir of archaeological and historical evidence;
An environment for plants and animals (including humans);
A resource that evokes sensual, cultural and spiritual responses and contributes to our
urban and rural quality of life;
A valuable recreation resource.
4.2.2 Guideline for Involving Visual and Aesthetic Specialists in the EIA Process
This guideline for visual and aesthetic specialists in the EIA process was coordinated by the CSIR, compiled by Bernand Oberholzer Landscape Architects, and issued by the Provincial Government of the Western Cape (Department of Environmental Affairs and Development Planning). The purpose of this guideline was to provide decision-makers with adequate and appropriate information about the potential positive and negative visual and aesthetic impacts of a proposed development and any associated management actions in order to make an informed decision on whether or not to approve, proceed with or finance the development (Oberholzer, 2005; pg 2). The following specific concepts should be considered during visual input into the EIA process:
An awareness that 'visual' implies the full range of visual, aesthetic, cultural and
spiritual aspects of the environment that contribute to the area's sense of place;
The consideration of both the natural and the cultural landscape, and their inter-
relatedness;
The identification of all scenic resources, protected areas and sites of special interest,
together with their relative importance in the region;
An understanding of the landscape processes, including geological, vegetation and
settlement patterns, which give the landscape its particular character or scenic
attributes;
The need to include both quantitative criteria, such as 'visibility', and qualitative criteria,
such as aesthetic value or sense of place;
The need to include visual input as an integral part of the project planning and design
process, so that the findings and recommended mitigation measures can inform the
final design, and hopefully the quality of the project; and

Gold Fields South Deep Mine PV LVIA
17
The need to determine the value of visual/aesthetic resources through public
involvement. (Oberholzer, 2005; Pg. 2).
4.2.3 Performance Standard 6 (PS6): Biodiversity Conservation and Sustainable Management
of Living Natural Resources
Under IFC PS 6, ecosystem services are organized into four categories, with the third
category related to cultural services which are defined as “the non-material benefits people
obtain from ecosystems”; and “may include natural areas that are sacred sites and areas
of importance for recreation and aesthetic enjoyment” (IFC, 2012). The Millennium
Ecosystem Assessment (2005) defined these non-material benefits that can be obtained
from ecosystems:
Inspiration: Ecosystems provide a rich source of inspiration for art, folklore, national
symbols, architecture, and advertising;
Aesthetic values: Many people find beauty or aesthetic value in various aspects of
ecosystems, as reflected in the support for parks, scenic drives, and the selection of
housing locations;
Sense of place: Many people value the “sense of place” that is associated with
recognised features of their environment, including aspects of the ecosystem;
Cultural heritage values: Many societies place high value on the maintenance of either
historically important landscapes (“cultural landscapes”) or culturally significant
species; and
Recreation and ecotourism: People often choose where to spend their leisure time
based in part on the characteristics of the natural or cultivated landscapes in a
particular area.
The Millennium Ecosystem Assessment (2005) Ecosystems and Human Well-being: Synthesis report indicates that there has been a “rapid decline in sacred groves and species” in relation to spiritual and religious values, and aesthetic values have seen a “decline in quantity and quality of natural lands”.
Gold Fields South Deep Mine PV LVIA
18
5 APPROACH AND METHODS
5.1 Introduction
5.1.1 Objectives
The ERM Landscape and Visual guidelines recommend that separate reports for Landscape and Visual Impacts be provided (ERM, 2014). However, the project scope was for a single report, which takes both landscape and visual impacts into consideration. The follow quotation from the report indicates the difference between the two assessments. “Landscape impacts derive from changes in the physical landscape; which may give rise to changes in its character and how this is experienced. This in turn may affect the perceived value attributed to the landscape. Visual impacts relate to changes that arise in the composition of available views as a result of changes to the landscape, to people’s response to any changes, and the overall impacts with respect to visual amenity”. (ERM, 2014)
5.1.2 Approach
. The following criteria defined by ERM represent the approach of the assessment:
Define the scenic values of the potentially affected area required to preserve areas
of high scenic value.
Review the project design in the context of the identified scenic values to identify
focus areas for field work.
Undertake a field survey to confirm the visual impacts of the project and define
potential mitigation through proposing alternative routing, where considered
feasible.
Undertake a landscape and visual impact assessment of the agreed and final
project.
5.1.3 Methods and Activities
The process that VRMA follows when undertaking a LVIA is based on the United States
Bureau of Land Management’s (BLM) Visual Resource Management method (USDI.,
2004). This mapping and GIS-based method of assessing landscape modifications allows
for increased objectivity and consistency by using standard assessment criteria.
Objectivity and consistency in VIA studies are increased by using the basic design
elements of form, line, colour, and texture. These landscape attributes are used as the
context for describing potential visual effects of proposed projects and to identify options
for management intervention, such as measures for adjusting project design to minimise
visual impacts. The assessment comprises two main sections; firstly the Visual Inventory
to identify the visual resources along the proposed routing; and secondly, the Analysis
Stage. This stage requires a Contrast Rating to assess the expected degree of contrast
the proposed project would generate within the receiving landscape in order to define the
Magnitude of the impact.
In terms of VRM methodology, landscape character is derived from a combination of
scenic quality and receptor sensitivity to landscape change. Thus the Importance of the
Visual Resource is based on the findings of the Scenic Quality and Receptor Sensitivity
check sheets located in Appendix C. These findings are then submitted to a VRM Matrix

Gold Fields South Deep Mine PV LVIA
19
(Table 3.1) to determine VRM Classes. The VRM Classes are not prescriptive and are
used as a guideline to determine the carrying capacity of a visually preferred landscape as
a basis for assessing the suitability of the landscape change associated with the proposed
project. The visual objectives of each of the classes are listed below:
The Class I objective is to preserve the existing character of the landscape, the level
of change to the characteristic landscape should be very low, and must not attract
attention. Class I is assigned when a decision is made to maintain a natural
landscape;
The Class II objective is to retain the existing character of the landscape and the level
of change to the characteristic landscape should be low. The proposed development
may be seen, but should not attract the attention of the casual observer, and should
repeat the basic elements of form, line, colour and texture found in the predominant
natural features of the characteristic landscape;
The Class III objective is to partially retain the existing character of the landscape,
where the level of change to the characteristic landscape should be moderate. The
proposed development may attract attention, but should not dominate the view of the
casual observer, and changes should repeat the basic elements found in the
predominant natural features of the characteristic landscape; and
The Class IV objective is to provide for management activities that require major
modifications of the existing character of the landscape. The level of change to the
landscape can be high, and these The proposed development may dominate the view
and be the major focus of the viewer’s (s’) attention.
Table 5: VRM Class Matrix Table
VISUAL SENSITIVITY LEVELS
High Medium Low
SCENIC
QUALITY
A (High)
II II II II II II II II II
B (Medium)
II III III/ IV * III IV IV IV IV IV
C (Low)
III IV IV IV IV IV IV IV IV
DISTANCE ZONES
Fo
re/m
iddle
gro
und
Ba
ckg
rou
nd
Se
ldom
se
en
Fo
re/m
iddle
gro
und
Ba
ckg
rou
nd
Se
ldom
se
en
Fo
re/m
iddle
gro
und
Ba
ckg
rou
nd
Se
ldom
se
en
* If adjacent areas are Class III or lower, assign Class III, if higher, assign Class IV
The contrast rating is undertaken from the receptor Key Observation Points, where the
level of change to the existing landscape is assessed in terms of line, colour, texture and
form, in relation to the visual objectives defined for the area. KOPs are defined by the
BLM as the people (receptors) located in strategic locations surrounding the property or
development that make consistent use of the views associated with the site where the
landscape modifications are proposed. To define the KOPs, potential receptor locations
Gold Fields South Deep Mine PV LVIA
20
were identified in the viewshed analysis, and screened, based on the following generic
criteria:
Angle of observation;
Number of viewers;
Length of time the project is in view;
Relative project size;
Season of use;
Critical viewpoints, e.g. views from communities, road crossings; and
Distance to the landscape modification.
5.1.4 Assumptions and Limitations
Although every effort to maintain accuracy was undertaken, as a result of the
Digital Elevation Model (DEM) being generated from satellite imagery and not
being a true representation of the earth’s surface, the viewshed mapping is
approximate and may not represent an exact visibility incidence.
The use of open source satellite imagery was utilised for base maps in the report.
The viewsheds were generated using ASTER elevation data. (NASA, 2009)
Some of the mapping in this document was created using Bing Maps (previously
Live Search Maps, Windows Live Maps, Windows Live Local, and MSN Virtual
Earth) and powered by the Enterprise framework.
VRM Africa reserves the right to modify aspects of the project deliverables if and
when new/additional information may become available from research or further
work in the applicable field of practice, or pertaining to this study.
5.2 Surveys and Data Analysis
5.2.1 Sampling Sites/ Areas
A site survey was undertaken on the 18th of June 2017 in fair weather conditions. A mine
safety assessment was conducted prior to the site survey and the required PPE was
utilised during the survey. During the field survey, due to the uniformity of the site
landscape, two sampling sites were visited. Photographs were taken from each of the
points and approximate compass points captured. The nature of the dominant landscape
was also noted. From the site, zoomed photographs were also taken of the receptors that
would have views of the proposed landscape modification to inform the Area of Influence
mapping. These receptor locations were then visited to determine the significance of the
views and to take photographs of the views back towards the proposed site replicating the
main views of the receptors. To get a perspective view of the site which is fairly flat, a
panoramic photograph was taken from an adjacent high ground point to the west of the
site which afforded clear views of the southern section of the proposed site.
Table 6: List of Sampling Sites where Landscape and Aesthetic Survey was Conducted
ID Date Latitude Longitude
1 18 Jun 2017 26°24' 13.1"S 27° 39' 59"E
2 18 Jun 2017 26°24' 37.35"S 27°39'14.23"E

Gold Fields South Deep Mine PV LVIA
21
Figure 4: Panoramic photograph taken southeast from Sample Point 1 of the grasslands, alien trees and the South Deep Twin Shaft Mine in the background and the D12324 road adjacent to the proposed site.
Figure 5: Photograph taken southwest from Sample Point 2 of the grasslands, and slightly undulating terrain.
Figure 6: Photograph taken southeast from Sample Point 2 of the grasslands, and slightly undulating terrain.

Gold Fields South Deep Mine PV LVIA
22
5.3 Impact Assessment Methodology Impacts were assessed in accordance with the standard impact assessment methodology provided by ERM and the ratings table provided in Error! Reference source not found. and 4.4 below. The VRM assessment methodology will be utilised to inform the ERM impact criteria. Table 7: Landscape Impact Significance Rating Table
Evaluation of Significance Importance of Landscape Resource
Low Medium High
Magnitude of Landscape Effect
Negligible Negligible Negligible Negligible
Small Negligible Minor Moderate
Medium Minor Moderate Major
Large Moderate Major Major
Positive Impacts
Positive Minor Moderate Major
The Importance of the Landscape Resource is based on the Classification of the Visual Resource classification, which represent the relative value of the visual resources of an area, where:
Classes I and II are the most valued (High);
Class III represents a moderate value (Medium); and
Class IV is of least value (Low).
Table 8: Visual Impact Significance Rating Table
Evaluation of Significance Sensitivity of the Visual Resource
Low Medium High
Magnitude of Visual Effect
Negligible Negligible Negligible Negligible
Small Negligible Minor Moderate
Medium Minor Moderate Major
Large Moderate Major Major
Positive Impacts
Positive Minor Moderate Major
The following Degree of Contrast rating criteria are utilised to inform the Magnitude
None: The element contrast is not visible or perceived (Negligible Magnitude).
Weak: The element contrast can be seen but does not attract attention (Small
Magnitude).
Moderate: The element contrast begins to attract attention and begins to
dominate the characteristic landscape (Medium Magnitude).
Strong: The element contrast demands attention, will not be overlooked, and is
dominant in the landscape (Large Magnitude).
6 BASELINE ENVIRONMENT
6.1 Area of Influence

Gold Fields South Deep Mine PV LVIA
23
The Visual Receptors and Area of Influence are identified by means of a viewshed analysis. The visible extent, or viewshed, is “the outer boundary defining a view catchment area, usually along crests and ridgelines” (Oberholzer, 2005). In order to define the extent of the possible influence of the proposed project, a viewshed analysis was undertaken from the proposed site at 4 m height above ground level, making use of open source NASA ASTER for the generation of the Digital Elevation Model data (NASA, 2009). This mapped area indicates the approximate maximum visual influence. However, as this mapping does not take vegetation into consideration, and visual intensity tends to diminish over distance (Hull & Bishop, 1988), the Area of Influence is mainly informed by the site visit. A regional topographic mapping exercise was undertaken to better understand the
topography of the surrounding areas (Figure 12). The map indicates that a series of low
hills and ridgelines are located to the north of the proposed site, with the areas to the south
having flatter terrain. Also potentially influencing visibility are the large mine dumps
located in the vicinity, which would also result in topographic screening. From profiles
generated across the proposed site in a West to East and North to South axis (Figure 13),
it is evident that the extent of the visibility is likely to be contained within the foreground
(6km) distance zone for both axis lines. Based on the viewshed analysis, and the site visit,
the Areas of Influence (AoI) of the proposed project was mapped (Figure 14). This area is
mainly located within the Foreground extent (up to three kilometres) due to the following
reasons:
The location of the low hills and ridgelines located to the north, west and east of the
proposed site.
The location of the Deep South mine dumps to the east of the proposed site.
Higher ground to the south.
Although the viewshed does extend outside of the Foreground (2 km) distance buffers, it is
very likely that vegetation and atmospheric influence would reduce the visual intensity of
the landscape effects. A such the visual AoI of the proposed project is defined as Local
and the zone of visual influence is likely to be contained to the Foreground / Middleground
(6km) distance zone. The main visual issues occurring within the AoI are:
Agricultural landscapes and settlement.
Local access roads.
Mining landscapes.
6.2 Visual Baseline Environment
6.2.1 Visual Receptors
Based on the AoI, four receptor locations were captured and evaluated in terms of the Key Observation Point Status. As all the identified receptors are located with the Medium to High Exposure distance zone, where views of the proposed PV landscape modification would be clearly visible (refer to Figure 20 for KOP mapped locations), all the receptors view points were included as KOPs as listed below:
D12324 road.

Gold Fields South Deep Mine PV LVIA
24
Northern Farmstead.
Western Farmsteads.
South-western Farmstead.
The D12324 Road
Figure 7: View of the D12324 Road located adjacent to the proposed PV site. The D12324 road, which is located adjacent to the northern boundary of the proposed site, is in a Very High Exposure location. The traffic making use of this road is mostly related to the two Gold Field’s Deep South Mines, where receptors are less likely to be sensitive to landscape change.

Gold Fields South Deep Mine PV LVIA
25
Northern Farmstead
Figure 8: Zoomed view of the northern farmstead as seen from the proposed site at 1.2 km distance. This receptor location is located 1.2 km to the northwest of the proposed site. The farmstead comprises a cluster of farm dwellings as well as large sized garden shade trees located to the north of the site. Views from the structures towards the proposed site would be partially obscured by scattered vegetation. Western Farmstead
Figure 9: Zoomed view of the western farmstead as seen from the proposed site at 1.3 km distance. South-western Farmstead

Gold Fields South Deep Mine PV LVIA
26
Figure 10: Zoomed view of the south-western farmstead located amongst the trees as seen from the proposed site at 1.6 km distance.
6.2.2 Broad Landscape Descriptions
As part of the scoping assessment, a botanical survey was undertaken by EcoPartner in 2011. According to the findings described in the scoping report, the Project Area falls within the Grassland Biome of southern Africa, and the vegetation type is described as Rand Highveld Grassland. This vegetation type is a species–rich unit with wiry, sour grassland alternating with low, sour shrubland on rocky outcrops and steeper slopes. The report indicates that the mining area was originally covered by grassland but that large areas were cleared for the construction of the mining infrastructure. The site visit confirmed that trees are generally absent, except in a few localized areas where invasive alien tree species dominate. The following botanical mapping was provided, which informs the dominant landscape types due to the lack of development and uniformity of the site. The field survey confirmed the grassland biome but also found that modification has taken place which includes old settlement areas, alien tree species, and road access modifications. The two broad vegetation dominated landscapes are thus defined as:
Rand Highveld Grassland.
Transformed Rand Highveld Grassland.

Gold Fields South Deep Mine PV LVIA
27
Figure 11: EcoPartner Vegetation Types Map (ERM (Pty) Ltd, 2017)
6.2.3 Visual Resources
The Scenic Quality of a site/ area is determined by making use of the VRM Scenic Quality
checklists (Appendix D) which rate the different broad-brush landscapes found within the
study area. Seven scenic quality criteria are scored on a 1 (low quality) to 5 (high quality)
scale. If applicable, the Cultural Modification can be assigned a negative value if the
landscape is significantly degraded by human-made modifications. The seven scenic
quality criteria are defined below:
Land Form: Topography becomes more of a factor as it becomes steeper, or more
severely sculptured;
Vegetation: Primary consideration given to the variety of patterns, forms, and textures
created by plant life;
Water: The component that adds movement or serenity to a scene. The degree to
which water dominates the scene is the primary consideration;
Colour: The overall colour(s) of the basic components of the landscape (e.g., soil,
rock, vegetation, etc.) are considered as they appear during seasons or periods of
high use;
Scarcity: This factor provides an opportunity to give added importance to one, or all,
of the scenic features that appear to be relatively unique or rare within one
physiographic region;
Adjacent Land Use: Degree to which scenery and distance enhance, or start to
influence, the overall impression of the scenery within the rating unit; and

Gold Fields South Deep Mine PV LVIA
28
Cultural Modifications: Cultural modifications should be considered, and may
detract from the scenery or complement or improve the scenic quality of an area.
(USDI., 2004)
The scenic quality scores are totalled and assigned an A (High scenic quality), B
(Moderate scenic quality) or C (Low scenic quality) category based on the following split:
A= scenic quality rating of ≥19; B = rating of 12 – 18, C= rating of ≤11
Receptor Sensitivity levels are a measure of public concern for scenic quality. Receptor
sensitivity to landscape change is determined by rating the following factors in terms of
Low to High:
Type of Users: Visual sensitivity will vary with the type of users, e.g. recreational
sightseers may be highly sensitive to any changes in visual quality, whereas
workers who pass through the area on a regular basis may not be as sensitive to
change;
Amount of Use: Areas seen or used by large numbers of people are potentially
more sensitive;
Public Interest: The visual quality of an area may be of concern to local, or
regional, groups. Indicators of this concern are usually expressed via public
controversy created in response to proposed activities; and
Adjacent Land Uses: The interrelationship with land uses in adjacent lands. For
example, an area within the viewshed of a residential area may be very sensitive,
whereas an area surrounded by commercially developed lands may not be as
visually sensitive.
Special Areas: These areas refer to landscapes that are protected status which
require specific management objectives, or have a uniqueness that implies cultural
landscape significance. (USDI., 2004)

Table 9: Scenic Quality and Receptor Sensitivity Table
Visual Resources Scenic Quality Receptor Sensitivity
VRM A= scenic quality rating of ≥19; B = rating of 12 – 18, C= rating of ≤11 H = High; M = Medium; L = Low
NAME
La
nd
form
Ve
ge
tati
on
Wa
ter
Co
lou
r
Sc
arc
ity
Ad
jac
en
t
La
nd
sca
pe
Cu
ltu
ral
Mo
dif
ica
tio
ns
Su
m
Rati
ng
Ty
pe
of
Us
ers
Am
ou
nt
of
Use
Pu
bli
c I
nte
res
t
Ad
jac
en
t L
an
d
Use
s
Sp
ec
ial
Are
as
Rati
ng
Cla
ss
Rand Highveld Grassland 1 2 0 2 2 2 0 9 C M H L L L L IV
Transformed Rand Highveld Grassland 1 2 0 2 2 2 -1 7 C M H L L L L IV
SUM (Avg) 1 2 0 2 2 2 0 C M H L L L L

Gold Fields South Deep Mine PV LVIA
30
6.2.4 Visual Resource Management Classes
The following VRM Classes are not prescriptive and are presented as a guideline to
determine the capacity and sensitivity of the landscape to visually absorb landscape
changes associated with the proposed development.
Class I is typically assigned when legislation restricts development in certain areas. The
visual objective is to preserve the existing character of the landscape, the level of change
to the characteristic landscape should be very low, and must not attract attention. As no
protected areas were identified within the area, the Class I visual objective was not
assigned to any of the landscapes.
A Class IV Visual Objective was assigned to the two landscapes of the proposed
development area. This was due to the Low Scenic Quality of the resource as well as the
anticipated Low Receptor Sensitivity to landscape change. The main finding is that the
two broad brush landscape types are similar in character and the overall site Scenic
Quality is graded Low. This is predominantly due to the lack of uniqueness of the site,
the homogeneity of the vegetation and the degraded nature of the adjacent mine
landscapes. The Landform is predominantly of shallow gradient, located on a low ridge
running along the length of the proposed site. The vegetation is predominantly grassland
but is modified with alien tree species, and some access roads from previous farm related
settlement. There are no visible water bodies on site to add visual focus areas and colours
are vegetation dominated, specifically the muted browns of the grasslands. The grassland
landscape is not a scarce feature in the landscape and to the south of the proposed site is
a common landscape. Adjacent landscapes to the east are strongly mine infrastructure
dominated, including mine headgear, large structures, mine dumps and quarry
landscapes. Adjacent landscapes to the west include small farmstead settlements, small-
holdings and road / power line infrastructure which, although interesting in the setting, are
not unique. Man-made modifications on site include access roads associated with
previous farming practices, alien trees as well as illegal dumping which degrade the
landscape to some degree.
The expected Receptor Sensitivity of the two landscapes is also graded Medium to Low for
both landscape types. Due to the adjacent Gold Field’s mines, the Type of Users in the
area are mainly going to be mine related, with some medium exposure views from the
west related to farm / small-holding settlements. Due to the residential nature of the
western farming areas, the Type of User is rated as Medium. The mine and adjacent
access road result in a large volume of traffic utilising the area and the Amount of Use is
defined as High. Due to the predominant mining landscapes of the adjacent lands, as well
as the uniformity of the site which has no unique landscape features, Public Interest is
likely to be Low. Adjacent Land Users do not include any tourists and are rated Low. The
site has no legal protection and as such is rated Low in terms of the Special Area category.

Gold Fields South Deep Mine PV LVIA
31
The existing built nature of the mine landscape, which increases the visual absorption
capacity of the site, in conjunction with the lower visual resources of the areas, result in a
Class IV visual objective being assigned to the proposed development area. The Class IV
objective is to provide for management activities that require major modifications to the
existing character of the landscape.
6.2.5 Threats to Scenic Quality
The main threat to scenic quality associated with the proposed PV Solar development is
the loss of the existing agricultural sense of place. This could take place should further
similar types of solar energy developments take place in the agricultural lands to the west
of the proposed site. Further threats also include degradation of the local ridgelines and
‘koppie’ landscapes to the north of the proposed site. However as the landscape is
already strongly associated with mining landscapes, these threats to local Scenic Quality
are rated Low.
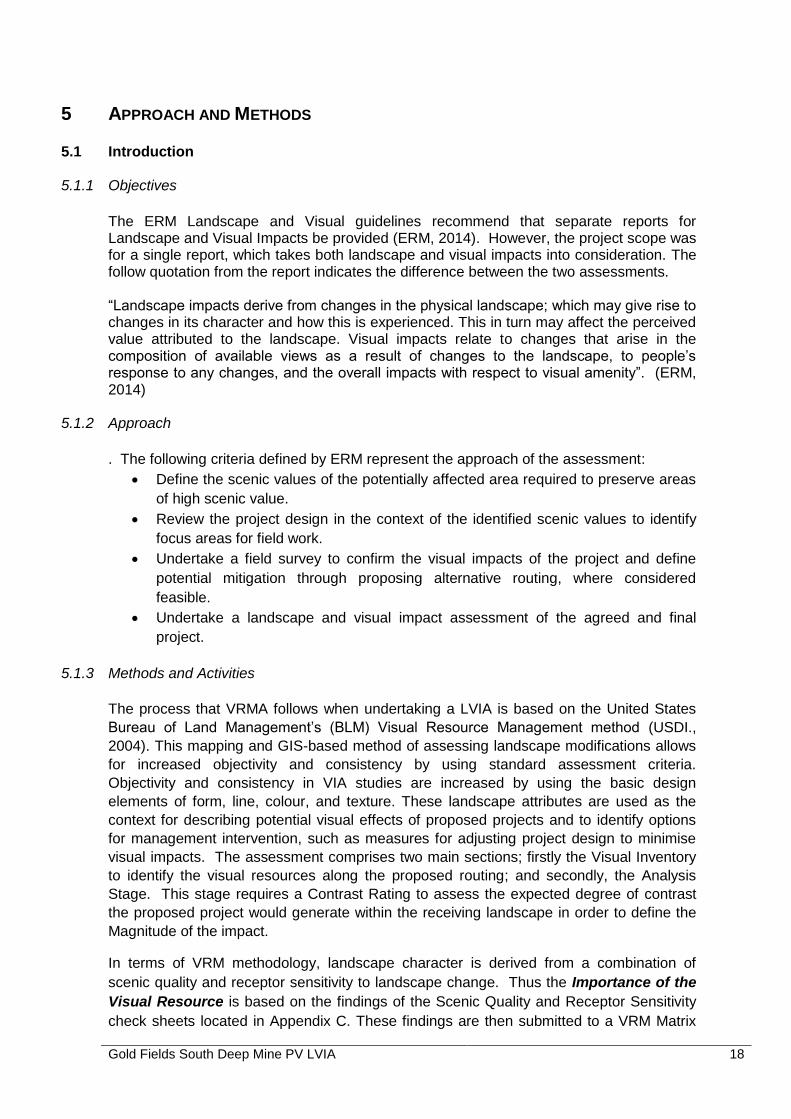
Further visual issues related to glare that is generated from reflection of sunlight at low angles. This effect is depicted in Figure 12 below that shows a low glare reflecting off PV panels due to the low angle of the sun in relation to the horizon.
Figure 12: Example of low glare effect from low angle sunlight. The USA Federal Aviation Association research into this effect has found light reflection off PV panels to be insignificant. The following graphic was modified from an analysis undertaken by the FAA that depicts the percentage scale of light reflecting off a variety of surfaces. As depicted on the scale, PV reflection is very low with some of the latest PV panels reflecting a little as 2% of incoming sunlight (Federal Aviation Association (USA), 2010). Although, as depicted in the photograph, some early morning glare could take place, this effect is likely to be limited, in close proximity to existing sunlight glare (due to the low angle of the sun), and would only take place for short periods of time at first light.
Gold Fields South Deep Mine PV LVIA
32
Figure 13: Percentage scale of light reflecting of a variety of surfaces.
7 IMPACT ASSESSMENT
7.1 Visual and Landscape
7.1.1 Reduction in visual resources for the Northern Receptors due to the construction of the
solar PV facility
Sensitive receptors
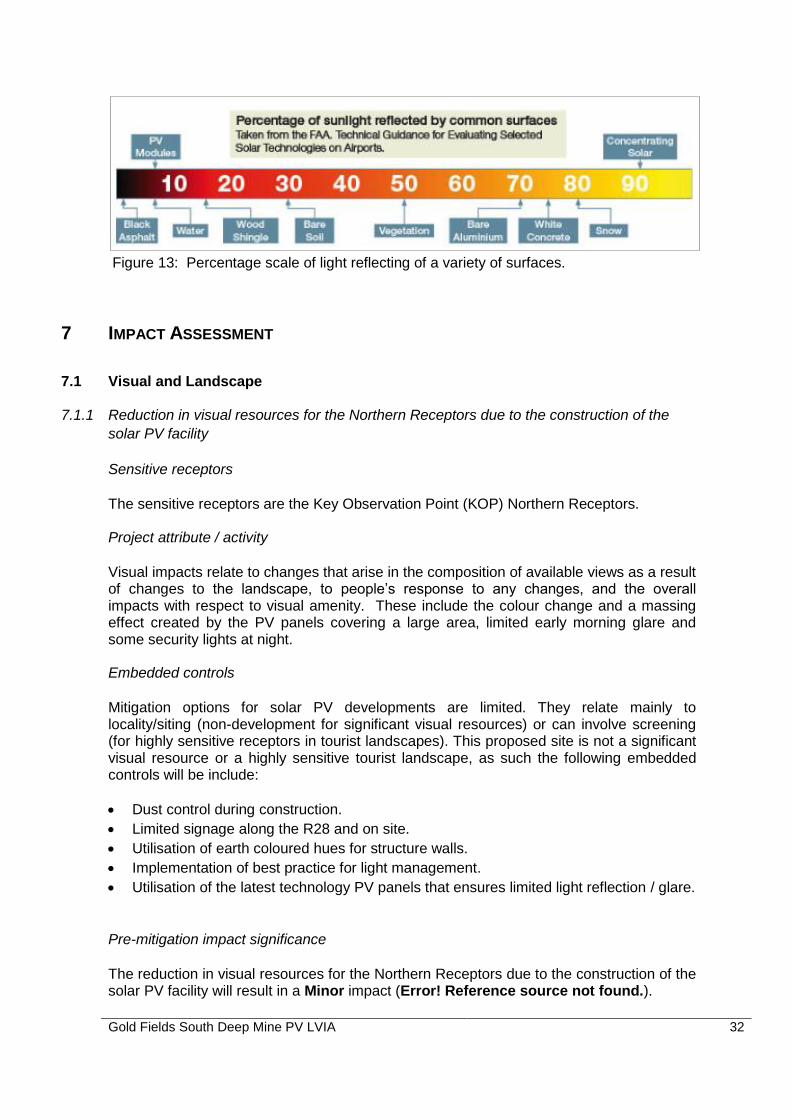
The sensitive receptors are the Key Observation Point (KOP) Northern Receptors. Project attribute / activity
Visual impacts relate to changes that arise in the composition of available views as a result of changes to the landscape, to people’s response to any changes, and the overall impacts with respect to visual amenity. These include the colour change and a massing effect created by the PV panels covering a large area, limited early morning glare and some security lights at night. Embedded controls
Mitigation options for solar PV developments are limited. They relate mainly to locality/siting (non-development for significant visual resources) or can involve screening (for highly sensitive receptors in tourist landscapes). This proposed site is not a significant visual resource or a highly sensitive tourist landscape, as such the following embedded controls will be include:
Dust control during construction.
Limited signage along the R28 and on site.
Utilisation of earth coloured hues for structure walls.
Implementation of best practice for light management.
Utilisation of the latest technology PV panels that ensures limited light reflection / glare.
Pre-mitigation impact significance
The reduction in visual resources for the Northern Receptors due to the construction of the solar PV facility will result in a Minor impact (Error! Reference source not found.).

Gold Fields South Deep Mine PV LVIA
33
Table 10: Pre-mitigation Visual Impacts for the reduction in visual resources for the Northern Receptors due to the construction of the solar PV facility Type of Impact
In-Direct Negative Impact
Rating of Impacts
Characteristic Designation Summary of Reasoning
Extent Partial The single northern receptor dwelling is located approximately one kilometre to the north of the proposed project. Satellite imagery reveals the main dwelling to be well screened by structures and buildings located between the main north-facing residence and the south lying PV project.
Duration Permanent The expected life of the project is 25 years, however it is possible that the panels would then be renewed and the project would then continue for another time period. Due to the long time periods of the project life, the duration is defined as Permanent.
Scale 33% The full extent of the project footprint will be transformed by the construction of the PV panels but only the northwest section of the PV project is likely to be visible due to shallow dome nature of the site topography.
Frequency Continuous Daylight views of the proposed PV structures will be continuous for proximate receptors, with night-time view limited to areas where security lighting is required.
Likelihood Possible Due to the strong colour contrast generated by the proposed PV, it is possible that the landscape change will be visible.
Magnitude of the Visual Effect
Small
Sensitivity of the Visual Receptor
Medium
The visual sensitivity of the receptors is rated Medium due to the existing mine related views which dominate the views from the receptors. Views from the dwellings are also localised by structures and garden trees.
Landscape Significance Rating Before Mitigation
Minor
Mitigation measures
No further mitigation measures Residual impact significance
The residual impact remains Minor, therefore no further assessments are required.
7.1.2 Reduction in visual resources for the Western Receptors due to the construction of the
solar PV facility
Sensitive receptors
The sensitive receptors are the Key Observation Point (KOP) Western Receptors. Project attribute / activity
Visual impacts relate to changes that arise in the composition of available views as a result of changes to the landscape, to people’s response to any changes, and the overall impacts with respect to visual amenity. These include the colour change and a massing

Gold Fields South Deep Mine PV LVIA
34
effect created by the PV panels covering a large area, limited early morning glare and some security lights at night. Embedded controls
The embedded controls are the same as those discussed in Section 7.1.1. Pre-mitigation impact significance
The reduction in visual resources for the Western Receptors due to the construction of the solar PV facility will result in a Moderate impact ( ). Table 11: Pre-mitigation Visual Impacts for the reduction in visual resources for the Western Receptors due to the construction of the solar PV facility Type of Impact
In-Direct Negative Impact
Rating of Impacts
Characteristic Designation Summary of Reasoning
Extent Partial views The three western receptor dwellings are located approximately 800m to the west of the proposed project. Satellite imagery reveals that most of the dwellings to be partially screened by structures and tree vegetation located at the receptor site.
Duration Permanent The expected life of the project is 25 years, however it is possible that the panels would then be renewed and the project would then continue for another time period. Due to the long time periods of the project life, the duration is defined as Permanent.
Scale 50% The full extent of the project footprint will be transformed by the construction of the PV panels but only the northwest section of the PV project is likely to be visible due to shallow dome nature of the site topography.
Frequency Continuous Daylight views of the proposed PV structures will be continuous for proximate receptors, with night-time view limited to areas where security lighting is required.
Likelihood Definite Due to the strong colour contrast generated by the proposed PV, the landscape change will definitely be visible.
Magnitude of the Visual Effect
Medium
Sensitivity of the Visual Receptor
Medium
The visual sensitivity of the receptors is rated Medium due to the existing mine related views which already dominate the views from the receptor dwellings. Views from the dwellings are also localised by structures and garden trees with mainly partial views of the proposed PV.
Landscape Significance Rating Before Mitigation
Moderate
Mitigation measures
No further mitigation measures Residual impact significance
The residual impact remains Moderate, therefore no further assessments are required.

Gold Fields South Deep Mine PV LVIA
35
7.1.3 Reduction in visual resources for the Southern Receptors due to the construction of the
solar PV facility
Sensitive receptors
The sensitive receptors are the Key Observation Point (KOP) Southern Receptors. Project attribute / activity
Visual impacts relate to changes that arise in the composition of available views as a result of changes to the landscape, to people’s response to any changes, and the overall impacts with respect to visual amenity. These include the colour change and a massing effect created by the PV panels covering a large area, limited early morning glare and some security lights at night. Embedded controls
The embedded controls are the same as those discussed in Section 7.1.1. Pre-mitigation impact significance
The reduction in visual resources for the Southern Receptors due to the construction of the solar PV facility will result in a Negligible impact (Error! Reference source not found.). Table 12: Pre-mitigation Visual Impacts for the reduction in visual resources for the Southern Receptors due to the construction of the solar PV facility Type of Impact
In-Direct Negative Impact
Rating of Impacts
Characteristic Designation Summary of Reasoning
Extent Glimpse The southern receptors are located approximately 1.5 kilometres to the south of the proposed project. Satellite imagery reveals the main dwelling to be well screened by structures and buildings that would mainly allow for a glimpse of the proposed landscape modification.
Duration Permanent The expected life of the project is 25 years, however it is possible that the panels would then be renewed and the project would then continue for another time period. Due to the long time periods of the project life, the duration is defined as Permanent.
Scale 20% The full extent of the project footprint will be transformed by the construction of the PV panels but only the northwest section of the PV project is likely to be visible due to shallow dome nature of the site topography.
Frequency Continuous Daylight views of the proposed PV structures will be continuous for proximate receptors, with night-time view limited to areas where security lighting is required.
Likelihood Possible Due to the strong colour contrast generated by the proposed PV, it is possible that the landscape change will be visible.
Magnitude of the Visual Effect
Negligible
Sensitivity of the Visual Receptor
High
The visual sensitivity of the receptors is rated High due to the occupiers of residential properties adjacent the proposed site with views affected by the development.
Landscape Significance Rating Before Mitigation
Negligible

Gold Fields South Deep Mine PV LVIA
36
Mitigation measures
No further mitigation measures Residual impact significance
The residual impact remains Negligible, therefore no further assessments are required.
7.1.4 Degradation of the landscape to due to the construction and operation of the solar PV
facility
Sensitive receptor
The sensitive receptor is the intrinsic value of the landscape associated with the proposed Project site and how it is perceived by those who experience it. Project attribute / activity
The construction and operation of the solar PV facility covering approximately 130 ha. Embedded controls
The embedded controls are the same as those discussed in Section 7.1.1. Pre-mitigation impact significance
The degradation of the landscape to due to the construction and operation of the solar PV facility will result in a Minor impact (Error! Reference source not found.). Table 13: Pre-mitigation impact significance rating for the degradation of the landscape to due to the construction and operation of the solar PV facility Type of Impact
Direct Negative Impact
Rating of Impacts
Characteristic Designation Summary of Reasoning
Extent Local Due to topographic screening of the surrounding low hills and tailing storage facilities, the extent of the landscape change is localised.
Duration Permanent The expected life of the project is 25 years, however it is possible that the panels would then be renewed and the project would then continue for another time period. Due to the long time periods of the project life, the duration is defined as Permanent.
Scale 130 ha The full extent of the project footprint will be transformed by the construction of the solar PV facility.
Frequency Continuous Daylight views of the proposed PV structures will be continuous for proximate receptors, with night-time view limited to areas where security lighting is required.
Likelihood Definite Due to the large scale of the area that will be covered by PV panels that will create a large massing effect, the likelihood of the landscape change taking place is Definite.
Magnitude of the Landscape Effect
Medium
Sensitivity of the Landscape Resource
Low

Gold Fields South Deep Mine PV LVIA
37
The sensitivity of the landscape resource is defined as Low as the proposed project site reflects a landscape that is not valued in a special way by the public. It has a low level of tranquillity and features detracting elements. The landscape contains industrialised areas and its character, land use, pattern and scale are such that it could absorb the Project without unacceptable damage. Landscape Significance Rating Before Mitigation
Minor
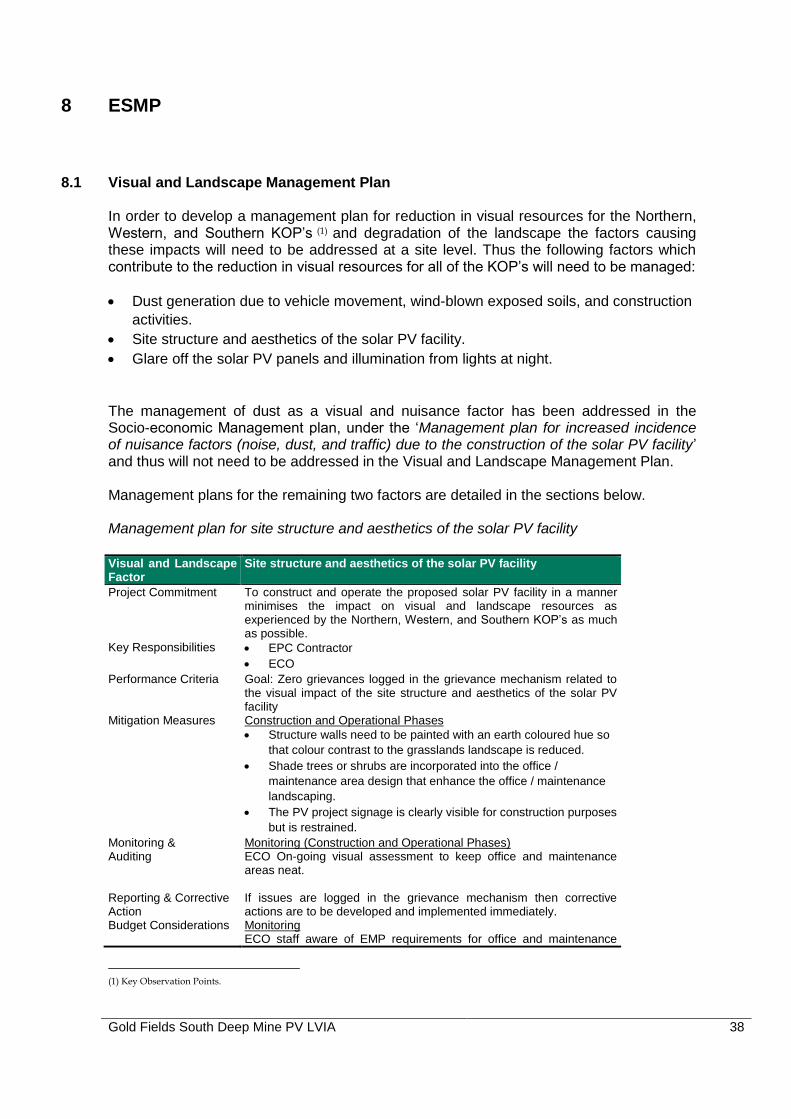
Gold Fields South Deep Mine PV LVIA
38
8 ESMP
8.1 Visual and Landscape Management Plan In order to develop a management plan for reduction in visual resources for the Northern, Western, and Southern KOP’s (1) and degradation of the landscape the factors causing these impacts will need to be addressed at a site level. Thus the following factors which contribute to the reduction in visual resources for all of the KOP’s will need to be managed:
Dust generation due to vehicle movement, wind-blown exposed soils, and construction
activities.
Site structure and aesthetics of the solar PV facility.
Glare off the solar PV panels and illumination from lights at night.
The management of dust as a visual and nuisance factor has been addressed in the Socio-economic Management plan, under the ‘Management plan for increased incidence of nuisance factors (noise, dust, and traffic) due to the construction of the solar PV facility’ and thus will not need to be addressed in the Visual and Landscape Management Plan. Management plans for the remaining two factors are detailed in the sections below. Management plan for site structure and aesthetics of the solar PV facility
Visual and Landscape Factor
Site structure and aesthetics of the solar PV facility
Project Commitment To construct and operate the proposed solar PV facility in a manner minimises the impact on visual and landscape resources as experienced by the Northern, Western, and Southern KOP’s as much as possible.
Key Responsibilities EPC Contractor
ECO
Performance Criteria Goal: Zero grievances logged in the grievance mechanism related to the visual impact of the site structure and aesthetics of the solar PV facility
Mitigation Measures Construction and Operational Phases
Structure walls need to be painted with an earth coloured hue so
that colour contrast to the grasslands landscape is reduced.
Shade trees or shrubs are incorporated into the office /
maintenance area design that enhance the office / maintenance
landscaping.
The PV project signage is clearly visible for construction purposes
but is restrained.
Monitoring & Auditing
Monitoring (Construction and Operational Phases) ECO On-going visual assessment to keep office and maintenance areas neat.
Reporting & Corrective Action
If issues are logged in the grievance mechanism then corrective actions are to be developed and implemented immediately.
Budget Considerations Monitoring ECO staff aware of EMP requirements for office and maintenance
(1) Key Observation Points.

Gold Fields South Deep Mine PV LVIA
39
Visual and Landscape Factor
Site structure and aesthetics of the solar PV facility
area landscaping and upkeep. Auditing NA
Management plan for glare off the solar PV panels and illumination from lights at night
Visual and Landscape Factor
Glare off the solar PV panels and illumination from lights at night
Project Commitment To construct and operate the proposed solar PV facility in a manner that glare and lights at night are not visually intrusive to the Northern, Western, and Southern KOP’s as much as possible.
Key Responsibilities EPC Contractor
ECO
Performance Criteria Goal: Zero grievances logged in the grievance mechanism related to glare and lights at night
Mitigation Measures Construction and Operational Phases
Pre-design specifications to ensure the procurement of glare
reduction panels in implemented by the design team.
Security lighting is located at the office site / maintenance area
only.
Downward lighting is used as much as possible.
Monitoring & Auditing
Monitoring (Construction and Operational Phases) On-going visual assessment by ECO and site operations manager
Reporting & Corrective Action
If issues are logged in the grievance mechanism then corrective actions are to be developed and implemented immediately.
Budget Considerations Monitoring None Auditing None
8.2 Monitoring
8.2.1 Construction and Operational Phases
No specific monitoring is required for visual impacts per se, although monitoring of on-
going erosion risks’ light spillage should be undertaken by the ECO.
Gold Fields South Deep Mine PV LVIA
40
9 OPPORTUNITIES AND CONSTRAINTS
9.1 Opportunities
Green energy electricity supply to Gold Field’s South Deep Mine.
Increased work opportunity associated with the construction and operation of the
proposed PV facility.
Improved management of an area that is currently being utilised for some illegal
dumping.
Low visual resources of the site due to the close proximity of the site to the existing
highly modified mining landscape associated with the Gold Field’s South Deep Mine.
9.2 Constraints
Reduction in the visual buffer space between the South Deep Mine landscape and
the Elandsfontein smallholdings agricultural landscape areas (average distance 2km
to 1km).
Medium visual intrusion to the more proximate Elandsfontein small holding receptors
due to a large area landscape change of grasslands to semi-industrial landscape, but
moderated by partial screening from vegetation located at receptor dwellings.

Gold Fields South Deep Mine PV LVIA
41
10 REFERENCES
ERM (Pty) Ltd. (2017). Scoping Study of a PV Solar Power Facility for Gold Field's South Deep Mine (Draft report). ERM. (2014). Annex B-* Landscape and Visual. Federal Aviation Association (USA). (2010). Technical guidance for evaluating selected solar technologies on airports. http://www.oxforddictionaries.com. (n.d.). IFC. (2012). International Finance Corporation (IFC) prescribes eight performance standards (PS) on environmental and social sustainability. Millennium Ecosystem Assessment. 2005. International Dark-sky Association. (n.d.). From http://darksky.org NASA, A. G. (2009). Advanced Spaceborne Thermal Emission and Reflection Radiometer (ASTER) Global Digital Elevation Model Version 2 (GDEM V2 2011). Ministry of Economy, Trade, and Industry (METI) of Japan and United States National Aeronauti. NELPAG. New England Light Pollution Advisory Group (NELPAG) http://cfa/ www.harvard .edu /cfa/ps/nelpag.html) and Sky & Telescope http://SkyandTelescope.com/). NELPAG and Sky & Telescope support the International Dark-Sky Association (IDA) (http://www.darksky.o. Oberholzer, B. (2005). Guideline for involving visual and aesthetic specialists in EIA processes: Edition 1. CSIR Report No ENV-S-C 2005 053 F. Republic of South Africa, Provincial Government of the Western Cape, Department of Environmental Affairs and Deve. The Landscape Institute. (2003). Guidelines for Landscape and Visual Impact Assessment (Second ed.). Spon Press. USDI., B. (2004). Bureau of Land Management, U.S. Department of Interior. 2004. Visual Resource Management Manual 8400. West Rand District Municipality. (2012). West Rand District Municipality - Regional Growth & Development Strategy.

Gold Fields South Deep Mine PV LVIA
42
11 ANNEXURE A: LANDSCAPE AND VISUAL IMPACT MAPS

Gold Fields South Deep Mine PV LVIA
43
Figure 14: Project locality map in relation to the Gold Field’s South Deep Mine.

Gold Fields South Deep Mine PV LVIA
44
Figure 15: Project preferred proposed site overlay onto SA 1:50 000 topocadastral maps sheets.

Gold Fields South Deep Mine PV LVIA
45
Figure 16: Project preliminary layout plan indicating the PV Arrays and 11 kV emergency transmission line.

Gold Fields South Deep Mine PV LVIA
46
Figure 17: West Rand District Municipality Environmental Opportunities Mapping with approximate project location depicted (blue arrow).

Gold Fields South Deep Mine PV LVIA
47
Figure 18: West Rand District Municipality Environmental Opportunities Heritage Mapping with approximate project location depicted.

Gold Fields South Deep Mine PV LVIA
48
Figure 19: Regional Digital Elevation and Profile Locality Map
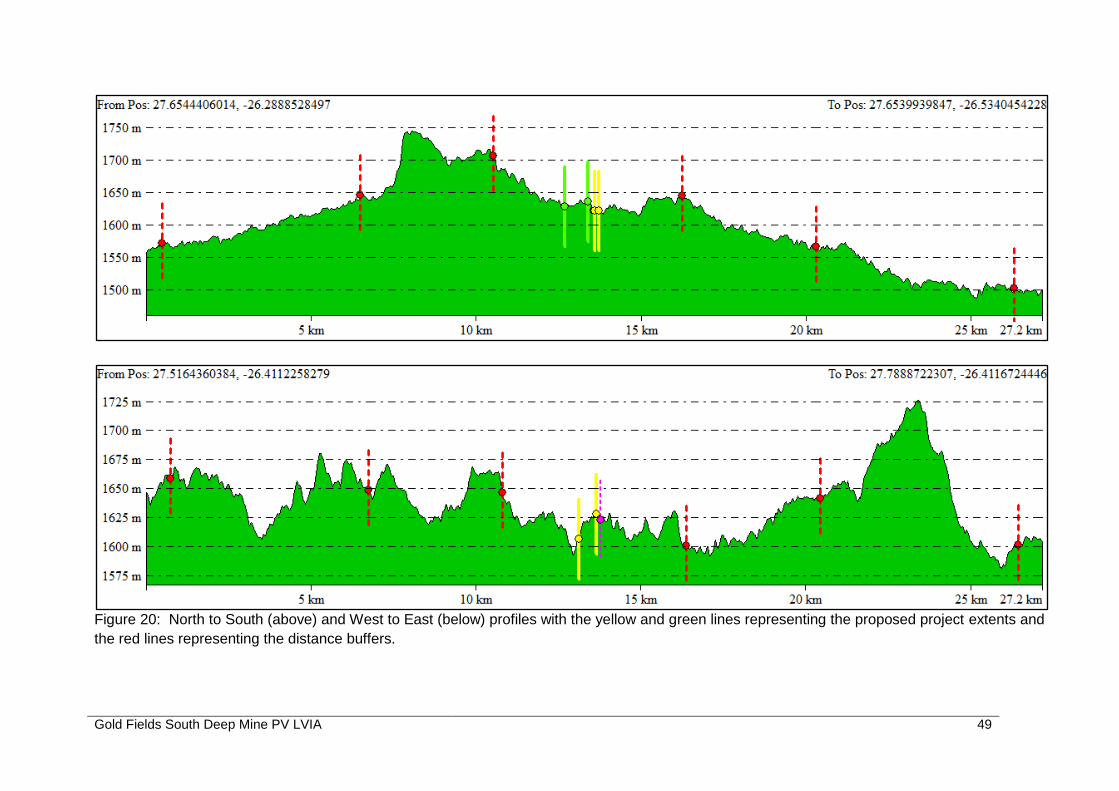
Gold Fields South Deep Mine PV LVIA
49
Figure 20: North to South (above) and West to East (below) profiles with the yellow and green lines representing the proposed project extents and
the red lines representing the distance buffers.

Gold Fields South Deep Mine PV LVIA
50
Figure 21: Deep South Mine PV approximate viewshed and anticipated Area of Influence Map

Gold Fields South Deep Mine PV LVIA
51
Figure 22: Deep South Mine PV Key Observation Point Map

Gold Fields South Deep Mine PV LVIA
52
Figure 23: Deep South Mine PV site landscape characterisation mapping with the area mainly defined as Highveld Grasslands

Gold Fields South Deep Mine PV LVIA
53
12 ANNEXURE B: PHOTOMONTAGES
Figure 24: Panoramic photograph amendment indicating the approximate extent of the proposed PV footprint.

Gold Fields South Deep Mine PV LVIA
54
13 ANNEXURE C: SPECIALIST INFORMATION
13.1 Declaration of Interest

Gold Fields South Deep Mine PV LVIA
55
13.2 Curriculum Vitae
Curriculum Vitae (CV)
1. Position: Owner / Director
2. Name of Firm: Visual Resource Management Africa cc (www.vrma.co.za)
3. Name of Staff: Stephen Stead
4. Date of Birth: 9 June 1967
5. Nationality: South African
6. Contact Details: Tel: +27 (0) 44 876 0020
Cell: +27 (0) 83 560 9911
Email: [email protected]
7. Educational qualifications:
University of Natal (Pietermaritzburg):
Bachelor of Arts: Psychology and Geography
Bachelor of Arts (Hons): Human Geography and Geographic Information
Management Systems
8. Professional Accreditation
Association of Professional Heritage Practitioners (APHP) Western Cape
o Accredited VIA practitioner member of the Association (2011)
9. Association involvement: :
International Association of Impact Assessment (IAIA) South African Affiliate
o Past President (2012 - 2013)
o President (2012)
o President-Elect (2011)
o Conference Co-ordinator (2010)
o National Executive Committee member (2009)
o Southern Cape Chairperson (2008)
10. Conferences Attended:
IAIAsa 2012
IAIAsa 2011
IAIA International 2011 (Mexico)
IAIAsa 2010
IAIAsa 2009
IAIAsa 2007
11. Continued Professional Development:

Gold Fields South Deep Mine PV LVIA
56
Integrating Sustainability with Environment Assessment in South Africa
(IAIAsa Conference, 1 day)
Achieving the full potential of SIA (Mexico, IAIA Conference, 2 days 2011)
Researching and Assessing Heritage Resources Course (University of Cape
Town, 5 days, 2009)
12. Countries of Work Experience:
South Africa, Mozambique, Malawi, Lesotho, Kenya and Namibia
13. Relevant Experience:
Stephen gained six years of experience in the field of Geographic Information
Systems mapping and spatial analysis working as a consultant for the KwaZulu-Natal
Department of Health and then with an Environmental Impact Assessment company
based in the Western Cape. In 2004 he set up the company Visual Resource
Management Africa that specializes in visual resource management and visual
impact assessments in Africa. The company makes use of the well documented
Visual Resource Management methodology developed by the Bureau of Land
Management (USA) for assessing the suitability of landscape modifications. In
association with ILASA qualified landscape architect Liesel Stokes, he has assessed
of over 100 major landscape modifications throughout southern and eastern Africa.
The business has been operating for eight years and has successfully established
and retained a large client base throughout Southern Africa which include amongst
other, Rio Tinto (Pty) Ltd, Bannerman (Pty) Ltd, Anglo Coal (Pty) Ltd, Eskom (Pty)
Ltd, NamPower and Vale (Pty) Ltd, Ariva (Pty) Ltd, Harmony Gold (Pty) Ltd, Mellium
Challenge Account (USA), Pretoria Portland Cement (Pty) Ltd
14. Languages:
English – First Language
Afrikaans – fair in speaking, reading and writing
15. Projects:
A list of some of the large scale projects that VRMA has assessed has been attached
below with the client list indicated per project (Refer to www.vrma.co.za for a full list of
projects undertaken).
Table 14: VRM Africa Projects Assessments Table
YEAR NAME DESCRIPTION LOCATION
2016 Kokerboom WEF Wind Energy Northern Cape
2016 Hotazel PV Solar Energy Northern Cape
2016 Eskom Sekgame Bulkop Power Line Infrastructure Northern Cape
2016 Ngonye Hydroelectric Hydroelectric Zambia
2016 Levensdal Infill Settlement Western Cape
2016 Arandis CSP Solar Energy Namibia
2016 Bonnievale PV Solar Energy Western Cape
2015 Noblesfontein 2 & 3 WEF (Scoping) Wind Energy Eastern Cape
2015 Ephraim Sun SEF Solar Energy Northern Cape

Gold Fields South Deep Mine PV LVIA
57
2015 Dyasonsklip and Sirius Grid TX Solar Energy Nothern Cape
2015 Dyasonsklip PV Solar Energy Nothern Cape
2015 Zeerust PV expansion and transmission
line
Solar Energy North West
2015 Bloemsmond SEF Solar Energy Nothern Cape
2015 Juwi Copperton PV Solar Energy Nothern Cape
2015 Humansrus Capital 14 PV Solar Energy Nothern Cape
2015 Humansrus Capital 13 PV Solar Energy Nothern Cape
2015 Spitzkop East WEF (Scoping) Solar Energy Western Cape
2015 Lofdal Rare Earth Mine and
Infrastructure Extraction Namibia
2015 AEP Kathu PV Solar Energy Nothern Cape
2014 AEP Mogobe SEF Solar Energy Nothern Cape
2014 Bonnievale SEF Solar Energy Western Cape
2014 AEP Legoko SEF Solar Energy Northern Cape
2014 Postmasburg PV Solar Energy Northern Cape
2014 Joram Solar Solar Energy Northern Cape
2014 RERE PV Postmasberg Solar Energy Northern Cape
2014 RERE CPV Upington Solar Energy Northern Cape
2014 Rio Tinto RUL Desalinisation Plant Industrial Namibia
2014 NamPower PV * 3 Solar Energy Namibia
2014 Pemba Oil and Gas Port Expansion Industrial Mozambique
2014 Brightsource CSP Upington Solar Energy Northern Cape
2014 Witsand WEF (Scoping) Wind Energy Western Cape
2014 Kangnas WEF Wind Energy Western Cape
2013 Cape Winelands DM Regional Landfill Industrial Western Cape
2013 Drennan PV Solar Park Solar Energy Eastern Cape
2013 Eastern Cape Mari-culture Mari-culture Eastern Cape
2013 Eskom Pantom Pass Substation Substation /Tx lines Knysna
2013 Frankfort Paper Mill Plant Free State
2013 Gibson Bay Wind Farm Transmission
lines Tranmission lines Eastern Cape
2013 Houhoek Eskom Substation Substation /Tx lines Western Cape
2013 Mulilo PV Solar Energy Sites (x4) Solar Energy Northern Cape
2013 Namies Wind Farm Wind Energy Northern Cape
2013 Rossing Z20 Pit and WRD Mining Namibia
2013 SAPPI Boiler Upgrade Plant Mpumalanga
2013 Tumela WRD Mine North West
2013 Weskusfleur Substation (Koeburg) Substation /Tx lines Western Cape
2013 Yzermyn coal mine Mine Mpumalanga
2012 Afrisam Mine Saldana
2012 Bitterfontein Solar Energy N Cape
2012 Kangnas PV Solar Energy N Cape
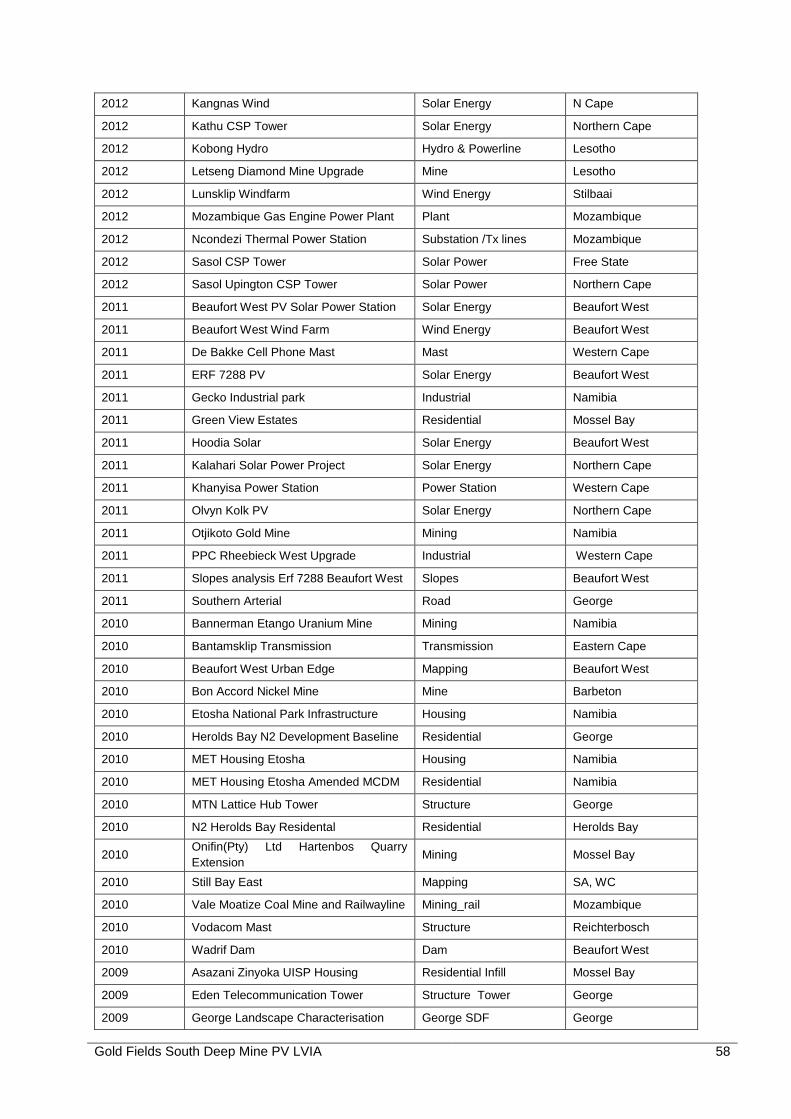
Gold Fields South Deep Mine PV LVIA
58
2012 Kangnas Wind Solar Energy N Cape
2012 Kathu CSP Tower Solar Energy Northern Cape
2012 Kobong Hydro Hydro & Powerline Lesotho
2012 Letseng Diamond Mine Upgrade Mine Lesotho
2012 Lunsklip Windfarm Wind Energy Stilbaai
2012 Mozambique Gas Engine Power Plant Plant Mozambique
2012 Ncondezi Thermal Power Station Substation /Tx lines Mozambique
2012 Sasol CSP Tower Solar Power Free State
2012 Sasol Upington CSP Tower Solar Power Northern Cape
2011 Beaufort West PV Solar Power Station Solar Energy Beaufort West
2011 Beaufort West Wind Farm Wind Energy Beaufort West
2011 De Bakke Cell Phone Mast Mast Western Cape
2011 ERF 7288 PV Solar Energy Beaufort West
2011 Gecko Industrial park Industrial Namibia
2011 Green View Estates Residential Mossel Bay
2011 Hoodia Solar Solar Energy Beaufort West
2011 Kalahari Solar Power Project Solar Energy Northern Cape
2011 Khanyisa Power Station Power Station Western Cape
2011 Olvyn Kolk PV Solar Energy Northern Cape
2011 Otjikoto Gold Mine Mining Namibia
2011 PPC Rheebieck West Upgrade Industrial Western Cape
2011 Slopes analysis Erf 7288 Beaufort West Slopes Beaufort West
2011 Southern Arterial Road George
2010 Bannerman Etango Uranium Mine Mining Namibia
2010 Bantamsklip Transmission Transmission Eastern Cape
2010 Beaufort West Urban Edge Mapping Beaufort West
2010 Bon Accord Nickel Mine Mine Barbeton
2010 Etosha National Park Infrastructure Housing Namibia
2010 Herolds Bay N2 Development Baseline Residential George
2010 MET Housing Etosha Housing Namibia
2010 MET Housing Etosha Amended MCDM Residential Namibia
2010 MTN Lattice Hub Tower Structure George
2010 N2 Herolds Bay Residental Residential Herolds Bay
2010 Onifin(Pty) Ltd Hartenbos Quarry
Extension Mining Mossel Bay
2010 Still Bay East Mapping SA, WC
2010 Vale Moatize Coal Mine and Railwayline Mining_rail Mozambique
2010 Vodacom Mast Structure Reichterbosch
2010 Wadrif Dam Dam Beaufort West
2009 Asazani Zinyoka UISP Housing Residential Infill Mossel Bay
2009 Eden Telecommunication Tower Structure Tower George
2009 George Landscape Characterisation George SDF George

Gold Fields South Deep Mine PV LVIA
59
2009 George Visual Resource Management George SDF George
2009 George Western Bypass Structure Road George
2009 Knysna Affordable Housing Heidevallei Residential Infill Knysna
2009 Knysna Affordable Housing Hornlee
Project Residential Infill Knysna
2009 Rossing Uranium Mine Phase 2 Mining Namibia
2009 Sun Ray Wind Farm Wind Energy Still Bay
2008 Bantamsklip Transmission Lines
Scoping Transmission Western Cape
2008 Erf 251 Damage Assessment Residential VIA Great Brak
2008 Erongo Uranium Rush SEA SEA Namibia
2008 Evander South Gold Mine Preliminary
VIA Mining Mpumalanga
2008 George Open Spaces System George SDF George
2008 Hartenbos River Park Residential VIA Hartenbos
2008 Kaaimans Project Residential Wilderness
2008 Lagoon Garden Estate Residential VIA Great Brak
2008 Moquini Beach Hotel Resort Mossel Bay
2008 NamPower Coal fired Power Station Power Station Namibia
2008 Oasis Development Residential VIA Plettenberg Bay
2008 RUL Sulpher Handling Facility Mining Walvis Bay
2008 Stonehouse Development Residential VIA Plettenberg Bay
2008 Walvis Bay Power Station Structure Namibia
2007 Calitzdorp Retirement Village Residential VIA Calitzdorp
2007 Calitzdorp Visualisation Visualisation Calitzdorp
2007 Camdeboo Estate Residential VIA Graaff Reinet
2007 Destiny Africa Residential George
2007 Droogfontein Farm 245 Residential VIA Danabaai
2007 Floating Liquified Natural Gas Facility Structure tanker Mossel Bay
2007 George Municipality Densification George SDF George
2007 Kloofsig Development Residential VIA Vleesbaai
2007 OCGT Power Plant Extension Structure Power Plant Mossel Bay
2007 Oudtshoorn Municipality SDF Mapping Oudtshoorn
2007 Oudtshoorn Shopping Complex Structure Mall Oudtshoorn
2007 Pezula Infill (Noetzie) Residential VIA Knysna
2007 Pierpoint Nature Reserve Residential VIA Knysna
2007 Pinnacle Point Golf Estate Golf/Residential Mossel Bay
2007 Rheebok Development Erf 252 Apeal Residential VIA Great Brak
2007 Rossing Uranium Mine Phase 1 Mining Namibia
2007 Ryst Kuil/Riet Kuil Uranium Mine Mining Beaufort West
2007 Sedgefield Water Works Structure Sedgefield
2007 Sulpher Handling Station Walvis Bay
Port Industrial Namibia
2007 Trekkopje Uranium Mine Mining Namibia

Gold Fields South Deep Mine PV LVIA
60
2007 Weldon Kaya Residential VIA Plettenberg Bay
2006 Farm Dwarsweg 260 Residential VIA Great Brak
2006 Fynboskruin Extention Residential VIA Sedgefield
2006 Hanglip Golf and Residential Estate Golf/Residential Plettenberg Bay
2006 Hansmoeskraal Slopes Analysis George
2006 Hartenbos Landgoed Phase 2 Residential VIA Hartenbos
2006 Hersham Security Village Residential VIA Great Brak
2006 Ladywood Farm 437 Residential VIA Plettenberg Bay
2006 Le Grand Golf and Residential Estate Golf/Residential George
2006 Paradise Coast Residential VIA Mossel Bay
2006 Paradyskloof Residential Estate Residential VIA Stellenbosch
2006 Riverhill Residential Estate Residential VIA Wilderness
2006 Wolwe Eiland Access Route Road Victoria Bay
2005 Harmony Gold Mine Mining Mpumalanga.
2005 Knysna River Reserve Residential VIA Knysna
2005 Lagoon Bay Lifestyle Estate Residential VIA Glentana
2005 Outeniquabosch Safari Park Residential Mossel Bay
2005 Proposed Hotel Farm Gansevallei Resort Plettenberg Bay
2005 Uitzicht Development Residential VIA Knysna
2005 West Dunes Residential VIA Knysna
2005 Wilderness Erf 2278 Residential VIA Wilderness
2005 Wolwe Eiland Eco & Nature Estate Residential VIA Victoria Bay
2005 Zebra Clay Mine Mining Zebra
2004 Gansevallei Hotel Residential VIA Plettenberg Bay
2004 Lakes Eco and Golf Estate Golf/Residential Sedgefield
2004 Trekkopje Desalination Plant Structure Plant Namibia
1995 Greater Durban Informal Housing
Analysis Photogrametry Durban

Gold Fields South Deep Mine PV LVIA
61
14 ANNEXURE D: VRM CHECKLISTS AND TERMINOLOGY
Table 15: Scenic Quality Checklist
KEY FACTORS RATING CRITERIA AND SCORE
SCORE 5 3 1
Land Form High vertical relief as expressed in
prominent cliffs, spires or massive
rock outcrops, or severe surface
variation or highly eroded formations
or detail features that are dominating
and exceptionally striking and
intriguing.
Steep-sided river valleys, or
interesting erosion patterns
or variety in size and shape
of landforms; or detail
features that are
interesting, though not
dominant or exceptional.
Low rolling hills, foothills
or flat valley bottoms; few
or no interesting
landscape features.
Vegetation A variety of vegetative types as
expressed in interesting forms,
textures and patterns.
Some variety of vegetation,
but only one or two major
types.
Little or no variety or
contrast in vegetation.
Water Clear and clean appearing, still or
cascading white water, any of which
are a dominant factor in the
landscape.
Flowing, or still, but not
dominant in the landscape.
Absent, or present but
not noticeable.
Colour Rich colour combinations, variety or
vivid colour: or pleasing contrasts in
the soil, rock, vegetation, water.
Some intensity or variety in
colours and contrast of the
soil, rock and vegetation,
but not a dominant scenic
element.
Subtle colour variations
contrast or interest:
generally mute tones.
Adjacent Scenery Adjacent scenery greatly enhances
visual quality.
Adjacent scenery
moderately enhances
overall visual quality.
Adjacent scenery has
little or no influence on
overall visual quality.
Scarcity One of a kind: unusually memorable,
or very rare within region. Consistent
chance for exceptional wildlife or
wildflower viewing etc.
Distinctive, though
somewhat similar to others
within the region.
Interesting within its
setting, but fairly
common within the
region.
SCORE 2 0 -4
Cultural
Modification
Modifications add favourably to visual
variety, while promoting visual
harmony.
Modifications add little or no
visual variety to the area,
and introduce no discordant
elements.
Modifications add variety
but are very discordant
and promote strong
disharmony.

Gold Fields South Deep Mine PV LVIA
62
Table 16: Sensitivity Level Rating Checklist
FACTORS QUESTIONS
Type of Users Maintenance of visual quality is:
A major concern for most users High
A moderate concern for most users Moderate
A low concern for most users Low
Amount of use Maintenance of visual quality becomes more important as the level of use increases:
A high level of use High
Moderately level of use Moderate
Low level of use Low
Public interest Maintenance of visual quality:
A major concern for most users High
A moderate concern for most users Moderate
A low concern for most users Low
Adjacent land
Users
Maintenance of visual quality to sustain adjacent land use objectives is:
Very important High
Moderately important Moderate
Slightly important Low
Special Areas Maintenance of visual quality to sustain Special Area management objectives is:
Very important High
Moderately important Moderate
Slightly important Low

Gold Fields South Deep Mine PV LVIA
63
Table 17: VRM Terminology Table
FORM LINE COLOUR TEXTURE
Simple
Weak
Strong
Dominant
Flat
Rolling
Undulating
Complex
Plateau
Ridge
Valley
Plain
Steep
Shallow
Organic
Structured
Horizontal
Vertical
Geometric
Angular
Acute
Parallel
Curved
Wavy
Strong
Weak
Crisp
Feathered
Indistinct
Clean
Prominent
Solid
Dark
Light
Mottled
Smooth
Rough
Fine
Coarse
Patchy
Even
Uneven
Complex
Simple
Stark
Clustered
Diffuse
Dense
Scattered
Sporadic
Consistent
Simple Basic, composed of few elements Organic Derived from nature; occurring or
developing gradually and naturally
Complex Complicated; made up of many interrelated
parts
Structure Organised; planned and controlled; with
definite shape, form, or pattern
Weak Lacking strength of character Regular Repeatedly occurring in an ordered fashion
Strong Bold, definite, having prominence Horizontal Parallel to the horizon
Dominant Controlling, influencing the surrounding
environment
Vertical Perpendicular to the horizon; upright
Flat Level and horizontal without any slope; even
and smooth without any bumps or hollows
Geometric Consisting of straight lines and simple
shapes
Rolling Progressive and consistent in form, usually
rounded
Angular Sharply defined; used to describe an object
identified by angles
Undulating Moving sinuously like waves; wavy in
appearance
Acute Less than 90°; used to describe a sharp
angle
Plateau Uniformly elevated flat to gently undulating
land bounded on one or more sides by steep
slopes
Parallel Relating to or being lines, planes, or curved
surfaces that are always the same distance
apart and therefore never meet
Ridge
A narrow landform typical of a highpoint or
apex; a long narrow hilltop or range of hills
Curved Rounded or bending in shape
Valley Low-lying area; a long low area of land, often
with a river or stream running through it, that is
surrounded by higher ground
Wavy Repeatedly curving forming a series of
smooth curves that go in one direction and
then another
Plain A flat expanse of land; fairly flat dry land,
usually with few trees
Feathered Layered; consisting of many fine parallel
strands
Steep Sloping sharply often to the extent of being
almost vertical
Indistinct Vague; lacking clarity or form
Prominent Noticeable; distinguished, eminent, or well-
known
Patchy Irregular and inconsistent;
Solid Unadulterated or unmixed; made of the same
material throughout; uninterrupted
Even Consistent and equal; lacking slope,
roughness, and irregularity
Broken Lacking continuity; having an uneven surface Uneven Inconsistent and unequal in measurement
irregular
Smooth Consistent in line and form; even textured Stark Bare and plain; lacking ornament or
relieving features
Rough Bumpy; knobbly; or uneven, coarse in texture Clustered Densely grouped
Fine Intricate and refined in nature Diffuse Spread through; scattered over an area
Coarse Harsh or rough to the touch; lacking detail Diffuse To make something less bright or intense
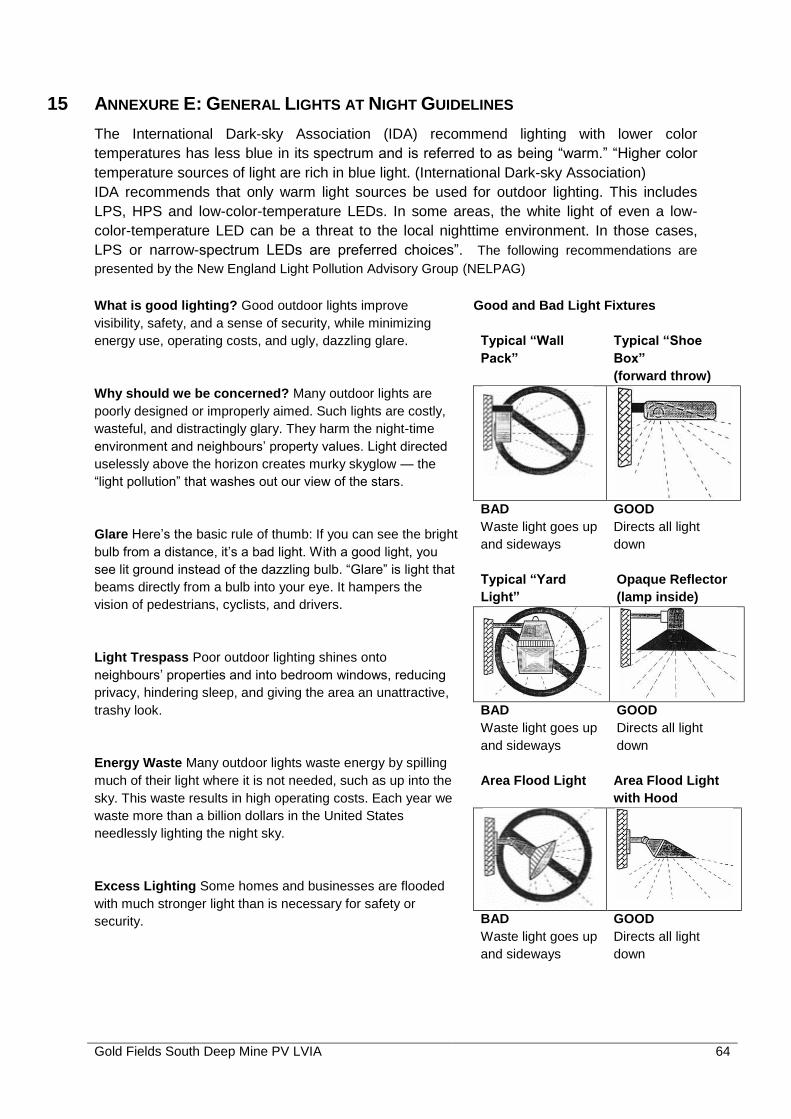
Gold Fields South Deep Mine PV LVIA
64
15 ANNEXURE E: GENERAL LIGHTS AT NIGHT GUIDELINES
The International Dark-sky Association (IDA) recommend lighting with lower color
temperatures has less blue in its spectrum and is referred to as being “warm.” “Higher color
temperature sources of light are rich in blue light. (International Dark-sky Association)
IDA recommends that only warm light sources be used for outdoor lighting. This includes
LPS, HPS and low-color-temperature LEDs. In some areas, the white light of even a low-
color-temperature LED can be a threat to the local nighttime environment. In those cases,
LPS or narrow-spectrum LEDs are preferred choices”. The following recommendations are
presented by the New England Light Pollution Advisory Group (NELPAG)
What is good lighting? Good outdoor lights improve
visibility, safety, and a sense of security, while minimizing
energy use, operating costs, and ugly, dazzling glare.
Why should we be concerned? Many outdoor lights are
poorly designed or improperly aimed. Such lights are costly,
wasteful, and distractingly glary. They harm the night-time
environment and neighbours’ property values. Light directed
uselessly above the horizon creates murky skyglow — the
“light pollution” that washes out our view of the stars.
Glare Here’s the basic rule of thumb: If you can see the bright
bulb from a distance, it’s a bad light. With a good light, you
see lit ground instead of the dazzling bulb. “Glare” is light that
beams directly from a bulb into your eye. It hampers the
vision of pedestrians, cyclists, and drivers.
Light Trespass Poor outdoor lighting shines onto
neighbours’ properties and into bedroom windows, reducing
privacy, hindering sleep, and giving the area an unattractive,
trashy look.
Energy Waste Many outdoor lights waste energy by spilling
much of their light where it is not needed, such as up into the
sky. This waste results in high operating costs. Each year we
waste more than a billion dollars in the United States
needlessly lighting the night sky.
Excess Lighting Some homes and businesses are flooded
with much stronger light than is necessary for safety or
security.
Good and Bad Light Fixtures
Typical “Wall
Pack”
Typical “Shoe
Box”
(forward throw)
BAD
Waste light goes up
and sideways
GOOD
Directs all light
down
Typical “Yard
Light”
Opaque Reflector
(lamp inside)
BAD
Waste light goes up
and sideways
GOOD
Directs all light
down
Area Flood Light Area Flood Light
with Hood
BAD
Waste light goes up
and sideways
GOOD
Directs all light
down

Gold Fields South Deep Mine PV LVIA
65
How do I switch to good lighting?
Provide only enough light for the task at hand; don’t over-light, and don’t spill light off your property. Specifying
enough light for a job is sometimes hard to do on paper. Remember that a full Moon can make an area quite
bright. Some lighting systems illuminate areas 100 times more brightly than the full Moon! More importantly, by
choosing properly shielded lights, you can meet your needs without bothering neighbours or polluting the sky.
1. Aim lights down. Choose “full-cutoff shielded” fixtures that
keep light from going uselessly up or sideways. Full-cutoff
fixtures produce minimum glare. They create a pleasant-
looking environment. They increase safety because you
see illuminated people, cars, and terrain, not dazzling
bulbs.
2. Install fixtures carefully to maximize their effectiveness on
the targeted area and minimize their impact elsewhere.
Proper aiming of fixtures is crucial. Most are aimed too
high. Try to install them at night, when you can see where
all the rays actually go. Properly aimed and shielded
lights may cost more initially, but they save you far more
in the long run. They can illuminate your target with a low-
wattage bulb just as well as a wasteful light does with a
high-wattage bulb.
3. If colour discrimination is not important, choose energy-
efficient fixtures utilising yellowish high-pressure sodium
(HPS) bulbs. If “white” light is needed, fixtures using
compact fluorescent or metal-halide (MH) bulbs are more
energy-efficient than those using incandescent, halogen,
or mercury-vapour bulbs.
What You Can Do To Modify Existing
Fixtures
Change this . . . to this
(aim downward)
Floodlight:
Change this . . . to this
(aim downward)
Wall Pack
4. Where feasible, put lights on timers
to turn them off each night after they
are no longer needed. Put home
security lights on a motion-detector
switch, which turns them on only
when someone enters the area; this
provides a great deterrent effect!
Change this . . . to this or this
Yard Light Opaque Reflecter Show Box
Replace bad lights with good lights.
You’ll save energy and money. You’ll be a good neighbour. And you’ll help preserve our view of the stars.