landscape degradation and restoration an animal’s...
TRANSCRIPT
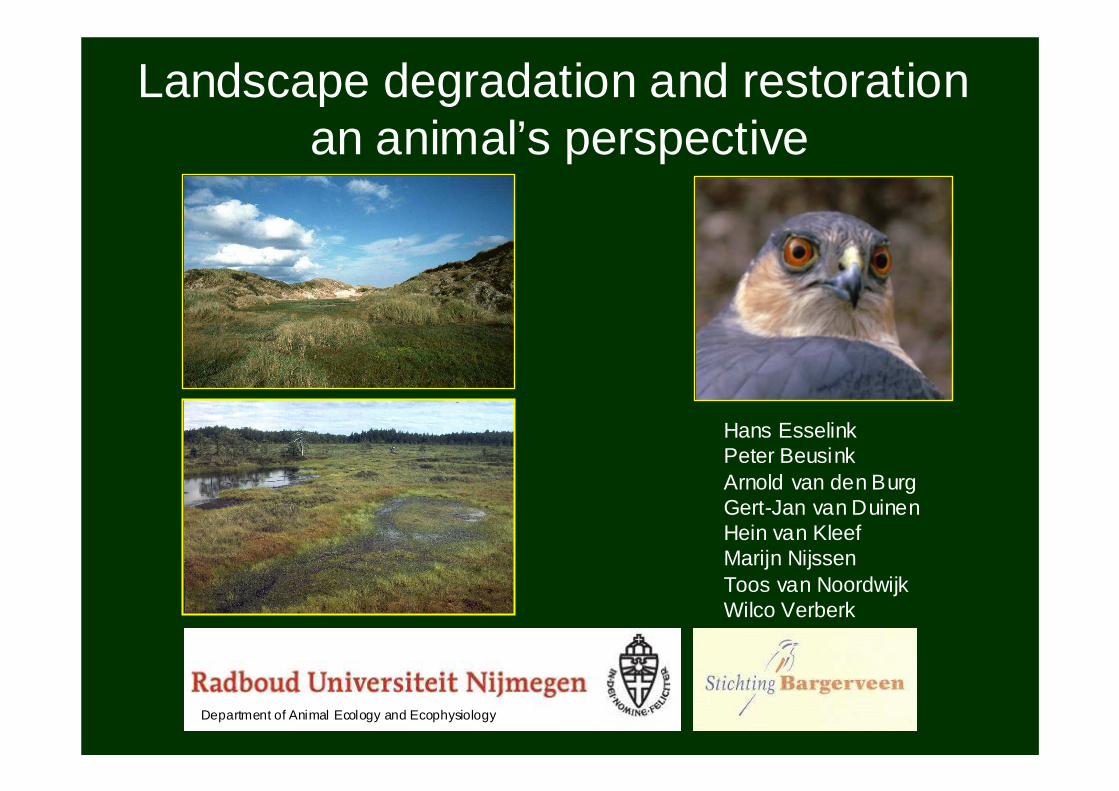
Landscape degradation and restoration an animal’s perspective
Hans EsselinkPeter BeusinkArnold van den BurgGert-Jan van DuinenHein van KleefMarijn NijssenToos van NoordwijkWilco Verberk
Department of Animal Ecology and Ecophysiology

Overview
Degradation
Fauna
Bottlenecks
Restoration
Conclusions

Degradation
Fauna
Bottlenecks
Restoration
Conclusions
EstoniaThe Netherlands
Degradation

Degradation
AcidificationEutrophicationDesiccation
Degradation
Degradation of Site conditions
Local conditions(microscale ~m2)

Degradation
Landscape conditions(mesoscale: ~ha macroscale: ~km2)
HomogenisationFragmentation
Chronic
Large scale
AcidificationEutrophicationDesiccation
Degradation of site conditions
Site conditions(microscale ~m2)
Degradation
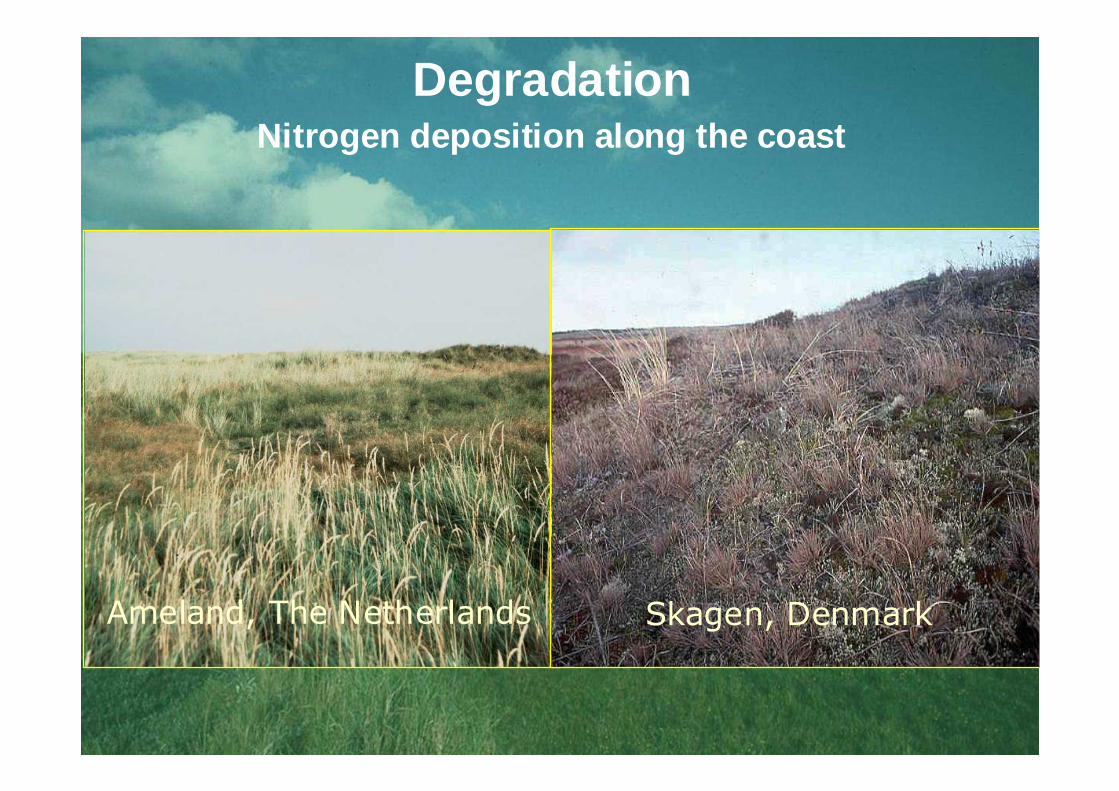
Skagen, DenmarkAmeland, The Netherlands
DegradationNitrogen deposition along the coast

Keibu bay, NW Estonia Korshage, NE Denmark
DegradationNitrogen deposition along the coast

Hanstolm, Denmark
Hanstholm, Denmark
1991
2001

Degradation
Landscape conditions(mesoscale: ~ha macroscale: ~km2)
HomogenisationFragmentation
Chronic
Large scale
AcidificationEutrophicationDesiccation
Degradation of site conditions
Site conditions(microscale ~m2)
Degradation of landscape
Degradation

Fauna
Degradation
Fauna
Bottlenecks
Restoration
Conclusions

Doel:Doel:behoud/herstel van ecosysteembehoud/herstel van ecosysteem
Biogeochemistry
&Hydrology
VegetationVegetation
FaunaFauna
High biodiversity – many different relationships with the environment

heterogeneous landscape
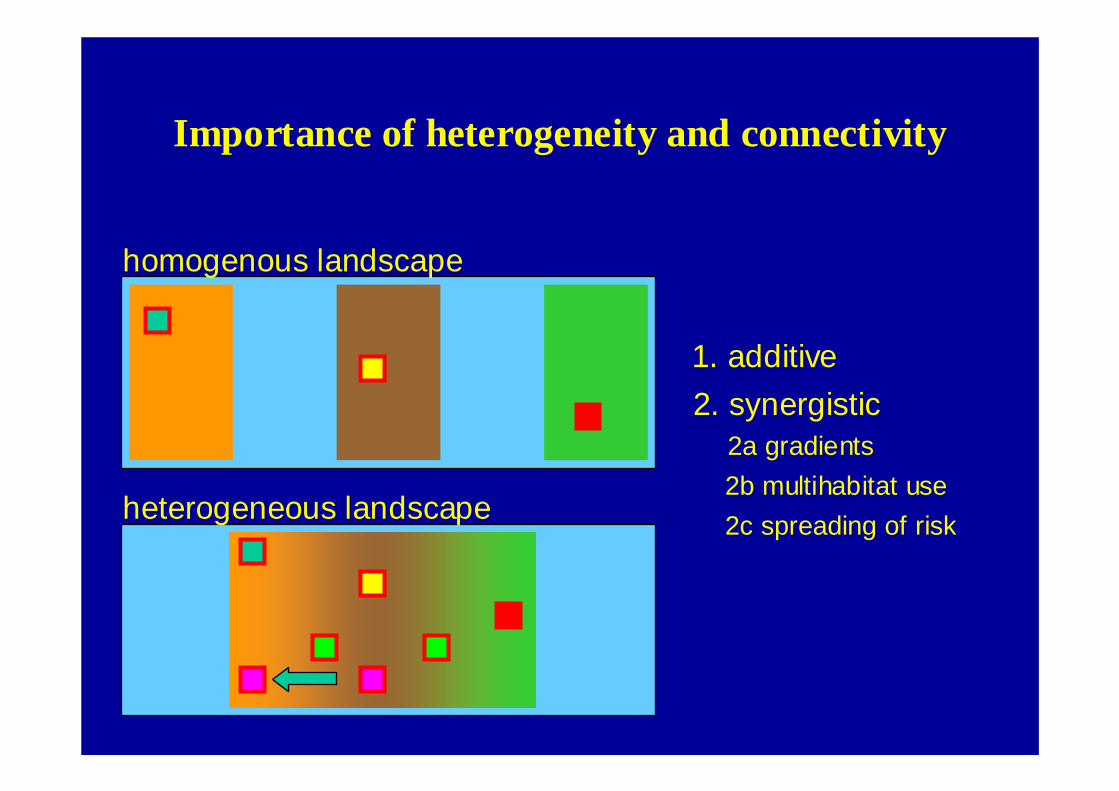
Importance of heterogeneity and connectivity
1. additive
2. synergistic2a gradients
2b multihabitat use
homogenous landscape
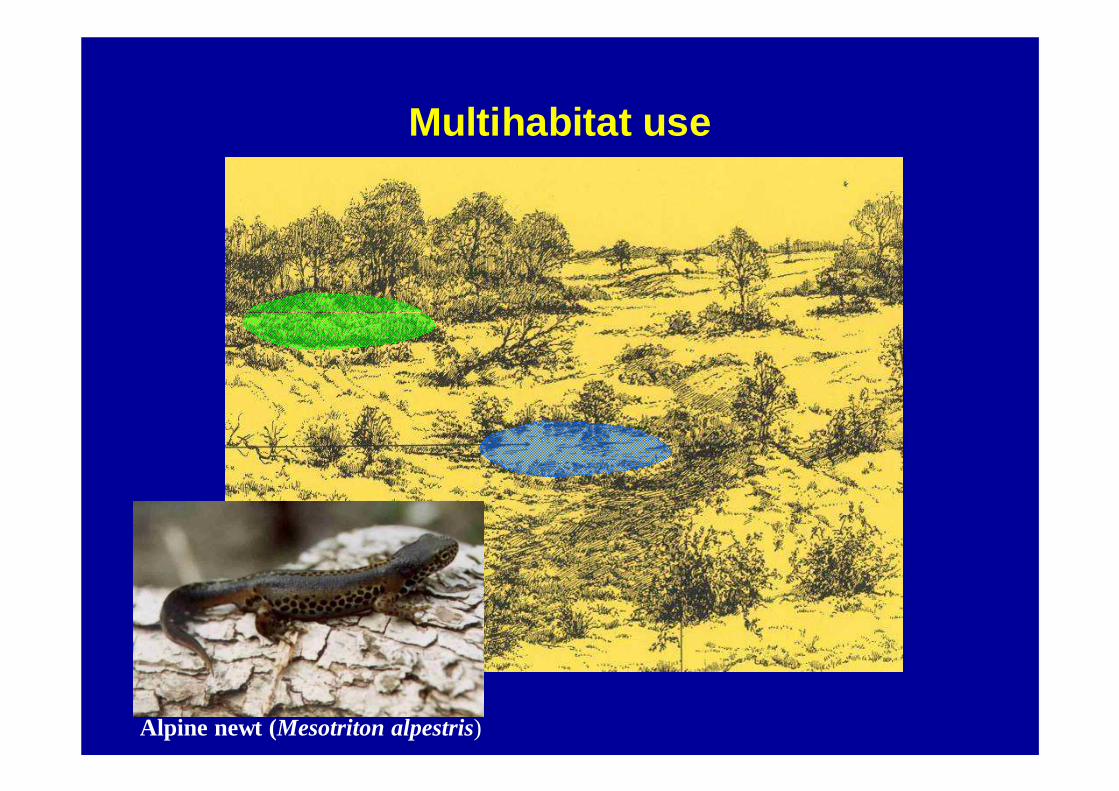
Multihabitat use
Alpine newt (Mesotriton alpestris)
heterogeneous landscape
Importance of heterogeneity and connectivity
1. additive
2. synergistic2a gradients
2b multihabitat use
homogenous landscape
2c spreading of risk

Spreading of risk
Optimal: shallow waterDrought: survival in suboptimalRecolonisation of optimal

- reproduce- pupate
- food- shelter
Importance of landscape connectivity and heterogeneit y!
Fauna

Ready flyerGood swimmerLongevity >1 yearSelective oviposition
# watertypes# configuration
‘match’ between fauna and landscape
Species use landscape specifically
Fauna

Degradation
Landscape conditions(mesoscale: ~ha macroscale: ~km2)
HomogenisationFragmentation
Chronic
Large scale
AcidificationEutrophicationDesiccation
Degradation of site conditions
Site conditions(microscale ~m2)
Degradation of landscape
Bottlenecks: Decline of
fauna diversity
Fauna

Bottlenecks
Degradation
Fauna
Bottlenecks
Restoration
Conclusions
Red-backed shrike
Sparrowhawk
Ants in chalk grasslands

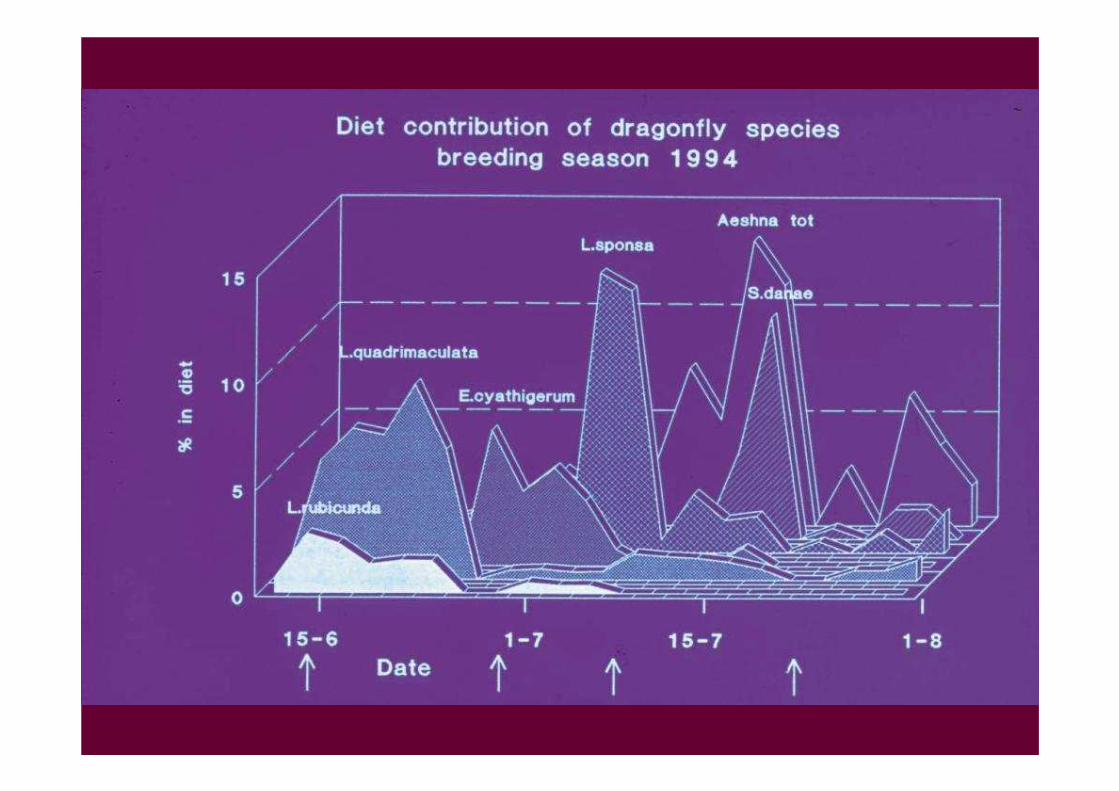
Example: Red backed Shrike •• seasonalseasonal migratingmigrating•• single single preyprey

Red backed Shrike •• seasonalseasonal migratingmigrating•• single single preyprey•• largelarge insectsinsects & & smallsmall vertebratesvertebrates

hymenoptera
odonata
lepidoptera
orthopteradiptera
larvae
coleopteraunknown
other
vertebrata
araneae
DietDiet compositioncomposition of the of the RedRed--backedbacked ShrikeShrike


Status of Red-Backed Shrike in Europe Tucker & Heath (1994)
The Red-backed Shrike ( Lanius collurio)

Population changes in the Netherlands
0
5000
10000
15000
1850 1900 1950 2000
(source: Hustings & Bekhuis 1993)

1965 1998
Decline of Red-Backed Shrike
in Dutch coastal dunes

stable
decreasing
almost disappeared
disappeared
Hanstolm
Skagen
The Netherlands
Belgium
France
Germany
Denmark
UK

Foodweb Hypothesis
timepr
ey a
vaila
bilit
y
time
prey
ava
ilab
ility
Species ASpecies BSpecies CCumulativeMinimum

DegradedDegraded
Last Last DutchDutch pairs in pairs in 1998/1999 1998/1999 onon Ameland, Ameland,
NetherlandsNetherlands
IntactIntact
VitalVital populationpopulation
in Skagen, Denmarkin Skagen, Denmark

0
1000
2000
3000
4000
5000
0 2 4 6 8 10 12 14
age of nestlings (days)
cons
umpt
ion
per n
estli
ng p
er
day
(mg
DW
)Ameland nestlings'97 (3)'98 (3 > 1)SkagenSK1 (5)SK12 (6)SK16 (4)
††
CONSUMPTION BY NESTLINGS

0
1000
2000
3000
4000
5000
0 2 4 6 8 10 12 14
age of nestlings (days)
cons
umpt
ion
per n
estli
ng p
er
day
(mg
DW
)Ameland nestlings'97 (3)'98 (3 > 1)SkagenSK1 (5)SK12 (6)SK16 (4)
††
†
†
CONSUMPTION BY NESTLINGS

0
25
50
75
0-5 5-10 10-15 15-20 > 20
prey length [classes in mm]
% o
f die
t
Ameland '97-'98Ameland '89Terschelling '94-'95Skagen '01Skagen '02
PREY LENGHT IN ADULT DIET
% o
f die
t

0
25
50
75
0-5 5-10 10-15 15-20 > 20
prey length [classes in mm]
% o
f die
t
Ameland '97-'98Ameland '89Terschelling '94-'95Skagen '01Skagen '02
PREY LENGHT IN ADULT DIET
% o
f die
t
Ameland1989Ameland
1997
Skagen2002

Ameland ‘89 Ameland‘97-‘98
Terschelling‘94-‘95
Skagen ‘02
Beetles 79,0 34,5 25,7 56,1Scarabids 49,5 3,9 7,0 46,5Carabids 5,5 7,9 2,6 3,3Weevils 6,9 8,3 9,2 1,7Other 17.1 12.5 6.9 4.6
Hymenoptera 17,1 55,9 62,6 30,8Bumblebees 11,9 4,0 33,4 14,4Ants 2,0 44,9 19,3 7,0Other 3,2 7,1 10,0 9,4
Other 3,9 9,5 11,7 13,1
n. pellets 115 35 63 52n. ind. prey 1381 864 629 458
Diet composition

-- ChaferChafer ((AnomalaAnomala dubiadubia))-- SandSand LizzardLizzard ((LacertaLacerta agilisagilis))-- WarthbiterWarthbiter ((DecticusDecticus verrucivorisverrucivoris))
Important prey species

Life cycle Anomala dubia
Anomala 2 years
augseptoct
nov
dec
jan
feb
mar apr
jul
jun
may egg
L1
L2
L3
pupal
adult
(Rittershaus 1927)
July - May
May - June
June - July
2 years
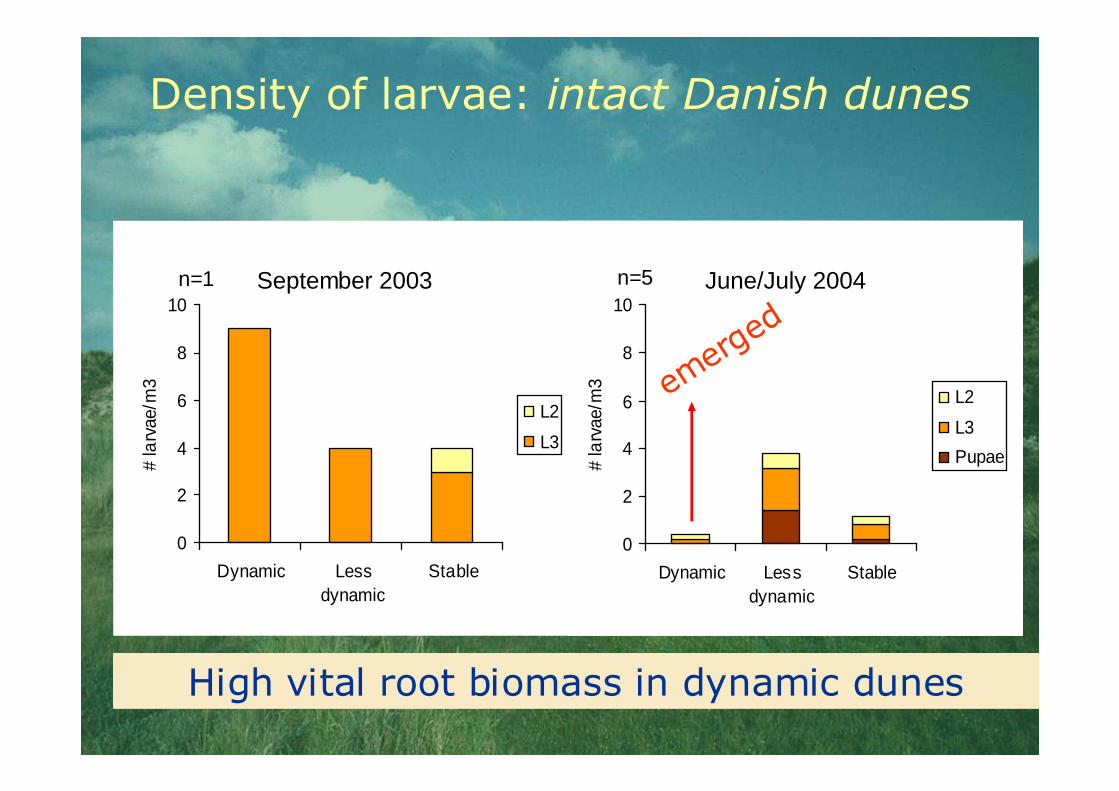
Density of larvae: intact Danish dunes
0
2
4
6
8
10
Dynamic Lessdynamic
Stable
# la
rvae
/m3
L2
L3
September 2003n=1
0
50
100
150
200
250
300
350
Dynamic Less dynamic StableR
oot
bio
mas
s (g
ram
/m3
)
n=5
0
2
4
6
8
10
Dynamic Lessdynamic
Stable#
larv
ae/m
3
L2
L3
Pupae
June/July 2004n=5
emerged
Highest density of larvae in dynamic dunesHigh vital root biomass in dynamic dunes

Density of larvae & Marram grass
Marram stage
0
1
2
3
4
5
pioneer relict large vital
# la
rvae
/m3
n= 6 3 6 17Root biomass
0
1
2
3
4
5
no-old little vital#
larv
ae/m
3
n= 7 17 11
Highest density of larvae if Marram shows vital growth
* *

- increased vegetation succession
- sand, organic layer (detrivores)
- changes in microclimate (soil fauna)
- changes in plants (herbivores & nectivores)
- lower heterogeneity and prey availability (carnivores)
Degradation causes ‘mismatch’ at different scales
Bottlenecks

Example:
Micronutriënts shortage in Sparrow Hawk (Accipiter nisus)
* Aminoacids
* Minerals
* Vitamins

1990 1991 1992 1993 1994 1995 1996 1997 1998 1999 2000 2001 20020,0
0,2
0,4
0,6
0,8
1,0
Rijk, 5 km2
/ Rich
2 / Rich
2 / Poor
2 / Poor
Rijk, 18 km
Arm, 18.5 km
Arm, 21 km
Tijd (jaren) / Time (years)
Example: micronutrient deficiency

Time
number of days
(range)
Body weight
+/- SD
(N)
Muscle size
+/- SD
(N)
before laying -24.4 (-8 - -45) 274.9 +/- 21.7
(14)
7.64 +/- 1.55
(11)
after laying 22.3 (10-37) 304.6 +/- 18.5
(40)
5.11 +/- 1.54
(30)
Wilcoxon p<0.0002 p<0.0002
Change in mass and breast musclesize in breeding females
Example: micronutrient deficiency

year
2000 2001 2002 2003 2004
N 10 6 14 14 14
breast muscle (mm) average 13.9 10.1 7.6 7.5 7.0
SD 1.4 1.2 1.3 1.1 0.9
body weight (g) average 308 311 300 309 307
SD 19.8 19.2 16.7 18.4 18.4
Example: micronutrient deficiency

Deficiencies in micronutrients decreases reproductive output.
Deficiency in vitamin B2 and carrier protein
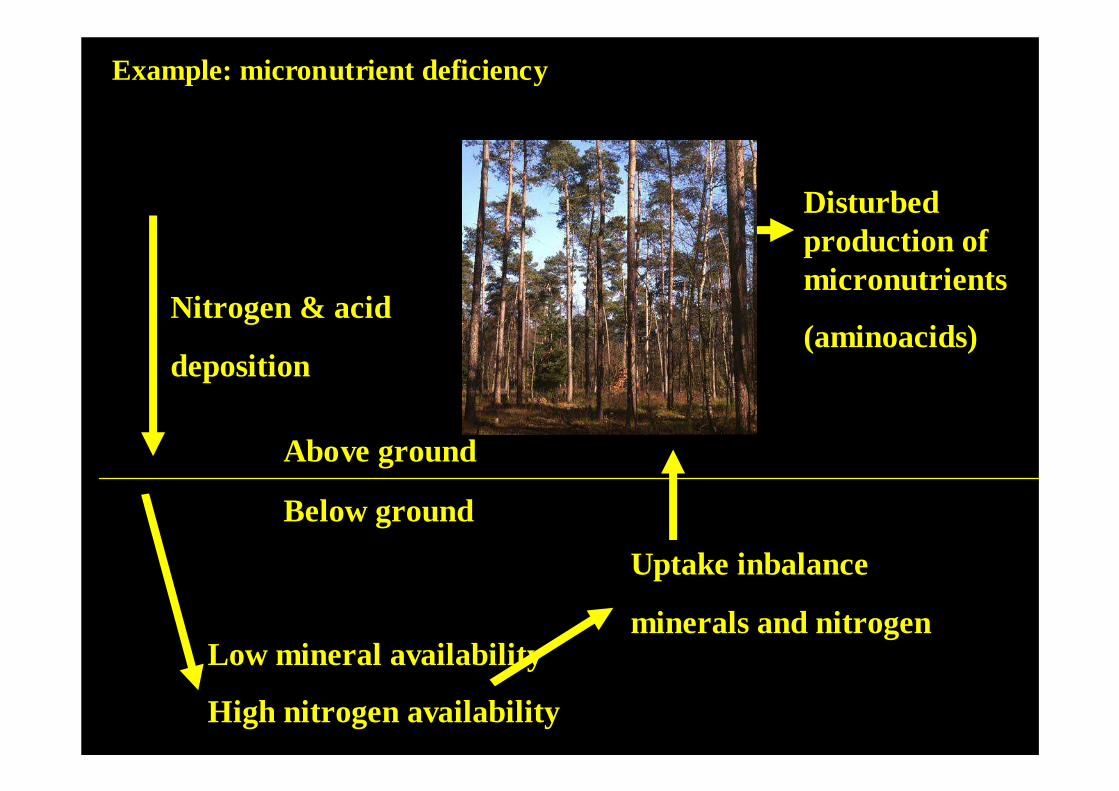
Nitrogen & acid
deposition
Below ground
Low mineral availability
High nitrogen availability
Uptake inbalance
minerals and nitrogen
Disturbedproduction of micronutrients
(aminoacids)
Above ground
Example: micronutrient deficiency

Example: Ants in chalk grasslands

Identifing the main bottlenecks Field survey chalk grasslands(’05-’06)

Hypotheses
• Fragmentation?• Microclimate?• Disturbance through
management?

Ants as indicators
• 38 species grouped in 7 life history tactics
• Temperature (time constrainted development)
• Fragmentation (limited dispersal)

GE+BE NL

Fragmentation
Microclimate

• Enhance microclimatic conditions:
Grazing and repeated mowing (not too late)
• Counter fragmentation:
stepping stones and expansion of current reserves

Restoration
Degradation
Fauna
Bottlenecks
Restoration
Recommendations
Effects
Bogs
Softwater pools
moorland

Restoration
AcidificationEutrophicationDesiccation
Degradation of site conditions
Site conditions(microscale ~m2)
Bottlenecks: Decline of
fauna diversity
MowingSod-cuttingRewetting…
Restoration

Restoration
AcidificationEutrophicationDesiccation
Site conditions(microscale ~m2)
MowingSod-cuttingRewetting…
Restoration of site conditions
Restoration

Restoration
LargescaledFast
Intensive

AcidificationEutrophicationDesiccation
Restoration of site conditions
Site conditions(microscale ~m2)
IntenseLarge scale
Landscape conditions(mesoscale: ~ha macroscale: ~km2)
HomogenisationFragmentation
Restoration
HomogenisationFragmentation
Restoration

AcidificationEutrophicationDesiccation
Restoration of site conditions
Site conditions(microscale ~m2)
IntenseLarge scale
Landscape conditions(mesoscale: ~ha macroscale: ~km2)
HomogenisationFragmentation
furtherdegradation of Landscape?
Bottlenecks: Decline of
fauna diversity
Restoration
Restoration

Example: rewetting of bog landscapes
Männikjärve, Estonia
Bargerveen, The Netherlands

Large variationFine scale mozaicGradual transitions
Relation between landscape heterogeneity and fauna diversity
Case study Korenburgerveen
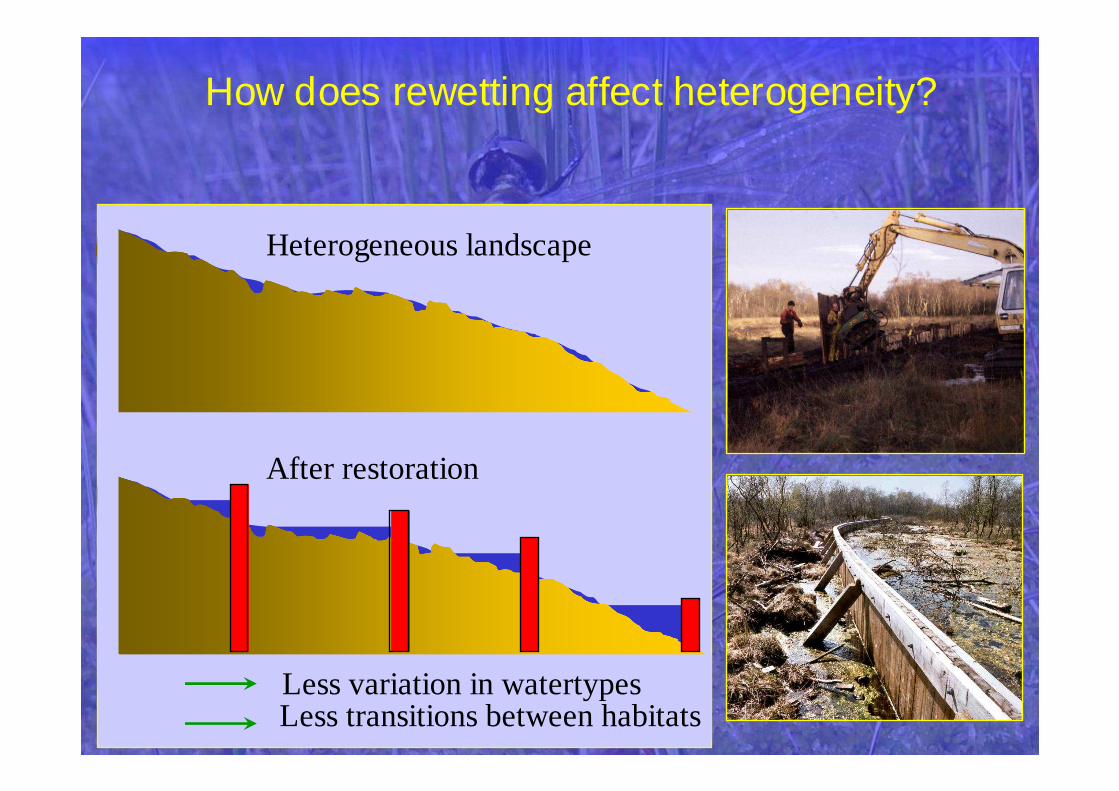
How does rewetting affect heterogeneity?
Heterogeneous landscape
After restoration
Less variation in watertypesLess transitions between habitats

Cumulatieve species richness
0
25
50
75
100
1 2 3 4 5 6 7 8 9 10
number of samples
cum
ula
tive
spec
ies
num
ber
Compartment 1 (before)Compartment 1 (after)Compartment 2 (before)Compartment 2 (after)

WHAT ARE THE EFFECTS OF (LARGE SCALE) RESTORATION?
ON MACROFAUNA ASSEMBLAGES IN RAISED BOGSON MACROFAUNA ASSEMBLAGES IN RAISED BOGS
Macro Macro invertebrateinvertebrate samples samples fromfrom::
1. Intact 1. Intact raisedraised bogsbogs in in EstoniaEstonia2. 2. RewettedRewetted sites in the sites in the NetherlandsNetherlands
3. 3. NonNon--rewettedrewetted ((remnantremnant) sites in the ) sites in the NetherlandsNetherlands
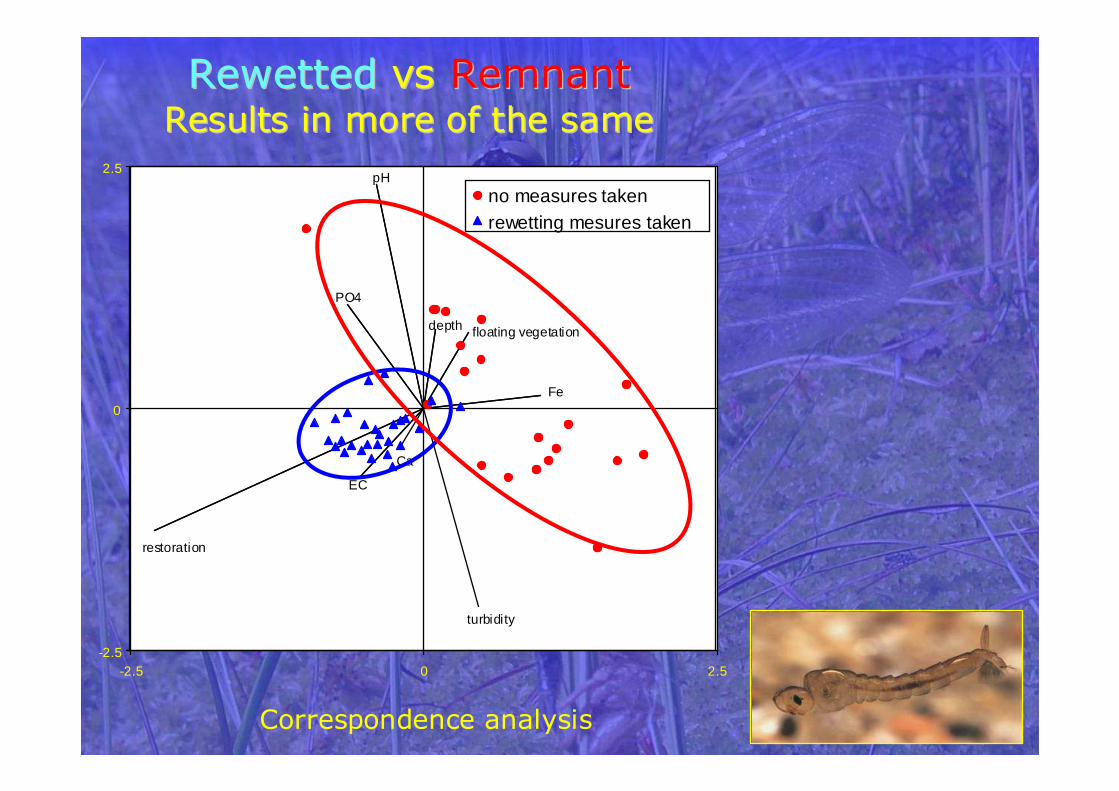
RewettedRewetted vsvs RemnantRemnantResultsResults in more of the in more of the samesame
Correspondence analysis
Ca
pH
PO4
restoration
floating vegetation
EC
depth
Fe
turbidity
-2.5
0
2.5
-2.5 0 2.5
no measures takenrewetting mesures taken

0
20
40
60
80
100
120
140
0 10 20 30
number of samples
restoration
remnantCum
ula
tive
num
bero
f spe
cies
RewettedRewetted vsvs RemnantRemnantSpecies Species richnessrichness
rewetted
remnant

0
2
4
6
8
10
12
14
16
0 10 20 30
Number of samples
restoration
remnant
Cum
. No
. Rar
e ch
arac
teris
ticsp
ecie
s
RewettedRewetted vsvs RemnantRemnantRare, Rare, characteristiccharacteristic speciesspecies
rewetted
remnant

-3
0
3
-4 0 4
remnantrestorationintact
remnantrestoredintact
Remnant sites still contain communities from intact bogs
RewettedRewetted,, RemnantRemnant && IntactIntact

-3
0
3
-4 0 4
remnantrestorationintact
remnantrestoredintact
Restoration does not lead to communities of intact bogs
RewettedRewetted,, RemnantRemnant && IntactIntact

-3
0
3
-4 0 4
remnantrestorationintact
remnantrestoredintact
As a result of restoration part of the remaining intact bog communities disappears
RewettedRewetted,, RemnantRemnant && IntactIntact

-3
0
3
-4 0 4
remnantrestorationintact
remnantrestoredintact
Species from the most ombrotrophic parts of intact bogsare still missing in the Netherlands
RewettedRewetted,, RemnantRemnant && IntactIntact

Example: Restoration measures in shallow soft water lakes
• increase CO2• toxicity
• accumulation of organic sludge
• anaërobic conditions
• increase N, P
• turbidity algae
• accumulation of organic sludge
• anaërobic conditions
• anaërobie => aërobie
• increased decomposition
• increased nutrientavailability, acidity
• decrease groundwater
Change in
characteristic
conditions
+
Special
adaptations
superfluous
}

Consequences
Populations decrease and extirpate Fot
o: M
. Dor
enbo
sch

Removal of organic sludge and recolonisation
2 options:
Present & persist
or
recolonise

Execution phase (1 week)
Recovery phase (1 year)
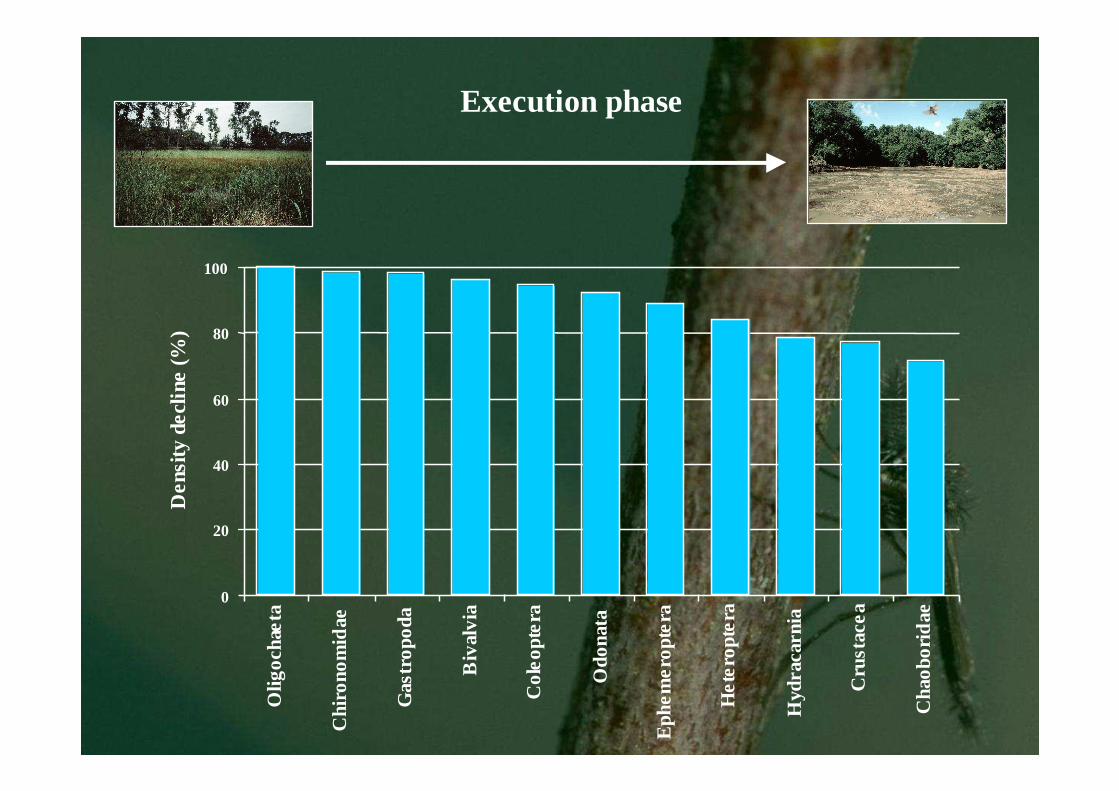
Execution phase
0
20
40
60
80
100O
ligo
chae
ta
Chi
rono
mid
ae
Gas
tropo
da
Biv
alvi
a
Co
leo
pte
ra
Odo
nata
Eph
em
ero
pte
ra
He
tero
pte
ra
Hyd
raca
rnia
Cru
sta
cea
Cha
obo
ridae
De
nsity
decl
ine
(%)

Mobility
0.00
0.02
0.04
0.06
0.08
0.10
0.12
sprawler digger climber crawler swimmer
Type of locomotion
-Lo
g (
dens
ityde
clin
e)
a a aa
b
Execution phase
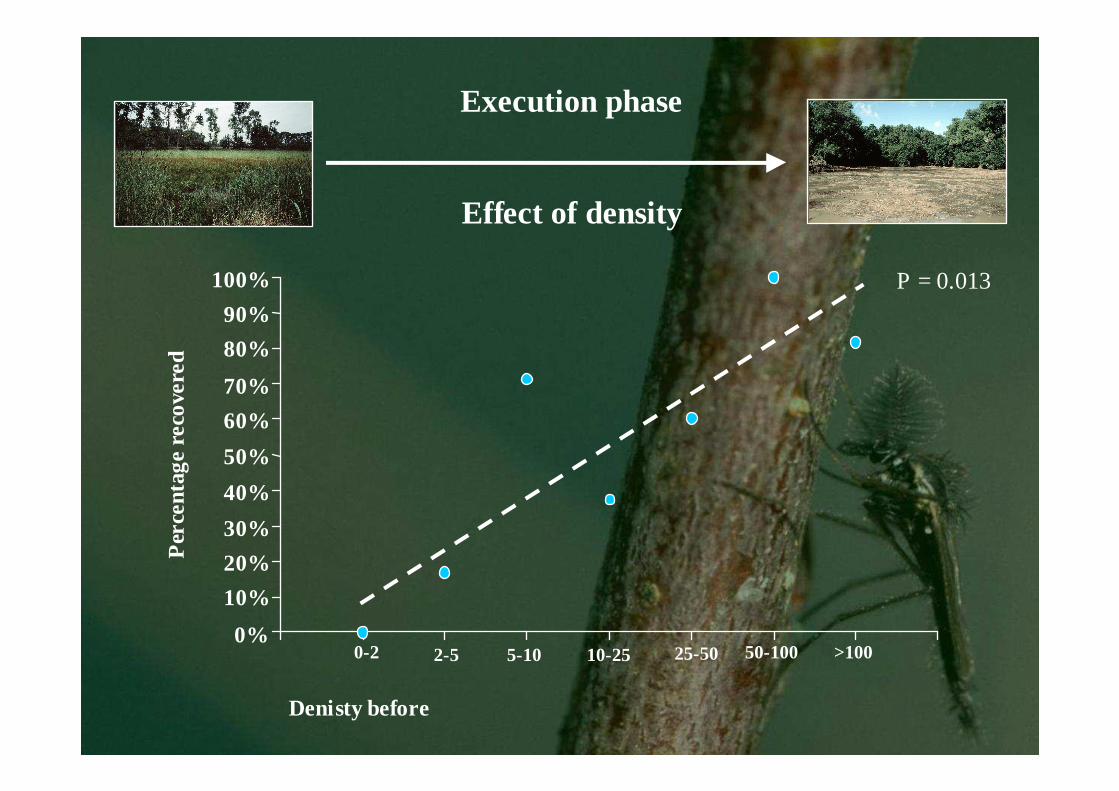
0%
10%
20%
30%
40%
50%
60%
70%
80%
90%
100%
Denisty before
Per
cent
age
reco
vere
d
Effect of density
0-2 2-5 5-10 10-25 25-50 50-100 >100
P = 0.013
Execution phase

Recovery-phase
Correspondence analysis on species traits
Accounting for effects of execution phase
Biological species traits
F3
F2
F1
F4E3
E1
E2A1
A2
K3
K4
K2
K5
K6
K1H3
H1
H4
H5
H6
H2
B1
B2
B3
G1
G2
J4J8
J3
J1
J2
J7
I4
I5
I6
I7
I1
I3
I2 New
Disappeared
Relatively stable
Decreased
Increased

Dissapeared Decreased Stabile Increased NewDiet
Animal X XPlants XDetritus X X
HabitatVegetation XBare sand XAnaerobic sediment XHost XAerobic organic matter XIndifferent X
Parental careEggs fixed terrestrial XEggs in/on vegetation XEggs on adult XEggs on surface XOvovivipary XEggs on solid substraat X
Prefered life historySemivoltine XUnivoltine XMultivoltine X
ReproductionSexually XAsexually X

Combined effects
Multiple filters
Abundant no Vulnerable yes Habitat:
vegetationno SAFE!
yes no yes yes no
Mobileyes
Carnivourno Ovipositionering in
vegetatie

Large changes
0%
10%
20%
30%
40%
50%
60%
70%
80%
90%
100%
IJsbaan Verwolde Grenspoel Wijnjeterperschar
Rel
atie
ve a
anta
l so
orte
n
Toename >= 1000%
Toename [100, 1000%>
Toename [0, 100%>
Afname <0,50%]
Afname <50,95%]
Afname <95,100%]

Gecombined effecten
0%
10%
20%
30%
40%
50%
60%
70%
80%
90%
100%
Het
ero
pter
a
Cru
stac
ea
Mol
lusc
a
Col
eopt
era
Hir
udi
nea
Odo
nat
a
Eph
em
ero
pter
a
Ara
chni
dae
Cha
obo
rida
e
Tric
hopt
era
Dix
idae
Meg
alo
pter
a
Hyd
raca
rin
a
Chi
rono
mid
ae
Olig
ocha
eta
Mobiliteit
Carnivorie
Ovipositionering
Habitat
Niet beïnvloed
26 40 6 16 4 1 4 8 2 1 20 24 691

0
0,1
0,2
0,3
0,4
0,5
0,6
0,7
0,8
0,9
1
Verdwenen Gebleven
Non characteristic
Characteristic
Re
latie
ve a
anta
l soo
rte
n
Persistence of characteristic species

Or…
Recolonisation
fragmentation
< 1950 1983-89

Gradients are refugia for characteristic species
Somatochlora flavomaculata
Ixobrychus minutus
Utricularia intermedia
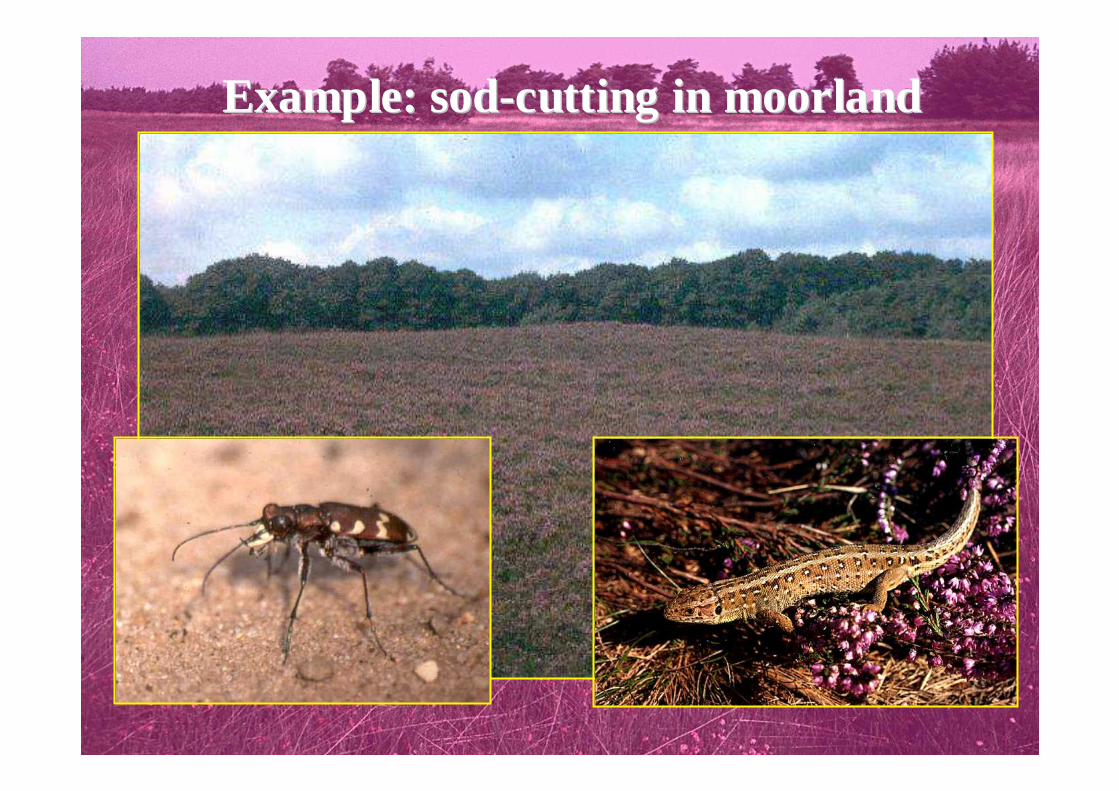
ExampleExample: : sodsod--cuttingcutting in moorlandin moorland


Alcon blue (Maculinea alcon)
ExampleExample: : smallsmall scalescalesodsodcuttingcutting

0
2000
4000
6000
8000
10000
12000
14000
16000
18000
1995 1996 1997 1998 1999 2000 2001 2002 2003
ExampleExample: : smallsmall scalescalesodsodcuttingcutting

Conclusions
Degradation
Fauna
Bottlenecks
Restoration
Conclusions

Conclusions
Species
Species traits: Capabilities and dependanciesMultiple Spatial scales
Landscapes
Configuration and habitat diversity:Possibilities and problemsSpatial and temporal heterogeneity
} Problem analysis:
Match & mismatch?Adress bottlenecks

Management recommendations
Ensure survival of relic populations (source for colonisation)- gradual transition from current situation to future situation

Ensure survival of relic populations (source for colonisation)- gradual transition from current situation to future situation
Conserve heterogeneity- internally and externally, relations at landscape level
(including all habitattypes and their transitions)- small scaled intensive (phased)- large scaled slow (reversible)
Management recommendations

Create heterogeneity- differential management- strengthen key processes
Ensure survival of relic populations (source for colonisation)- gradual transition from current situation to future situation
Conserve heterogeneity- internally and externally, relations at landscape level
(including all habitattypes and their transitions)- small scaled intensive (phased)- large scaled slow (reversible)
Management recommendations

Restoring faunal communitiesMatching species to changing landscapes

Thank you for your attention!
Questions?