landslide risk assessment of chepe river ......landslide is one of the major type of natural...
TRANSCRIPT
LANDSLIDE RISK ASSESSMENT OF CHEPE
RIVER CORRIDOR, GANDAKI RIVER BASIN,
NEPAL
A Dissertation Submitted to
CENTRAL DEPARTMENT OF ENVIRONMENTAL SCIENCE
Institute of Science and Technology
Tribhuvan University
Kirtipur, Kathmandu, Nepal
In Partial Fulfilment of the Requirements for the Award of Degree of
M.Sc. in Environmental Science
By
Kripa Shrestha
June, 2018
La
nd
slid
e R
isk
As
ses
sm
en
t of C
he
pe
Riv
er C
orrid
or, G
an
dak
i Riv
er B
as
in, N
ep
al. –
Sh
res
tha
, K.

LANDSLIDE RISK ASSESSMENT OF CHEPE
RIVER CORRIDOR, GANDAKI RIVER BASIN,
NEPAL
A Dissertation Submitted to
CENTRAL DEPARTMENT OF ENVIRONMENTAL SCIENCE
Institute of Science and Technology
Tribhuvan University
Kirtipur, Kathmandu, Nepal
In Partial Fulfilment of the Requirements for the Award of Degree of
M.Sc. in Environmental Science
By
Kripa Shrestha TU Registration no.: 5-2-453-203-2011
TU Exam Roll no: 518
June, 2018

ii
DECLARATION
I hereby declare that the work presented in this dissertation is a genuine work done
originally by me and has not been submitted anywhere for the award of any degree.
All the sources of information have been specifically acknowledgement by reference
to the author(s) or institution(s).
…………………………………
Kripa Shrestha
Date: 29th June, 2018

iii
RECOMMENDATION
This is to certify that Ms. Kripa Shrestha has completed this dissertation work entitled
“Landslide Risk Assessment of Chepe River Corridor, Gandaki River Basin,
Nepal” as a partial fulfilment of the requirements of M.Sc. in Environmental Science
under our supervision and guidance. To our knowledge, this research has not been
submitted for any other degree, anywhere else.
We therefore, recommend the dissertation for acceptance and approval.
Supervisors:
……………………………………
Udhab Raj Khadka, PhD
Central Department of Environmental Science,
Tribhuvan University
Kirtipur, Kathmandu, Nepal
TRIBHUVAN UNIVERSITY Central Department of Environmental Science
Tel No: 4-332147
4-332711
Date: 29th June, 2018
…………………………………….
Mandira Singh Shrestha, PhD
Program Co-ordinator-Hi-RISK
River Basins and Cryosphere
ICIMOD

iv
LETTER OF APPROVAL
On the recommendation of supervisors “Dr. Udhab Raj Khadka” and “Dr. Mandira Singh
Shrestha” this dissertation submitted by “Ms. Kripa Shrestha” entitled “Landslide
Risk Assessment of Chepe River Corridor, Gandaki River Basin, Nepal” has been
approved for the examination and submitted to the Tribhuvan University in partial
fulfilment of the requirements of M.Sc. in Environmental Science.
.………………………………….
Rejina Maskey, PhD
Professor and Head
TRIBHUVAN UNIVERSITY Central Department of Environmental Science
Tel No: 4-332147
4-332711
Date: 29th June, 2018
Kirtipur, Kathmandu, Nepal

v
CERTIFICATE OF ACCEPTANCE
This dissertation entitled “Landslide Risk Assessment of Chepe River Corridor,
Gandaki River Basin, Nepal” submitted by “Ms. Kripa Shrestha” has been examined
and accepted as a partial fulfilment of the requirements of M.Sc. in Environmental
Science.
Evaluation Committee
Tel No: 4-332147
4-332711
Date: 13th September, 2018
TRIBHUVAN UNIVERSITY Central Department of Environmental Science
Kirtipur, Kathmandu, Nepal
…………………………………..
Udhab Raj Khadka, PhD
Supervisor
Central Department of Environmental Science,
Tribhuvan University
Kirtipur, Kathmandu, Nepal
…………………………………….
Mandira Singh Shrestha, PhD
Supervisor
Program Co-ordinator-Hi-RISK
River Basins and Cryosphere
ICIMOD
......................................
Prof. Rejina Maskey, PhD
Internal Examiner
Head
CDES, TU
Kirtipur, Kathmandu,
…………………………………..
External Examiner
Vishwas Chitale, PhD
…………………………………..
Internal Examiner
Asst. Prof. Man Kumar Dhamala, PhD
Central Department of Environmental Science
Tribhuvan University
Kirtipur, Kathmandu, Nepal

vi
ACKNOWLEDGEMENTS
Firstly, I would like to express my sincere gratitude to my esteemed supervisors Dr.
Udhab Raj Khadka, Central Department of Environmental Science, Tribhuvan
University (T.U.) and Dr. Mandira Singh Shrestha, International Centre for Integrated
Mountain Development (ICIMOD) for their continuous support, motivation, critical
supervision and valuable suggestions. Their mentorship was paramount in providing a
well-rounded experience consistent my long-term career goals. Thank you for giving me
the opportunity to develop my own individuality and self-sufficiency by allowing me to
work with such independence.
I owe my indebtedness to Prof. Dr. Rejina Maskey, Head of Department of Central
Department of Environmental Science (T.U.) for providing me administrative support. I
warmly acknowledge the guidance and financial support of Himalayan Adaptation,
Water and Resilience (HI-AWARE), International Centre for Integrated Mountain
Development (ICIMOD) Kathmandu, Nepal. I am thankful to Integrated Research on
Disaster Risk Programme (IRDR), Beijing, China for providing me the platform to
explore even more opportunities for my further research.
I am pleased to express my deepest gratitude to Dr. Deo Raj Gurung, Aga Khan
Development Network (AKDN), Tajikistan (Former GIS and Remote sensing specialist,
ICIMOD) and Dr. Uttam Paudel, Housing Recovery and Reconstruction Platform
(HRRP), Kathmandu for their invaluable guidance throughout my study. I am heartily
thankful to Mr. Prakash Aryal and Mr. Salar Saeed Dogar, GIS/RS Analyst from
National Agriculture Research Centre (NARC), Pakistan for their guidance. Along with
them, I will also like to thank Mr. Nabin Bhandari, Mr. Kesav Paudel, Mrs. Radhika
Maharjan and Mr. Ajay Shrestha for always being there and helping me out in my
confusions throughout my thesis period.
Finally, I would like to thank the people of Lamjung and Gorkha district, friends and my
family for their persistent support, inspiration and encouragement during my study.
Kripa Shrestha
June, 2018
vii
ABSTRACT
Landslide is one of the major type of natural disaster that causes loss of life and property
in Nepal. The landslide risk assessment using GIS and remote sensing tools identifying
hazard, vulnerability and risk are very useful for disaster risk reduction and management.
The study was carried out in the Chepe river corridor using two landslide hazard models
which were compared for the evaluation of the performance of the hazard model in the
small area like a river corridor. In this study, the Statistical Index Model and Logistic
Regression Model were applied, within a geographical information system (GIS), to
derive landslide hazard map of the Chepe river corridor. Eleven factors were considered
as possible triggering factors for the hazard assessment. In order to validate both the
models, Receiver Operating Characteristic (ROC) was used which shows that logistic
regression has 82% prediction accuracy whereas Statistical Index model has 63%
prediction accuracy. The logistic regression model seems to have extensive applicability
in river corridor of Nepal than statistical index method using eleven causative factors.
For the vulnerability assessment, the analysis of fourteen indicators were done to obtain
the vulnerability score following the Local Disaster and Climate Resilience Planning
(LDCRP) guideline. 10 wards were found to be low vulnerable whereas 8 wards were
observed to be medium vulnerable. No wards were found to be highly vulnerable to
landslide till date. Similarly, most of the area lies in medium risk zone i.e. 16.59 km2
followed by high, very high and low risk area in the Chepe river corridor.
Keywords: Corridor, logistic regression, risk, river, statistical index, vulnerability

viii
TABLE OF CONTENTS DECLARATION ......................................................................................................................... ii
RECOMMENDATION .............................................................................................................. iii
LETTER OF APPROVAL .......................................................................................................... iv
CERTIFICATE OF ACCEPTANCE ........................................................................................... v
ACKNOWLEDGEMENTS ........................................................................................................ vi
ABSTRACT ............................................................................................................................... vii
LIST OF TABLES ....................................................................................................................... x
LIST OF FIGURES .................................................................................................................... xi
LIST OF PHOTOGRAPHS ....................................................................................................... xii
ACRONYMS AND ABBREVIATIONS ................................................................................. xiii
CHAPTER 1: INTRODUCTION ............................................................................................. 1
1.1 Background ........................................................................................................................ 1
1.2 Rationale ............................................................................................................................ 3
1.3 Research Questions ............................................................................................................ 3
1.4 Objectives........................................................................................................................... 4
1.5 Limitations ......................................................................................................................... 4
CHAPTER 2: LITERATURE REVIEW ................................................................................. 5
CHAPTER 3: MATERIALS AND METHODS .................................................................... 10
3.1 Study Area........................................................................................................................ 10
3.2 Data Collection ................................................................................................................ 11
3.2.1 Field work ................................................................................................................. 11
3.2.2 Software used for data analysis ................................................................................. 11
3.3 Landslide modelling ......................................................................................................... 12
3.3.1 Remote sensing and GIS based landslide inventory by Bivariate Analysis .............. 12
3.3.2 Multivariate Analysis Model ..................................................................................... 14
3.3.3 Landslide Hazard Index Classification (Lee & Pradhan, 2007) ................................ 15
3.3.4 ROC index ................................................................................................................. 15
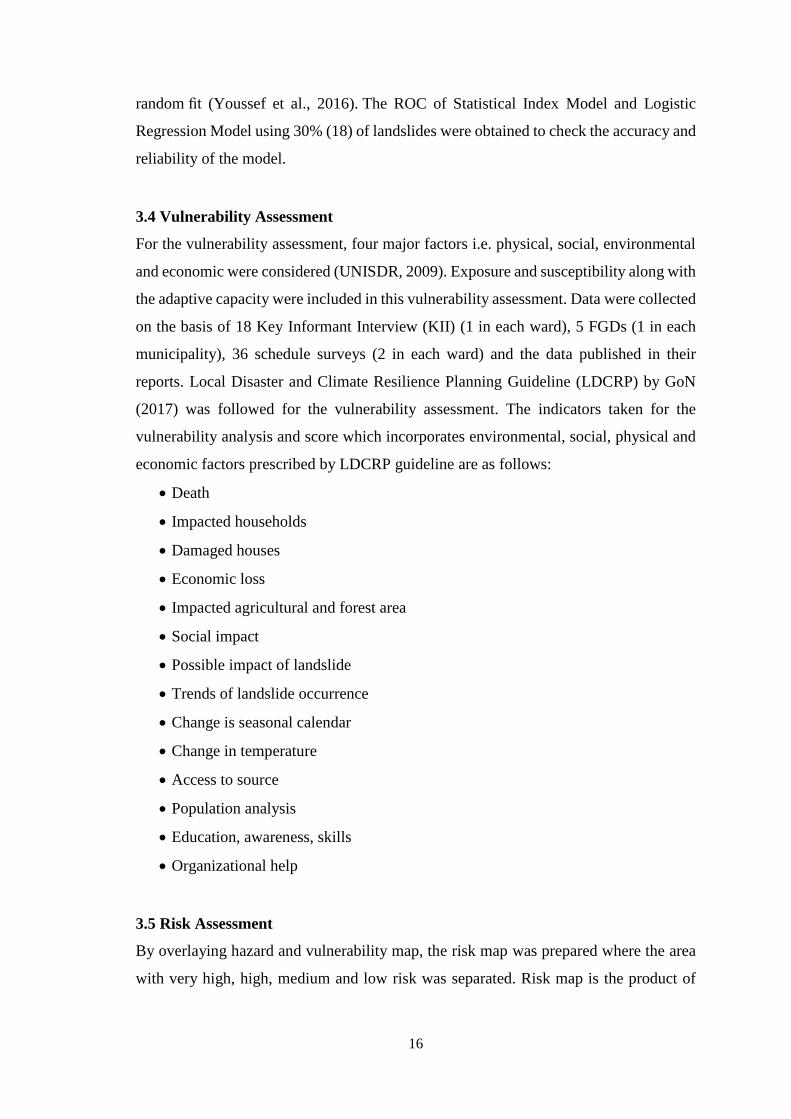
3.4 Vulnerability Assessment................................................................................................. 16
3.5 Risk Assessment .............................................................................................................. 16
3.6 Standardized map ............................................................................................................. 17
CHAPTER 4: RESULTS ......................................................................................................... 18
4.1 Landslide Inventory Map ................................................................................................. 18
4.2 Factor maps for Bivariate Statistical Index Model........................................................... 19
4.2.1 Slope .......................................................................................................................... 19
4.2.2 Aspect ........................................................................................................................ 20
4.2.3 Distance to road......................................................................................................... 22

ix
4.2.4 Relief ......................................................................................................................... 24
4.2.5 Profile curvature ........................................................................................................ 26
4.2.6 Plan curvature............................................................................................................ 28
4.2.7 Geology ..................................................................................................................... 30
4.2.8 Elevation ................................................................................................................... 31
4.2.9 Drainage density........................................................................................................ 33
4.2.10 Land use .................................................................................................................. 34
4.2.11 Rainfall .................................................................................................................... 36
4.3 Landslide Hazard Index (LHI) for Statistical Index Model ............................................. 38
4.3 Multivariate Logistic Regression Model .......................................................................... 40
4.4 Landslide Hazard Index for Logistic Regression Model ................................................. 42
4.5 Receiver Operating Characteristic (ROC)........................................................................ 44
4.6 Vulnerability Assessment................................................................................................. 46
4.6 Risk Assessment .............................................................................................................. 49
CHAPTER 5: DISCUSSION .................................................................................................. 51
5.1 Inventory and historical analysis of landslides ................................................................ 51
5.2 Landslide triggering factors ............................................................................................. 51
5.3 Landslide modelling and model comparison ................................................................... 55
5.4 Vulnerability and risk assessment .................................................................................... 56
CHAPTER 6: CONCLUSION AND RECOMMENDATIONS .......................................... 58
6.1 Conclusion ....................................................................................................................... 58
6.2 Recommendations ............................................................................................................ 58
REFERENCES ......................................................................................................................... 60
APPENDICES ............................................................................................................................. I
Appendix 1: Letter from Palungtar municipality, Gorkha for the completion of fieldwork at
the site ....................................................................................................................................... I
Appendix 2: Letter from Rainas municipality, Lamjung for the completion of fieldwork at
the site ..................................................................................................................................... II
Appendix 3: Questionnaire for Key Informant Interview ...................................................... III
Appendix 4: List of Key Informant Interviewed .................................................................... VI
Appendix 5: Ward level vulnerability Scores of each indicators .......................................... VII
Appendix 6: Rainfall stations in Chepe vicinity ................................................................. XXI

x
LIST OF TABLES
Table 1: Different landslide triggering factors and it’s sources ................................................. 12
Table 2: Weightage values of each slope class in Chepe River corridor ................................... 19
Table 3: Weightage values of each aspect in Chepe River corridor .......................................... 21
Table 4: Weightage values of distance from road in Chepe River corridor ............................... 23
Table 5: Weightage values of each relief class in Chepe River corridor ................................... 25
Table 6: Weightage values of each category of profile curvature in Chepe River corridor ....... 27
Table 7: Weightage values of each category of plan curvature in Chepe River corridor .......... 29
Table 8: Weightage values of each type of geological formation in Chepe River corridor ....... 30
Table 9: Weightage values of each elevation class in Chepe River corridor ............................. 32
Table 10: Weightage values of drainage density in Chepe River corridor ................................ 33
Table 11: Weightage values of each category of land use in Chepe River corridor .................. 35
Table 12: Weightage values of rainfall in Chepe River corridor ............................................... 36
Table 13: Weightage values for the triggering factors of landslide ........................................... 37
Table 14: Landslide Hazard Index Classification ...................................................................... 38
Table 15: Coefficient value of factors in Logistic Regression Model ....................................... 40
Table 16: Whole Model Test...................................................................................................... 42
Table 17: Landslide Hazard Index Classification ...................................................................... 43
Table 18: List of wards and municipality in the study area ....................................................... 46
Table 19: Landslide occurring areas (m2) .................................................................................. 47
Table 20: Vulnerability score of each wards of the study area .................................................. 47
Table 21: Differential vulnerability classes on the basis of vulnerability scores ....................... 48

xi
LIST OF FIGURES
Figure 1: Location of study area showing Chepe River corridor ............................................... 11
Figure 2: Flow Chart of Landslide Hazard Map Preparation by Statistical Index Model .......... 13
Figure 3: Landslide inventory map showing the distribution of landslides in the Chepe River
corridor ....................................................................................................................................... 18
Figure 4: Distribution of landslides in the different slopes of Chepe River corridor ................. 20
Figure 5: Distribution of landslides in the different aspects of Chepe River corridor ............... 22
Figure 6: Distribution of landslides along the distance from road in the Chepe River corridor 24
Figure 7: Distribution of landslides with the relief in the Chepe River corridor ....................... 26
Figure 8: Distribution of landslides with the profile curvature in Chepe River corridor ........... 28
Figure 9: Distribution of landslides with the plan curvature in the Chepe River corridor ......... 29
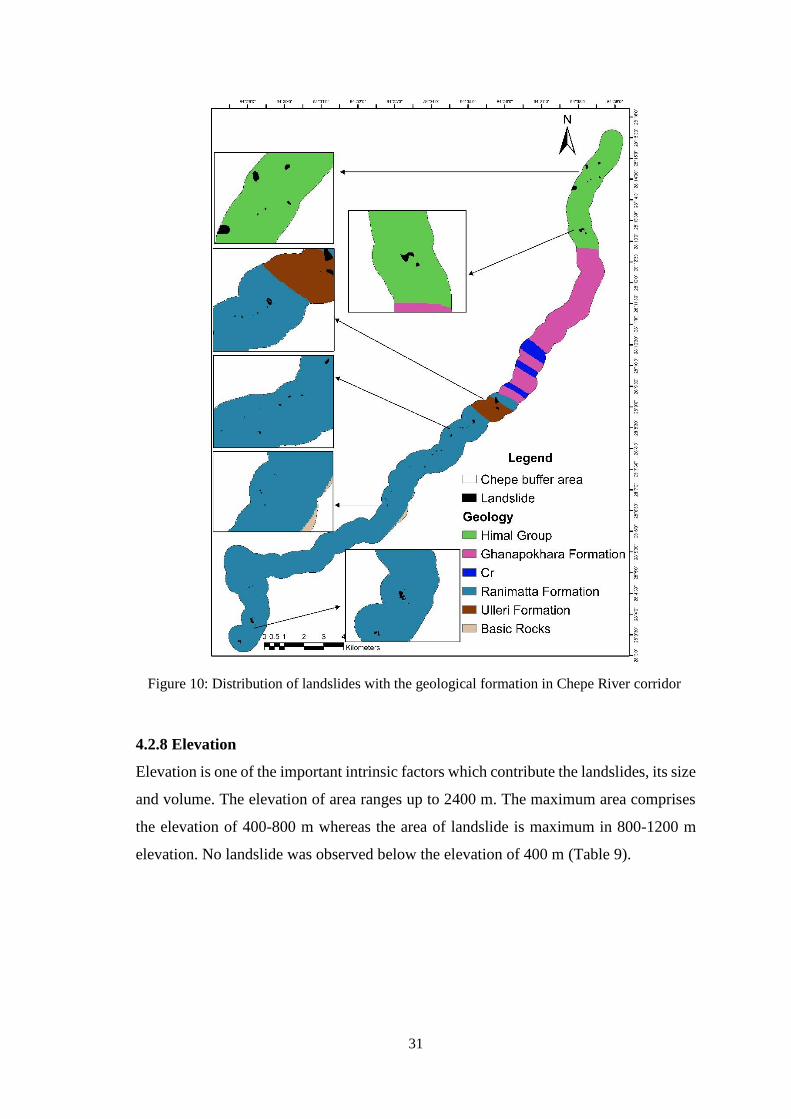
Figure 10: Distribution of landslides with the geological formation in Chepe River corridor .. 31
Figure 11: Distribution of landslides with the different elevation in Chepe River corridor ...... 32
Figure 12: Distribution of landslides with the drainage density in the Chepe River corridor .... 34
Figure 13: Distribution of landslides with the land use in the Chepe River corridor ................. 35
Figure 14: Distribution of landslides with the rainfall in the Chepe River corridor .................. 37
Figure 15: Percentage cumulative of landslide with their corresponding hazard index............. 39
Figure 16: Landslide hazard map prepared by Statistical Index Model ..................................... 40
Figure 17: Probability value for each triggering factors of landslide......................................... 42
Figure 18: Percentage cumulative of landslide with the hazard index ....................................... 43
Figure 19: Landslide hazard map prepared by Logistic Regression Model ............................... 44
Figure 20: ROC for Statistical Index Model .............................................................................. 45
Figure 21: ROC for Logistic Regression Model ........................................................................ 46
Figure 22: Vulnerable wards in the Chepe River corridor ......................................................... 48
Figure 23: Ward-wise landslide vulnerability in the Chepe River corridor ............................... 49
Figure 24: Area covered by each risk level in the study area .................................................... 50
Figure 25: Spatial distribution of landslide risk areas in Chepe River corridor ......................... 50

xii
LIST OF PHOTOGRAPHS
Photograph 1: View of Chepe River ........................................................................... XXI
Photograph 2: Study of landslide in the river corridor ............................................... XXI
Photograph 3: Landslide in the study area .................................................................. XXI
Photograph 4: Landslide in the study area .................................................................. XXI
Photograph 5: Questionnaire with the local residents................................................. XXI
Photograph 6: Questionnaire with the local residents................................................. XXI
Photograph 7: KII with Mr. Ramesh Neupane (Ward Chairperson, Rainas-1) .......... XXI
Photograph 8: Created gully resulting the landslide (Rainas, Lamjung) .................... XXI
Photograph 9: Rainas Irrigation Canal ........................................................................ XXI
Photograph 10: Unmanaged road construction causing downfall of the slope area ... XXI
Photograph 11: Gabion wall as control measure of landslide ..................................... XXI
Photograph 12: Landslide caused due to the river cut-off .......................................... XXI

xiii
ACRONYMS AND ABBREVIATIONS
ADPC Asian Disaster Preparedness Center
AKDN Aga Khan Development Network
AUC Area Under Curve
DEM Digital Elevation Model
DHM Department of Hydrology and Meteorology
GEE Google Earth Engine
Arc GIS Aeronautical Reconnaissance Coverage
Geographical Information System
GoN Government of Nepal
GPS Global Positioning System
HI-AWARE Himalayan Adaptation, Water and Resilience
HRRP Housing Recovery and Reconstruction Platform
ICIMOD International Centre for Integrated Mountain
Development
ILC Irrigation Line of Credit
ILO International Labor Organization
IRDR Integrated Research on Disaster Risk Programme
Kml Keyhole Markup Language
LDCRP Local Disaster and Climate Resilience Planning
LHI Landslide Hazard Index
LHMs Landslide Hazard Models
LSMs Landslide Susceptibility Models
MoFE Ministry of Forest and Environment
MoHA Ministry of Home Affairs

xiv
MoLRM Ministry of Land Reform and Management
NARC National Agriculture Research Centre
ROC Receiver Operating Characteristic
SRTM Shuttle Radar Topography Mission
UNISDR United Nations International Strategy for Disaster
Reduction
VA Vulnerability Assessment
VDC Village Development Committee
WB World Bank

1
CHAPTER 1: INTRODUCTION
1.1 Background
Nepal’s varied topography makes it susceptible to climate-related disasters and it
experiences a range of natural hazards, some of which occur yearly e.g., floods and
landslides whereas others occur less frequently (earthquakes) (UNDP, 2009). Disasters
triggered by natural hazards cause heavy loss of lives, properties and also the
unparalleled threat to sustainable development. Nepal ranks 23rd in terms of total natural
hazard related deaths globally for the year 1988-2007 with more than 7000 deaths
(Baruwal, 2014). Nepal ranks 11th in the world in terms of vulnerability to earthquakes
and 30th in terms of water-induced hazards such as flood and landslides (UNDP, 2009)
and the country falls in the top 20th list of the most multi-hazard prone countries in the
world (Dangal, 2011). The effects of climate change and extremes have further
aggravated the disaster vulnerability in Nepal. In this way, Nepal is one of the most
disaster-prone countries in the world. Despite of some good practices and disaster risk
reduction (DRR) initiatives, the frequency and intensity of disasters are observed to be
in increasing trend. MoHA and DpNet-Nepal (2015) stated that the various studies and
reports over the last 33 years have shown that each year, floods, landslides, fires,
avalanches and epidemics kill hundreds of people and destroy property worth billions of
rupees and the extreme weather events associated with heavy rainfalls are the principal
cause of cascading natural disasters in Nepal.
Landslides are recognized as the third type of natural disaster in terms of worldwide
importance. Most of the damages and a considerable proportion of the human losses
associated with earthquakes and meteorological events are caused by landslides
(Guzzetti et al., 1999). Due to the unique combination of active tectonic setting, high
rates of weathering and abundant rainfall, human interference in the form of rapid
urbanization and infrastructure development, it is considered to be a major natural hazard
in Nepal. Landslides in Nepal are the country’s costliest and deadliest type of natural
disaster, but their management is still seen as low priority (IRIN, 2013). Landslide
susceptibility, vulnerability and risk maps are vital for disaster management and for
planning development activities in the mountainous country like Nepal. The new tools
like remote sensing and GIS will help to improve the quality of landslide maps, with
positive effects on all derivative products and analyses, including erosion studies and

2
landscape modeling, susceptibility and hazard assessments, and risk evaluation
(Guzzetti, 2012).
Landslide hazard zonation techniques can be subdivided into direct and indirect methods.
The direct mapping of the geomorphologies is based on the experience and knowledge
of terrain conditions determining the degree of susceptibility directly whereas in the case
of indirect mapping, it basically uses either statistical models or deterministic models to
predict landslide prone areas, based on information obtained from the interrelations
between landslide conditioning factors and the landslides distribution (Khanh, 2009).
GIS is appropriate for indirect susceptibility mapping, in which all possible landslide
contributing terrain factors are combined with landslide inventory map, using data-
integration techniques (Chung et al., 1995). Modeling is important method for the
studying of many aspects of physical geography which allows the use of mathematical
expressions to represent the behavior of particular geographical systems. Available
information and basic knowledge of landslides have been applied in the process of model
creation and defining of places with the highest landslide risk and all the created models
are very powerful tools for describing and assess not only landslides but natural
phenomena as well (Vozenilek, 2000).
Risk assessment is the final goal of many landslide investigations which lays at the fuzzy
boundary between science, technology, economy and politics, including planning and
policy making. The assessment of landslide risk is a complex and uncertain operation
which requires the combination of different techniques, methods and tools, and the
interplay of various expertise such as geology and geomorphology, engineering and
environmental sciences, meteorology, climatology, mathematics, information
technology, economics, social sciences and history. Though there is the indisputable
importance of landslide risk evaluation for decision making, comparatively very less
efforts have been made to establish and systematically test methods for landslide risk
assessment and as well as to determine their advantages and limitations (Guzzetti, 2012).
The study in Chure area also recommended that the area identified as the most
susceptible for landslides should be given first priority for the prevention and mitigation
measure through structural and nonstructural interventions (CDES, 2014).

3
1.2 Rationale
MoFE (2010) stated that the overall vulnerability of Lamjung district is very high with
the index ranging from 0.100 to 0.787. The district is considered highly vulnerable to
landslide, rainfall, temperature and glacial lake outburst flood (GLOF). Landslide
occurrence was noted highest in the year 2001 when it occurred 17 times and comprised
16% of total human death, 6% of houses destruction and 4 % were affected. During 2001
to 2011, landslide is calculated as the most vulnerable cause causing the loss of life and
property (DCEP, 2014). Similarly, Gorkha is also the another district which is prone to
landslides and the earthquake of 25th April, 2015 and its aftershocks triggered many new
landslides, often in locations not previously affected (Shrestha et al., 2016). The varieties
of hazards have been increased and especially landslide is calculated as the most
vulnerable cause in case of Nepal. The major purpose of this study is to assess the
landslide hazard and risk along the Chepe river corridor touching the boundary of
Lamjung and Gorkha district. Since this area is unexplored in term of landslide risk
assessments, this study will provide the information about the landslide hazard,
vulnerability and risk area along the river corridor. Landslide causing the loss of life and
property is not new in the history of Nepal. The study of landslide in the river corridor
should not be underestimated as it can cause a huge destruction. The major motive of
doing this study is to observe the number and condition of landslide and assessing the
causative factors. This study will contribute towards the methodological approach of
landslide risk assessment in similar river corridor as well. Additionally, this study will
identify the landslide risk which can be helpful in mitigating the impact of landslide
towards life, property and development within Chepe River corridor.
1.3 Research Questions
i. What are the characteristics (type and number) of landslide in the Chepe River
corridor?
ii. What are the significant triggering factors of landslide in the river corridor?
iii. Which is the relevant model for the hazard assessment of landslide in the river
corridor?
iv. What is the risk associated with the landslides in this river corridor?

4
1.4 Objectives
General Objective
To assess the landslide hazard, vulnerability and risk along the Chepe River corridor.
Specific Objectives
i. To prepare the inventory of landslides with their spatial distribution in Chepe
River corridor.
ii. To assess the significant factors responsible for the landslide along the
corridor.
iii. To validate and compare Landslide Hazard Index models.
iv. To analyze hazard, vulnerability and risk of the river corridor.
1.5 Limitations
i. The factors like soil type, soil depth, vegetation density, stream power index etc.
that trigger the landslide aren’t considered in this study due to the time constrain.
ii. Crack version of Arc GIS 10.2 is used.

5
CHAPTER 2: LITERATURE REVIEW
Nepal is exposed to a variety of natural hazards and human induced disasters. More than
80 percent of the total population of Nepal is at risk of natural hazards such as floods,
landslides, windstorms, hailstorms, fires, earthquakes and Glacial Lake Outburst Floods
(GLOFs) (MoHA & DpNet-Nepal, 2017). A massive landslide took place in Jure,
Sindhupalchowk district during 2014 which killed 33 people, 123 people have been
missing and 478 families were affected from that unfortunate event. In the year 2014,
about 113 people died in the whole country due to landslides (MoHA & DpNet-Nepal,
2015). The Hill region, including the Siwaliks (or the Churia Range) experiences regular
landslides, debris flow along creeks and steep slopes, flooding in the lower stages of
river terraces and erosion of river banks during the monsoon (ISDR, 2009). According
to the study by Bhattarai et al. (2002), a total of about 12,000 small and large-scale
landslides occur in Nepal every year, most of which often remain unnoticed and
unreported mainly because of an inadequate information system, little economic impact,
or little harm to humans and national infrastructure. Several scientific studies have
reported the basics of landslide mechanisms and processes in the Nepal Himalaya (Dhital
et al., 1991; Yagi & Nakamura, 1995; Dahal & Hasegawa, 2008; Dahal et al., 2008;
Poudyal et al., 2010; Ghimire et al., 2011).
Landslide susceptibility maps (LSMs) are the likelihood of a landslide occurring in an
area on the basis of local terrain conditions which is vital for disaster management and
for planning development activities in the mountainous country like Nepal (Brabb,
1993). Hazard assessment is the process of studying nature/manmade hazards
determining its essential features (ADPC, 2016). Various factors are responsible for the
occurrence of the landslide. Slope is the measure of an angle between a location in the
ground surface and the horizon (Ohlmacher, 2006) which is the important factors that
control the amount of material available for landslides, size and resultant landslides
(Chen et al., 2015). Aspect is defined as the direction of the slope and in some cases of
landslide cases, researchers have agreed that the slope aspect is one of the main reasons
for the occurrences of landslides (Tian et al., 2010). Plan curvature controls the
convergence or divergence of landslide material and water in the direction of landslide
motion (Carson & Kirk, 1972). Profile curvature is the curvature in the downslope
direction along a line formed by the intersection of an imaginary vertical plane with the

6
ground surface (Ohlamacher, 2007). Profile curvature affects the driving and resisting
stresses within a landslide in the direction of motion (Meten et al., 2015). Altitude is also
a significant landslide conditioning factor because it is controlled by several geologic
and geomorphological processes (Gritzner et al., 2001; Dai & Lee, 2002; Ayalew et al.,
2005; Pourghasemi, 2008). The vegetation covers or land use characteristics are
important for the stability of slopes, and considered vegetation cover to assess the
conditioning factors of landslides (Ocakoglu et al., 2002). A road constructed results an
increase in stress on the back of the slope, because of changes in topography and decrease
of load on toe, some tension cracks may develop (Pourghasemi et al., 2012).
There are dozens of numerical models that were devised for the zoning of the relative
risk of the slope instability with weight, rate, computational logic and different scale
agents and modified in a variety of conditions based on land evidences (Sakar &
Kanungo, 1995). According to Van Westen et al. (1994) the bivariate methods are a
modified form of the qualitative map combined with the exception that weights are
assigned based upon statistical relationships between past landslides and various factor
maps and along with this these statistics can be used to develop decision rules. Individual
factor maps (independent variables) or combinations of factor maps (e.g. unique
condition units) are overlaid with a landslide map (dependent variable) to develop cross
tabulations for each factor and subclass. Similarly, the multivariate methods have been
used for slope instability zonation where the techniques used are: multiple linear
regression analysis (Carrara, 1983), discriminate analysis (Carrara, 1983; Guzzetti et al.,
2005), and logistic regression analysis (Dai et al., 2001; Suzen & Doyuran, 2004; Lee et
al., 2004). Multivariate analysis is based on the presence or absence of stability
phenomena within the units (Van Westen, 1993). Logistic regression and discriminant
analysis are the most frequently used models (Brenning, 2005) and have been developed
using the geographic information system (GIS) for landslide susceptibility mapping (Lee
et al., 2010). The multivariate logistic regression approach (Yesilnacar & Topal, 2005;
Lee & Pradhan, 2007; Nandi & Shakoor, 2009; Yilmaz, 2010; Oh & Lee, 2010;
Felicisimo et al., 2013, Akgun, 2012) and bivariate (Bednarik et al. 2010; Pradhan &
Lee, 2010; Pourghasemi et al. 2013) were used by various researchers worldwide for the
landslide susceptibility mapping.
In the study of landslide hazard assessment between Besi Sahar and Tal area in
Marsyangdi River Basin, West Nepal, it was found that the high hazard zone was lying

7
along the Marsyangdi River and its tributaries where logistic regression was applied
(Acharya & Pathak, 2017). Statistical Index Model (SIM) is a bivariate statistical
analysis introduced by Van Westen (1997) for landslide susceptibility analysis. A weight
value for a parameter class (e.g., a certain lithological unit or a certain slope class) is
defined as the natural logarithm of the landslide density in the class divided by the
landslide density in the entire map. SIM are generally considered the most appropriate
method for landslide susceptibility mapping at regional scales because they are objective,
reproducible and easily updatable (He & Beighley, 2008). The LSI model is a data-driven
bivariate statistical approach in which each parameter is analyzed individually and the
calculation and application are easy and fast (Suzen & Doyuran, 2004). For the validation
of models, many recent studies (Nandi & Shakoor, 2010; Akgun, 2012; Pourghasemi et
al., 2012; Zare et al., 2012; Pourghasemi et al., 2013; Conforti et al., 2014; Youssef et
al., 2016; Wang et al., 2017) have utilized ROC curve to demonstrate and compare the
reliability of their created LSMs.
Vulnerability refers to the conditions, as determined by physical, social, economic and
environmental factors or processes, which make a community susceptible to the impact
of hazards (UNISDR, 2004). For the United Nations, the term "vulnerability" refers to
the conditions which make a community susceptible to the impact of hazards, the
conditions being determined by physical, social, economic and environmental factors or
processes (UNISDR, 2009). Vulnerability is a fundamental component in the evaluation
of landslide risk (Leone et al., 1996) and in the present context, it can be defined as the
level of potential damage, or degree of loss, of a given element (expressed on a scale of
0 to 1) subjected to a landslide of a given intensity (Fell, 1994; Leone et al., 1996; Wong
et al., 1997). Vulnerability assessment (VA) serve various purposes such as to identify
the impacts and prioritizing adaptation options in the initial planning phase. Birkmann
(2007) also studied about the risk and vulnerability indicators at different scales:
applicability, usefulness and policy implications which was basically focused on four
attempts to measure risk and vulnerability by applying indicators. All the approaches
presented in his paper were based on a common theory that disaster risk is a product of
three major elements i.e. exposure to hazards, the frequency or severity of hazard and
vulnerability. Therefore, in actual landslide risk assessment, the most common method
is to set the landslide vulnerability of different elements at risk to a constant 1, that is, to
believe that the elements at risk will be completely damaged and lost, or to assign the

8
vulnerability on the basis of expert knowledge and experience (Van Westen et al., 2009).
There are several scholars that had studied the vulnerability of building, road, and land
use to landslide by the methods of vulnerability curve, vulnerability matrix, and
vulnerability indicators (Silva & Pereira, 2014; Quan Luna et al., 2011; Galli & Guzzetti,
2007). Societal vulnerability is related to factors such as demographics, preparedness
levels, memory of past events, and institutional and non-institutional capacity for
handling natural hazards which can be quantified by means of questionnaire, poverty
level, literacy rate and decentralization (UNISDR, 2009). The physical dimension of
vulnerability links extreme physical or natural phenomenon with a vulnerable human
group (Westgate & O’Keefe, 1976). It is important to find out how different kinds of
natural environment cope with and recover from different hazards (TU-CDES & UNDP,
2014).
Vulnerability Assessment describes who and what is exposed to threat (hazard
identification), and the differential susceptibility and impacts of the exposure. In other
word, it doesn’t only identify the risk factors (who and what is vulnerable) but also the
driving forces that shape vulnerability in a particular place (Birkmann, 2006). According
to Glade (2003), although vulnerability estimation is an important part within in
landslide assessment, a literature review demonstrates a lack of vulnerability studies in
landslide risk research with regard to both social and natural science approaches.
Landslide vulnerability assessment is still considered a difficult process because of its
dependency on several factors like landslide type and the way its impact may generate
different degree of impacts. Douglas (2007) explained why vulnerability should not be
modelled while Van Western et al. (2006) explained why it is too difficult to model. At
present, there is no uniform methodology to quantitatively assess the vulnerability of
various elements at risk to different types and magnitudes of landslides (Glade &
Crozier, 2005).
The elements at risk are the population, property, economic activities, including public
services, or any other defined entities exposed to hazards in a given area (UNISDR,
2004). Risk analysis uses available information to estimate the risk to individuals,
population, property or the environment from hazards which generally contains the
following steps like hazard identification, hazard assessment, inventory of elements at
risk and exposure, vulnerability assessment and risk estimation. Since all of these steps
have an important spatial component, risk analysis often requires the management of a

9
set of spatial data and the use of geographic information systems. Risk evaluation is the
stage at which values and judgments enter the decision process, explicitly or implicitly,
including considerations of the importance of the estimated risks and the associated
social, environmental, and economic consequences, in order to identify a range of
alternatives for managing the risks (Corominas et al., 2014). Multiple risk can be defined
as the risk to more than one specific element from a single specific hazardous factor
affecting landslide, or the risk to one specific element from more than one specific
hazardous factors affecting the landslide. Multiple partial risk, multiple specific risk, and
multiple specific value risk can also be estimated by applying standard probability
concepts (Vandine et al., 2004). The devastating earthquake of 25th April, 2015 A.D. and
aftershocks have increased the exposure of the humans and resources towards the
vulnerable situation. Therefore, only guided activities are allowed to be operated and the
responsibility of probabilities of newly created hazards among natural disasters should
be taken into account in such hazard prone or vulnerable areas of natural disasters
(MoLRM, 2015). The major objective of Land Use Policy (2015) is to ensure the
hygienic, beautiful, well-facilitated and safe human settlement, sustainable and planned
urbanization of the country as well as to maintain a balance between physical
infrastructure development and environment (MoLRM, 2015).

10
CHAPTER 3: MATERIALS AND METHODS
3.1 Study Area
The study area is the Chepe River, which lies in the border between the Gorkha and
Lamjung districts. The river originates from the Dudhpokhari at an elevation of about
5300 m. The name of Chepe river is historically linked to Nepal’s politics and the
formation of the nation state, which offer a rich context for the study of institutional
responses to landslides. In the 18th century and before, it was a political boundary
between the two princely states-Rainaskot in the west and Ligligkot in the east. The size
of the river thus acts more as a symbolic divider of the boundary and at the same time, a
connector among communities on either side. It has the total catchment area of 308 km2
at the confluence of Marshyangdi River. The total area of the river corridor taken for the
study is 47.301 km2 considering the buffer of 1km along the river. There are five
precipitation stations around Chepe river catchment with only one station inside the
catchment. The terrain is very rugged, precipitation distribution pattern seems to be very
much influenced by the spotty convective activities, so the pattern from one station to
the other nearby station is also different and complex (Pokhrel, 2003). The Chepe river
corridor touches five municipalities i.e. two from Lamjung district (Rainas and
Dudhpokhari) and three from Gorkha district (Palungtar, Siranchowk and Ajirkot).

11
3.2 Data Collection
3.2.1 Field work
The fieldwork (15th-27th Jan, 2018) was carried out for the mapping of landslide and
infrastructures with the help of Global Positioning System (GPS). Along with landslides
location their few features and characteristics were also studied. After field visit, the GPS
locations that were recorded in the field were entered in the google earth image for the
landslide verification and inventory map preparation. The Keyhole Markup Language
(kml) file was then imported to Arc GIS 10.2 for the preparation of inventory and factor
maps. For the vulnerability assessment the field work was carried out from 5th -13th June,
2018.
3.2.2 Software used for data analysis
Arc GIS 10.2
R studio
JMP (pronounced as jump) software (Trial version)
Google Earth Engine (GEE)
Figure 1: Location of study area showing Chepe River corridor
- (Source: Data from Department of Survey)

12
Table 1: Different landslide triggering factors and it’s sources
S.N Factors Source
1 Slope Extracted from the DEM (SRTM 1 Arc-Second Global) of
cell size 30 m x 30 m
2 Distance to Road Open street map further cleaned by the World Bank Group
and stored in the raster format of cell size of 30 m x 30 m
3 Geology Extracted from geological survey department and stored in
ArcGIS in raster format of cell size 30 m x 30 m
4 Land use Manual digitization using base map in Arc GIS and
validating using Google Earth Engine (GEE)
5 Rainfall Extracted data from DHM from the year 1987-2016 from 8
meteorological stations which were neighboring station to
study area
6 Elevation SRTM 1 Arc-Second Global of cell size 30 m x 30 m
7 Plan curvature Extracted from the DEM and stored in the raster format of
cell size of 30 m x 30 m
8 Relief Extracted from the DEM and stored in the raster format of
cell size of 30 m x 30 m
9 Profile curvature Extracted from the DEM and stored in the raster format of
cell size of 30 m x 30 m
10 Drainage density Extracted from DEM; stream feature and stored in the raster
format of cell size 30 m x 30 m
11 Aspect Extracted from the DEM and stored in the raster format of
cell size of 30 m x 30 m
3.3 Landslide modelling
Total landslides were divided into training data (70%) and validation data (30%) using
random selection in Arc GIS, in which training data were used for running the model
and rest 30% were used for the model comparison and validation purpose (Dou et al.,
2015; Kalantar et al., 2018; Fayez et al., 2018).
3.3.1 Remote sensing and GIS based landslide inventory by Bivariate Analysis
Landslide were identified by visual inspection and expert suggestion. Google earth and
GIS were used for the preparation of landslide inventory map of Chepe river corridor.

13
It is based on assumption that causative factors of landslide can be quantified by
calculating areas of each class. The model calculation and map preparation is done by
using Arc GIS 10.2 and hazard class is differentiated into 4 classes by using R studio.
Statistical-Index Model (Van Westen, 1997)
Wij = ln (fij/f) = ln ((A*ij/Aij) x (A/A*)) = ln ((Aij*/A*) x (A/Aij)
Where,
Wij = weight given to class I of parameter j
Fij = landslide density within class I of parameter j
F = Landslide density within entire map
Aij* = area of landslide in class I of parameter J
Aij = area of a class I of parameter j
Base map Factor map
Data Input
Landslide
Distribution Map
Cross operation
Aspect
Slope
Elevation
Land use
Drainage Density
Rainfall
Geological
Distance to road
Profile Curvature
Plane Curvature
Relief
Cross tabulation
Table calculation
Weight map
Final weight= sum of
weight map
Slicing operation
Hazard class
Low
Medium
High
Very High
Hazard validation
Landslide hazard map
Figure 2: Flow Chart of Landslide Hazard Map Preparation by Statistical Index Model

14
A* = totalarea of landslide in entire map
A = total area of entire map
Landslide Hazard Index (LHI)
LHI= ∑ 𝑾𝒊𝒋𝒏𝒋=𝟏
Where,
Wij = weight of class i of parameter j
n = number of parameter
Drainage Density
The drainage distance map was prepared by using the stream feature and line
density tool in Arc GIS. The drainage density i.e.
Drainage Density = 𝑇𝑜𝑡𝑎𝑙 𝑙𝑒𝑛𝑔𝑡ℎ 𝑜𝑓 𝑠𝑡𝑟𝑒𝑎𝑚
𝑇𝑜𝑡𝑎𝑙 𝑎𝑟𝑒𝑎 𝑜𝑓 𝑠𝑡𝑢𝑑𝑦𝑎𝑟𝑒𝑎
3.3.2 Multivariate Analysis Model
Logistic regression model (Cox, 1958)
Considering p independent variables, x1, x2, ... , xp, affecting landslide occurrences,
we define the vector X = (x1, x2, ... , xp). In this study, the independent variables
will be with values of 1 (presence) or 0 (absence).
The conditional probability that a landslide occurs is represented by
P (y = 1/X).
The logit of the multiple logistic regression model (Hosmer & Lemeshow, 2000)
is:
Logit (y) = b0 + b1x1 + b2x2 + ……+ bpxp
where b0 is the constant of the equation, and b1, b2, ... ,bp are the coefficients
of variables x1, x2, ... , xp.
The probability P(y = 1/X) can be expressed in the logistic regression model:
P(y = 1/X) = 1
1 + e – (b0 + b
1x1
+ b2
x2
+ ……+ bp
xp
)
Where, ‘e’ is the constant 2.718.
Higher the value of coefficient, higher will be the weightage.

15
For hazard mapping, both the model was used and lastly, the model that gave the accurate
result was considered for the risk assessment.
3.3.3 Landslide Hazard Index Classification (Lee & Pradhan, 2007)
For the differentiation of different hazardous class, hazard index classification was done
using R studio. Both the landslide and non-landslide points are taken for the landslide
hazard index classification. The hazard index having 25% of landslide was classified as
low hazard, 25%-50% as medium hazard, 50%-75% as high hazard, and 75%-100% as
very high hazard. By this method both the percentage cumulative of landslide
distribution and hazard index were used for the classification purpose of hazard index
class. Both landslide and non-landslide points are considered for the preparation of %
cumulative of landslide versus hazard index graph from which the differentiation of low,
medium, high and very high hazardous area was done.
3.3.4 ROC index (Pontius & Schneider, 2001)
It is very important to check the efficiency or the validation of the landslide hazard model
and similarly ROC (relative operating characteristic) index has been used in this study
for the validation. ROC curve is a diagram in which the pixel ratio that correctly predicts
the occurrence or nonoccurrence of landslides (True Positive) is plotted against the
supplement amount that is the pixel ratio that is wrongly predicted. The hazard model
computes the change in likelihood in each pixel in a continuous range of zero and one.
By determining a threshold (e.g. 0.5) the model's output can be converted to a discrete
scale of zero and one e.g. the pixels, in which that the change likelihood is more than
their threshold, it takes the value 1 and pixels in which the change likelihood is less than
their threshold, it takes the value 0. After this the output is presented as a map. By
comparing this with the landslide inventory, the pixel ratio can be plotted in ROC
diagram. The ROC index equals to the area under the curve (Pontius & Schneider, 2001).
In ROC curve, the sensitivity of model (the percentage of existing land-
slide pixels correctly predicted by the model) is plotted against the 1-specificity (the
percentage of predicted landslide pixels over the total study area).
The quality of the probabilistic model to reliably predict of the occurrence or non-
occurrence of landslides is predicted by the area under the curve of ROC. A good fit
model has AUC values that range from 0.5 to 1, while values below 0.5 represent a
16
random fit (Youssef et al., 2016). The ROC of Statistical Index Model and Logistic
Regression Model using 30% (18) of landslides were obtained to check the accuracy and
reliability of the model.
3.4 Vulnerability Assessment
For the vulnerability assessment, four major factors i.e. physical, social, environmental
and economic were considered (UNISDR, 2009). Exposure and susceptibility along with
the adaptive capacity were included in this vulnerability assessment. Data were collected
on the basis of 18 Key Informant Interview (KII) (1 in each ward), 5 FGDs (1 in each
municipality), 36 schedule surveys (2 in each ward) and the data published in their
reports. Local Disaster and Climate Resilience Planning Guideline (LDCRP) by GoN
(2017) was followed for the vulnerability assessment. The indicators taken for the
vulnerability analysis and score which incorporates environmental, social, physical and
economic factors prescribed by LDCRP guideline are as follows:
Death
Impacted households
Damaged houses
Economic loss
Impacted agricultural and forest area
Social impact
Possible impact of landslide
Trends of landslide occurrence
Change is seasonal calendar
Change in temperature
Access to source
Population analysis
Education, awareness, skills
Organizational help
3.5 Risk Assessment
By overlaying hazard and vulnerability map, the risk map was prepared where the area
with very high, high, medium and low risk was separated. Risk map is the product of

17
hazard and vulnerability (UNISDR, 2004) and the risk map was prepared incorporating
both the hazard as well as vulnerability of the study area.
Risk = Hazard x Vulnerability
3.6 Standardized map
The hazard, vulnerability and risk map formed was then standardized from 0 to 1. For
standardization, minimum-maximum standardization method (Briguglio et al., 2009)
was used.
Standardized map = (𝑃𝑟𝑒𝑝𝑎𝑟𝑒𝑑 𝑚𝑎𝑝−𝑀𝑎𝑥𝑖𝑚𝑢𝑚 𝑣𝑎𝑙𝑢𝑒)
(𝑀𝑎𝑥𝑖𝑚𝑢𝑚 𝑣𝑎𝑙𝑢𝑒−𝑀𝑖𝑛𝑖𝑚𝑢𝑚 𝑣𝑎𝑙𝑢𝑒)

18
CHAPTER 4: RESULTS
4.1 Landslide Inventory Map
A total of 73 landslides were observed during field visit and inspection of the Google
Earth. The landslides with the area ranging from 3.87 m2 to 30600.79 m2 are
heterogeneously distributed over the area. Some landslides are located near the
confluence with Marshyangdi River, some on the middle section of river and some close
to the river source. The 70% (55) of total landslides were used as training data for the
analysis purpose and remaining 30% (18) of landslides were used as validation data for
validation purpose (Figure 3).
Figure 3: Landslide inventory map showing the distribution of landslides in the Chepe River corridor

19
4.2 Factor maps for Bivariate Statistical Index Model
The landslide triggering factors used in this study include slope, elevation, geology, land
use, aspect, plan and profile curvatures, distance to road, line density and relief as
intrinsic factors of the landslides and rainfall was taken as extrinsic factors that trigger
landslide.
4.2.1 Slope
Slope were divided into seven different classes ranges from <10°, 10-20°, 20-30°, 30-
40°, 40-50°, 50-60°, 60-70° respectively. Most of the landslide in the study area falls
into the classes 40-50°. Whereas the slope class of 30-40°, 40-50°, 50-60° and 60-70°
have the positive weightage value (Table 2).
Table 2: Weightage values of each slope class in Chepe River corridor
Value Slope
(Degree)
Area of Slope
(m2)
Area of
Landslide (m2)
Weightage
(Wij)
1 <10 11766600 6300 -1.736
2 10-20 14140800 27000 -0.4645
3 20-30 11758500 27900 -0.2472
4 30-40 6904800 30600 0.3775
5 40-50 2431800 36000 1.5836
6 50-60 367200 13500 2.4933
7 60-70 27000 2700 3.4939
Total 47396700 144000 5.5006

20
4.2.2 Aspect
Aspect class was classified into nine different classes: Flat, North, Northeast, East,
Southeast, South, Southwest, West and Northwest. The most of the study area lies in
Southeast and west aspect, whereas most of the landslides lies in southeast aspect
covering relatively large area (Table 3). Positive weightage values were found in
northeast, southeast and south, whereas negative weightage value were found in north,
east, southwest, west and northwest.
Figure 4: Distribution of landslides in the different slopes of Chepe River corridor

21
Table 3: Weightage values of each aspect in Chepe River corridor
Value Aspect Area of Aspect (m2) Area of
Landslide (m2)
Weightage
(Wij)
1 Flat 42300 0 0
2 North 5288400 1800 -2.189
3 Northeast 3159000 10800 0.118
4 East 5742900 15300 -0.1314
5 Southeast 7514100 56700 0.9097
6 South 6327900 35100 0.602
7 Southwest 5180400 11700 -0.2965
8 West 7363800 9000 -0.9106
9 Northwest 6777900 3600 -1.744
Total - 3.6418

22
4.2.3 Distance to road
By using the Euclidean distance, the distance of the road to landslide was calculated.
More landslides were observed in the areas nearer to the road i.e. less than 500 m (Table
4). The total weightage of the road was calculated to be 5.1733 which states that the road
is a very strong triggering factor of the landslide in the Chepe River corridor.
Figure 5: Distribution of landslides in the different aspects of Chepe River corridor

23
Table 4: Weightage values of distance from road in Chepe River corridor
Value Road Distance
(m)
Area of Road
Distance
(m2)
Area of
Landslide
(m2)
Weightage
(Wij)
0 <500 24497100 36000 -0.7372
1 500-1000 5670000 0 0
2 1000-1500 2346300 28800 1.3854
3 1500-2000 1687500 28800 1.7149
4 2000-2500 841500 15300 1.7782
5 2500-3000 522000 4500 1.032
6 3000-3500 522900 0 0
7 3500-4000 522000 0 0
8 4000-4500 310500 0 0
Total 5.1733

24
4.2.4 Relief
The relief is the variation in height of land surface or the local difference in height within
a unit area. Basically, the different reliefs have different climatic conditions. The study
area has the maximum area of landslide in the relief of less than 30 m (Table 5). With
the increase of the variation in the height of the land surface the area of landslide is
decreasing. Lesser the variation greater is the probability of landslide. The sum
weightage of the relief is a positive value which states that the relief is one of the
triggering factor of the landslide in the study area.
Figure 6: Distribution of landslides along the distance from road in the Chepe River corridor

25
Table 5: Weightage values of each relief class in Chepe River corridor
Value Relief
(m)
Area of Relief
(m2)
Area of
Landslide
(m2)
Weightage
(Wij)
1 <30 1302300 35100 2.1544
2 30-60 1706400 18900 1.2651
3 60-90 2795400 17100 0.6714
4 90-120 3913200 23400 0.6487
5 120-150 5305500 14400 -0.1412
6 150-180 9058500 14400 -0.6761
7 180-210 10118700 9900 -1.1615
8 210-240 8546400 5400 -1.5987
9 240-270 1595700 0 0
Total 44342100 138600 1.1621

26
4.2.5 Profile curvature
A hill shade of profile curvature is classified into three categories i.e. convex, concave
and planar. Negative (< -6.8179) indicates that the surface is upwardly convex and
positive (1-7.6562) profile indicates that the surface is upwardly concave. The planar
surface has the value range from -6.8179 to 1 (Table 6). In this study area, hill slope with
planar profile has a greater area covered by landslide followed by concave and convex.
The weightage is positive in concave and convex surface whereas negative in planar
surface.
Figure 7: Distribution of landslides with the relief in the Chepe River corridor

27
Table 6: Weightage values of each category of profile curvature in Chepe River corridor
Value
Profile
Curvature
(Value)
Profile
Curvature
Area of
Profile
Curvature
(m2)
Area of
Landslide
(m2)
Weightage
(Wij)
1 <-6.8179 Convex 6417000 40500 0.7311
2 -6.8179-1 Planar 34599600 60300 -0.5558
3 1-7.6562 Concave 6380100 43200 0.8014
Total 47396700 144000 0.9767

28
4.2.6 Plan curvature
The plan curvature of study area is classified into three categories i.e. concave, planar
and convex. The concave has its range from > -6.8179, planar has its range from -6.8179
to 1 and convex ranges from 1 to 6.8179. Planar surface comprises maximum area of
landslide followed by concave and convex. The positive weightage value is observed in
concave and convex whereas the negative value was observed in planar surface (Table
7).
Figure 8: Distribution of landslides with the profile curvature in Chepe River corridor

29
Table 7: Weightage values of each category of plan curvature in Chepe River corridor
Value
Plan
Curvature
(Value)
Plan
Curvature
Area of
Plan
Curvature
Area of
Landslide
Weightage
(Wij)
1 -6.8179 Concave
3698100 33300 1.0865
2 -6.8179-1 Planar
39724200 82800 -0.3768
3 1-6.8179 Convex
3973500 27900 0.8377
Total
47395800 144000 1.5474
Figure 9: Distribution of landslides with the plan curvature in the Chepe River corridor

30
4.2.7 Geology
Geology of the area is also considered as one of the causative factors for the landslide
hazard analysis. The geology of the study area consists of Himal group, Ghanapokhara
formation, Corallian (Cr), Ranimatta formation, Ulleri formation and Basic rocks. Most
of the study area comprises Ranimatta formation and Ghanapokhara formation. Whereas
most of the area where the landslide has occurred comprises Himal group of geology.
There is no landslide in Ghanapokhara and Corallian (Cr) class of geology (Table 8).
Table 8: Weightage values of each type of geological formation in Chepe River corridor
Value Geology Area of Geology
(m2)
Area of
Landslide
(m2)
Weightage
(Wij)
1 Himal group 7452900 77400 1.2208
2 Ghanapokhara
formation 9406800 0 0
3 Corallian (Cr) 1578600 0 0
4 Ranimatta
formation 27189900 39600 -0.7436
5 Ulleri formation 1512900 27900 1.795
6 Basic rocks 154800 0 0
Total 47295900 144900 2.2722
31
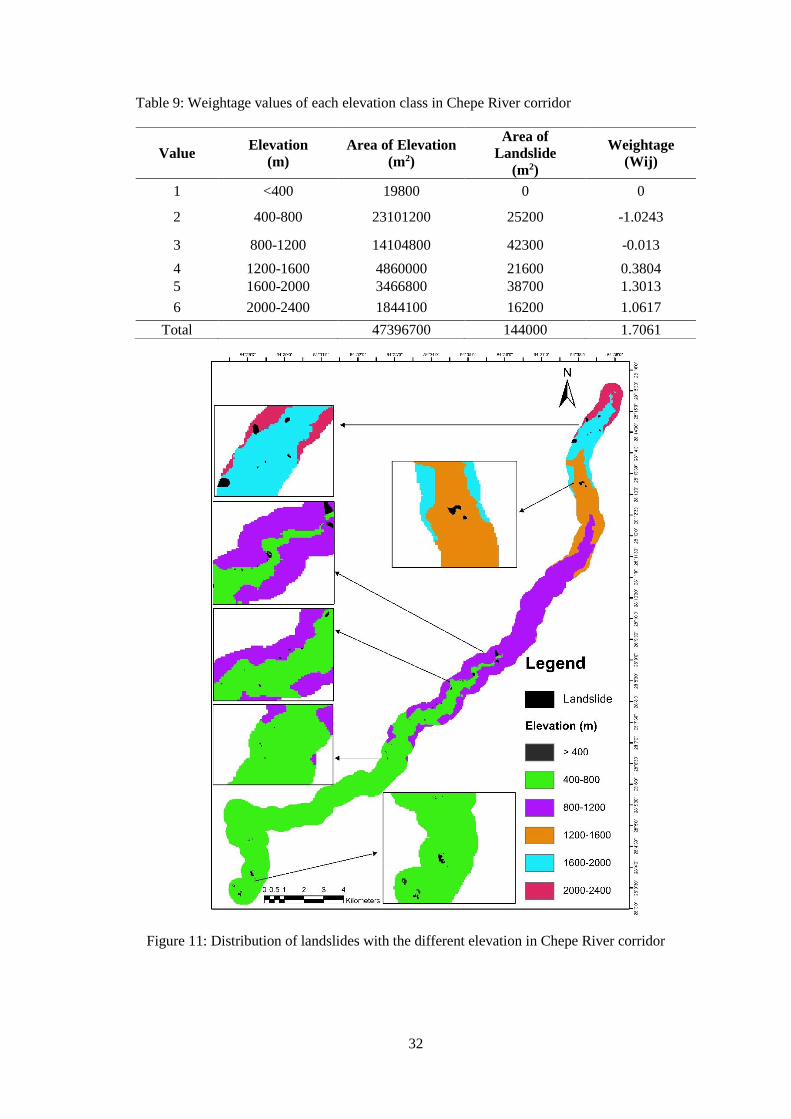
4.2.8 Elevation
Elevation is one of the important intrinsic factors which contribute the landslides, its size
and volume. The elevation of area ranges up to 2400 m. The maximum area comprises
the elevation of 400-800 m whereas the area of landslide is maximum in 800-1200 m
elevation. No landslide was observed below the elevation of 400 m (Table 9).
Figure 10: Distribution of landslides with the geological formation in Chepe River corridor
32
Table 9: Weightage values of each elevation class in Chepe River corridor
Value Elevation
(m)
Area of Elevation
(m2)
Area of
Landslide
(m2)
Weightage
(Wij)
1 <400 19800 0 0
2 400-800 23101200 25200 -1.0243
3 800-1200 14104800 42300 -0.013
4 1200-1600 4860000 21600 0.3804
5 1600-2000 3466800 38700 1.3013
6 2000-2400 1844100 16200 1.0617
Total 47396700 144000 1.7061
Figure 11: Distribution of landslides with the different elevation in Chepe River corridor

33
4.2.9 Drainage density
The drainage density of overall study area is 0.00305 m/m2. The maximum area covered
by the landslide is within the line density of <0.502875 m2 and the sum weightage of line
density is negative i.e. -1.840117.
Table 10: Weightage values of drainage density in Chepe River corridor
Value Line density
(m/m2)
Area of line density
(m2)
Area of landslide
(m2) Weightage (Wij)
1 <0.502879 14864400 77400 0.530398
2 0.502879-0.978691 11997900 36900 0.00386
3 0.978691-1.430713 10513800 15300 -0.74446
4 1.430713-2.073061 7430400 2700 -2.13195
5 2.073061-3.036581 2489400 12600 0.502035
Total -1.840117

34
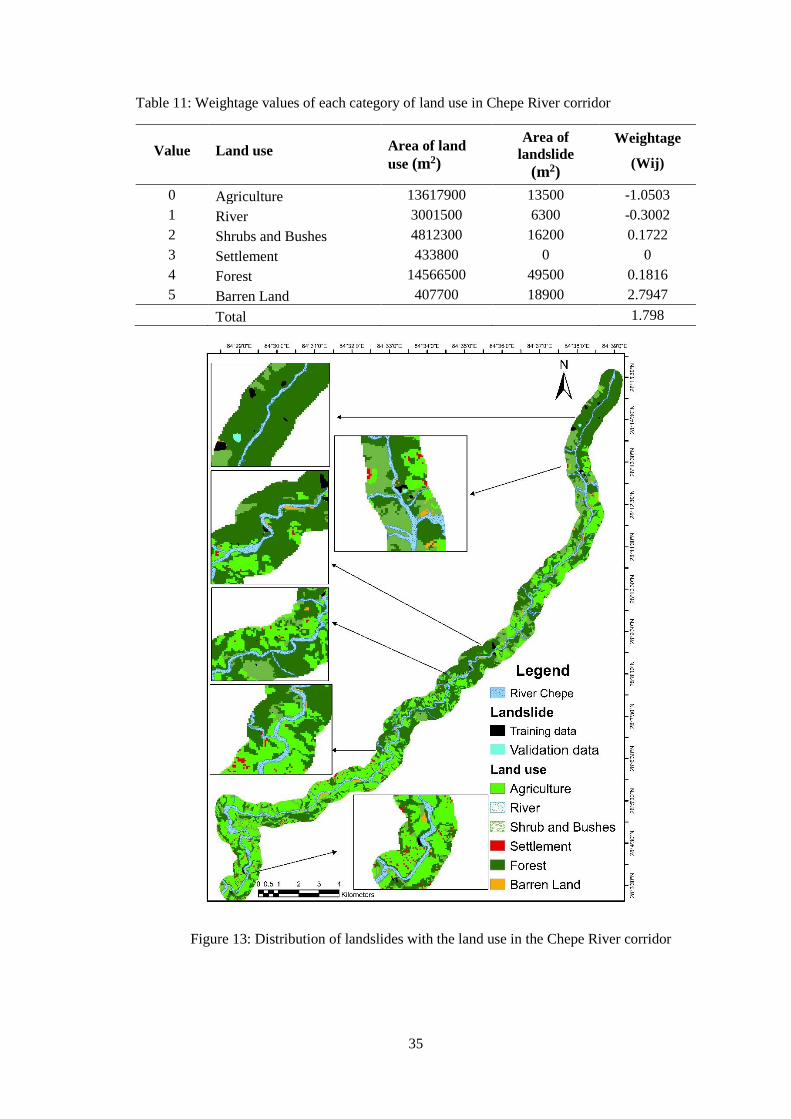
4.2.10 Land use
The land use of the study area is divided into six different classes i.e. agriculture, river,
shrub and bushes, settlement, forest and barren land. The result shows that the area is
mostly covered by forest followed by the agricultural area. Landslide wasn’t found
exactly in the settlement area but few were found very nearer to the settlement area. Most
of the landslides were found to be in the forested areas followed by barren land (Table
11).
Figure 12: Distribution of landslides with the drainage density in the Chepe River corridor
35
Table 11: Weightage values of each category of land use in Chepe River corridor
Value Land use Area of land
use (m2)
Area of
landslide
(m2)
Weightage
(Wij)
0 Agriculture 13617900 13500 -1.0503
1 River 3001500 6300 -0.3002
2 Shrubs and Bushes 4812300 16200 0.1722
3 Settlement 433800 0 0
4 Forest 14566500 49500 0.1816
5 Barren Land 407700 18900 2.7947
Total 1.798
Figure 13: Distribution of landslides with the land use in the Chepe River corridor

36
4.2.11 Rainfall
The rainfall data taken from eight stations (Annex 6) ranges from 2000 mm to 2900 mm.
Rainfall of study area fall into nine classes with the minimum rainfall 2000 mm and the
maximum rainfall about 2900 mm. The landslide is basically found to be occurring in
the area having the rainfall of 2800-2900 mm. With the increasing intensity of rainfall,
the area covered by the landslide is also maximum (Table 12).
Table 12: Weightage values of rainfall in Chepe River corridor
Value Rainfall (mm) Area of rainfall
(m2)
Area of landslide
(m2)
Weightage
(Wij)
0 <2100 213300 0 0
1 2100-2200 2445300 10800 0.4446
2 2200-2300 5112000 0 0
3 2300-2400 5904000 0 0
4 2400-2500 2271600 0 0
5 2500-2600 3672900 5400 -0.6554
6 2600-2700 5031000 30600 0.7646
7 2700-2800 9031500 20700 -0.2114
8 2800-2900 3188700 36900 1.4078
Total 1.7502

37
On the basis of the bivariate model i.e. Statistical Index Model, the major triggering
factor was observed to be slope and distance to road followed by geology, land use,
elevation, plan curvature, relief, profile curvature, drainage distance and aspect (Table
13).
Table 13: Weightage Values for the triggering factors of landslide
S.N Landslide triggering factors Weightage
1. Slope 5.5006
2. Distance to Road 5.1733
3. Geology 2.2722
Figure 14: Distribution of landslides with the rainfall in the Chepe River corridor
38
4. Land use 1.798
5. Rainfall 1.7502
6. Elevation 1.7061
7. Plan curvature 1.5474
8. Relief 1.1621
9. Profile curvature 0.9767
10 Drainage density -1.8401
11. Aspect -3.6418
4.3 Landslide Hazard Index (LHI) for Statistical Index Model
The result from the landslide hazard index classification showed the maximum value of
1 and the minimum value of 0.1 for hazard index value. By this method both the landslide
distribution and hazard index are used for the classification purpose of hazard index
class. The result obtained showed that about 25% of the landslide has the landslide
hazard index below 0.1, about 50% of landslide is in the range of 0.1 to 0.19, about 75%
of landslide is at the range of 0.19 to 0.2 and 100% of landslide are in the range of 0.2 to
1 (Table 14).
Table 14: Landslide Hazard Index Classification
S.N Landslide Hazard Index Hazard class
1. <0.1 Low hazard
2. 0.1-0.19 Medium hazard
3. 0.19-0.2 High hazard
4 0.2-1 Very high hazard

39
Figure 15: Percentage cumulative of landslide with their corresponding hazard index

40
4.3 Multivariate Logistic Regression Model
The multivariate logistic regression was done by using R studio, Arc GIS and JMP i.e.
R studio and JMP for data calculation and formation of equation and Arc GIS for the
preparation of multivariate hazard map. The resultant beta (β) coefficients for each
independent variable in the logistic regression equation are given in Table 15.
Table 15: Coefficient value of factors in Logistic Regression Model
S.N Factors β
1 Slope 0.0967
2 Distance to Road - 0.0028
Figure 16: Landslide hazard map prepared by Statistical Index Model

41
3 Geology
Ghanapokhara formation
Cr
Ranimatta formation
Ulleri formation
-13.5925
-10.4906
11.6915
12.3917
4 Land use
Agriculture
River
Shrubland
Forest
-3.2927
1.079
2.3956
-0.1821
5 Rainfall 0.0092
6 Elevation - 0.0190
7 Plan curvature 1.1295
8 Relief - 0.0335
9 Profile curvature 0.0631
10 Drainage density 2.2773
11 Aspect 0.0069
Using both landslide and non-landslide points, the following equation was obtained from
JMP software.
Z = Float (-20.4030 - 0.0190 x Elevation + 2.2773 x Drainage - 0.0028 x Road + 0.0631
x Profile Curvature + 1.1295 x Plan Curvature - 0.0335 x Relief + 0.0092 x Rainfall +
0.0069 x Aspect + 0.0967 x Slope + Con (“Landuse” == 1, -3.2927, Con (“Landuse” ==
2, 1.079, Con (“Landuse” ==3, 2.3956, Con (“Landuse” ==5, -0.1821, 0)))) + Con
("Geology" == 2, -13.5925, Con ("Geology" == 4, -10.4906, Con ("Geology" == 5,
11.6915, Con ("Geology" == 8, 12.3917, 0)))))

42
Table 16: Whole Model Test
Model -LogLikelihood DF ChiSquare Prob>ChiSq
Difference 38.025046 15 76.05009 <.0001*
Full 30.591474
Reduced 68.616520
RSquare (U) 0.5542
AICc 99.8171
BIC 134.705
Observations (or Sum Wgts) 99
Map prepared was converted into the log expression:
P(y = 1/X) = 1
(1+𝑃𝑜𝑤𝑒𝑟(2.718,−𝑟𝑎𝑠𝑡𝑒𝑟𝑚𝑎𝑝)
4.4 Landslide Hazard Index for Logistic Regression Model
The result of landslide hazard index classification showed the maximum value of 0.7309
and the minimum value of 0.62. The result obtained showed that about 25% of the
landslide has the LHI less than 0.62, about 50% of landslides is in the range of 0.62-0.64,
Figure 17: Probability value for each triggering factors of landslide.

43
about 75% of landslides had at the range of 0.64 to 0.645 and 100% of landslides had
the range of 0.645 to 0.7309.
Table 17: Landslide Hazard Index Classification
S.N Landslide Hazard Index Hazard class
1. <0.62 Low hazard
2. 0.62-0.64 Medium hazard
3. 0.64-0.645 High hazard
4 0.645-0.7309 Very high hazard
Figure 18: Percentage cumulative of landslide with the hazard index

44
4.5 Receiver Operating Characteristic (ROC)
The landslide hazard assessment was carried out using two different models i.e.
Statistical Index Model (bi-variate model) and Logistic Regression (multi-variate
model). Furthermore, the analysis results were validated using the receiver operating
characteristic (ROC) analysis to evaluate the correlation between the landslide hazard
maps and landslide inventory points as well as to compare the effectiveness of model in
landslide hazard mapping of Chepe River corridor. 30% of total 73 landslides (18
landslide) had been employed for validation purpose. The results obtained shows that a
value of area under curve (AUC) for Statistical Index model was 0.6296 and the
prediction accuracy was about 63%. Similarly, AUC for logistic regression model was
0.8209 and the prediction accuracy was 82%. This results obtained from ROC indicate
Figure 19: Landslide hazard map prepared by Logistic Regression Model

45
that the logistic model looks to be more accurate in terms of the performance of landslide
hazard mapping and has better prediction accuracy than the Statistical Index Model in
the study area.
Figure 20: ROC for Statistical Index Model

46
4.6 Vulnerability Assessment
For the vulnerability assessment a total of five municipalities and eighteen wards were
taken that falls within the boundary of river corridor (Table 18). Local Disaster and
Climate Resilient Planning guideline (2017) by Government of Nepal was followed for
the analysis of vulnerability of the Chepe River corridor.
Table 18: List of wards and municipality in the study area
S.N District Municipality Wards Area covered (km2)
1 Gorkha Ajirkot 2, 3 4.1698
2 Gorkha Siranchok 1, 2, 3 5.3201
3 Gorkha Palungtar 3, 5 3.3780
4 Lamjung Rainas 1, 2, 3, 4, 5, 6, 7 9.7069
5 Lamjung Dudhpokhari 1, 2, 4, 5 13.9777
Though landslides were found in the seven wards, all the eighteen wards were taken into
analysis for vulnerability assessment because people own property like house and land
on the other ward apart from that they were residing (Table 18). Landslides were found
to occur more in the forest area with none in the settlements (Table 19).
Figure 21: ROC for Logistic Regression Model

47
Table 19: Landslide occurring areas (m2)
S.N Municipality Wards Agriculture
(m2)
River
(m2)
Shrub and
bushes
(m2)
Forest
(m2)
Barren
land (m2)
1 Ajirkot 2 0 0 0 900 0
2 Palungtar 5 900 0 0 1800 0
3 Rainas 1 2700 1800 4500 4500 1800
4 Dudhpokhari 1 0 0 9900 14400 17100
5 Dudhpokhari 4 5400 900 0 25200 0
6 Dudhpokhari 5 3600 0 1800 0 0
7 Rainas 7 900 3600 0 3600 0
The result obtained from the KII and FGD was converted into the vulnerability scores
(Annex 5) for each indicators and the vulnerability map of the Chepe River corridor was
prepared (Figure 22). Out of eighteen wards considered for the vulnerability assessment,
ten wards were observed to have low vulnerability to landslide while eight wards were
observed to have medium vulnerability (Table 20). Rainas Municipality (Ward-7) and
Dudhpokhari Municipality (Ward-4) have the maximum vulnerability score in
comparison to the other wards. Single death was found in the Dudhpokhari (ward-4) due
to Mughe landslide. Based on the field survey, people living in the Chepe River corridor
reported that many houses have possibility of getting impacted due to the landslide in
the near future as there is no proper management of spring source of water that creates
gullies and haphazard road construction. Houses of Rainas-1, 4, 6, Dudhpokhari-4,
Palungtar-3 and Siranchowk-2 were found to be highly affected due to the landslide
(Annex 5).
Table 20: Vulnerability score of each wards falling within the study area
S.N Municipality Ward Vulnerability score
1 Ajirkot 2 22
2 Ajirkot 3 23
3 Siranchowk 1 23
4 Siranchowk 2 25
5 Siranchowk 3 27
6 Palungtar 3 27
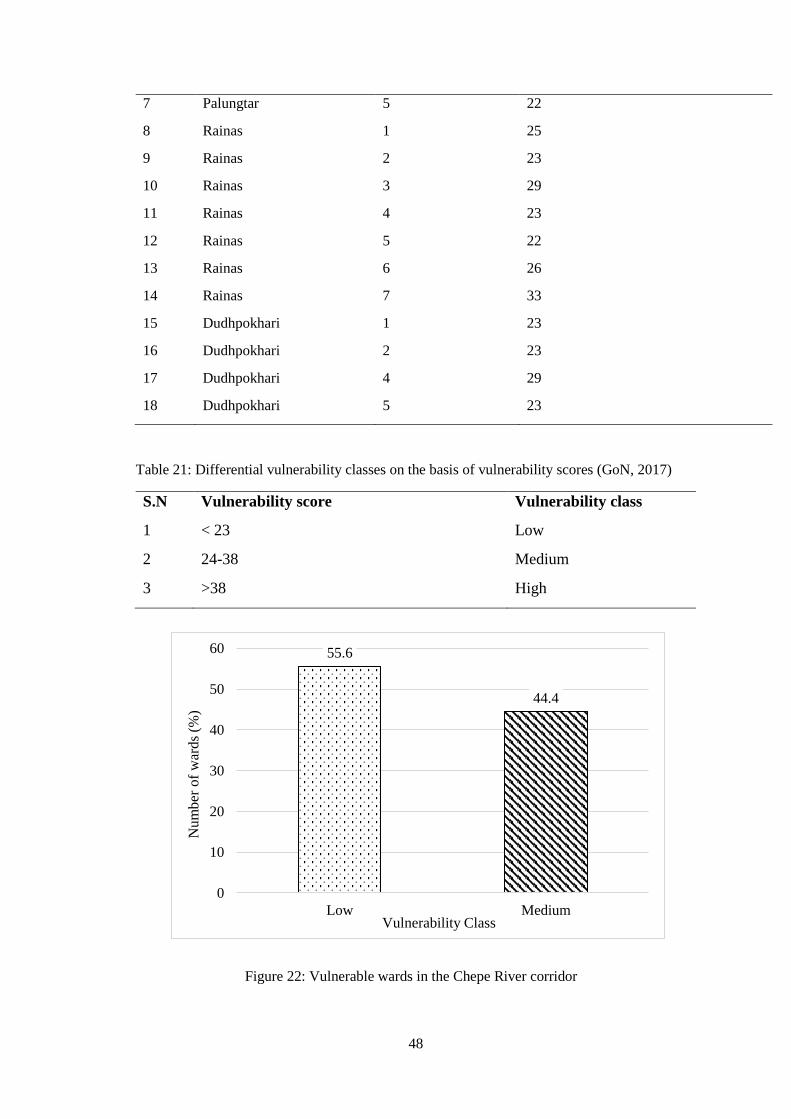
48
7 Palungtar 5 22
8 Rainas 1 25
9 Rainas 2 23
10 Rainas 3 29
11 Rainas 4 23
12 Rainas 5 22
13 Rainas 6 26
14 Rainas 7 33
15 Dudhpokhari 1 23
16 Dudhpokhari 2 23
17 Dudhpokhari 4 29
18 Dudhpokhari 5 23
Table 21: Differential vulnerability classes on the basis of vulnerability scores (GoN, 2017)
S.N Vulnerability score Vulnerability class
1 < 23 Low
2 24-38 Medium
3 >38 High
Figure 22: Vulnerable wards in the Chepe River corridor
55.6
44.4
0
10
20
30
40
50
60
Low Medium
Nu
mb
er o
f w
ards
(%)
Vulnerability Class

49
4.6 Risk Assessment
As the logistic regression model was found to be more reliable in terms of landslide
hazard assessment, the model was multiplied with the vulnerability model to get
landslide risk map. The risk level was classified into 4 level i.e. low, medium, high and
very high. 16.59 (34.54%) km2 area lies in the medium risk followed by 12.13 (27.46%)
km2 in high risk, 7.75 (17.54 %) km2 in very high risk and 7.72 (17.46 %) km2 in low
risk respectively (Figure 23).
Figure 23: Ward-wise landslide vulnerability in the Chepe River corridor

50
Figure 25: Spatial distribution of landslides risk areas in Chepe River corridor
Figure 24: Area covered by each risk level in the study area
17.5
37.5
27.4
17.5
0
5
10
15
20
25
30
35
40
Low Medium High Very high
Are
a (%
)
Risk Level

51
CHAPTER 5: DISCUSSION
5.1 Inventory and historical analysis of landslides
In the present study, a total of 73 landslides were observed. Most of the landslides
observed were debris flow and very few were rock flow and were found to be active.
According to the people living on the corridor the major reason for the landslide are the
road construction, irrigation canal construction, spring source and rainfall. A series of
landslides in Dhamilikuwa VDC had occurred in the slopes along the Chepe River. There
are about 7-10 landslides at the same place which had displaced Bharati family from that
area and the landslide is also called Bharati veer (personal communication with local
people). According to Ojha et al. (2015), Patapati (first started in 1984), Simpani (first
started in 2001) which is still active covering the area about 200m x 150m, Chepe Sangu
(first started in 2011), and Bagar/Tamang tole (first started in 2012) are some of the
landslides. An irrigation canal popularly known as Rainastar Sinchai Nahar was initiated
by the Government of Nepal (GoN) in 1984 with the technical and financial support from
the Irrigation Line of Credit (ILC), World Bank (WB) and the International Labor
Organization (ILO), which was completed in 1996 (Ojha et al., 2015). The people of
Borangkhola believe that the landslide is caused due to this canal too along with the other
spring sources and rainfall. Another most popular landslide in the Chepe River corridor
is Chunpaharo landslide in Bangechaur. The landslide occurred about 10 year ago and is
still active slowing taking away the land of the people living nearby. Around 5 houses
are highly vulnerable to that landslide which has covered a broad area in the river
corridor. Mughe landslide is the another huge landslide which is basically the rock flow
that may cause loss of life and property if it occurs frequently. During 2015 (September)
a massive Mughe landslide killed one disable person who wasn’t able to run during that
landslide. Most of the landslide were found to have occurred due to road construction
whereas others are found to be older one occurred 5-10 years before which is still active.
5.2 Landslide triggering factors
Many factors are responsible for the landslide occurrence. In this study a total of 11
factors were considered for the analysis of landslide hazard and risk. The slope class
from 10° to 50° showed an increasing trend of landslide whereas from 50° to 70°, it is
decreasing (Table 2). Generally, as slope increases, the probability of landslide
occurrence also increases (Meten et al., 2015). Chen et al. (2001) state that there is no
appropriate relationship between the steepness of a slope and the probability of

52
occurrence of landslides. Landslides are prone to occur on slopes having a particular
range of steepness. The finding of this study agrees to Chen et al. (2001).
Aspect (slope orientation) affects the exposure to sun-light, wind and precipitation
thereby indirectly affecting other factors such as soil moisture, vegetation cover and soil
thickness that contribute to landslides (Clerici et al., 2006). In the present study, aspect
towards the southeast and south is found mostly to contributes towards landslides (Table
3). This may be because most of rivers flows from east-west and most of landslides
appear on the south slopes towards the river (Caiyan, 2006). The south facing slopes are
generally steep and anti-dipping slopes and many south facing facets are on the
windward side of the summer monsoon rain which agrees with Ghimire (2011).
The land use has also the significant role in the stability of soil slope. Landslide was
found to occur more in the forested area than in the barren lands (Table 11) which is
similar to the findings in Chure area (TU-CDES, 2016). Based on the field survey the
maximum area covered by landslides in the forest is may be due to factors like haphazard
road construction, broader girth of older trees, spring source creating gullies etc. There
are numerous factors responsible for the occurrence of landslide. Statistical Index Model
has also stated that slope (40-50°), distance to road (less than 500 m), geology (Himal
group, Ranimatta and Ulleri formation) and rainfall (2800-2900 mm) are mostly
responsible for the occurrence of landslide in the study area which might be the reason
for the observation of maximum landslide in the forest areas. Most of the area of the
corridor falls in the forest which might be the another reason of maximum landslide
observed in forest. Trees and forests can make a positive contribution in various
situations however it also increase landslide risk by imposing load on unstable slopes
and via wind-related effects; they are unlikely to prevent or minimize deep landslides or
slides on very steep slopes. However, they can (FAO, 2018).
The surface relief is the variation in height of land surface and the different reliefs have
different climatic conditions. According to Bhattarai and Pradhan (2011) the
construction activities like roads are preferentially built along the same relief and are
therefore landslide hazards in an area are observed more or less on the same relief. The
study area has the maximum area of landslide in the relief of less than 30 m (Table 5).
Most of the area of Chepe River falls within the elevation of 400-800 m where the area
of occurrence of landslide is maximum in the elevation of 800-1200 m. According to

53
Ghimire (2011), there is no exact relation between occurrence of landslide and elevation
and therefore elevation alone cannot explain about the occurrence of landslides.
Elevation along with other linked parameters like aspect, slope is interlinked for causing
landslides in any place.
The roads built on the slopes cause the loss of toe support. The change of the topography
and loss of support lead to increase in strain behind the slope and development of cracks.
It leads to the instabilities occurring in the slope because of the negative effects such as
water infiltration (Devkota et al., 2013) and with that the road segment may act as a
barrier, a net source, a net sink or a corridor for water flow, and depending on its location
in the area, it usually serves as a source of landslides (Pradhan & Lee, 2010). In the study
area, maximum landslides were found to be near to the road i.e. < 500 m. With the
increasing distance of the road the landslide is also less which shows that the landslide
is triggered due to the haphazard road construction (table 4). The similar result was
reported by Devkota et al. (2013) in the Mugling-Narayanghat road section which stated
that road construction is one of the reason behind the landslide occurrence.
Implementation of improved standards for road construction needs to be undertaken
immediately to reduce landslide risk.
Plan curvature is the curvature of the hillside in a horizontal plane or the curvature of the
contours on a topographic map. Hillsides can be subdivided into regions of concave
outward, convex outward, and straight contours called planar regions (Ohlmacher,
2007). It was observed that slope in the case of curvature, the planar curvature is the
most susceptible to landslides, in both plan as well as profile curvature and the finding
of this study is similar to Ohlmacher (2007) in which the statistical analysis of plan-
curvature and landslide datasets also indicate that hillsides with planar plan curvature
have the highest probability for landslides in regions dominated by earth flows and earth
slides in clayey soils (CH and CL). The curvature values represent the morphology of
the topography (Lee et al., 2004; Erener & Duzgun, 2010). Devkota et al. (2013)
concluded that the concave curvature is most susceptible to the landslide whereas Lee
and Pradhan (2007) observed that convex curvature is more susceptible to landslide
which indicates there are other factors like rainfall, slope, geology, land use etc. along
with curvature type responsible for the landslide.

54
Geology plays an important role in the causes of landslide failure. Most of the landslide
in the study area is found to contain Himal group and Ranimatta formation. Himal group
consists of rocks like marble, gneiss, magmatite whereas Ranimatta formation consists
of phyllite, quartzite, metasandstone and conglomerate (Ojha, 2009). Thin beds of
phyllite between quartzite beds is one of the cause of landslide. Phyllite has less friction
angle and higher weathering rate which gets weathered during long environmental
exposure. Due to that the landslides are active. Himal group consists gneiss which
contains more amount of feldspar and weathering rate of feldspar is higher which
undergoes chemical weathering with water. Due to which land sliding is common in
gneiss (Gasim et al., 2015).
Drainage density is the important factor in deciding the degree of dissection and has been
observed that in the low dissected hill the drainage density is low, while in the highly
dissected hills the drainage density is high. It is important factor for slope instability as
higher the drainage density, lower is the infiltration and faster is movement of the surface
flow (Pachauri et al., 1998). In the area close to the drainages, the high drainage density
can cause accelerated surface erosion resulting into intense superficial mass wasting
(Barredo et al., 2000). Many landslides in hilly areas occur due to the erosional activity
associated with drainage. The result of this present study showed that landslide area is
maximum in the area having less drainage density, which shows more infiltration causing
the more landslide to occur.
Rainfall plays an important role in landslide triggering effects. Rainfall triggered
landslides are reported every year in different countries. The findings of this study also
shows rainfall as one of the significant triggering factor. The area of landslide is
increasing with the increase in the intensity of rainfall in the Chepe River corridor.
Although rainfall is one of the main landslides triggering factors in Nepal and throughout
the Himalaya, the relationship between landslide occurrence and rainfall characteristics,
either in empirical equations, or in known physical interactions of slope materials, is still
unclear. In the Himalaya, the empirical relationship between rainfall and landslide
occurrence, such as minimum or maximum amount of rainfall necessary for triggering
landslides, is yet to be established (Dahal & Hasegawa, 2008).

55
5.3 Landslide modelling and model comparison
Statistical Index Model (SIM) is a polygon (area) based analysis and the result showed
that slope and road are the major triggering factor of landslide in the study area. Most of
the area of the corridor lies to the very high hazard area. Dudhpokhari municipality of
Lamjung district and Ajirkot municipality of Gorkha district lying in the river corridor
are observed to be very high hazardous in terms of landslide. Logistic regression model,
one of the proposed favorable model to deal with the problem of combination of
heterogeneous data, has been widely used for mapping landslide susceptibility. It is
based on the point based analysis of landslide. In the present study, logistic regression
model shows that there is greater significance of landuse and landcover in the occurrence
of the landslides whereas geology and profile curvature has very less significance. There
is a general consensus that geological information is one of the most decisive parameters
regarding landslide manifestation and thus included in landslide hazard models (LHMs)
(Rossi et al., 2010; Pourghasemi et al., 2012). However, the study by Paudel (2016)
revealed that the necessity of using geological information in additional to topographical
parameters is not always high. The whole model test (table 15) shows that the-
loglikelihood has dropped to 30.59 (from 68.62) and the difference in model by including
the variable is significant with Prob>ChiSq (<.0001) and chi square statistics (76.05009).
This means models are compared and hypothesis is tested which showed model
improvement has been achieved. On the basis of landslide hazard map, Rainas and few
areas of Dudhpokhari municipality and Palungtar and Siranchowk municipality of
Gorkha district are observed to be high hazard areas.
Landslide Hazard Models (LHMs) after the preparation should be validated before using
to ascertain their reliability. According to Vakhshoori and Zare (2018), the validity of
LSMs had simply been presented by simple statistics such as landslide percentage per
susceptible zones and model efficiency. Owing to the inefficiency of these simple
statistics (Provost & Fawcett, 1997; Provost et al., 1998), threshold-independent
methods, like receiver operating characteristic (ROC), have been recommended for
validation (Fielding & Bell, 1997; Begueria, 2006; Akgun, 2012; Corominas et al.,
2014). The area under curve (AUC) value of SIM was 0.6296 and the prediction accuracy
was 63%. Similarly, AUC for logistic regression model was 0.8209 with the prediction
accuracy of 82% which shows that comparatively logistic regression is better in
performance than statistical index model for landslide hazard assessment. Various results

56
from different studies has shown the logistic regression models to be more reliable than
the statistical Index models: Pourghasem et al. (2013) prepared the landslide
susceptibility mapping by binary logistic regression, analytical hierarchy process, and
statistical index models along with this they also compared the performances of model
which also shows logistic regression model is better than SIMs; Similar result have been
observed by Lim et al. (2011) where landslide hazard maps were produced using the
probabilistic methods like frequency ratio, statistical index, certainty factor and landslide
susceptibility analysis, logistic regression (80.05%) accuracy represented the best result
followed by frequency ratio (79.68%), landslide susceptibility analysis (79.6%),
statistical index (79.38%) and certainty factor (79.37%); logistic regression was found
to be more reliable than SIMs in the study of landslide susceptibility in Japan (Dou et
al., 2015). The result of logistic regression showed that geology has very less impact in
the landslide occurrence in this study area and the similar result was obtained in the study
of Khanh (2009). Vakhshoori and Zare (2018) also stated that ROC curve could merely
estimate a general validity for the produced LSMs and therefore, it is by no means certain
that a map with a ROC-AUC a few percent lower than that of the other maps is less
reliable in predicting the future landslides.
5.4 Vulnerability and risk assessment
Vulnerability assessment is a challenging work to be done as different studies uses
different indicators for the analysis. In this study the LDCRP guideline provided by the
GoN (2017) was used. A total of 14 indictors were used for the analysis. Ajirkot-2,3,
Siranchowk-1,2, Palungtar-5, Rainas-2, 4,5, and Dudhpokhari-1,2,5 were observed to be
low vulnerable to the landslides whereas Siranchowk-3, Palungtar-3, Rainas-1,3,6,7 and
Dudhpokhari-4 were found to have medium vulnerability. Landslide has caused the
economic loss by means of damaged house and loss of agricultural land. Maize, wheat,
millet, paddy and buckwheat are some of the major agricultural production in the study
area. These crops were also considered during the vulnerability analysis of economical
aspect (Appendix 5). Most of the area was found to be less vulnerable to the landslide
because of less impact of landslide in the settlement area and good economic stability of
people. None of the area is found to be highly vulnerable to the landslide till date but
according to the people there is a high possibility of increment of the impact from the
increment in the landslide number because of the external factors like road construction
in the study area. Most of the area of landslide lies in the medium risk zone followed by

57
high, very high and low risk zone. Areas like Rainas-1,3,7, Siranchowk-3, Palungtar-3
and Dudhpokhari-4 were observed to be at high and very high risk in terms of landslide.
The early paradigms within social science emphasized the reaction and perceptions of
communities during and after emergencies and did not explicitly focus on issues of risk,
or mitigating the risk of physical harm and social disruption before an event occurred
(Kreps,1973; Cardona, 2003).
58
CHAPTER 6: CONCLUSION AND RECOMMENDATIONS
6.1 Conclusion
A total of 73 landslides were found in the Chepe River corridor which was divided into
training data (70%) and validation data (30%). The hazard, vulnerability and risk
assessment of Chepe River corridor comprising 5 municipalities and 18 wards was
studied. Two models i.e. bivariate statistical index model and multivariate logistic
regression model were used for the landslide hazard assessment. According to the
statistical index model slope, distance to road, geology, land use and rainfall are the
major triggering factors of landslides whereas the logistic regression model states that
land use, relief, elevation, drainage density, slope and plan curvature are the major
triggering factors in the study area. The comparison and validation of the model was
done by using ROC which states the prediction accuracy of logistic regression model is
82% whereas the statistical index model is only 63%. The logistic regression model is
found to be a better model for the landslide hazard assessment in the smaller area like
river corridor. Therefore, the prioritization should be given to the proper land use
management to control the landslide of the area. The vulnerability assessment done in
the study area indicates 10 wards falling within the river corridor to be low vulnerable to
the landslide whereas 8 wards were found to be medium vulnerable to the landslide.
None of the wards were highly vulnerable to the landslide. But due to the haphazard road
construction, the likelihood of occurrence of landslide and increment of its negative
impact is maximum in upcoming days. Most of the area (34.54%) lies in the medium
risk followed by high risk (27.46%), very high risk (17.54%) and low risk (17.46%).
6.2 Recommendations
Based on the findings of the present study following recommendations have been put
forward:
This study has identified the risk prone areas in terms of landslide therefore the
information and awareness about the risk should be provided to the people living
in such areas for their preparedness towards mitigation.
Proper Land Use planning (according to Land Use policy, 2015) and its
implementation should be done in order to use the land sustainably.

59
Proper baseline study on the hazard and risk zonation should be done prior to the
construction of roads, houses and the other infrastructures.
Government (Federal, Provincial and Local) should prevent the people living in
the risk prone area where the landslide is cutting the land mass slowly.
As the present study incorporates eleven factors, further studies can be carried
out incorporating the other triggering factors like vegetation index, soil type etc.

60
REFERENCES
Acharya, S. & Pathak, D. (2017). Landslide hazard assessment between Besi Sahar and
Tal area in. Int. Journal of Advances in Remote Sensing and GIS, 5(1), 29–38.
Akgun, A. (2012). A comparison of landslide susceptibility maps produced by logistic
regression, multi-criteria decision, and likelihood ratio methods: A case study
at ˙Izmir, Turkey; Landslides 9 93–106.
ADPC. (2016). Annual Report; Asian Disaster Preparedness Center.
Ayalew, L., Yamagishi, H., Marui, H. & Kanno, T. (2005). Landslide in Sado Island of
Japan: Part II. GIS-based susceptibility mapping with comparison of results
from two methods and verifications. Eng Geol. 81:432–445.
Barredo, J., Benavide, S.A., Hervas, J. & Van Westen, C. (2000). Comparing heuristic
landslide hazard assessment techniques using GIS in the Tirajana basin, Gran
Canaria Island,Spain. JAG 2(1):9-23.
Baruwal, A. (2014). Disaster Profile of Nepal. Monographic Issue. Emergency and
Disaster Reports. 1 (3): 3-49.
Bednarik, M., Magulova, B., Matys, M. & Marschalko, M. (2010). Landslide
susceptibility assessment of the KralovanyLiptovsky Mikulas railway case
study. Phys. Chem. Earth Parts A/B/C 35(3–5) 162–171.
Begueria, S. (2006). Validation and evaluation of predictive models in hazard assessment
and risk management. Nat Hazards. 37(3):315–329.
Bhattarai, B. C. & Pradhan, A. M. S. (2011). A case study on landslide hazard mapping
in Changunarayan VDC, Nepal. In Landslide Science and Practice (pp. 551-
559). Springer, Berlin, Heidelberg.
Bhattarai, D., Tsunaki R. & Mishra, A.N. (2002). Water and Risk. In: Proceedings of
Asia High Summit, 6-10 May 2002, ICIMOD, Nepal

61
Birkmann, J. (2006). Measuring vulnerability to promote disaster-resilient societies:
Conceptual frameworks and definitions. Measuring vulnerability to natural
hazards: Towards disaster resilient societies, 1, 9-54.
Birkmann, J. (2007). Risk and vulnerability indicators at different scales: Applicability,
usefulness and policy implications. Environmental hazards. 7(1), 20-31.
Brabb, E. (1993). Proposal for worldwide landslide hazard maps. Proceedings of 7th
International Conference and field workshop on landslide in Czech and Slovak
Republics; pp. 15–27.
Brenning, A. (2005). Spatial prediction models for landslide hazards: review,
comparison and evaluation. Natural Hazards Earth Systems Science. 5(6): 853–
862, doi:10.5194/nhess-5-853-2005.
Briguglio, L., Cordina, G., Farrugia, N. & Vella, S. (2009). Economic vulnerability and
resilience: Concepts and measurements. Oxford Development Studies, 37(3),
229-247.
Caiyan, W. J. (2006). Landslides and Slope Aspect in the Three Gorges Reservoir Area
Based on GIS and Information Value Model. Wuhan University Journal of
Natural Sciences, 773779.
Cardona, O.D. (2003). Indicators for Risk Measurement: Fundamentals for a
methodological approach. Manizales–Colombia: Inter-American Development
Bank.
Carrara, A. (1983). Multivariate models for landslide hazard evaluation. Mathematical
Geol., v. 15, n. 3, p. 403-426.
Carson, M. A. & Kirk, M.J. (1972). Hillslope Form and Process. Cambridge University
Press, London, 475 pp.
CDES. (2014). Hazard and vulnerability analysis of Nepal’s Chure area. Central
Department of Environmental Science.
Chen, H.H., Chiou, C.R. & Kang, T.S. (2001). The application of GIS on studying the
characteristics of landslide areas in the Shi-Meng Reservoir watershed. J Exp
For National Taiwan Univ. 15(3):3-222.

62
Chen, X. L., Liu, C. G., Chang, Z. F. & Zhou, Q. (2015). The relationship between the
slope angle and the landslide size derived from limit equilibrium simulations.
Geomorphology, 253, 547-550.
Chung, C.F., Fabbri, A.G. & Van Westen, C.J. (1995). Multivariate regression analysis
for landslide hazard zonation. Geographical information systems in assessing
natural hazards (A. Carrera and F.Guzzetti, editors, Kluwer Academin
Publishers, Dordrecht, The Netherlands): 107-133.
Clerici, A., Perego, S., Tellini, C. & Vescovi, P. (2006). A GIS-based automated
procedure for landslide susceptibility mapping by the conditional analysis
method: the Baganza valley case study (Italian Northern
Apennines). Environmental Geology, 50(7), 941-961.
Conforti, M., Pascale, S., Robustelli, G. & Sdao, F. (2014). Evaluation of prediction
capability of the artificial neural networks for mapping landslide susceptibility
in the Turbolo River catchment (northern Calabria, Italy). Catena. 113:236–
250.
Corominas, J., Van Westen, C., Frattini, P., Cascini, L., Malet, J. P., Fotopoulou, S. &
Pitilakis, K. (2014). Recommendations for the quantitative analysis of landslide
risk. Bulletin of engineering geology and the environment, 73(2), 209-263.
Cox, D. (1958). The Regression Analysis of Binary Sequences. Journal of the Royal
Statistical Society. Series B (Methodological),20(2), 215-242.
Dahal, R. K. & Hasegawa, S. (2008). Representative rainfall thresholds for landslides in
the Nepal Himalaya. Geomorphology, 100(3), 429-443.
Dahal, R. K., Hasegawa, S., Nonomura, A., Yamanaka, M., Masuda, T. & Nishino, K.
(2008). GIS-based weights-of-evidence modelling of rainfall-induced
landslides in small catchments for landslide susceptibility
mapping. Environmental Geology, 54(2), 311-324.
Dai, F.C. & Lee, C.F. (2002). Landslide characteristics and slope instability modeling
using GIS, Lantau Island, Hong Kong. Geomorphology. 42:213–228.
63
Dai, F.C., Lee, C.F. & Xu, Z.W. (2001). Assessment of landslide susceptibility on the
natural terrain of Lantau Island, Hong Kong. Environmental geology, 40(3):
381-391.
Dangal R. (2011). Country profile Nepal. Disaster risk management: policies and
practices in Nepal. Kobe: Asian Disaster Reduction Center;.
(http://www.adrc.asia/countryreport/NPL/2011/FY2011B NPL CR.pdf,
accessed 5 June 2018).
Devkota, K. C., Regmi, A. D., Pourghasemi, H. R., Yoshida, K., Pradhan, B., Ryu, I. C.
& Althuwaynee, O. F. (2013). Landslide susceptibility mapping using certainty
factor, index of entropy and logistic regression models in GIS and their
comparison at Mugling–Narayanghat road section in Nepal Himalaya. Natural
hazards, 65(1), 135-165.
Dhital, M.R., Upreti, B.N., Dangol, V., Bhandari, A.N., & Bhattarai, T.N. (1991).
Geological engineering methods applied in mountain road survey: an example
from Baitadi-Darchula Road Project, Nepal. Journal of Nepal Geological
Society, 7, 49-67.
DCEP. (2014). District Climate and Energy Plan. District Development Committee,
Lamjung.
Dou, J., Bui, D. T., Yunus, A. P., Jia, K., Song, X., Revhaug, I. & Zhu, Z. (2015).
Optimization of causative factors for landslide susceptibility evaluation using
remote sensing and GIS data in parts of Niigata, Japan. PloS one, 10(7),
e0133262.
Douglas, J. (2007). Physical vulnerability modelling in natural hazard risk assessment.
Natural Hazards and Earth System Science, 7(2), 283-288.
Erener, A. & Duzgun, H.S.B. (2010) Improvement of statistical landslide susceptibility
mapping by using spatial and global regression methods in the case of More and
Romsdal (Norway). Landslides 7(1):55–68.
Fayez, L., Pazhman, D., Pham, B. T., Dholakia, M. B., Solanki, H. A., Khalid, M., &
Prakash, I. (2018). Application of Frequency Ratio Model for the Development
of Landslide Susceptibility Mapping at Part of Uttarakhand State, India.
International Journal of Applied Engineering Research, 13(9), 6846-6854.

64
Felicisimo, A., Cuartero, A., Remondo, J. & Quiros, E. (2013). Mapping landslide
susceptibility with logistic regression, multiple adaptive regression splines,
classification and regression trees, and maximum entropy methods: a
comparative study. Landslides 10(2): 175-189.
Fell, R. (1994). Landslide risk assessment and acceptable risk. Canadian Geotechnical
Journal 31, 261–272.
Fielding, A.H. & Bell, J.F. (1997). A review of methods for the assessment of prediction
errors in conservation presence/ absence models. Environ Conserv. 24(01):38–
49.
Galli, M. & Guzzetti, F (2007). Landslide vulnerability criteria: a case study from
Umbria, Central Italy. Environ Manage. 40:649–664.
Gasim, M.B., Toriman, M.E. and Juahir, H. (2015). Phenomenon of Slope Failure
Occurrences along Gerik-Jeli Highway, Malaysia. Science Alert.
Ghimire, M. (2011). Landslide occurrence and its relation with terrain factors in the
Siwalik Hills, Nepal: Case study of susceptibility assessment in three basins.
Natural Hazards, 299320.
Glade, T. & Crozier, M.J. (2005). Landslide Hazard and Risk. Wiley; Chichester, UK.
The Nature of Landslide Hazard Impact. pp. 43–74.
Glade, T. (2003). Vulnerability assessment in landslide risk analysis. Erde. 134(2), 123-
146.
GoN. (2017). Local Disaster and Climate Resilience Planning Guideline (LDCRP). First
Amendment. Final Draft. Government of Nepal.
Gritzner, M.L, Marcus, W.A, Aspinall, R. & Custer, S.G. (2001). Assessing landslide
potential using GIS, soil wetness modeling and topographic attributes, Payette
River, Idaho. Geomorphology 37:149–165.
Guzzetti, F., Carrara, A., Cardinali, M. & Reichenbach, P. (1999). Landslide hazard
evaluation: a review of current techniques and their application in a multi-scale
study, Central Italy. Geomorphology, 31(1), 181-216.

65
Guzzetti, F. (2005). Landslide hazard and Risk assessment. Concepts, methods and tools
for the detection and mapping of landslides, for Landslide susceptibility
zonation and hazard assessment, and for landslide risk evaluation. PhD
dissertation.
Guzzetti, F., Reichenbach, P., Cardinali, M., Galli, M. & Ardizzone, F. (2005). Landslide
hazard assessment in the Staffora basin, northern Italian Apennines.
Geomorphology, 72: 272- 299.
Guzzetti, F. (2012). Landslide inventory maps: New tools for an old problem. Earth
Science Reviews, 42-66.
He, Y. & Beighley, R.E. (2008). GIS-based regional landslide susceptibility mapping: A
case study in southern California. Earth Surf. Process. Landf., 33, 380–393.
Hosmer, D. W. & Lemeshow, S. (2000). Special topics. Applied Logistic Regression,
Second Edition, 260-351.
IRIN. (2013). No Early Warning for Nepali’s Deadly Landslides.
www.irinnews.org/report/98381/no-early-warning-nepal%E2%80%99s-
deadly-landslides.
ISDR. (2009). Global Assessment Report on Poverty and Disaster Risk. Nepal Country
Report.
Kalantar, B., Pradhan, B., Naghibi, S. A., Motevalli, A., & Mansor, S. (2018).
Assessment of the effects of training data selection on the landslide
susceptibility mapping: a comparison between support vector machine
(SVM), logistic regression (LR) and artificial neural networks (ANN).
Geomatics, Natural Hazards and Risk, 9(1), 49-69.
Khanh, N. Q. (2009). Landslide hazard assessment in Muonglay, Vietnam applying
GIS and remote sensing. Dr. rer. nat. at the Faculty of Mathematics and
Natural Sciences Ernst-Moritz-Arndt-University Greifswald.
Kreps, G. A. 1973. Decision making under conditions of uncertainty: Civil
disturbance and organizational change in urban police and fire departments.
Newark: Disaster Research Centre, University of Delaware.
Lee, S. & Pradhan, B. (2007). Landslide hazard mapping at Selangor, Malaysia using
frequency ratio and logistic regression models. Landslides, 4(1), 33-41.

66
Lee, S., Ryu, J.H., Won, J.S. & Park, H.J. (2004) Determination and application of the
weights for landslide susceptibility mapping: using an artificial neural network.
Eng Geol. 71:289–302.
Lee, S.T., Yu, T.T., Peng, W.F. & Wang, C.L. (2010). incorporating the effects of
topographic amplification in the analysis of earthquake-induced landslide
hazards using logistic regression. Natural Hazards and Earth System Sciences.
10: 2475-2488.
Leone, F., Aste, J.P. & Leroi, E. (1996) Vulnerability assessment of elements exposed
to mass-movement: working toward a better risk perception. In: Senneset K (ed)
Landslides. Balkema, Rotterdam, pp 263–270.
Lim, K.W., Tay, L.T. & Lateh, H. (2011). Landslide hazard mapping of Penang island
using probabilistic methods and logistic regression. Proceedings of the IEEE
International Conference on Imaging Systems and Techniques, May 17-18,
2011, Penang, Malaysia, pp: 273-278.
Meten, M., Prakashbhandary, N. & Yatabe, R. (2015). Effect of Landslide Factor
Combinations on the Prediction Accuracy of Landslide Susceptibility Maps in
the Blue Nile Gorge of Central Ethiopia. Geoenvironmental Disasters, 2:9.
MoFE. (2010). National Adaptation Programme of Action (NAPA). Government of
Nepal, Ministry of Forest and Environment (previously MoPE), Kathmandu,
Nepal.
MoHA & DPNet-Nepal (2015). Nepal Disaster Report. Ministry of Home Affairs,
Government of Nepal and Disaster Preparedness Network-Nepal.
MoHA & DPNet-Nepal (2017). Nepal Disaster Report. Ministry of Home Affairs,
Government of Nepal and Disaster Preparedness Network-Nepal.
MoLRM. (2015). Land Use Policy. Ministry of Land Reform and Management.
Government of Nepal.
Nandi, A. & Shakoor, A.A. (2009). GIS-based landslide susceptibility evaluation using
bivariate and multivariate statistical analyses. Engineering Geology 110: 11-20.
67
Nandi, A. & Shakoor, A. (2010). A GIS-based landslide susceptibility evaluation using
bivariate and multivariate statistical analyses. Eng Geol. 110(1):11–20.
Ocakoglu, F., Gokceoglu, C. & Ercanoglu, M. (2002). Dynamics of a complex mass
movement triggered by heavy rainfall: a case study from NW Turkey.
Geomorphology. 42(3):329–341.
Oh, H.J. & Lee, S. (2010). Cross-validation of logistic regression model for landslide
susceptibility mapping at Geneoung areas, Korea. Disaster Advances. 3(2): 44-
55.
Ohlmacher, C. (2006). The Relationship Between Geology and Landslide Hazards of
Atchison, Kansas, and Vicinity. Kansas Geological Survey.
Ohlmacher, G. C. (2007). Plan curvature and landslide probability in regions dominated
by earth flows and earth slides. Engineering Geology, 91(2-4), 117-134.
Ojha, T.K. (2009). Magnetostratigraphy, Topography and Geology of Nepal Himalaya:
A GIS and Paleomagnetic Aproach. PhD dissertation. University of Arizona.
Ojha, H., Adhikari, B., Gurung, N., Khatri, D.B., Joshi, T., Dhungana, H. & Dhungana,
S. (2015). The Production of Landslides Risks and Local Responses: A Case
Study of Dhamilikuwa, Lamjung District of Nepal. Case Study Report 4.
Kathmandu: Southasia Institute of Advance Studies and Forest Action Nepal.
Pachauri, A.K., Gupta, P.V. & Chander, R. (1998) Landslide zoning in a part of the
Garhwal Himalayas. Environmental Geology. 36, 325-334.
Paudel, U. (2016). Landslide susceptibility assessment using machine learning with
emphasis on scaling and topographic representation issues. PhD dissertation.
Department of Natural Environmental Studies, Graduate School of Frontier
Sciences, The University of Tokyo (unpublished).
Pokhrel, N. (2003). Study of areal precipitation distribution pattern in the Chepe
catchment, Nepal. Butwal Power Company Ltd, Kumaripati Lalitpur, GPO
11728, Kathmandu, Nepal, pp. 1-7.

68
Pontius, R.J. & Schneider, L.C. (2001). Land-cover change model validation by an ROC
method for the Ipswich watershed, Massachusetts, USA. Agriculture,
Ecosystems and Environment 85: 239–248.
Poudyal, C.P., Chang, C., Oh. H.J. & Lee, S. (2010). Landslide susceptibility maps
comparing frequency ratio and artificial neural networks: a case study from the
Nepal Himalaya. Environmental Earth Science. 61, 1049–1064.
Pourghasemi, H.R. (2008). Landslide hazard assessment using fuzzy logic (Case Study:
A part of Haraz watershed), M.Sc.Thesis, TarbiatModarres University
International Campus, Iran, pp92.
Pourghasemi, H. R., Pradhan, B., Gokceoglu, C. & Moezzi, K. D. (2012). Landslide
susceptibility mapping using a spatial multi criteria evaluation model at Haraz
Watershed, Iran. In Terrigenous mass movements (pp. 23-49). Springer, Berlin,
Heidelberg.
Pourghasemi, H R, Moradi, H.R. & Aghda, S.F. (2013). Landslide susceptibility
mapping by binary logistic regression, analytical hierarchy process, and
statistical index models and assessment of their performances. Nat. Hazards.
69(1) 749–779.
Pradhan, B. & Lee, S. (2010). Landslide susceptibility assessment and factor effect
analysis: backpropagation artificial neural networks and their comparison with
frequency ratio and bivariate logistic regression modelling. Environmental
Modelling & Software, 25(6), 747-759.
Pradhan, B. (2010). Remote sensing and GIS-based landslide hazard analysis and cross-
validation using multivariate logistic regression model on three test areas in
Malaysia. Adv Space Res 45(10): 1244–1256.
Provost, F.J. & Fawcett, T. (1997). Analysis and visualization of classifier performance:
comparison under imprecise class and cost distributions. In: Heckerman D,
Mannila H, Pregibon D, Uthurusamy R, editors. Proceedings of the 3rd
International Conference on Knowledge Discovery and Data Mining (KDD-
97); Aug 14; Menlo Park (CA): AAAI Press. p. 43-48.

69
Provost, F.J, Fawcett, T., and Kohavi, R. (1998). The case against accuracy estimation
for comparing induction algorithms. In: Shavlik J, editor. Proceedings of the
ICML 1998; Jul 24; San Francisco (CA): Morgan Kaufmann. p. 445-453.
Quan Luna, B., Blahut, J., Van Westen, C.J., Sterlacchini, S., Van Asch, T.W.J. &
Akbas, S.O. (2011). The application of numerical debris flow modelling for the
generation of physical vulnerability curves. Nat. Hazard. Earth Syst.11:2047–
2060.
Rossi, M., Guzzetti, F., Reichenbach, P., Mondini, A.C. & Peruccacci, S. (2010).
Optimal landslide susceptibility zonation based on multiple forecasts.
Geomorphology, 114, 129-142.
Sakar, S. & Kanungo, D.P. (1995). Mehrotar, G.S. Landslide zonation: A case study
Garhwal Hymalia, India. Mountain Research and Development 15(4): 301-30.
Shrestha, A. B., Bajracharya, S. R., Kargel, J. S., & Khanal, N. R. (2016). The impact of
Nepal's 2015 Gorkha earthquake-induced geohazards. International Centre for
Integrated Mountain Development (ICIMOD).
Shuttle Radar Topography Mission (SRTM) 1 Arc-Second Global. Landsat 4-5
Thematic Mapper (TM) Level-1 Data Products | The Long Term Archive,
lta.cr.usgs.gov/STRM1Arc.
Silva, M. & Pereira, S. (2014). Assessment of physical vulnerability and potential losses
of buildings due to shallow slides. Nat. Hazards. 72:1029–1050.
Suzen, M.L. & Doyuran, V. (2004). Data driven bivariate landslide susceptibility
assessment using geographical information systems: A method and application
to Asarsuyu catchment, Turkey. Eng. Geol. 71, 303–321.
Tian, H., Nan, H. & Yang, Z. (2010). Select landslide susceptibility main affecting
factors by multi objective optimization algorithm, in Proceedings of the 6th
International Conference on Natural Computation (ICNC '10), pp. 1830–1833.
TU-CDES & UNDP. (2014). Hazard and vulnerability analysis of Nepal’s Chure area.
Central Department of Environmental Science, Tribhuvan University and
Government of Nepal, President Chure-Tarai Madhesh Conservation
Development Board, Kathmandu.

70
TU-CDES (2016). Landslide Inventory Characterization and Engineering Design for
Mitigation Works of Chure Area in Ten Districts. Central Department of
Environmental Science, Tribhuvan University and Government of Nepal,
President Chure-Tarai Madhesh Conservation Development Board,
Kathmandu.
UNDP (2009). Found on August 10, 2009, on: http://www.undp.org/mdtf/UN-REDD/
overview.shtml.
UNISDR (2004) Terminology of disaster risk reduction. United Nations International
Strategy for Disaster Reduction, Geneva.
http://www.unisdr.org/eng/library/lib-terminology-eng%20home.
UNISDR. (2009). Terminology on Disaster Risk Reduction. Geneva: United Nations.
Vandine, D.F., Moore, G., Wise, M., Vanbuskirk, C. & Gerath, R. (2004). Chapter 3 -
Technical Terms and Methods. In: Wise et al. (eds.) Landslide Risk Case
Studies in Forest Development Planning and Operations. B.C., Ministry of
Forests, Forest Science Program, Abstract of Land Management Handbook, 56:
13-26.
Vakhshoori, V. & Zare, M. (2018). Is the ROC curve a reliable tool to compare the
validity of landslide susceptibility maps? Geomatics, Natural Hazards and
Risk, 9(1), 249-266.
Van Westen, C. J. (1993). Application of geographic information systems to landslide
hazard zonation.
Van Westen, C.J., Soeters, R. & Rengers, N. (1994). GISSIZ: training package
Geographical Information Systems in slope instability zonation. In: STOP
Disasters, 18, pp. 24-25.
Van Westen, C.J. (1997). Statistical landslide hazard analysis. Application Guide,
ILWIS 2.1 for Windows. Enschede.
Van Westen, C. J., Van Asch, T. W. & Soeters, R. (2006). Landslide hazard and risk
zonation-why is it still so difficult? Bulletin of Engineering geology and the
Environment, 65(2), 167-184.

71
Van Westen, C.J., Alkema, D., Damen, M.C.J., Kerle, N. & Kingma, M.A. (2009).
Multi-Hazard Risk Assessment: Distance Education Course Guide Book.
United Nations University-ITC School on Disaster Geoinformation
Management; Tokyo, Japan.
Vozenilek, V. I. T. (2000). Landslide modelling for natural risk / hazard assessment
with GIS. Geographica, 35(Vozenilek 1998), 145–155.
Wang, F., Xu, P., Wang, C., Wang, N. & Jiang, N. (2017). Application of a GIS-based
slope unit method for landslide susceptibility mapping along the Longzi
River, Southeastern Tibetan Plateau, China. ISPRS Int J Geoinf. 6(6):172.
Westgate, K.N. & O’Keefe, P. (1976). Some Definitions of Disaster. Disaster
Research Unit Occasional Paper 4, Department of Geography, University of
Bradford, UK.
Wong, H.N., Ho, K.K.S. & Chan, Y.C. (1997). Assessment of consequence of landslides.
In: Cruden, R., Fell, R. (Eds.), Landslide Risk Assessment. Balkema,
Rotterdam, pp. 111–149.
Yagi, H. & Nakamura, S. (1995). Hazard mapping on large scale landslides in the lower
Nepal Himalayas. In: Proceedings of international seminar on water induced
disasters (ISWID-1995), DPTC-JICA, Kathmandu, Nepal, 162-168.
Yesilnacar, E. & Topal, T. (2005). Landslide susceptibility mapping: a comparison of
logistic regression and neural networks methods in a medium scale study,
Hendek region (Turkey). Engineering Geology. 79: 251-266.
Yilmaz, I. (2010). Comparison of landslide susceptibility mapping methodologies for
Koyulhisar, Turkey: conditional probability logistic regression, artificial
neural networks, and support vector machine. Environmental Earth Science.
61: 821-836.
Youssef, A.M, Pourghasemim, H.R, Pourtaghi, Z.S. & Al-Katheeri, M.M. (2016).
Landslide susceptibility mapping using random forest, boosted regression
tree, classification and regression tree, and general linear models and
comparison of their performance at Wadi Tayyah Basin, Asir Region, Saudi
Arabia. Landslides. 13(5):839–856.

72
Zare, M., Pourghasemi, H.R, Vafakhah, M. & Pradhan, B. (2012). Landslide
susceptibility mapping at Vaz Watershed (Iran) using an artificial neural
network model: a comparison between multilayer perceptron (MLP) and
radial basic function (RBF) algorithms. Arab J Geosci. 6(8):2873–2888.
https://lta.cr.usgs.gov/SRTM1Arc. Extracted on 18th April, 2018.
https://wiki.openstreetmap.org/wiki/Nepal/Roads. Extracted on 18th April, 2018.
https://www.fao.org/asiapacific/forestry-publication. Extracted on 25th September,
2018.

I
APPENDICES
Appendix 1: Letter from Palungtar municipality, Gorkha for the
completion of fieldwork at the site

II
Appendix 2: Letter from Rainas municipality, Lamjung for the
completion of fieldwork at the site

III
Appendix 3: Questionnaire for Key Informant Interview
1. Date of Survey:
2. Name of Interviewee: …………………………………………………
3. Name of Village/settlements: ……………………………
4. GPS Location: ………………………………………………………
5. Landslide event in the past (you observed)
S.N Date
/Year
Description of the event
(timing, causes)
Loss/damages
6. Landslides that caused your loss/damage
S.N Loss/damages Description of the event (amount) Date/Year
1. Human Death
2. House
Damaged
3. Economic
Loss
4. Agriculture
and forest area
5. Social Impact
(human lost,
robbery, etc.)
7. Do you have any idea on the cause of landslide in this area?
Yes No
If yes. What may be the causes of landslide?
i. ……………………………
ii. ……………………………
iii. …………………………….
8. Do you still feel that you are vulnerable to landslide? Yes
No
If yes, why do you think so?
…………………………………………………………………………….
9. Have you ever experienced the changes in the event in this area since last 10
years?

IV
Yes No
If yes:
Increasing Decreasing
10. What do you feel about the trend of landslide occurrence in this area?
a. Stable
b. Decreasing
c. Increasing
d. Rapidly Increasing
11. What do you think the impact of landslide would be in the future and why?
a. Stable
b. Medium
c. High
d. No idea
12. Access to information:
i. TV
ii. Radio
iii. Newspaper
iv. Friends
v. Others specify………………………………
13. Do you get any information/hints prior to landslide event and if yes, from
where?
Yes, I know Yes, somewhat
No No response
14. Do you have any traditional/indigenous knowledge to mitigate the landslide?
……………………………………………………………………………..
15. What is the percentage of population group which includes pregnant woman,
old people, population group less than 25 and greater than 60 years in this area?
a. 0-20
b. 20-40
c. 40-60
d. 60-80
16. Has your household taken any coping strategies or action to cope up with the
impact of landslide?
Yes No
If yes:
……………………………………………………………………………………
…
17. Do you think the local knowledge, skills, capacity and technical approaches are
not used for the control of landslide in the area?

V
a. No idea
b. Strongly agree
c. Moderately agree
d. Disagree
18. Is there any watershed management approach?
Yes No
If yes. What?
……………………………………………………………………………………
19. Is there any evacuation center identified?
Yes No
If yes. Where is it?
………………………………………………………………….
20. Resources availability and access:
i. Both available and accessible
ii. Available but not accessible
iii. Limited resources
21. Is there any private or government agencies working in landslides?
Yes No
If yes. Can you name the organization and the work done by them?
Organization Work done

VI
Appendix 4: List of Key Informant Interviewed
S.N Name of Key Informant Ward Chairperson/Senior Officers
1 Ramesh Neupane Rainas-1
2 Ram Chandra Adhikari Rainas-2
3 Swotantra Hamal Rainas-3
4 Jaiman Gurung Rainas-4
5 Nanda Bahadur Kumal Rainas-5
6 Rup Bahadur Tamang Rainas-6
7 Madhav Prasad Parajuli Rainas-7
8 Man Singh Gurung Dudhpokhari-1
9 Govinda Dawadi Dudhpokhari-2
10 Dhan Prasad Gurung Dudhpokari-4
11 Saroj Gurung Dudhpokhari-5
12 Bhim Lal Gurung Ajirkot-1
13 Toya Raj Gurung Ajirkot-3
14 Ramesh Adhikari Palungtar-3
15 Dipak Pandey Palungtar-5
16 Suk Man Gurung Siranchowk-1
17 Gyanendra Gurung Siranchowk-2
18 Bir Bahadur Thapa Siranchowk-3

VII
Appendix 5: Ward level vulnerability Scores of each indicators
S.N Municipality Wards Indicators Vulnerability
scores
Total
vulnerability
1 Ajirkot 2 Death 2 22
Impacted households 1
Damaged houses 1
Economic loss 1
Impacted agricultural
and forest area
1
Social Impact 2
Trends of landslide
occurrence
2
Possible impact of
landslide
2
Change is seasonal
calendar
1
Change in
temperature
1
Access to source 2
Population analysis 2
Education,
awareness, skills
2
Organizational help 2
2 Ajirkot 3 Death 2
23
Impacted households 1
Damaged houses 1
Economic loss 1

VIII
Impacted agricultural
and forest area
1
Social Impact 1
Trends of landslide
occurrence
2
Possible impact of
landslide
3
Access to source 3
Population analysis 2
Change is seasonal
calendar
1
Change in
temperature
1
Education,
awareness, skills
2
Organizational help 2
3 Siranchok 1 Death 2 23
Impacted households 1
Damaged houses 1
Economic loss 1
Impacted agricultural
and forest area
1
Social Impact 2
Trends of landslide
occurrence
2
Possible impact of
landslide
3

IX
Change is seasonal
calendar
1
Change in
temperature
1
Access to source 2
Population analysis 2
Education,
awareness, skills
2
Organizational help 2
4 Siranchok 2 Death 2 25
Impacted households 1
Damaged houses 1
Economic loss 3
Impacted agricultural
and forest area
1
Social Impact 2
Trends of landslide
occurrence
2
Possible impact of
landslide
2
Change is seasonal
calendar
2
Change in
temperature
1
Access to source 2
Population analysis 2
Education,
awareness, skills
2
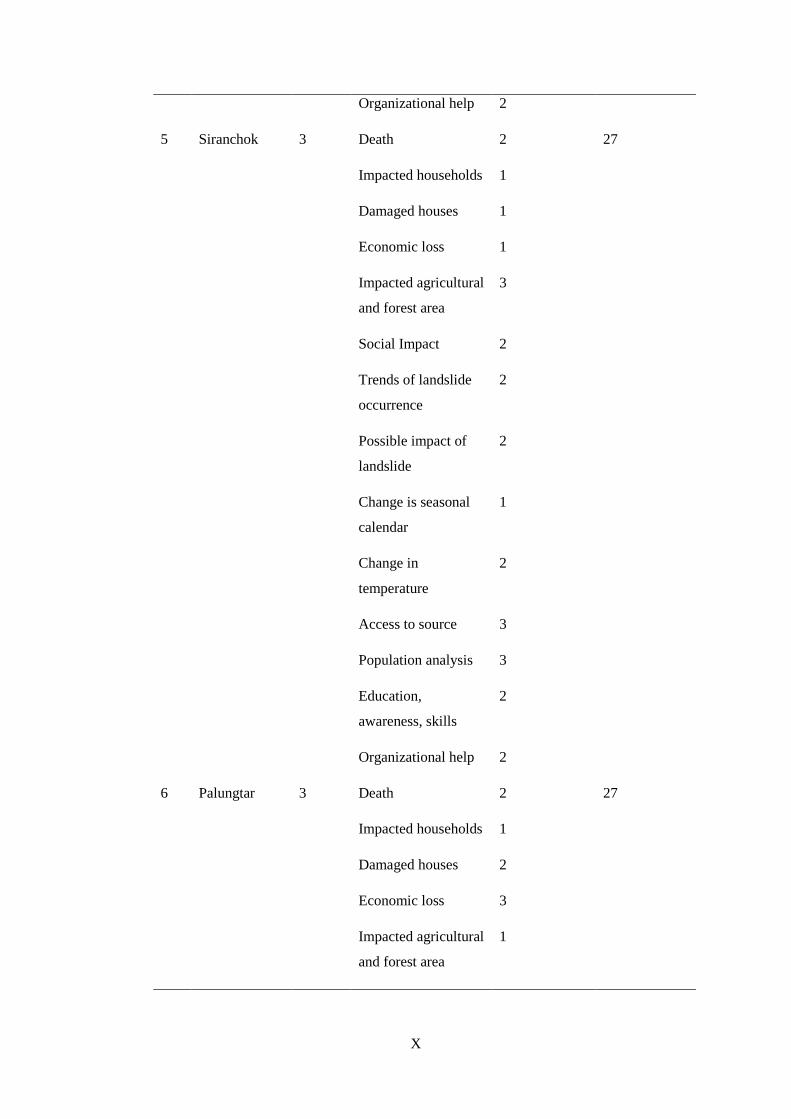
X
Organizational help 2
5 Siranchok 3 Death 2 27
Impacted households 1
Damaged houses 1
Economic loss 1
Impacted agricultural
and forest area
3
Social Impact 2
Trends of landslide
occurrence
2
Possible impact of
landslide
2
Change is seasonal
calendar
1
Change in
temperature
2
Access to source 3
Population analysis 3
Education,
awareness, skills
2
Organizational help 2
6 Palungtar 3 Death 2 27
Impacted households 1
Damaged houses 2
Economic loss 3
Impacted agricultural
and forest area
1

XI
Social Impact 2
Trends of landslide
occurrence
2
Possible impact of
landslide
2
Change is seasonal
calendar
1
Change in
temperature
2
Access to source 3
Population analysis 2
Education,
awareness, skills
2
Organizational help 2
7 Palungtar 5 Death 2
22
Impacted households 1
Damaged houses 1
Economic loss 1
Impacted agricultural
and forest area
1
Social Impact 2
Trends of landslide
occurrence
2
Possible impact of
landslide
2
Change is seasonal
calendar
1

XII
Change in
temperature
1
Access to source 2
Population analysis 2
Education,
awareness, skills
2
Organizational help 2
8 Rainas 1 Death 2
25
Impacted households 1
Damaged houses 1
Economic loss 3
Impacted agricultural
and forest area
1
Social Impact 1
Trends of landslide
occurrence
2
Possible impact of
landslide
2
Change is seasonal
calendar
1
Change in
temperature
1
Access to source 3
Population analysis 2
Education,
awareness, skills
2
Organizational help 3
9 Rainas 2 Death 2 23

XIII
Impacted households 1
Damaged houses 1
Economic loss 1
Impacted agricultural
and forest area
1
Social Impact 2
Trends of landslide
occurrence
2
Possible impact of
landslide
2
Change is seasonal
calendar
1
Change in
temperature
2
Access to source 2
Population analysis 2
Education,
awareness, skills
2
Organizational help 2
10 Rainas 3 Death 2 29
Impacted households 1
Damaged houses 1
Economic loss 2
Impacted agricultural
and forest area
2
Social Impact 2
Trends of landslide
occurrence
3

XIV
Possible impact of
landslide
3
Change is seasonal
calendar
2
Change in
temperature
2
Access to source 3
Population analysis 2
Education,
awareness, skills
2
Organizational help 2
11 Rainas 4 Death 2 23
Impacted households 1
Damaged houses 1
Economic loss 2
Impacted agricultural
and forest area
1
Social Impact 2
Trends of landslide
occurrence
2
Possible impact of
landslide
2
Change is seasonal
calendar
1
Change in
temperature
1
Access to source 2
Population analysis 2

XV
Education,
awareness, skills
2
Organizational help 2
12 Rainas 5 Death 2 22
Impacted households 1
Damaged houses 1
Economic loss 1
Impacted agricultural
and forest area
1
Social Impact 2
Trends of landslide
occurrence
2
Possible impact of
landslide
2
Change is seasonal
calendar
1
Change in
temperature
1
Access to source 2
Population analysis 2
Education,
awareness, skills
2
Organizational help 2
13 Rainas 6 Death 2 26
Impacted households 2
Damaged houses 3
Economic loss 1

XVI
Impacted agricultural
and forest area
2
Social Impact 2
Trends of landslide
occurrence
2
Possible impact of
landslide
2
Change is seasonal
calendar
1
Change in
temperature
1
Access to source 2
Population analysis 2
Education,
awareness, skills
2
Organizational help 2
14 Rainas 7 Death 2 33
Impacted households 3
Damaged houses 3
Economic loss 2
Impacted agricultural
and forest area
3
Social Impact 2
Trends of landslide
occurrence
2
Possible impact of
landslide
2

XVII
Change is seasonal
calendar
2
Change in
temperature
2
Access to source 2
Population analysis 3
Education,
awareness, skills
3
Organizational help 2
15 Dudhpokhari 1 Death 2
23
Impacted households 1
Damaged houses 1
Economic loss 1
Impacted agricultural
and forest area
1
Social Impact 2
Trends of landslide
occurrence
2
Possible impact of
landslide
2
Change is seasonal
calendar
1
Change in
temperature
1
Access to source 2
Population analysis 2
Education,
awareness, skills
2

XVIII
Organizational help 3
16 Dudhpokhari 2 Death 2
23
Impacted households 1
Damaged houses 1
Economic loss 1
Impacted agricultural
and forest area
1
Social Impact 1
Trends of landslide
occurrence
1
Possible impact of
landslide
3
Change is seasonal
calendar
1
Change in
temperature
1
Access to source 3
Population analysis 2
Education,
awareness, skills
2
Organizational help 3
17 Dudhpokhari 4 Death 2 29
Impacted households 2
Damaged houses 2
Economic loss 3
Impacted agricultural
and forest area
1

XIX
Social Impact 2
Trends of landslide
occurrence
2
Possible impact of
landslide
2
Change is seasonal
calendar
1
Change in
temperature
2
Access to source 3
Population analysis 2
Education,
awareness, skills
2
Organizational help 3
18 Dudhpokhari 5 Death 2 23
Impacted households 1
Damaged houses 1
Economic loss 1
Impacted agricultural
and forest area
1
Social Impact 2
Trends of landslide
occurrence
2
Possible impact of
landslide
2
Change is seasonal
calendar
1

XX
Change in
temperature
1
Access to source 2
Population analysis 3
Education,
awareness, skills
2
Organizational help 2

XXI
Appendix 6: Rainfall stations in Chepe vicinity
S.N Station
number
Name of station Latitude Longitude Average rainfall
(mm)
1 808 Bandipur 27.93333333 84.416667 1678.847
2 817 Damauli 27.966667 84.283333 1719.187
3 823 Gharedhunga 28.2 84.616667 2920.9
4 809 Gorkha 28 84.616667 1566.95
5 802 Khudibazar
28.283333 84.366667 3174.38
6 807 Kunchha 28.133333 84.35 2598.737
7 801 Jagat 28.366666 84.9 1310.367
8 815 Khairenitar 28.033333 84.1 2218.41
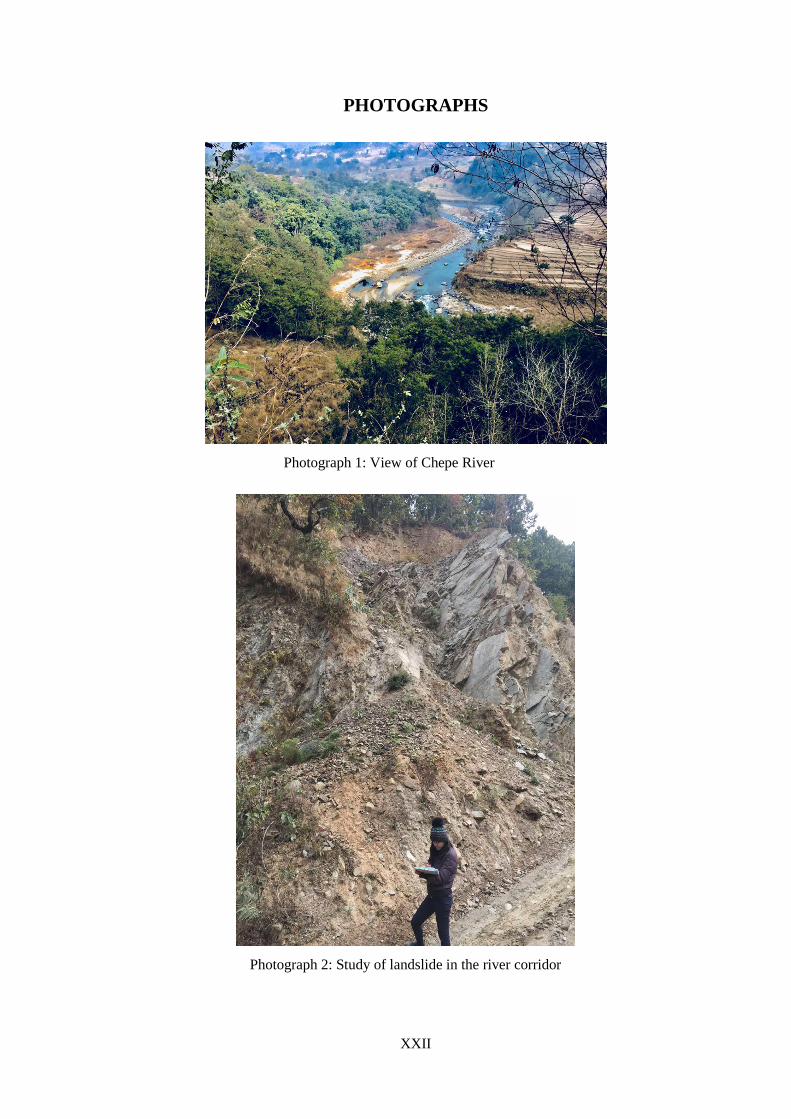
XXII
PHOTOGRAPHS
Photograph 2: Study of landslide in the river corridor
Photograph 1: View of Chepe River

XXIII
Photograph 3: Landslide in the study area
Photograph 4: Landslide in the study area

XXIV
Photograph 5: Questionnaire with the local residents
Photograph 6: Questionnaire with the local residents

XXV
Photograph 7: KII with Mr. Ramesh Neupane (Ward Chairperson,
Rainas-1)
Photograph 8: Created gully resulting the landslide (Rainas, Lamjung)
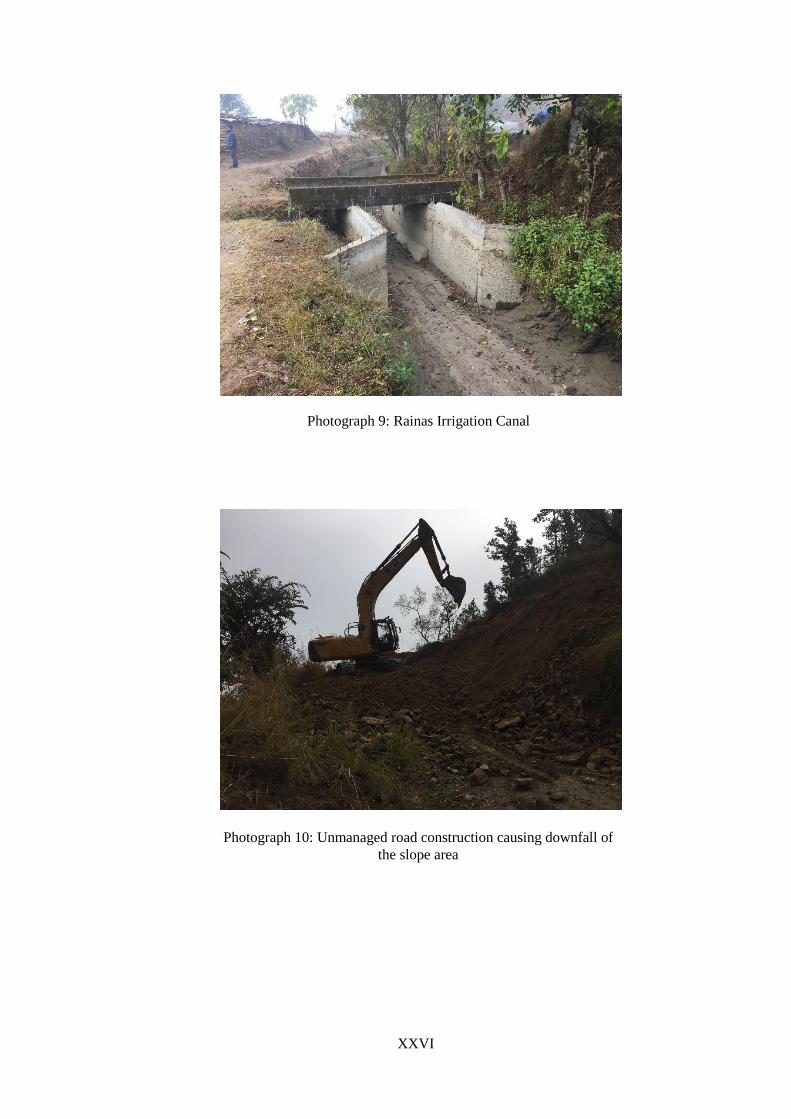
XXVI
Photograph 9: Rainas Irrigation Canal
Photograph 10: Unmanaged road construction causing downfall of
the slope area

XXVII
Photograph 11: Gabion wall as control measure of landslide
Photograph 12: Landslide caused due to the river cut-off