langdorf pmid 25263233
TRANSCRIPT

UC IrvineUC Irvine Previously Published Works
TitleComparison of US emergency department acute asthma care quality: 1997-2001 and 2011-2012.
Permalinkhttps://escholarship.org/uc/item/4bh1b5hh
JournalThe Journal of allergy and clinical immunology, 135(1)
ISSN0091-6749
AuthorsHasegawa, KoheiSullivan, Ashley FTsugawa, Yusukeet al.
Publication Date2015
DOI10.1016/j.jaci.2014.08.028 Peer reviewed
eScholarship.org Powered by the California Digital LibraryUniversity of California

Comparison of US emergency department acute asthma care quality: 1997-2001 and 2011-2012 Kohei Hasegawa, MD, MPH,a Ashley F. Sullivan, MPH, MS,a Yusuke Tsugawa, MD, MPH,b Stuart J. Turner, BPharm, MPH,c Susan Massaro, PharmD, MPH,c Sunday Clark, ScD,d Chu-Lin Tsai, MD, ScD,a and Carlos A. Camargo, Jr, MD, DrPH,a on behalf of the MARC-36 Investigators* Boston and Cambridge, Mass, East Hanover, NJ, and New York, NY
Background: It remains unclear whether the quality of acute asthma care in US emergency departments (EDs) has improved over time. Objectives: We investigated changes in concordance of ED asthma care with 2007 National Institutes of Health guidelines, identified ED characteristics predictive of concordance, and tested whether higher concordance was associated with lower risk of hospitalization. Methods: We performed chart reviews in ED patients aged 18 to 54 years with asthma exacerbations in 48 EDs during 2 time periods: 1997-2001 (2 prior studies) and2011-2012 (new study). Concordance with guideline recommendations was evaluated by using item-by-item quality measures and composite concordance scores at the patient and ED levels; these scores ranged from 0 to 100. Results: The analytic cohort comprised 4039 patients (2119 from 1997-2001 vs 1920 from 2011-2012). Over these 16 years, emergency asthma care became more concordant with level A recommendations at both the patient and ED levels (both P < .001). By contrast, concordance with non–level A recommendations (peak expiratory flow measurement and timeliness) decreased at both the patient (median score, 75 [interquartile range, 50-100] to 50 [interquartile range, 33-75], P <.001) and ED (mean score, 67 [SD, 7] to 50 [SD, 16], P <.001) levels. Multivariable analysis demonstrated ED concordance was lower in Southern and Western EDs compared with Midwestern EDs. After adjusting for severity, guideline concordant care was associated with lower risk of hospitalization (odds ratio, 0.37; 95% CI, 0.26-0.53). Conclusions: Between 1997 and 2012, we observed changes in the quality of emergency asthma care that differed by level of guideline recommendation and substantial interhospital and geographic variations. Greater concordance with guideline recommended management might reduce unnecessary hospitalizations. (J Allergy Clin Immunol 2015; 135:73-80.) From athe Department of Emergency Medicine, Massachusetts General Hospital, Harvard Medical School, Boston; bthe Harvard Interfaculty Initiative in Health Policy, Cambridge; cNovartis Pharmaceuticals, East Hanover; and dthe Department of Emergency Medicine, Weill Cornell Medical College, New York. *The following individuals were MARC-36 site investigators and collaborators on this article: Annette O. Arthur, PharmD, University of Oklahoma School of Community Medicine–Hillcrest Medical Center, Tulsa, Okla; Jeanne M. Basior, MD, Buffalo General Hospital, Buffalo, NY;

Brigitte M. Baumann, MD, MSCE, Cooper Medical School of Rowan University, Camden, NJ; Ronald S. Benenson, MD, York Hospital, York, Pa; Francis L. Counselman, MD, Sentara Norfolk General Hospital, Norfolk,Va; Cameron Crandall, MD, PhD, University of New Mexico Health Sciences Center, Albuquerque, NM; Rita K. Cydulka, MD, MS, MetroHealth Medical Center, Cleveland, Ohio; Michael J. Drescher, MD, Hartford Hospital, Hartford, Conn; Daniel J. Egan, MD, Mount Sinai St Luke’s and Mount Sinai Roosevelt Hospitals, New York, NY; Christopher Fee, MD, University of California San FranciscoMedical Center, San Francisco, Calif; Theodore J. Gaeta, DO, MPH, New York Methodist Hospital, Brooklyn, NY; Michael G. Gonzalez, MD, Ben Taub General Hospital, Houston, Tex; John E. Gough, MD, East Carolina University, VidantMedical Center, Greenville, NC; Blanca Grand, DO, St Barnabas Hospital, Bronx, NY; Richard O. Gray, MD, Hennepin County Medical Center, Minneapolis, Minn; Megan Healy, MD, Temple University Hospital, Philadelphia, Pa; Eva Tovar Hirashima, MD, MPH, Massachusetts General Hospital, Boston, Mass; Talmage M. Holmes, PhD, MPH, University of Arkansas for Medical Sciences, Little Rock, Ark; P. Charles Inboriboon, MD, MPH, Truman Medical Center Hospital, Kansas City, Mo; Mark J. Leber, MD, MPH, Brooklyn Hospital Center, New York, NY; Bernard L. Lopez, MD, MS, Thomas Jefferson University Hospital, Philadelphia, Pa; Frank LoVecchio, DO, Maricopa Medical Center, Phoenix, Ariz; Rashid F. Kysia, MD, MPH, John H. Stroger Jr Hospital of Cook County, Chicago, Ill; Mark I. Langdorf, MD, MHPE, University of California Irvine Medical Center, Orange, Calif; Joseph Montibeller, MD, Allegheny General Hospital, Pittsburgh, Pa; Dan Mosely, MD, University of Texas Health Science Center at San Antonio, San Antonio, Tex; Joseph S. Myslinski, MD, Palmetto Health Richland, Columbia, SC; Stephanie A. Nonas, MD, Oregon Health & Science University Hospital, Portland, Ore; Richard M. Nowak, MD, MBA, Henry Ford Hospital, Detroit, Mich; Daniel J. Pallin, MD, MPH, Brigham andWomen’s Hospital, Boston, Mass; Claire Pearson, MD, MPH, Detroit Receiving Hospital, Detroit, Mich; Veronica Pei, MD, University of Maryland Medical Center, Baltimore, Md; Ava E. Pierce, MD, University of Texas Southwestern Medical Center–Parkland Memorial Hospital, Dallas, Tex; John T. Powell, MD, Christiana Hospital, Newark, Del; Stewart O. Sanford, MD, Albert Einstein Medical Center, Philadelphia, Pa; Nathan Shapiro, MD, Beth Israel Deaconess Medical Center, Boston, Mass; Patrick Shen, MD, Mercy Hospital of Philadelphia, Philadelphia, Pa; Robert A. Silverman, MD, Long Island Jewish Medical Center,New Hyde Park,NY; Howard A. Smithline, MD, MS, Baystate Medical Center, Springfield, Mass; Brian Snyder, MD, University of California San Diego Medical Center, San Diego, Calif; Kirk A. Stiffler, MD, MPH, Akron City Hospital, Akron, Ohio; D. Matthew Sullivan, MD, Carolinas Medical Center, Charlotte, NC; Suzanne S. Teuber, MD, University of California Davis Medical Center, Sacramento, Calif; J. Adrian Tyndall, MD, MPH, Shands Hospital at the University of Florida, Gainsville, Fla; Nancy E. Wang, MD, Stanford University Medical Center, Palo Alto, Calif; MuhammadWaseem, MD, MS, Lincoln Medical and Mental Health Center,NewYork,NY; and Eric J.Wasserman, MD, Newark Beth Israel Medical Center, Newark, NJ. Supported by a grant from Novartis Pharmaceuticals Corporation to Massachusetts General Hospital (principal investigator: Camargo). The sponsor had no role in the conduct of the study, nor collection, management, or analysis of the data. Disclosure of potential conflict of interest: Y. Tsugawa is employed by St Luke’s Life Science Institute and has received research support from Harvard University, Honjo International

Foundation, and Hoshi General Hospital. S. J. Turner is employed by Novartis. S. Massaro is employed by, has received travel support from, and has stock/stock options in Novartis. S. Clark has received a service agreement from Massachusetts General Hospital for participation in a multicenter study. C. A. Camargo has received research support from Novartis and Teva and has consultant arrangements with GlaxoSmithKline, Merck, Novartis, and Teva. The rest of the authors declare that they have no relevant conflicts of interest.
Asthma remains an important public health burden in the United States. Asthma prevalence is at historically high levels, affecting 26 million persons in 2010.1 There are 1.8 million emergency department (ED) visits and 440,000 hospitalizations for asthma,1 with an estimated economic burden of $56 billion annually.2 In this context the US government has identified improving asthma care as a national objective in ‘‘Healthy People 2020’’ through ‘‘increasing the proportion of persons with current asthma who receive appropriate asthma care according to the guidelines.’’3
Concordance of health care delivery with quality measures has improved over time in patients with several disease conditions, such as heart failure, acute myocardial infarction, and pneumonia.4-6 Compared with these emergency conditions, however, changes in the quality of emergency asthma care have attracted less attention. An analysis of survey data reported upward trends in the use of systemic corticosteroids and inhaled anticholinergic agents in the ED between 1993 and 2005.7 However, their inferences are limited because of selection bias, potential errors in data collection and coding, and unmeasured confounders (eg, severity). Additionally, this study did not address important aspects of emergency asthma care (eg, assessment of airflow limitation and timeliness measures). Therefore it remains unclear whether the quality of emergency asthma care increased or decreased over time, particularly after the publication of the 2007 National Institutes of Health (NIH) guidelines.
To address this knowledge gap, we analyzed data from 3 multicenter observational studies of patients with asthma exacerbation; 2 studies were conducted during 1997-2001, and the third was conducted during 2011-2012. Our study objectives were3-fold: (1) to investigate changes in the concordance of asthma exacerbation management in the 48 EDs with recommendations in the NIH guidelines over these 16 years, (2) to identify ED characteristics associated with lower guideline concordance, and (3) to test whether higher concordance was associated with lower risk of hospitalization for asthma. METHODS Study design and setting
The present analysis combined data from 3 multicenter observational studies of adult ED patients with asthma exacerbation that were performed in 1997-2001 and 2011-2012 as part of the Multicenter Airway Research Collaboration (MARC).MARC is a part of the Emergency Medicine Network (EMNet), a collaboration of more than 225 EDs.8
From 1997 to 2001, EMNet conducted 2 observational studies of adult ED patients with asthma exacerbations (the MARC-2 and MARC-5 studies). These studies consisted of ED interviews to assess patients’ characteristics and chart reviews to assess ED presentation, asthma management, and disposition. The design, setting, and methods of data collection used in the studies have been reported previously.9, 10

We recently completed the MARC-36 study, a multicenter chart review study that sought
to characterize adult ED patients with asthma exacerbations and to determine the quality of their emergency care during 2011-2012. To better evaluate temporal changes in emergency asthma care, we recruited EDs by inviting the sites that had participated in the earlier MARC studies during 1997-2001. A total of 48 US EDs in 23 states completed the MARC-36 study (see Table E1 and Fig E1 in this article’s Online Repository at www.jacionline. org); the 1997-2001 versus 2011 2012 comparison was based on the same 48 EDs during both time periods. In all of these studies, patients were managed at the discretion of the treating physician. The institutional review board of each participating center approved the studies. Abbreviations used ED: Emergency department EMNet: Emergency Medicine Network ICU: Intensive care unit IQR: Interquartile range MARC: Multicenter Airway Research Collaboration NIH: National Institutes of Health PEF: Peak expiratory flow Study participants Using International Classification of Diseases, Ninth Revision, Clinical Modification, code 493.xx,11 each site identified all visits with a primary ED or hospital discharge diagnosis of asthma during a 12-month period between January 1, 2011, and December 31, 2012 (ie, sites had a 24-month window from which to select the 12-month study period). Similar to the 1997-2001 studies, the inclusion criteria were ED visits made by adult patients aged 18 to 54 years and a history of physician-diagnosed asthma before the index ED visit. We excluded ED visits made by patients with a history of physician diagnosed chronic obstructive pulmonary disease, transfer ED visits, repeat ED visits, or ED visits not prompted largely by an asthma exacerbation. In the case of repeat visits, only the first randomly sampled ED visit was included. Therefore each ED visit in the study represented a unique ED patient. Data measurements
In the MARC-36 study onsite chart reviewers at each site reviewed 40 ED charts that were randomly selected by the EMNet Coordinating Center at Massachusetts General Hospital. All reviewers participated in a 1-hour Web conference training session, and then reviewers completed 2 practice charts, which were evaluated with a ‘‘criterion standard.’’ If a reviewer’s accuracy was less than 80% per chart, the reviewer was retrained.
ED-level covariates. A key informant survey at each participating site was conducted to collect data on ED characteristics. Collected covariates included annual volume of ED visits, annual volume of asthma-related ED visits, affiliation with an emergency medicine residency program, urban-rural distinction, and region. Urban-rural distinctions were made according to the 2003 Urban Influences Codes.12 Geographic regions were defined according to Census Bureau Boundaries.13

Patient-level covariates. In the MARC-36 study data abstraction was performed with a standardized form and included patients’ demographics, past asthma history, current asthma medications, presentation, peak expiratory flow (PEF), asthma management in the ED or at discharge, and ED disposition. Severity of asthma exacerbation was classified according to the initial PEF at ED presentation as follows: mild, 400 L/min or greater for men and 300 L/min or greater for women; moderate, 250 to 399 L/min for men and 200 to 299 L/ min for women; severe, 150 to 249 L/min for men and 120 to 199 L/min for women; and very severe, less than 150 L/min for men and less than 120 L/ min for women.14 This approach was used in earlier MARC studies.9,10,15,16
Quality measures
Process measures. On the basis of common recommendations included in the 1997 and 2007 NIH guidelines17-19 and using methods similar to those in the National Emergency Department Safety Study, 14 we derived a priori 9 explicit process measures. These process measures included 5 level A and 4 non–level A evidence-based measures (2 level B evidence-based treatments and 2 additional timeliness measures; see Table E2 in this article’s Online Repository at www.jacionline.org).
We summarized these 9 evidence-based process measures by using a patient composite concordance score, which was computed as the sum of guideline-concordant care provided from the patient’s total number of eligible opportunities.20 These scores were then averaged across patients at the ED level to obtain ED composite scores.14 These scores ranged from 0 to 100, with a score of 100 indicating perfect guideline concordance.21 To assess whether the concordance varied by level of evidence, we calculated the scores for level A and non–level A guideline-recommended measures separately.
Outcome measures. The outcome of interest was hospitalization for asthma exacerbation, which was defined as hospital admission to an observation unit, inpatient unit, or intensive care unit (ICU). Data analysis
Summary statistics at both the ED and patient levels were presented as means (with SDs), medians (with interquartile ranges [IQRs]), and proportions (with 95% CIs). At the patient level, the change in the item-by-item and overall concordance scores between the time periods were examined by using x2 tests or Wilcoxon-Mann-Whitney tests at the patient level. At the ED level, these changes were examined by using paired t tests to account for correlations within sites. Complete case analyses were used for these unadjusted analyses. Multiple imputation (using the multivariate normal model) was used for the multivariable regression analyses at both the ED and patient levels to account for the variables with significant missing data (see the Methods section in this article’s Online Repository at www.jacionline.org).22
ED-level analysis. Using the 2011-2012 data, we examined associations between ED characteristics and overall ED concordance scores by using multivariable linear regression, controlling for a predefined set of aggregate patient mix at the ED level (ie, age, sex, respiratory

rate, oxygen saturation, and initial PEF at ED presentation). The missing values for the patient-level characteristics were multiply imputed and then summarized for each ED (see the Methods section in this article’s Online Repository). In the sensitivity analysis, to examine the robustness of the findings, we also generated the ED-level composite concordance scores by using opportunity-based methods.21
Patient-level analysis. To examine the association of patients’ composite concordance
scores with the risk of hospitalization for asthma exacerbation in the 2011-2012 period, we constructed 2 regression models. First, we fitted an unadjusted model that included only the patient’s composite score as the independent variable. Second, we fitted a 2-level mixed-effects model with binomial response by using random intercepts for EDs to account for the clustering of patients at the ED level. We adjusted for both patient-level variables (ie, age, sex, race/ethnicity, history of intubation for asthma, current use of systemic corticosteroids and inhaled corticosteroids, comorbidities, duration of symptoms, respiratory rate, oxygen saturation, and initial PEF at ED presentation) and ED-level variables (ie, annual ED visit volume, annual ED asthma volume, and region). For the models, only 4 level A evidence-based care treatments were used for computing the composite scores (ie, inhaled b-agonists, inhaled anticholinergic agents, and systemic corticosteroids and not receiving methylxanthines in the ED) to provide more weight to the treatments that have been shown to reduce asthma-related hospitalizations. 14,19,23,24 The composite scores were treated as a dichotomous variable given the highly skewed distribution. Additionally, dichotomizing concordance into 100% concordance versus other concordance allowed us to examine how results differed using an all-or-none quality metric.14, 25
In the sensitivity analysis, to address potential reverse causations in the association between guideline concordance and risk of hospitalization (ie, critically ill patients were hospitalized quickly before receiving all of the recommended care in the ED), we repeated the hospitalization model, excluding patients hospitalized within 1 hour of ED arrival or those admitted directly to the ICU. Additionally, to address the effect of patients with a prolonged ED length of stay, we also repeated the model using a different definition of the outcome (ie, hospitalization or ED length of stay >360 minutes). All tests were 2-tailed, and a P value of less than .05 was regarded as statistically significant. Multiple imputation was performed with Stata 12.0 software (StataCorp, College Station, Tex); other analyses were performed with SAS 9.3 software (SAS Institute, Cary, NC). RESULTS ED and patient characteristics The analytic cohort comprised 4039 adult patients: 2119 patients from 1997-2001 versus 1920 patients from 2011-2012. All presented with an asthma exacerbation to one of the 48 participating EDs. Over these 16 years, participating EDs experienced a significant increase in annual volume of ED visits and a decrease in the number of asthma-related ED visits (both P < .01, Table I). The proportion of EDs affiliated with an emergency medicine residency program increased during the time periods (P <.001). Participating EDs are all urban but located in different regions across the United States.

ED patients with asthma exacerbations in more recent years were younger and less likely to be female, of non-Hispanic white race, of Hispanic ethnicity, and current smokers (all P <.05, Table I). Over the 2 time periods, chronic asthma burden decreased but remained high. For example, in the 2011-2012 period, 15% were hospitalized for asthma exacerbations in the past year, and 43% had visited the ED for asthma exacerbations. Likewise, use of long-term control medications increased over the time periods but remained underused in this population. For example, the proportion of asthmatic patients taking inhaled corticosteroids increased from 17% to 35% (P < .001). At ED presentation, according to the initial PEF results, 87% of patients were classified as having at least a moderate exacerbation in the 1997-2001 period and 80% in the 2011-2012 period (P < .001). After ED management, 21% of patients were hospitalized in the 1997-2001 period and 17% in the 2011-2012 period (P < .001).
Change in performance on quality measures
Table II summarizes the item-by-item guideline recommended management and overall concordance scores according to the time period. At the patient level, the median overall concordance score decreased from 80 (IQR, 67-89) in the 1997-2001 period to 75 (IQR, 57-86; P < .001) in the 2011-2012 period. This decrease was driven by significant decreases in concordance with the non–level A recommendations (ie, use of PEF assessment and timeliness measures) from a median score of 75 (IQR, 50-100) to 50 (IQR, 33-75). By contrast, the concordance with the level A recommendations improved, with significant increases in use of inhaled anticholinergic agents and systemic corticosteroids in the ED and in provision of an oral corticosteroid prescription at ED discharge (all P < .001).
At the ED level, the overall concordance with the guideline recommendations also
decreased, and its variation across EDs became larger over the 2 time periods, with a mean composite score of 75 (SD, 5) to 72 (SD, 8; P5.02). In the 2011-2012 period the best-performing ED had a score of 89, whereas the worst performing ED had a score of 59. Similar to the findings at the patient level, this decrease in overall score was driven by significant decreases in concordance with the non–level A recommendations (Fig 1), such as PEF assessment (see Fig E2 in this article’s Online Repository at www.jacionline.org) and timeliness measures (see Fig E3 in this article’s Online Repository at www.jacionline.org), with larger variations in these measures across EDs (all P < .001). By contrast, the concordance with level A recommendations improved over these 16 years (Fig 2). ED characteristics and ED-level guideline Concordance
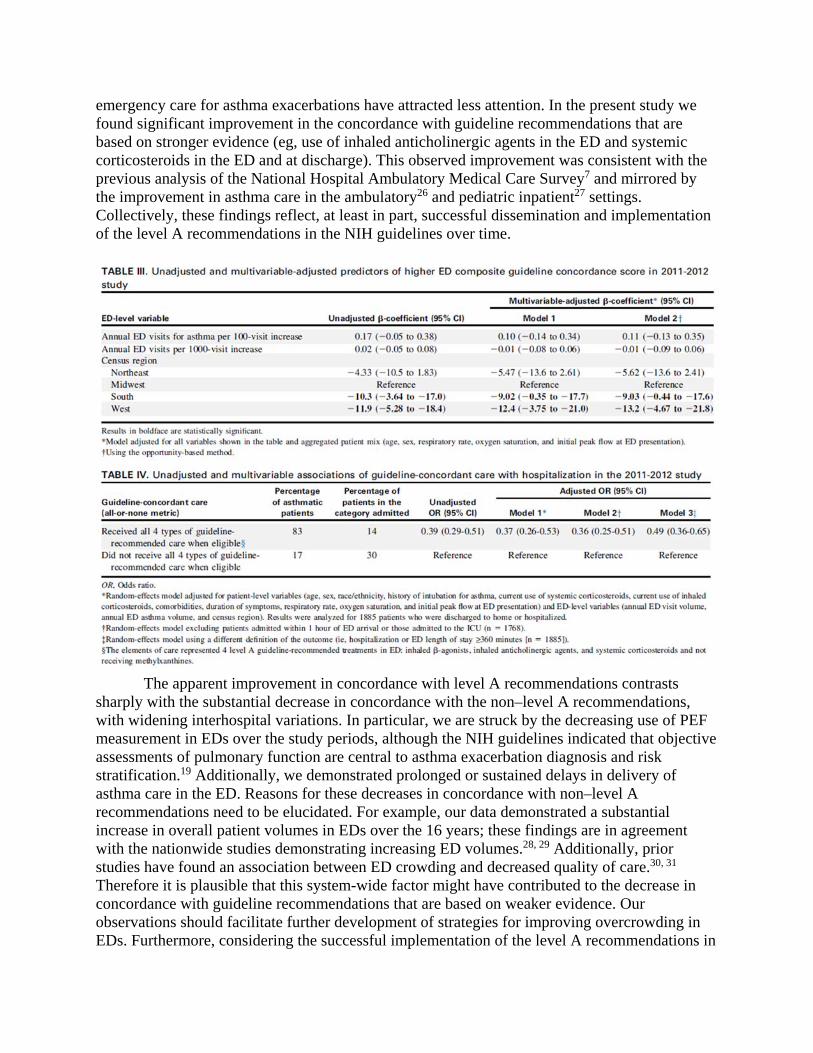
Table III shows ED characteristics associated with ED level guideline concordance in the 2011-2012 period. After adjusting for aggregated patient mix, Southern EDs and Western EDs were less likely to deliver guideline concordant care than Midwestern EDs. The sensitivity analysis using the opportunity-based method did not change the results materially.

Patient-level guideline concordance and risk of hospitalization
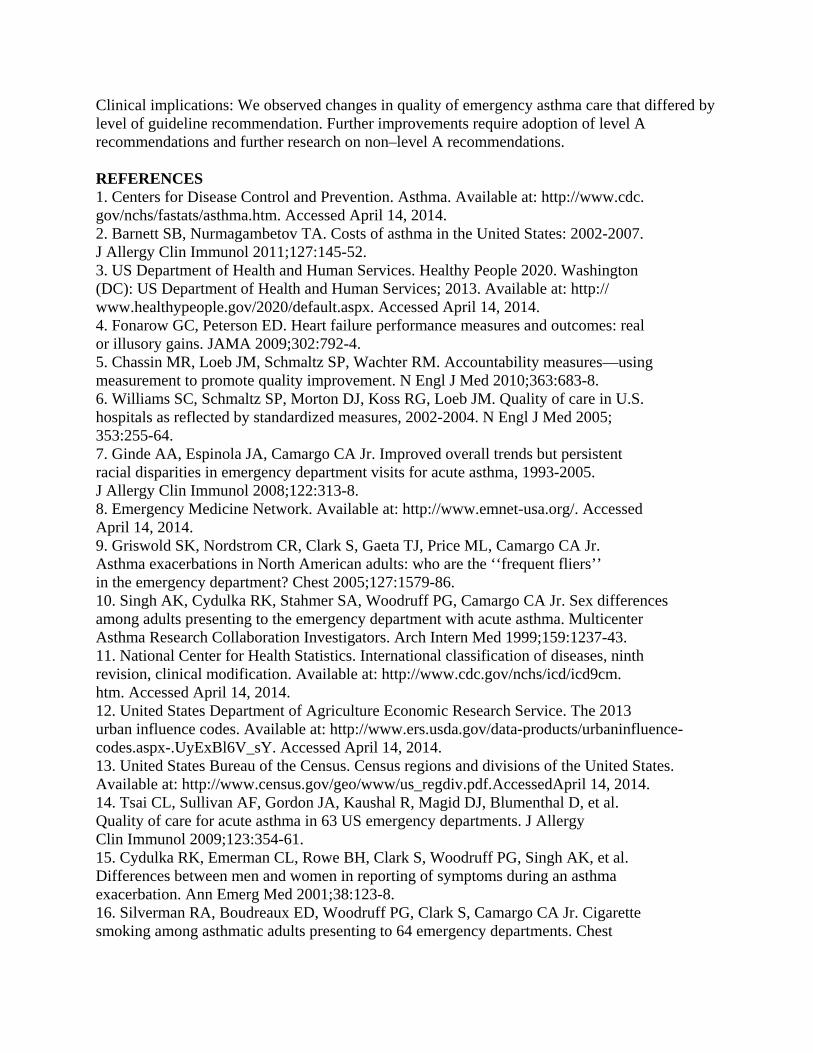
In the 2011-2012 period, approximately 80% of patients received care perfectly concordant with the 4 level A recommendations (Table IV). These patients had reduced risk of hospitalization compared with the others (14% vs 30%, P <.001). After adjusting for 14 patient- and ED-level characteristics, risk of hospitalization remained significantly lower in patients who received fully concordant care in the ED (odds ratio, 0.37; 95% CI, 0.26-0.53; P < .001). Likewise, in sensitivity analyses the significant association persisted with excluding patients admitted within 1 hour of ED presentation or admitted to the ICU and with using a different definition for the outcome (ie, hospitalization or prolonged ED length of stay; Table IV).

DISCUSSION
In this 48-center analysis based on 3 observational studies of 4039 adults with asthma exacerbation over 16 years, we observed changes in the quality of emergency asthma care that differed by level of guideline recommendation. Although emergency care became highly concordant with level A guideline recommendations, the concordance with non–level A recommendations (ie, use of PEF measurement and timeliness measures) decreased. Additionally, the variations in these measures became larger across the EDs, with significant regional differences. Our data also demonstrated a strong association between quality of care and patient outcomes. More specifically, complete concordance with the NIH asthma guidelines was associated with a significantly reduced risk of hospitalization.
The extent to which guideline-recommended asthma care is provided in the real-world setting is of great interest to a variety of stakeholders. However, to date, changes in the quality of
emergency care for asthma exacerbations have attracted less attention. In the present study we found significant improvement in the concordance with guideline recommendations that are based on stronger evidence (eg, use of inhaled anticholinergic agents in the ED and systemic corticosteroids in the ED and at discharge). This observed improvement was consistent with the previous analysis of the National Hospital Ambulatory Medical Care Survey7 and mirrored by the improvement in asthma care in the ambulatory26 and pediatric inpatient27 settings. Collectively, these findings reflect, at least in part, successful dissemination and implementation of the level A recommendations in the NIH guidelines over time.
The apparent improvement in concordance with level A recommendations contrasts
sharply with the substantial decrease in concordance with the non–level A recommendations, with widening interhospital variations. In particular, we are struck by the decreasing use of PEF measurement in EDs over the study periods, although the NIH guidelines indicated that objective assessments of pulmonary function are central to asthma exacerbation diagnosis and risk stratification.19 Additionally, we demonstrated prolonged or sustained delays in delivery of asthma care in the ED. Reasons for these decreases in concordance with non–level A recommendations need to be elucidated. For example, our data demonstrated a substantial increase in overall patient volumes in EDs over the 16 years; these findings are in agreement with the nationwide studies demonstrating increasing ED volumes.28, 29 Additionally, prior studies have found an association between ED crowding and decreased quality of care.30, 31 Therefore it is plausible that this system-wide factor might have contributed to the decrease in concordance with guideline recommendations that are based on weaker evidence. Our observations should facilitate further development of strategies for improving overcrowding in EDs. Furthermore, considering the successful implementation of the level A recommendations in

the EDs, building more robust evidence on the non–level A recommendations (eg, PEF measurement and delivery of timely emergency asthma care), coupled with improved disseminations of these findings, could further improve care for ED patients with asthma exacerbations.
We were also struck by the wide variations in quality of emergency asthma care across
the 48 EDs. The reasons for the observed practice variations are probably multifactorial. Our data identified that the variation in quality of care was partly explained by geographic region, even after adjusting for the other ED characteristics and patient mix, with Southern and Western EDs providing less guideline-concordant care than those in the Midwest. Parallel to these observations, the National Emergency Department Safety Study also showed a lower concordance with guideline recommendations in Southern EDs.14 However, the relationship between region and quality of emergency asthma care is complex. Geographic region is a surrogate marker for a number of patient, physician, institutional, and systems characteristics that affect quality of care but are difficult to quantify individually. We hope that our observations facilitate further investigation of any barriers to the delivery of high-quality asthma care in these underperforming EDs.
Process measures are designed to assess concordance with expected care and, when
provided, should ‘‘maximize health benefits to patients’’ and lead to improved clinical outcomes (eg, reduced risk of hospitalization).5,32 In the present study we demonstrated that complete delivery of the guideline recommended asthma care (all or none) was associated with significantly lower risk of hospitalization. This association is encouraging and consistent with the results from our previous multicenter studies both in the United States and Japan.14, 23 With multiple studies arriving at a similar conclusion, despite differing populations and health care settings, we believe that there is very robust evidence to support level A management in all EDs.
Taken together, many hospitalizations and the associated health care spending could be avoided if the variations in asthma care were attenuated and best practices were implemented in underperforming EDs. Use of an all-or-none metric certainly raises the bar on performance for providers, 14 and there might be potential resource disparities among sites that make it a challenge to implement some guideline recommendations. For patients with acute asthma, however, the level A recommendations are easily within reach (eg, prescribing systemic corticosteroids), and we believe that it is reasonable to expect a consistently high level of quality and performance in all US EDs. There is added urgency given that asthma is such a common public health problem.23 Although improvement in the quality of emergency asthma care is ultimately the responsibility of the involved clinicians and hospitals, collective efforts with other stakeholders, such as community centers, professional organizations, and federal agencies, are warranted to overcome barriers to improving emergency asthma care nationally. Potential limitations
Several study limitations should be noted. First, given the underuse of PEF measurement in this study, we might have underestimated the number of eligible patients who should receive anticholinergic agents or systemic corticosteroids in the ED. Accordingly, despite the high performance on these 2 measures, the smaller number of eligible patients using these measures

carries less weight when calculating the overall concordance score, thereby underestimating the score.
Second, the study relied on medical record review for quality measure assessment; therefore some of the quality deficit might be due to underdocumentation. However, prior studies have demonstrated high agreement in ED asthma assessment and management between chart review and direct observation, with k coefficients ranging from 0.6 to 0.9.33 Additionally, we used the identical approach to assess quality measures across studies, and this should mitigate any effect on the trend analysis.
Third, our study did not measure postdischarge care plans (eg, written discharge plans and follow-up care) and postdischarge outcomes (eg, revisits and readmissions). These important outcomes will be the focus of future research by the MARC investigators.
Fourth, as with any observational studies, the associations between higher concordance and lower risk of hospitalization does not necessarily prove causality and might by confounded by unmeasured factors, such as disease severity. However, we restricted the denominator of a quality measure to patients at risk for that measure to minimize potential confounding by severity and indication.34 This approach has been used in prior studies of both acute and chronic asthma to adjust for this type of confounding.14, 35-37
Lastly, our study population consisted of adults who presented mainly to academic EDs. Therefore our inferences might not be generalizable to children or asthma management in nonacademic EDs, where emergency asthma care might be better or worse than in our participating EDs. Nevertheless, we believe that our observations are highly relevant from a policy standpoint because these academic EDs train emergency medicine residents. Thus these institutions have a disproportionate effect on the quality of current and future emergency asthma care.
In summary, on the basis of observational studies of 4039 adults with asthma exacerbation in 48 US EDs, we found changes in quality of emergency asthma care that differed by level of guideline recommendation. The observed improvement in the concordance with level A guideline recommendations supports prior optimism that the quality of emergency asthma care can be improved and morbidity reduced. By contrast, the decreased concordance with non–level A recommendations and wide interhospital variations in quality of care present an important challenge. For researchers, these observations should facilitate further investigation to build more robust evidence on current non–level A recommendations. Finally, we found a strong association between fully concordant asthma care and reduced risk of hospitalization. Clinicians and policymakers will need to promote further adoption of level A recommendations and assist efforts to decrease the interhospital variations in quality of emergency asthma care to achieve better patient outcomes. We thank the MARC-36 study hospitals and research personnel for their ongoing dedication to asthma research (see Table E1 and Fig E1 in this article’s Online Repository).
Clinical implications: We observed changes in quality of emergency asthma care that differed by level of guideline recommendation. Further improvements require adoption of level A recommendations and further research on non–level A recommendations. REFERENCES 1. Centers for Disease Control and Prevention. Asthma. Available at: http://www.cdc. gov/nchs/fastats/asthma.htm. Accessed April 14, 2014. 2. Barnett SB, Nurmagambetov TA. Costs of asthma in the United States: 2002-2007. J Allergy Clin Immunol 2011;127:145-52. 3. US Department of Health and Human Services. Healthy People 2020. Washington (DC): US Department of Health and Human Services; 2013. Available at: http:// www.healthypeople.gov/2020/default.aspx. Accessed April 14, 2014. 4. Fonarow GC, Peterson ED. Heart failure performance measures and outcomes: real or illusory gains. JAMA 2009;302:792-4. 5. Chassin MR, Loeb JM, Schmaltz SP, Wachter RM. Accountability measures—using measurement to promote quality improvement. N Engl J Med 2010;363:683-8. 6. Williams SC, Schmaltz SP, Morton DJ, Koss RG, Loeb JM. Quality of care in U.S. hospitals as reflected by standardized measures, 2002-2004. N Engl J Med 2005; 353:255-64. 7. Ginde AA, Espinola JA, Camargo CA Jr. Improved overall trends but persistent racial disparities in emergency department visits for acute asthma, 1993-2005. J Allergy Clin Immunol 2008;122:313-8. 8. Emergency Medicine Network. Available at: http://www.emnet-usa.org/. Accessed April 14, 2014. 9. Griswold SK, Nordstrom CR, Clark S, Gaeta TJ, Price ML, Camargo CA Jr. Asthma exacerbations in North American adults: who are the ‘‘frequent fliers’’ in the emergency department? Chest 2005;127:1579-86. 10. Singh AK, Cydulka RK, Stahmer SA, Woodruff PG, Camargo CA Jr. Sex differences among adults presenting to the emergency department with acute asthma. Multicenter Asthma Research Collaboration Investigators. Arch Intern Med 1999;159:1237-43. 11. National Center for Health Statistics. International classification of diseases, ninth revision, clinical modification. Available at: http://www.cdc.gov/nchs/icd/icd9cm. htm. Accessed April 14, 2014. 12. United States Department of Agriculture Economic Research Service. The 2013 urban influence codes. Available at: http://www.ers.usda.gov/data-products/urbaninfluence- codes.aspx-.UyExBl6V_sY. Accessed April 14, 2014. 13. United States Bureau of the Census. Census regions and divisions of the United States. Available at: http://www.census.gov/geo/www/us_regdiv.pdf.AccessedApril 14, 2014. 14. Tsai CL, Sullivan AF, Gordon JA, Kaushal R, Magid DJ, Blumenthal D, et al. Quality of care for acute asthma in 63 US emergency departments. J Allergy Clin Immunol 2009;123:354-61. 15. Cydulka RK, Emerman CL, Rowe BH, Clark S, Woodruff PG, Singh AK, et al. Differences between men and women in reporting of symptoms during an asthma exacerbation. Ann Emerg Med 2001;38:123-8. 16. Silverman RA, Boudreaux ED, Woodruff PG, Clark S, Camargo CA Jr. Cigarette smoking among asthmatic adults presenting to 64 emergency departments. Chest

2003;123:1472-9. 17. Expert panel report 2: guidelines for the diagnosis and management of asthma. Available at: http://www.nhlbi.nih.gov/guidelines/archives/epr-2/index.htm. Accessed April 14, 2014. 18. National Asthma Education and Prevention Program. Expert panel report: guidelines for the diagnosis and management of asthma update on selected topics—2002. J Allergy Clin Immunol 2002;110(suppl):S141-219. 19. Expert panel report 3 (epr-3): guidelines for the diagnosis and management of asthma—summary report 2007. J Allergy Clin Immunol 2007;120(suppl):S94-138. 20. Brook RH, McGlynn EA, Cleary PD. Quality of health care. Part 2: measuring quality of care. N Engl J Med 1996;335:966-70. 21. Reeves D, Campbell SM, Adams J, Shekelle PG, Kontopantelis E, Roland MO. Combining multiple indicators of clinical quality: an evaluation of different analytic approaches. Med Care 2007;45:489-96. 22. Little RJ, Rubin DB. Statistical analysis with missing data. New York: Wiley-Interscience; 2002. 23. Hasegawa K, Chiba T, Hagiwara Y, Watase H, Tsugawa Y, Brown DF, et al. Quality of care for acute asthma in emergency departments in Japan: a multicenter observational study. J Allergy Clin Immunol Pract 2013;1:509-15. 24. Rowe BH, Edmonds ML, Spooner CH, Camargo CA. Evidence-based treatments for acute asthma. Respir Care 2001;46:1380-91. 25. Nolan T, Berwick DM. All-or-none measurement raises the bar on performance. JAMA 2006;295:1168-70. 26. Rank MA, Liesinger JT, Ziegenfuss JY, Branda ME, Lim KG, Yawn BP, et al. The impact of asthma medication guidelines on asthma controller use and on asthma exacerbation rates comparing 1997-1998 and 2004-2005. Ann Allergy Asthma Immunol 2012;108:9-13. 27. Morse RB, Hall M, Fieldston ES, McGwire G, Anspacher M, Sills MR, et al. Hospital-level compliance with asthma care quality measures at children’s hospitals and subsequent asthma-related outcomes. JAMA 2011;306: 1454-60. 28. Tang N, Stein J, Hsia RY, Maselli JH, Gonzales R. Trends and characteristics of US emergency department visits, 1997-2007. JAMA 2010;304:664-70. 29. Pitts SR, Carrier ER, Rich EC, Kellermann AL. Where Americans get acute care: increasingly, it’s not at their doctor’s office. Health Aff (Millwood) 2010;29: 1620-9. 30. Sills MR, Fairclough D, Ranade D, Kahn MG. Emergency department crowding is associated with decreased quality of care for children. Pediatr Emerg Care 2011; 27:837-45. 31. Tsai CL, Rowe BH, Sullivan AF, Camargo CA Jr. Factors associated with delayed use or nonuse of systemic corticosteroids in emergency department patients with acute asthma. Ann Allergy Asthma Immunol 2009;103:318-24. 32. Agency for Healthcare Research and Quality. Understanding quality measurement. Available at: http://www.ahrq.gov/professionals/quality-patient-safety/qualityresources/ tools/chtoolbx/understand/. Accessed April 14, 2014. 33. McDermottMF, Lenhardt RO, Catrambone CD,Walter J,Weiss KB.Adequacy of medical

chart review to characterize emergency care for asthma: findings from the Illinois Emergency Department Asthma Collaborative. Acad Emerg Med 2006;13:345-8. 34. Tsai CL. Raising the bar for asthma care in the emergency department. J Allergy Clin Immunol Pract 2013;1:516-7. 35. Schatz M, Zeiger RS, Vollmer WM, Mosen D, Mendoza G, Apter AJ, et al. The controller-to-total asthma medication ratio is associated with patient-centered as well as utilization outcomes. Chest 2006;130:43-50. 36. Tsai CL, Sullivan AF, Ginde AA, Camargo CA Jr. Quality of emergency care provided by physician assistants and nurse practitioners in acute asthma. Am J Emerg Med 2010;28:485-91. 37. Sills MR, Ginde AA, Clark S, Camargo CA Jr. Multicenter analysis of quality indicators for children treated in the emergency department for asthma. Pediatrics 2012;129:e325-32.
METHODS Multiple imputation
In the patient- and ED-level models we conducted multiple imputation by using the multivariate normal imputation method for the variables with missing data. The proportion of missing values was small (<11%) for all variables, except for PEF data. The proportion of missing values for PEF was 59% if we only use the sample from the 2011-2012 period but decreased to 46% if we use the data from both the 1997-2001 and 2011-2012 study periods. Therefore we used data from both study periods to impute the missing values. Because the proportion of missing values was relatively large for PEF, we created 100 multiply imputed data sets by using the multivariate normal imputation method developed by Rubin and colleagues.E1,
E2
We first imputed missing values including the ED indicator in the imputation model as fixed effects and then constructed hierarchic models treating the ED indicator as random effects.E3 We dropped the first 200 simulations as a burn-in and used every 100 simulations as thinning. Incomplete variables were imputed by using the variables predictive of either missing values or missingness and all of the variables included in our analysis models (age; sex; race/ethnicity; primary insurance; smoking history; primary care physician status; history of intubation for asthma; number of ED visits for asthma in the previous year; current use of systemic corticosteroids, inhaled corticosteroids, long-acting b-agonist inhalers, and leukotriene modifiers; comorbidities; duration of the current asthma exacerbation before the ED presentation; respiratory rate and oxygen saturation at ED presentation; administration of systemic corticosteroids, anticholinergic agents, and subcutaneous epinephrine in the ED; ED disposition; log-transformed ED length of stay; ED identifiers; annual ED visit volume; annual ED asthma volume; census region; and patient-level composite scores). Our data had less than 2% missingness in the outcome variable (ie, hospitalization) of the patient-level regression models. We included this outcome variable in the imputation model and then excluded any cases with imputed values for the outcome variables from the final models, according to the approach by von Hippel.E4 These estimates and their standard errors were combined by using Rubin’s combination methods.E1

We created 100 multiply imputed data sets to account for the relatively large proportion of missingness of the PEF variable. As long as the missing-at-random assumption holds, the missing PEF values would not bias the estimates or affect the estimated SEs. Alternatively, patients with missing PEF data might have had asthma too severe to undergo PEF measurements in the ED. In this case, with predicting the missingness of PEF by using the markers of acute asthma severity (eg, respiratory rate and oxygen saturation at ED presentation, administration of inhaled anticholinergic agents and subcutaneous epinephrine in the ED, ED length of stay, and disposition), the unobserved PEF values are no longer relevant to the missingness of this variable (ie, the missing at random assumption holds). Multiple imputation was conducted at the patient level and then aggregated for the ED-level analyses. All analyses with multiple imputation were performed with Stata 12.0 software (StataCorp). REFERENCES E1. Rubin DB. Multiple imputation for nonresponse in surveys. New York: John Wiley & Sons; 1987. E2. Little RJ, Rubin DB. Statistical analysis with missing data. New York: Wiley-Interscience; 2002. E3. Graham JW. Missing data analysis: making it work in the real world. Ann Rev Psychol 2009;60:549-76. E4. von Hippel PT. Regression with missing y’s: an improved strategy for analyzing multiple imputed data. Sociol Method 2007;37:83-117.

