language deficits in dyslexic children: speech perception...
TRANSCRIPT

Language Deficits in Dyslexic Children:Speech Perception, Phonology and Morphology
Marc F. Joanisse and Franklin R. ManisUniversity of Southern California
Patricia KeatingUniversity of California, Los Angeles
Mark S. SeidenbergUniversity of Southern California
This work has been submitted to Academic Press for possible publication. Copyright may be transferredwithout notice, after which this version may no longer be accessible.
Abstract
We investigated the relationship between dyslexia and three aspects of language:speech perception, phonology and morphology. Reading and language taskswere administered to dyslexics aged 8-9 years, and two normal reader groups(age-matched and reading-level matched). Three dyslexic groups were identi-fied: phonological dyslexics (PD), developmentally language impaired (LI), andglobally delayed (delay-type dyslexics). The LI and PD groups exhibited simi-lar patterns of reading impairment, attributed to low phonological skills. How-ever, only the LI group showed clear speech perception deficits, suggesting thatsuch deficits affect only a subset of dyslexics. Results also indicated phonologicalimpairments in children whose speech perception was normal. Both the LI andPD groups showed inflectional morphology difficulties, with the impairment be-ing more severe in the LI group. The Delay group’s reading and language skillsclosely matched those of younger normal readers, suggesting these children hada general delay in reading and language skills, rather than a specific phonologicalimpairment. The results are discussed in terms of models of word recognition anddyslexia.
Developmental dyslexia is diagnosed in children who fail to acquire age-appropriate read-ing skills in the absence of other cognitive dysfunctions, such as poor vision, or frank neurologicaldeficit (Stanovich, 1988b; Vellutino, 1979). Dyslexic children typically exhibit difficulties in rec-ognizing printed words, and perform poorly on such tasks as nonsense word reading, spelling, andreading comprehension (Lyon, 1995; Rack, Snowling, & Olson, 1992). Dyslexia is sometimesthought to be an impairment that is specific to reading; however, there is now a considerable bodyof evidence linking dyslexia to impairments in other aspects of language, memory, and perception(Adams, 1990; Snowling, 1987; Stanovich, 1988a; Vellutino, 1979; Wagner & Torgesen, 1987).

LANGUAGE DEFICITS AND DYSLEXIA 2
A prominent view of dyslexia is that it derives from deficits in the representation and use ofphonological information (Liberman & Shankweiler, 1985; Rack et al., 1992; Stanovich, 1988b;Wagner & Torgesen, 1987). Phonological deficits are thought to interfere with learning the corre-spondences between spelling and sound, an important step in reading acquisition. Several aspectsof phonological skill have been shown to be affected. Some studies have focused on dyslexics’ poorphonemic awareness, characterized as an inability to segment words into phonemes (Bradley &Bryant, 1983; Bruck, 1992; Manis, Custodio, & Szeszulski, 1993). Phonemic awareness tasks typ-ically involve counting, adding, deleting, or identifying the position of phonemes in familiar wordsand nonwords. Other studies have examined the effects of phonological impairments on lexicalaccess (Bowers & Swanson, 1991; Denckla & Rudel, 1976; Wolf, 1986) and verbal working mem-ory (Byrne & Shea, 1979; Shankweiler, Liberman, Mark, Fowler, & Fischer, 1979). Prospectivestudies of phonology and reading support the hypothesis that poor phonological ability can play acausal role in reading deficits. For example, Bradley and Bryant (1983) have shown that pre-readingchildren’s performance on phonemic awareness tasks is a better predictor of a child’s later readingability than is a measure of general intelligence.
The underlying cause of phonological deficits in poor readers is unclear. One possible sourceis impaired perception of speech at the phoneme level. Several studies have shown that poor readersas a group tend to perform abnormally on tasks involving the categorization and/or discriminationof speech sounds (Godfrey, Syrdal-Lasky, Millay, & Knox, 1981; Manis et al., 1997; Masterson,Hazan, & Wijatilake, 1995; Mody, Studdert-Kennedy, & Brady, 1997; Reed, 1989; Werker & Tees,1987). The acoustic cues for contrastive speech sounds tend to be continuous, such as voice onsettime (VOT), relevant to voicing contrasts (e.g., /p/ vs. /b/), and the onset frequency of formanttransitions, relevant to place of articulation contrasts (e.g., /b/ vs. /g/). In spite of the acoustic con-tinuity of speech cues, children and adults tend to perceive speech sounds categorically (Liberman,Harris, Hoffman, & Griffith, 1957), with sharp boundaries between phonemic categories. In somestudies, dyslexics have shown weak or distorted categorization, in addition to speech discriminationthat is different from normals (Godfrey et al., 1981; Werker & Tees, 1987). A perceptual deficit ofthis sort would impair the ability to process speech and could in turn affect the development anduse of phonological representations, leading to the commonly observed problems with nonwordpronunciation and phonological awareness in dyslexic children.
A problem with this hypothesis is that reader group differences in speech perception tendto be small and not always statistically robust (Manis et al., 1997; Werker & Tees, 1987). Forexample, in some studies dyslexic children have exhibited impaired speech perception for only asubset of the phonemic contrasts on which they were tested (e.g., Godfrey et al., 1981). In otherstudies, case by case analyses revealed abnormal speech perception in only a subset of the dyslexics.Manis et al. (1997) investigated dyslexic children’s ability to identify /b/ vs. /p/ on the basis of VOT.
This research was supported by NICHD grant HD 29891-03 and NIMH grant 04756. Marc Joanisse was supportedby NSERC (Canada) postgraduate award 208931. Mark Seidenberg was supported by a Research Scientist DevelopmentAward, NIMH KO2-01188. We are grateful to Richard Wright for assisting in developing the speech stimuli, and toMichael Harm, Maryellen MacDonald, and two anonymous reviewers for helpful discussions. We thank the students,teachers and principals of Buffum, Burcham, Carver, Gant, Lowell, Madison, Prisk and Tincher Elementary Schools(Long Beach, CA). We also wish to thank Carrie Bailey, Suzanne Curtin, Laura Gonnerman, Arthur Giraco, MichaelHarm, Maria Munoz, Lynne Stallings, Anne Styskal, Pauline Tam and Lisa Woomer for assisting in testing. Addresscorrespondence to Mark S. Seidenberg, Neuroscience Program, University of Southern California, Los Angeles, CA.90089-2520. E-mail: [email protected]

LANGUAGE DEFICITS AND DYSLEXIA 3
Dyslexics with low phonemic awareness were more likely to have speech perception deficits thanother dyslexics who had reading-level appropriate phonological abilities. Similarly, Tallal (1980)reported a high correlation between nonword reading skill and temporal order judgments of speechsounds, such that poor nonword readers were poor at perception, while better nonword readers werenot. However, the Manis et al. study also indicated that fewer than half of the dyslexics with lowphonological skill demonstrated deviant speech categorization profiles on the VOT categorizationtask. A similar result was found in Nittrouer (1999), who found appreciable phonological difficultiesin a sample of poor readers, but failed to observe appreciable deficits on both speech and nonspeechperception tasks.
It is possible that the tasks used in these studies were not sensitive enough to detect sub-tle speech perception difficulties in poor readers. Nevertheless, these studies raise the possibilitythat speech perception deficits may only be observed in a subset of poor readers. Tallal and Stark(1982) suggested that difficulties on auditory-temporal processing tasks, including tests of speechperception, might be more prevalent among dyslexic children with expressive and/or receptive lan-guage delays than among dyslexics without language delays. However, dyslexics with and withoutlanguage difficulties were not compared in a single study by Tallal and her colleagues, nor werelanguage deficits investigated in the Manis et al. (1997) study.
The goal of the present study was to obtain additional information about the occurrence ofspeech perception deficits in dyslexia and how they are related to impairments in two other aspectsof linguistic knowledge, phonology and morphology. One question is whether dyslexics who ex-hibit phonological impairments have impaired speech perception. This would be consistent with theidea that phonological impairments are secondary to a speech perception deficit. However, it is alsopossible that phonological deficits can occur without impaired speech perception. Harm and Seiden-berg (1999) simulated phonological dyslexia in a connectionist model by introducing anomalies inphonological processing that were severe enough to affect reading acquisition but not the categoricalperception of phonemes. Thus, the model suggests that phonological impairments can have causesother than a speech perception impairment and predicts that at least some phonological dyslexicswill have normal speech perception.
We also investigated the possibility that speech perception deficits are limited to dyslexicswho exhibit broader impairments in language. Although the evidence for speech perception impair-ments in dyslexia is mixed, there is much stronger evidence for this type of impairment in childrenwho are categorized as specific language impaired (SLI) or developmentally language impaired (El-liott & Hammer, 1988; Stark & Heinz, 1996; Tallal & Stark, 1980; Thibodeau & Sussman, 1979).Language impaired children tend to be dyslexic (Catts, Hu, Larriv´ee, & Swank, 1994) in additionto exhibiting impaired acquisition of inflectional morphology and other aspects of grammar (for re-views, see Bishop, 1997b; Leonard, 1998). In these children, speech perception deficits apparentlyinterfere with learning to read as well as with the acquisition of other aspects of language, includ-ing morphology (Bishop, 1997b; Kamhi & Catts, 1986; Joanisse & Seidenberg, 1998; Shankweileret al., 1995; Vogel, 1977; Wiig, Semel, & Crouse, 1973).
Finally, we examined the incidence of speech perception and morphological deficits indyslexics who do not exhibit specific phonological impairments relative to word reading ability.Studies by Manis, Seidenberg, Doi, McBride-Chang, and Petersen (1996), Castles and Coltheart(1993), Stanovich, Siegel, and Gottardo (1997) and others have identified children, termed “sur-face” or “delay” dyslexics, whose phonological skills are on par with their word reading skills.These children read below grade level, but their pattern of reading is more like younger normal

LANGUAGE DEFICITS AND DYSLEXIA 4
readers than phonological dyslexics. In Harm and Seidenberg’s computational model, the delaypattern can be produced by several causes, including lack of experience, learning or visual pro-cessing impairments, and reduced computational resources. Our sample of dyslexics also yielded asubgroup of dyslexics fitting this pattern, allowing us to examine whether they also exhibit problemsin speech perception.
In addition to individual differences among dyslexics, the weak and inconsistent effects inprevious studies of speech perception deficits in dyslexia might be due to a lack of sensitivity in thetasks. The present study addressed this problem by using two separate speech contrasts. The firstwas a VOT continuum (/d/-/t/) which provided a comparison to our previous work (Manis et al.,1997). A second measure of speech perception was utilized to address the potential criticism thatthe voicing continuum was not demanding enough. This measure featured a place of articulation(POA) distinction (/p/ - /k/) occurring word-medially (in this case, following an /s/ in the words“spy” and “sky”). Perceptual demands should be greater for categorization of consonants within aconsonant cluster, particularly the non-initial consonants.
In summary, we addressed relationships among speech perception, phonology and morphol-ogy in a representative sample of third grade poor readers. Their performance was compared tothat of two groups of normal readers, matched for chronological age (CA), and younger childrenmatched for reading level (RL). The RL group was crucial to the design because various cognitiveand language skills are related to reading achievement. For example, phonemic awareness is likelyaffected by degree of literacy (Morais, Cary, Alegria, & Bertelson, 1979), and thus it is possiblethat some dyslexics’ poor performance on phonemic awareness tasks is solely the result of poorerreading skills. Including the RL group allowed us to assess the degree to which low phonemic skillwas uniquely associated with performance on other tasks. Similarly, many other language skillscould potentially be influenced by a child’s literacy; for example, a certain amount of a child’s vo-cabulary is learned through print exposure (Hayes, 1988). Here again, the RL group allowed us tocounterbalance any effect reading achievement might have had on the various language skills beingmeasured. To the extent that dyslexics performed more poorly than the RL group, it could be arguedthat their difficulties on the task in question were not simply related to a general delay in readingability.
Method
Participants
A total of 137 children were selected for this study, from a group of 180 children who wereparticipating in a longitudinal study of reading impairments. At the beginning of the school year,third grade teachers at eight primary schools in the Long Beach, California area were asked toprovide the names of normally-achieving and poor readers in their classes. The teachers wereasked not to nominate any children who had non-native proficiency in English, severe cognitiveor neurological impairments, or severe hearing loss. In addition, first and second grade teacherswere also asked to provide normally-achieving readers to be used in a younger comparison group.Children who failed to return signed parental consent forms, or who did not wish to participate inthe study were not included.
The dyslexic group consisted of a sample of 61 third grade children, ages 7;10 to 9;4 (mean8;7). Classification as dyslexic was based on teacher referral, and standardized reading scores ator below the 25th percentile on the Woodcock Reading Mastery Task–Revised (Woodcock, 1989).

LANGUAGE DEFICITS AND DYSLEXIA 5
The diagnosis of dyslexia we adopt here is relatively inclusive, as it is based solely on reading delayin the absence of extenuating factors such as neurological disease, social problems, or more globalcognitive deficits. Participants were selected from a larger pool of 71 poor readers referred by theteachers. Ten children were excluded from the present analyses when testing revealed them to havenon-native English proficiency (2 cases), or Woodcock reading scores above the 25th percentile (8cases).
It is common in studies of dyslexia to exclude children whose global IQ score (includingverbal and nonverbal ability) falls below average. We did not exclude participants on this basisbecause we sought to investigate the relationships among broader language skills and other factors,and did not want to restrict the range of language skills within the dyslexic sample. Hence, thesample included some children with very low language skills (in the bottom 5% of the population).However, none of the dyslexics in the present sample were classified as mentally retarded by theschools.
A group of 52 chronological age-matched normal readers (the CA group) was obtained fromthe sample of 62 third graders nominated as average to above average readers. Only participantsreading at or above the 40th percentile on the Woodcock word reading task and who demonstratednormal language ability, as assessed by standardized language tasks, were included in the study (10were excluded on these criteria). The mean age of this group was 8;5 (range 7;11 – 9;3).
The younger normal reader group (the RL group) consisted of 37 younger children who werematched with the dyslexic group on Woodcock Word Identification grade level. This group wasselected from a total of 47 first- and second-grade children in the larger sample, all scoring at orabove the 40th percentile on the Woodcock task. Mean age for this group was 6;11 (range: 6;1 –8;1). Ten of the 47 children originally nominated by the teachers were excluded from the presentanalyses, as they were reading above the grade level range for dyslexics.
Procedures
Participants were tested individually over five sessions, all during normal school hours. Ses-sions lasted on average 30 minutes, though the participants were encouraged to take breaks ordiscontinue the session whenever they desired.
Reading tasks. Three reading tasks were administered to each participant. The first wasform G of the Word Identification subtest of the Woodcock Reading Mastery Test–Revised. In thistask, participants read words presented in isolation, with stimuli consisting of words that variedin spelling-to-sound regularity, complexity and familiarity. An exception word reading task wasalso administered, in which stimuli consisted of 70 exception words such as HAVE, ISLAND, andYACHT, also presented in isolation. The task was discontinued when children read six consecutivewords incorrectly. Finally, a nonword reading task was administered, consisting of 70 nonsensewords such as NUP and CLEESH presented in isolation. The task was discontinued when childrenmade ten consecutive mistakes.
Phonemic awareness. A phoneme deletion and blending task of the type originally devisedby Bruce (1964), was administered in two parts (more information on this task, including test items,can be found in Keating & Manis, 1998). In the first subtask, participants were asked to repeat afamiliar word that was spoken on a tape. The speaker on the tape then asked the participant to repeatthe word, but with part of it missing. Each prompt was in the following form:

LANGUAGE DEFICITS AND DYSLEXIA 6
Say mat. (pause for child to repeat)Now say it without the/m/. (pause for child to respond)
The prompts were recorded by a trained phonetician. In cases where the target phoneme wasa voiced consonant, care was taken to produce it with as little and as neutral following vocalic soundas possible. As well, onset and coda allophones (most importantly pre- and post-vocalic /l/ and /r/)were produced as appropriate. Target phonemes included stops, fricatives, and sonorants. Theyincluded simple onsets and codas, along with all or part of an onset or coda cluster. Thus, somestimuli required simply deleting a phoneme of the target word, while others also required phonemeblending, such as sayingfloatwithout /l/. All stimuli were monosyllables, and were devised in sucha way that all answers, along with the most likely incorrect answers, were real words.
Participants were given 4 practice items, followed by 25 experimental items. Feedback wasprovided for practice items, but not for experimental items. Stimuli were presented in order of dif-ficulty, based on piloting data. The task was discontinued after 5 consecutive errors. One repetitionwas allowed per item, in cases where the participant forgot the stimulus.
The second subtest was identical to the first, but here stimuli consisted of 15 monosyllablenonwords, following 3 practice items. In both subtasks, the deletion target varied from simple onsetsand codas of words, to all or part of a word-initial or word-final cluster. Correct responses and mostof the likely incorrect responses were also nonwords, to prevent biases towards real-word responses.
Inflectional morphology. A task of inflectional morphology similar to the one originally de-vised by Berko (1958) was administered in order to assess each child’s ability to apply proper pasttense agreement rules to familiar and nonsense words. The task consisted of both plural noun andpast tense verb marking. The plural noun subtask consisted of 8 familiar nouns and 4 nonsensewords; 4 of the real word nouns were regularly marked as plurals (e.g. face – faces), while 4 wereirregularly marked as plurals (e.g. foot – feet). Regular and irregular words were equated for fre-quency and phonological complexity. The nonword items were equated with the real word stimulifor phonological complexity. Four practice items with feedback were administered for both tasks.
Participants were presented target nouns as part of a sentence, accompanied by picture stimulishowing just one picture of that noun. They were then shown a picture of two or more of the sameobject, and prompted to provide the plural of the noun, as follows:
Here is a fish. (exp. points to picture of a fish)Now there are two of them. There are two ...(pause for child to respond).
Testing proceeded similarly in the case of nonwords, where participants were shown pictures offictitious creatures, and told that the nonword was the name of that creature.
The past tense verb subtask proceeded similarly. Stimuli consisted of 16 familiar verbs ofwhich half were regularly-marked for past tense using one of the ‘-ed’ allomorphs (/-t/ /-d/ /-Id/),for example “bake – baked”. The other half consisted of irregularly marked verbs, such as “drive– drove”, matched for frequency and phonological complexity with the regularly-marked verbs. Aset of 8 nonsense verbs were also presented, for example “filp – filped”. All verbs were presentedas part of a sentence completion task, where the experimenter asked the participant to repeat a wordused in the first sentence to finish the second sentence. Visual stimuli were provided for the nonworditems, consisting of pictures depicting fictional creatures doing various activities.

LANGUAGE DEFICITS AND DYSLEXIA 7
CELF Word Structure task. Participants were also administered the Word Structure compo-nent of the CELF language assessment battery (Semel, Wiig, & Secord, 1995), to assess gram-matical skill. In this task, children were shown pictures and were then read sentences that theyhad to complete based on examples given by the experimenter. Most English morphological mark-ings were represented in this task, including tense and number, along with other morpho-syntacticmarkers such as pronouns, comparatives and superlatives.
WISC-III Vocabulary task. The Vocabulary subtask of the Weschler Intelligence Scale forChildren–III (WISC-III, Weschler, 1992) was administered, to assess any semantic and lexical dif-ficulties. Stimuli consisted of a standardized list of words that participants were asked to define asbest they could.
Speech perception. Two tests of speech perception were administered to participants. Bothwere in the form of a single stimulus categorization task, in order to minimize any effect of attentionor memory. Previous studies have used tasks in which participants were asked to indicate the tem-poral order of two auditory stimuli (Mody et al., 1997; Tallal, 1980); this places a load on workingmemory, and as such does not differentiate between deficits in processing speech, and the ability tomaintain phonological representations in working memory while operating upon them. The cate-gorization tasks used in the present study allowed us to assess children’s perceptual abilities undera minimal working memory load. We chose to test participants on two separate contrasts, voic-ing and POA. Perception of these two types of contrasts is well-known to be categorical in nature(Liberman, 1996), and they are the contrasts most commonly tested in previous studies of speechperception by dyslexics.
The stimuli constructed for these contrasts differed in their expected perceptual demands.The VOT continuum, made from natural speech and with the test consonant in initial position (“dug-tug”), was expected to be readily categorized. In contrast, the POA stimuli have the test consonant asthe second member of a consonant cluster (“spy-sky”). These could be more difficult to categorizefor the following reasons: perceptual attention must be focused on a non-initial segment; the onset ofthe second consonant could potentially be masked by the noise of the preceding [s]; the stimuli weresynthesized and therefore less natural; dyslexics sometimes have difficulty segmenting consonantclusters, and therefore might have trouble processing these items.
In the first task, “dug-tug”, stimuli were created by cross-splicing progressively more “tug”into “dug” from natural speech. The result was 8 different VOT values from about 10 ms to 80 msvoicing lag, in roughly 10 ms increments (the exact values depended on the fundamental frequencyof the voice, since pitch pulses were kept intact in the splicing). This formed a continuum of wordsidentifiable as eitherdugor tug. Participants were given 6 practice items with feedback, consistingof endpoint stimuli. During experimental trials, no feedback was given. All stimuli were presentedin random order, and each participant heard each stimulus 5 times, for a total of 40 trials.
The second task, “spy-sky”, manipulated a consonant’s perceived POA based on the onsetfrequency of second formant (F2) transition sweeps in the second consonant of the target word. Thisproduced a continuum between the labial /p/ and dorsal /k/ phonemes. F2 onsets ranged from 1100to 1800 Hz. Formant transition duration was 45 ms. The closure duration of 30 ms was chosen to belong enough to produce a clear stop percept, but short enough to make listeners vulnerable to effectsof masking or to other auditory difficulties in processing too-short intervals between successivecomponents of speech segments. This resulted in 8 words discriminable as eitherspyor sky. Stimuliwere produced synthetically using the Klatt hybrid synthesizer on a PC (Klatt, 1990), and recorded

LANGUAGE DEFICITS AND DYSLEXIA 8
as 16-bit, 22.05 kHz digital sound files.Stimuli were presented using a Macintosh Powerbook with 16-bit audio and an active matrix
screen. On each trial, participants were presented with two pictures, and an auditory stimulus waspresented over Shure SM-2 headphones. All auditory stimuli were played as 16-bit, 22.05 kHzaudio files. Participants were told to point to the picture of the word that they heard. Six practiceitems were presented with feedback, consisting solely of endpoints of the continuum. Test stimuliwere then presented in random order, and each participant heard each stimulus 4 times, for a totalof 32 trials.Feedback was not given during experimental trials.
Both tasks were expected to yield response profiles which could be characterized as categor-ical S-curves. To better quantify these data, each child’s categorization curve was fitted to a logisticfunction using the Logistic Curve Fit function in SPSS. This procedure was used to estimate logisticcurve functions for each categorization curve, including a slope coefficient. Valid coefficients tendto be between 0 and 1.0, where higher values represent shallower slopes. However, the logisticcurve estimation procedure yields poor estimates for non-logistic data (for example, random andnear-random responses at endpoints), which results in positively skewed data violating the assump-tions of normality necessary for reliable statistical analysis. To control for this, we excluded allcoefficients of 1.2 or more.
Results
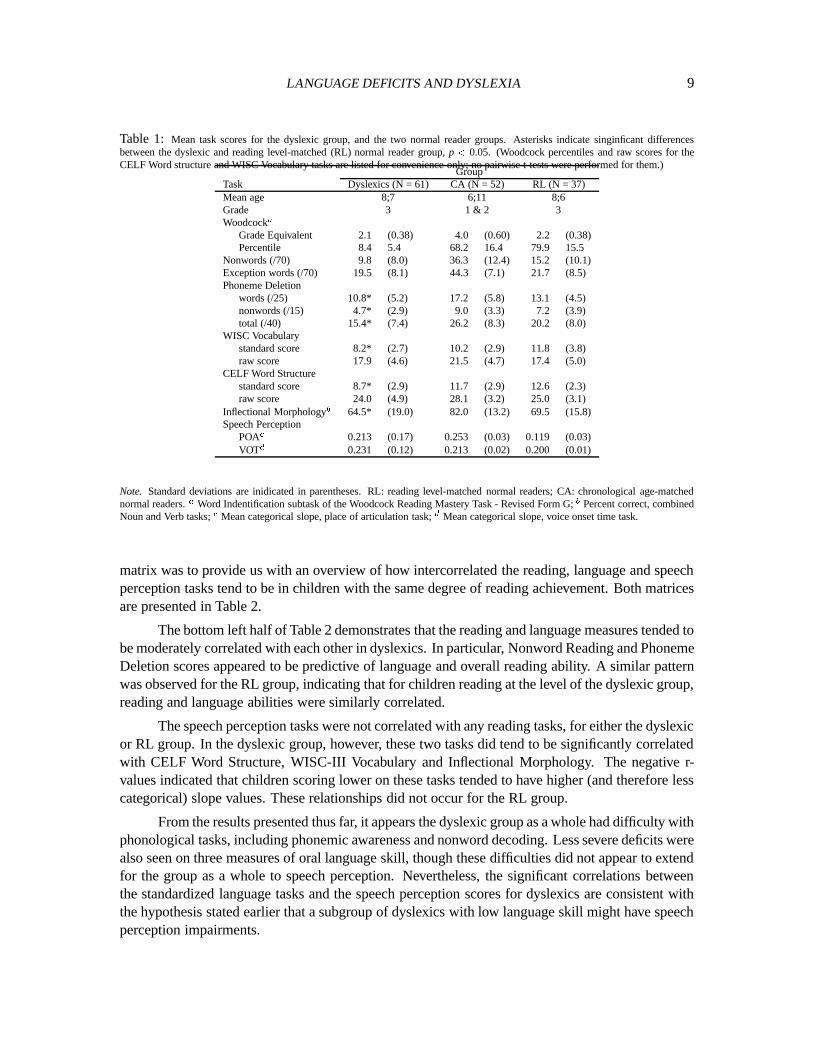
Mean scores for the combined group of dyslexics and the two normal reader groups are pre-sented in Table 1. The dyslexic group scored significantly below the CA group on nearly every task(Word Identification:t(111) = 20.16,p < 0.0001; Nonword Readingt(111) = 13.74,p < 0.0001;Exception Word Readingt(111) = 17.20,p< 0.0001; Phoneme Deletion word subtaskt(111) = 6.92p < 0.0001, nonword subtaskt(111) = 6.79p < 0.0001, overall scoret(111) = 7.46p < 0.0001;CELF Word Structure (standard score)t(111) = 5.47,p < 0.0001; WISC Vocabulary (standardscore)t(98) = 3.77,p< 0.0001; Inflectional Morphology (combined noun and verb subtasks)t(111)= 5.07,p< 0.0001).
These differences are consistent with the studies reviewed above indicating that phonemeawareness and inflectional morphology are deficient in dyslexic children (e.g., Bruck, 1992; Maniset al., 1993; Shankweiler et al., 1995; Vogel, 1977). In contrast, the dyslexic group did not differsignificantly from the CA group on either speech perception task (VOTt(111) = 0.80p = 0.43;POA t(111) = 1.11,p= 0.27). The low scores by dyslexics on the standardized language measuresindicate that a significant number of dyslexics had low language ability for their age, making itpossible to investigate relationships among various aspects of language and speech perception.
The dyslexic group was also compared to the RL group on the same tasks. The two groupsonly differed significantly on Nonword Reading (t(96) = 2.96,p < 0.01) and Phoneme Deletion(word subtaskt(96) = 2.01,p < 0.0001 nonword subtaskt(96) = 3.90,p < 0.0001, overallt(96)= 2.99,p < 0.01). Dyslexics scored significantly below the RL group on CELF Word Structurestandard score (t(83) = 6.81,p= 0.0001), and WISC-III Vocabulary standard scores (t(83) = 5.22,p = 0.0001). No other raw score group means differed significantly, including scores on the twospeech perception tasks (VOTt(93) = 0.42,p= 0.68; POAt(106) = 0.80,p= 0.43).
As an initial investigation of the relationships among phonological, other language, andspeech perception variables in this study, two sets of Pearson correlations were performed for alltasks. The first correlation matrix was done for all dyslexics. The second coefficient matrix usedthe same variables as the first, but was done only for the RL group. The purpose of this second
LANGUAGE DEFICITS AND DYSLEXIA 9
Table 1: Mean task scores for the dyslexic group, and the two normal reader groups. Asterisks indicate singinficant differencesbetween the dyslexic and reading level-matched (RL) normal reader group,p < 0.05. (Woodcock percentiles and raw scores for theCELF Word structure and WISC Vocabulary tasks are listed for convenience only; no pairwise t-tests were performed for them.)
GroupTask Dyslexics (N = 61) CA (N = 52) RL (N = 37)Mean age 8;7 6;11 8;6Grade 3 1 & 2 3Woodcocka
Grade Equivalent 2.1 (0.38) 4.0 (0.60) 2.2 (0.38)Percentile 8.4 5.4 68.2 16.4 79.9 15.5
Nonwords (/70) 9.8 (8.0) 36.3 (12.4) 15.2 (10.1)Exception words (/70) 19.5 (8.1) 44.3 (7.1) 21.7 (8.5)Phoneme Deletion
words (/25) 10.8* (5.2) 17.2 (5.8) 13.1 (4.5)nonwords (/15) 4.7* (2.9) 9.0 (3.3) 7.2 (3.9)total (/40) 15.4* (7.4) 26.2 (8.3) 20.2 (8.0)
WISC Vocabularystandard score 8.2* (2.7) 10.2 (2.9) 11.8 (3.8)raw score 17.9 (4.6) 21.5 (4.7) 17.4 (5.0)
CELF Word Structurestandard score 8.7* (2.9) 11.7 (2.9) 12.6 (2.3)raw score 24.0 (4.9) 28.1 (3.2) 25.0 (3.1)
Inflectional Morphologyb 64.5* (19.0) 82.0 (13.2) 69.5 (15.8)Speech Perception
POAc 0.213 (0.17) 0.253 (0.03) 0.119 (0.03)VOTd 0.231 (0.12) 0.213 (0.02) 0.200 (0.01)
Note. Standard deviations are inidicated in parentheses. RL: reading level-matched normal readers; CA: chronological age-matchednormal readers.a Word Indentification subtask of the Woodcock Reading Mastery Task - Revised Form G;b Percent correct, combinedNoun and Verb tasks;c Mean categorical slope, place of articulation task;d Mean categorical slope, voice onset time task.
matrix was to provide us with an overview of how intercorrelated the reading, language and speechperception tasks tend to be in children with the same degree of reading achievement. Both matricesare presented in Table 2.
The bottom left half of Table 2 demonstrates that the reading and language measures tended tobe moderately correlated with each other in dyslexics. In particular, Nonword Reading and PhonemeDeletion scores appeared to be predictive of language and overall reading ability. A similar patternwas observed for the RL group, indicating that for children reading at the level of the dyslexic group,reading and language abilities were similarly correlated.
The speech perception tasks were not correlated with any reading tasks, for either the dyslexicor RL group. In the dyslexic group, however, these two tasks did tend to be significantly correlatedwith CELF Word Structure, WISC-III Vocabulary and Inflectional Morphology. The negative r-values indicated that children scoring lower on these tasks tended to have higher (and therefore lesscategorical) slope values. These relationships did not occur for the RL group.
From the results presented thus far, it appears the dyslexic group as a whole had difficulty withphonological tasks, including phonemic awareness and nonword decoding. Less severe deficits werealso seen on three measures of oral language skill, though these difficulties did not appear to extendfor the group as a whole to speech perception. Nevertheless, the significant correlations betweenthe standardized language tasks and the speech perception scores for dyslexics are consistent withthe hypothesis stated earlier that a subgroup of dyslexics with low language skill might have speechperception impairments.

LANGUAGE DEFICITS AND DYSLEXIA 10
Analysis of Subgroups
To better investigate the hypothesis that speech perception deficits were specific to dyslex-ics with either phonological impairments or broader language impairments, the dyslexic group wasseparated into three subgroups: phonological dyslexics , delay-type dyslexics, and language im-paired dyslexics. The third subgroup also allowed us to explore the possibility that speech percep-tion deficits might be specific to, or stronger in dyslexics with language deficits extending beyondphonology.
The subgrouping methodology used in the present study was intended to yield groups ofchildren similar to those in Manis et al. (1996) and Stanovich et al. (1997). As such, Phonolog-ical Dyslexic and Delay-type dyslexic groups were obtained based on phonological decoding andphonological awareness abilities. Four dyslexic children were not included in the subgroup analysesbecause of extremely low reading achievement (Word Identification scores below the 1st percentile)that made subgrouping impractical.
Phonological dyslexics in previous studies have been characterized by deviant nonword read-ing and phonological awareness ability. Thus, the 24 dyslexics who scored one standard deviation ormore below the RL group mean on either Nonword Reading or Phoneme Deletion were classified asphonological dyslexic. As described below, the 8 children in this group who also fit the criteria forthe Language Impaired group were excluded from the Phonological Dyslexic group. The remaining16 participants were classified in the Phonological Dyslexic group. Mean age was 8;7 (range 7;11– 9;0).
Though two separate criteria were used to include children in the Phonological Dyslexicgroup, 11 of the Phonological Dyslexic children met both the low Nonword Reading and lowPhoneme Deletion criteria. Another 4 children met only the low Nonword Reading criterion, and 1met only the low Phoneme Deletion criterion.
The main purpose for defining a delay-type dyslexic group was to provide a sample of poorreaders whose phonological skills were on a par with their overall reading level, and who weresimilar to the Phonological Dyslexic group on reading level. Accordingly, all dyslexics (n = 33)who demonstrated Phoneme Deletion and Nonword Reading profiles within one standard deviationof the RL group mean were included in the Delay group.1 One also fit the criteria for the LanguageImpaired group as described below, and thus was not included in the Delay group. An additional9 dyslexic children were excluded in order to obtain matching means and standard deviations withthe Phonological Dyslexic group on Word Identification. The result was a group of 23 childrenwhose reading achievement was very similar to children in the Phonological Dyslexic group, butwho showed reading-age appropriate Nonword Reading and Phoneme Deletion scores. The meanage for this group was 8;7 (range 7;10 – 9;4). Most of the Delay group fell below the CA groupon Nonword Reading and Phoneme Deletion, indicating they had mild phonological difficulties.However, what was of interest in the present study was that their phonological skill was comparableto what is expected given their word identification skill.
The Language Impaired group was identified based on scores obtained from two standardized
1An initial investigation of dyslexics who were very low on exception word reading but normal on phonemic awarenessand nonword reading – that is, children who constituted very pure cases of delay or “surface” dyslexia – yielded arelatively small group of dyslexics (N=5). This group also had very poor Woodcock reading scores compared to otherdyslexics, making it difficult to compare them to the RL group. For this reason, we opted to include a broader range ofdyslexics in the Delay group, including those scoring similarly to the Phonological Dyslexic group on exception wordreading.

LANGUAGE DEFICITS AND DYSLEXIA 11
language subtasks known to be highly correlated with overall language ability and verbal IQ: theCELF Word Structure and WISC Vocabulary tasks. A total of 9 dyslexics scoring below a standard-ized score of 7 on both tasks were classified as Language Impaired; for both tasks, these representeda score of greater than one standard deviation below the normative mean. Only dyslexic childrenwere included in this sample; one non-dyslexic who also fit the language impairment criteria wasnot included in the Language Impaired group. Mean age for this group was 8;8 (range: 7;11 – 9;4).Because this group was intended to represent any dyslexic children with broad language difficulties,participants fitting the criteria foreither dyslexic subgroup were considered. As indicated abovehowever, 8 of the 9 children in this group also fit the criteria for the Phonological Dyslexic group.
It should be pointed out that the criteria used in classifying the Language Impaired groupdid not include phonological ability measures. This is in keeping with the traditional definition oflanguage impairment or SLI that includes only children with grammatical deficits, although phono-logical deficits also tend to co-occur with these (Bishop, 1997b). Thus, while this group’s languageproblems could also extend into phonology, children who demonstratedonly phonological deficitswere excluded from this group. One difference between the Language Impaired group and typicalSLI groups is that measures of nonverbal intelligence were not included in the present study.2 Ta-ble 3 presents the means for the three dyslexic subgroups. The CA and RL group means are repeatedhere for convenience.
Subgroup Comparisons on the Defining Tasks. The subgroups and the two normally achiev-ing groups were compared on the defining measures to confirm the distinctiveness of the groups.Planned comparisons were conducted for the defining measures (Word Identification, NonwordReading, Phoneme Deletion combined score, CELF Word Structure Standard Score, and Vocabu-lary Standard Score). Ten possible pairwise comparisons were possible. However, performing eachof these comparisons involved an unacceptable level of Type I error, and while corrective post-hoctests can help control for this, there was the real possibility of failing to detect small yet reliablebetween-group differences. In order to balance these two considerations, four Bonferroni-correctedt-tests were performed for each task. We performed the following four comparisons: LanguageImpaired vs. RL, Phonological Dyslexic vs. RL, Delay vs. RL, and CA vs. RL. Significant effectswere reached atp < 0.0125, based on dividing a significance level of 0.05 by the total number ofcomparisons. As was discussed earlier, many different skills are related to reading experience, in-cluding phonological and morphological ability, and phonological awareness. Comparing the threedyslexic groups to the RL group, in addition to the CA group, allowed us to take this into consider-ation when assessing any dyslexic group’s difficulties on a given task.
The results of the pairwise comparisons on the Woodcock and nonword tasks were as follows.Only the CA group’s mean Woodcock grade-level was significantly different from the RL group,t(87) = 16.83,p< 0.0001. However, both the Phonological Dyslexic and CA groups were different
2To better assess the Language Impaired group’s cognitive status, participants in all five groups were tested on theVisual Closure subtask of the Woodcock-Johnson Psycho-Educational Battery–Revised to assess nonverbal intelligence.This task was used in a follow-up study. Due to normal attrition several of the participants in this study were thus no longeravailable for testing. Mean standardized scores for all five groups were well within normal limits (Language Impaired:98.9 (12.9), N=7; Phonological Dyslexic: 93.7 (13.5), N=13; Delay: 98.1 (14.0), N=16; CA: 101.0 (10.3), N=44; RL:103.6 (13.6), N=22. Standard deviations are indicated in parentheses). This was confirmed by five one-sampled t-testswhich indicated that no group mean differed significantly from the mean standard score of 100. In addition, all childrenin the Language Impaired group who were retested scored above 90 on this task. These results indicate that the LanguageImpaired group was not comprised of children with disproportionately poor cognitive skills.

LANGUAGE DEFICITS AND DYSLEXIA 12
Table 2: Pearson correlation coefficients of the tasks in this study. The lower left triangle represents thedyslexics only (N=63); the upper right triangle represents the YN group only. The inflectional morphologyfactor represents the overall mean on both the noun and verb subtasks. Significance levels: *= 0.05; ** =0.01, two-tailed.
1 2 3 4 5 6 7 8 91. Woodcock Reading Level . .44** .11 .37* .53** .52** .35* .11 -.252. Nonword Reading Accuracy .43** . .26 .42** .26 .10 .25 .26 -.083. Exception Wd. Reading Accuracy .81** .30* . .14 -.19 -.01 .19 .04 -.054. Phoneme Deletion Accuracy .29* .38** .24 . .43** .25 .30 .09 .075. CELF Word Structure .23 .45** .14 .31* . .36* .55** -.07 -.106. WISC-II Vocabulary .17 .25* .06 .18 .42** . .39* -.20 -.007. Inflectional Morphology (composite) .40** .22 .27* .51** .58** .47** . -.06 -.288. Categorical Perception - POA -.13 -.22 -.04 -.07 -.40** -.21 -.30* . -.309. Categorical Perception - VOT .00 -.23 -.11 .04 -.35** -.29* -.08 .31* .
Note.POA: place of articulation, VOT: voice onset time.
Table 3:Mean task scores for the dyslexic subgroups. Asterisks indicate singinficant differences from the reading level-matched (RL)normal reader group,p< 0.0125. (Woodcock percentiles and raw scores on the CELF Word structure and WISC Vocabulary tasks arelisted for convenience only; no pairwise t-tests were performed for them.)
GroupTask LI (N = 9) PD (N = 16) Delay (N = 23) CA (N = 52) RL (N = 37)Woodcocka
Grade Equivalent 2.1 (0.28) 2.1 (0.31) 2.1 (0.23) 4.0* (0.60) 2.2 (0.38)Percentile 6.3 (5.9) 8.3 (6.2) 9.3 (4.4) 68.2 (16.4) 79.9 (15.5)
Nonwords (/70) 7.0 (7.5) 4.1* (3.4) 14.0 (6.8) 36.3* (12.4) 15.2 (10.1)Exception words (/70) 18.7 (7.3) 18.2 (7.0) 19.8 (5.0) 44.3* (7.1) 21.7 (8.5)Phoneme Deletion
words (/25) 8.4 (5.9) 5.5* (3.4) 14.2 (2.6) 17.2* (5.8) 13.1 (4.5)nonwords (/15) 3.9* (3.2) 2.6* (2.4) 5.8 (1.9) 9.0 (3.3) 7.2 (3.9)total (/40) 12.3 (8.7) 8.0 (4.9) 20.0 (3.6) 26.2 (8.3) 20.2 (8.0)
WISC Vocabularystandard score 5.1* (0.9) 8.1 (3.2) 9.1 (2.7) 10.2* (2.9) 11.8 (3.8)raw score 12.9 (1.6) 17.2 (4.9) 19.7 (4.8) 21.5 (4.7) 17.4 (5.0)
CELF Word Structurestandard score 5.2* (1.0) 7.7 (1.9) 10.3 (2.9) 11.7* (2.9) 12.6 (2.3)raw score 17.4 (3.5) 22.3 (4.4) 26.4 (3.8) 28.1 (3.2) 25.0 (3.1)
Inflectional Morphologyb 44.2* (15.0) 58.2 (20.2) 72.6 (11.7) 82.0* (13.2) 69.5 (15.8)Speech Perception
POAc 0.410* (0.12) 0.171 (0.02) 0.181 (0.02) 0.253 (0.03) 0.119 (0.03)VOTd 0.289* (0.05) 0.223 (0.03) 0.215 (0.02) 0.213 (0.02) 0.200 (0.01)
Note.Standard deviations are inidicated in parentheses. PD: phonological dyslexics; LI: language impaired dyslexics; RL: reading-levelmatched normal readers; CA: age-matched normal readers.a Word Indentification subtask of the Woodcock Reading Mastery Task- Revised Form G;b Percent correct, combined Noun and Verb tasks;c Mean categorical slope, place of articulation task;d Meancategorical slope, voice onset time task.

LANGUAGE DEFICITS AND DYSLEXIA 13
from the RL group on the nonword reading task: Phonological Dyslexic vs. RL,t(51) = 4.28,p<0.0001, CA vs. RL,t(87) = 8.56,p< 0.0001. No other group differences were significant for thesetwo tasks.
Planned comparisons were also performed for the real word and nonword subtasks of thephoneme deletion task. The Phonological Dyslexic group was significantly different from the RLgroup on both the word subtask,t(51) = 4.72,p < 0.001, and nonword subtask,t(51) = 5.03,p < 0.001. The Language Impaired group also differed from RL group on the nonword subtask,t(44) = 2.68,p< 0.01. Differences between the CA and RL groups were also significant for the realword subtask,t(87) = 3.77,p< 0.001. No other differences were significant.
The standardized language measures also showed the expected differences among groups(standard scores). On the CELF Word Structure task, significant differences were obtained forthe Language Impaired vs. RL,t(44) = 6.44,p< 0.001, and CA vs. RL,t(87) = 4.46,p< 0.001,comparisons. On the WISC Vocabulary task, significant differences were obtained for the LanguageImpaired vs. RL comparison,t(36) = 2.62,p< 0.0125, and CA vs. RL comparison,t(87) = 3.96,p< 0.001.
Subgroup Comparisons on Validating Tasks. Planned comparisons were also performed forthe two tasks that were not used in the classification phase, Exception Word Reading, and Inflec-tional Morphology. The CA group was superior to the RL group on Exception Word Reading (t(87) = 13.70,p< 0.001); no other comparisons reached significance. The similarity of the dyslexicgroups to the RL group on this measure indicates that the process of equating reading levels usingWoodcock Word Identification was validated by an independent measure of word reading.
The inflectional morphology task was of interest for two reasons. First, it provided a checkon the classification process for language deficits using a focused test of one of the central languageskills thought to be involved in language difficulties. Mean scores combining across nouns and verbsare shown in Table 3. Planned comparisons were performed, and indicated significant differencesbetween the Language Impaired and RL groups,t(44) = 3.11,p< 0.001, and the CA and RL groupst(87) = 4.04,p< 0.001. The Delay group did not differ from the RL group (and was fact was quitesimilar to the RL group on this measure). These results confirm the classification of the LanguageImpaired group, and supports the definition of the Delay group as showing reading-level appropriatelevels of language skill.
The inflectional morphology task also provided a test of the hypothesis that phonological dif-ficulties in reading were associated with poor knowledge of inflectional morphology. The Phonolog-ical Dyslexic-RL comparison was marginally significant, given the degree of Bonferroni correction(t(51)= 2.21,p= 0.03), providing limited support for this hypothesis.
Speech Perception Tasks
Identification functions for thedug-tugVOT categorization task were obtained by calculatingthe proportion oftug responses (out of 5) for each stimulus along the continuum of 8 items. Whenplotted, the result was an S-shaped curve, where high values along the y axis would indicate agreater proportion oftug responses at that VOT; lower values would indicate moredug responses.A narrower, steeper crossover between the two endpoint regions would indicate sharper overallcategorization, whereas a wider and flatter crossover would indicate a greater number of inconsistentresponses, suggesting weak categorization. Completely random responses would result in a flat lineacross the continuum.

LANGUAGE DEFICITS AND DYSLEXIA 14
Figure 1 shows the mean categorization curves on this task for the normal readers comparedto each of the three dyslexic groups. To simplify the graph, the normal reader curve represents themean of the CA and RL groups, which did not differ in slope. Overall curves for the PhonologicalDyslexic and Delay groups appeared relatively consistent with the normal readers, showing similarcrossover points between 30 and 40 ms. In contrast, the Language Impaired group curve indicatedslightly weaker categorization between 40 and 60 ms VOT.
To assess the reliability of these differences, mean logistic slope values were calculated foreach participant as described in the Method section. Group means are presented in Table 3. Asmentioned above, slope coefficients above 1.2 were trimmed to control for positively skewed dis-tributions. This meant excluding one from the CA group for this analysis only. This participantwas also excluded from Figure 1. Bonferroni-corrected planned comparisons were used to compareslope means for the Language Impaired, Phonological Dyslexic, Delay and CA groups to the RLgroup. The Language Impaired group showed a significantly higher slope parameter than the RLgroup,t(43)= 2.68,p< 0.01. No other differences were significant.
Analyses of thespy-skyPOA task proceeded similarly. Categorization scores were obtainedby calculating the proportion ofspy to sky responses at each stimulus value. Figure 2 plots theLanguage Impaired, Phonological Dyslexic and Delay group curves relative to the normal readers(here again, the mean of the CA and RL groups was plotted). Each participant’s categorizationcurve was fitted to a logistic function, yielding mean slope coefficients for each group (Table 1). Tocontrol for outlier effects, participants with slope coefficients greater than 1.2 were again excluded.This ruled out 2 Phonological Dyslexic and 2 Delay subjects from this analysis. Data from thesesubjects were also excluded from plots in Figure 2. Planned comparisons were performed on themean slope coefficients. As with the VOT task, the Language Impaired group’s mean slope wassignificantly different from the RL group,t (41) = 2.71, p< 0.01. No other group’s slope wassignificantly different from the RL group.
These results show that, on both speech categorization tasks, the Language Impaired groupdemonstrated distorted or weakened perceptual categories for speech sounds. This result is similarto what has been found in other studies of stop consonant categorization in groups of poor readers(Godfrey et al., 1981; Masterson et al., 1995; Reed, 1989; Werker & Tees, 1987). However, italso goes beyond these studies by finding only one subgroup of dyslexics that departed from thenormal pattern of categorical perception. This is consistent with results reported in Manis et al.(1997), where it was found that only a subset of the children who manifested phonologically-basedreading difficulties (phonological dyslexia) demonstrated measurable speech perception deficits.The present results suggest this subgroup in the Manis et al. sample represented language impairedchildren.
Regression Analyses
While the comparison of dyslexic subgroups on the speech perception tasks is theoreticallyinteresting, the subgroup divisions were arbitrary, and it is of interest to examine the relationshipbetween the defining measures and speech perception treated as continuous variables. We thereforeconducted separate hierarchical regression analyses for the dyslexics as a combined group, and forthe RL group. Given the subgroup results, we would expect phonological skill among dyslexicsto account for less variability in speech perception than the CELF and Vocabulary measures. Nostrong relationships between the predictor variables and speech perception would be expected forthe RL group, as few or none of these children performed poorly on the speech perception tasks.

LANGUAGE DEFICITS AND DYSLEXIA 15
10 20 30 40 50 60 70 80
VOT (ms)
0.1
0.2
0.3
0.4
0.5
0.6
0.7
0.8
0.9
1.0
Pro
port
ion
TU
GR
espo
nses
Normal ReadersPhonological Dyslexics
10 20 30 40 50 60 70 80
VOT (ms)
0.1
0.2
0.3
0.4
0.5
0.6
0.7
0.8
0.9
1.0
Pro
prot
ion
TU
GR
espo
nses
Normal ReadersLanguage Impaired
10 20 30 40 50 60 70 80
VOT (ms)
0.1
0.2
0.3
0.4
0.5
0.6
0.7
0.8
0.9
1.0
Pro
port
ion
TU
GR
espo
nses
Normal ReadersDelay-Type Dyslexics
Figure 1. Comparison of group curves on the voice onset time (VOT) categorization task.

LANGUAGE DEFICITS AND DYSLEXIA 16
1100 1200 1300 1400 1500 1600 1700 1800
F2 onset frequency (Hz)
0.1
0.2
0.3
0.4
0.5
0.6
0.7
0.8
0.9
1.0
Pro
port
ion
SK
YR
espo
nses Normal Readers
Phonological Dyslexics
1100 1200 1300 1400 1500 1600 1700 1800
F2 onset frequency (Hz)
0.1
0.2
0.3
0.4
0.5
0.6
0.7
0.8
0.9
1.0
Pro
port
ion
SK
YR
espo
nses Normal Readers
Language Impaired
1100 1200 1300 1400 1500 1600 1700 1800
F2 onset frequency (Hz)
0.1
0.2
0.3
0.4
0.5
0.6
0.7
0.8
0.9
1.0
Pro
port
ion
SK
YR
espo
nses Normal Readers
Delay-Type Dyslexics
Figure 2. Comparison of group curves on the place of articulation (POA) categorization task.

LANGUAGE DEFICITS AND DYSLEXIA 17
As in the previous analyses, slope scores exceeding 1.2 for the VOT or POA tasks weretreated as outliers and eliminated. Phonological variables (Phoneme Deletion and Nonword Read-ing) were entered first as a block, followed by CELF and Vocabulary as a block. For dyslexics,the phonological variables accounted for less than 7% of the variance in either slope value, and thecoefficients were not significant. When CELF Word Structure and WISC Vocabulary scores wereadded, these two variables accounted for significant additional variance (11.8% for VOT slope and12.9% for POA slope). In both analyses, CELF-Word Structure was the only variable that wassignificant in the regression analyses (p < .05 for VOT, andp < .025 for POA). In contrast, sim-ilar analyses conducted for the RL group revealed that neither the phonological nor the languagevariables accounted for reliable variance in speech perception slopes.
The form of the relationship between CELF Word Structure (the strongest predictor of speechperception performance) and the mean slopes from the two speech perception tasks is shown for thedyslexic subgroups in Figure 3. There was a weak negative linear relationship between CELFscores and mean slopes (slopes get smaller as CELF score increases). Six of the Language Impairedparticipants showed moderately high to high mean slope values; in addition, several Delay andPhonological Dyslexic children also showed mean slopes above 0.25, though it is interesting thatmost of these participants also showed abnormally low scores on the CELF task. It is possible thatthese participants represent children with milder language impairments who were not included inthe Language Impaired group due to marginally better scores on the WISC-II vocabulary task.
To better characterize the relationship between performance on the language and speech per-ception tasks, curve-fitting procedures were applied to the data. These revealed that the linear com-ponent and the quadratic component were both significant atp < .05, but the best fitting functionwas the inverse. The inverse function has very high Y values closer to the X-axis, with Y valuesapproaching zero as X values increase. The results indicate that abnormalities in speech perceptionoccur only for a minority of children, those with low language skills. Slopes were uniformly low(indicating strongly categorical speech perception) among the rest of the participants and unrelatedto language ability.
The results of these regression analyses make it clear that only a minority of dyslexic partici-pants showed abnormal speech perception, and these children were primarily found among dyslex-ics with broader and more severe language impairments. Severity of the phonological deficit wasnot related to categorical speech perception among dyslexics, and in fact accounted for less than 7%of the variance in speech perception slopes. Thus, treating the subgrouping variables (phonologicalskill and language skill) as continuous variables did not substantially alter the group results reportedabove.
Discussion
The principal goal of this study was to investigate the occurrence of speech perception deficitsin developmental dyslexia, and their relationship to knowledge of phonology and other aspects oflanguage, particularly morphology. We found that the children exhibited considerable heterogeneity(Figure 4). They differed with respect to both their pattern of reading and the extent to which speechperception, phonology, and morphology were impaired. We analyzed the results with respect toseveral subgroups defined by theoretically-relevant aspects of performance. Defining subtypes inthis way clearly imposes somewhat artificial categorical distinctions on the participants. However,the purpose of this subgrouping was to facilitate investigating the contributions of several distinctfactors to dyslexic reading acquisition rather than to define diagnostic categories. We can now

LANGUAGE DEFICITS AND DYSLEXIA 18
CELF Word Structure Scaled Score
18161412108642
Com
posi
te C
ateg
oric
al P
erce
ptio
n S
core
.9
.8
.7
.6
.5
.4
.3
.2
.1
LI
DEL
PD
Figure 3. Scatter plot of mean slopes on the two categorical perception tasks and the CELF Word Structuretask.
discuss the results for the different subtypes using theories of reading to explain why specific factorstend to give rise to different behavioral patterns.
One implication of the present study, consistent with previous research, (e.g., Manis et al.,1997; Tallal, 1980; Tallal & Stark, 1982) is that only a small minority of dyslexics appear to haveperceptual difficulties. This implies that researchers must look beyond speech perception for thesource of reading difficulties in the majority of dyslexics with phonological awareness and nonwordreading difficulties. In addition, a sizeable number of dyslexics, here represented in the delay sub-group, do not have phonological skills that are out of line with their word recognition skills. Thissuggests that other factors beyond phonological ability may be relevant to variation among dyslexics(Manis et al., 1996; Stanovich et al., 1997).
Phonological Dyslexics
The phonological dyslexics in this study exhibited a behavioral profile observed in manyprevious studies. They were poor at reading both exception words and nonwords, but they weremuch worse on the latter. As in previous studies, their performance was markedly dissimilar toyounger normal readers, suggestive of a deviant developmental trajectory. These children exhibiteda phonological deficit, performing more poorly than younger normal readers on Phoneme Dele-tion and Nonword Reading. This pattern has been widely acknowledged as the dominant profile

LANGUAGE DEFICITS AND DYSLEXIA 19
Dyslexia
DyslexiaPhonological Delay-Type
Dyslexia
not speech perception.Affects phonology,
ImpairmentPhonological
SpeechPerceptionImpairment
OtherEndogenous
Deficits FactorsExogenous
- Learning disability- Visual-perceptual impairment- "Resource" limitation
Speech perceptionimpairment that hassecondary effects on
Lack of experience.
phonology and reading.
Figure 4. Summary of dyslexic subgroups.
for children with moderate to severe reading disabilities (e.g., Liberman & Shankweiler, 1985;Shankweiler et al., 1995; Wagner & Torgesen, 1987). There are explicit theories of how this prob-lem might develop. Skilled reading and the ability to pronounce nonwords depend on representingphonological information segmentally. Impaired development of segmental phonology interfereswith the acquisition of word recognition skill, but it especially affects the capacity to use knowl-edge of spelling-sound correspondences in pronouncing novel words. Harm and Seidenberg (1999)present simulations using a connectionist model of word recognition that demonstrate such effectsof phonological impairment on reading acquisition.
Our study provides evidence about two additional aspects of phonological dyslexia. First,although this group of dyslexics exhibited impaired knowledge of phonology, their performance ontwo speech perception tasks was normal. These results suggest that phonological representationscan be impaired independently of speech perception. Simulations in Harm and Seidenberg (1999)illustrate this point. They introduced anomalies in the processing of phonological information thatwere severe enough to yield reading impairments but did not affect the model’s performance onsimulated speech perception tasks. These anomalies were specific to the phonological componentof their network model: they affected the capacity of the network to represent phonological infor-mation and the dynamics of phonological processing.
Because we have not tested all aspects of speech perception, we cannot be sure that thephonological dyslexics’ speech perception was normal in all respects. Nevertheless, the presentstudy and Manis et al. (1997) together indicate that on three separate speech contrasts, a largenumber of dyslexics, many of them with severe phonological deficits, performed normally. Hence,researchers will need to examine other aspects of phonological processing to better understandphonological deficits in dyslexia.
A second finding is that the Phonological Dyslexic group’s knowledge of inflectional mor-phology was below normal for age (though not significantly so for reading grade level), indicat-ing that their behavioral impairment was not limited to reading and phonemic awareness. These

LANGUAGE DEFICITS AND DYSLEXIA 20
morphological difficulties are likely to be another consequence of the children’s phonological im-pairment. Morphological regularities such as the ones involved in the formation of English pasttense verbs have a significant phonological component. Specifically, the past tense “-ed” morphemesurfaces in three forms (-t/-d/-Id, as in BAKED, TUGGED and PATTED), with the correct surfacevariant determined by the phonological structure of the verb stem. Difficulty analyzing phonologi-cal structure can therefore affect the acquisition of morphological patterns such as past tenses. Themain impact of the phonological impairment is on generalization. Thus, although it is commonlyobserved that phonological dyslexics are poor at pronouncing nonwords such as WUG, they are alsopoor at generating novel past tenses such as WUGGED; the two deficits have a common phonolog-ical basis. Joanisse and Seidenberg (1999) describe a computational model illustrating the effectsof a phonological impairment on past tense generation. Consistent with the present data, a phono-logical impairment in the model had a bigger impact on generating past tenses for nonwords thanirregular past tenses.
An important caveat should be noted, which is that the development of phonological repre-sentations and the use of this information in reading most likely is affected by the method of read-ing instruction (Byrne, Fielding-Barnsley, Ashley, & Larsen, 1997; Olson, Wise, Ring, & Johnson,1997). Many children are exposed to whole language methods that discourage the use of phono-logical decoding strategies. The school district from which the children in the present study wereobtained relied strongly on these methods during the period in which the dyslexics were in gradesK-2. Hence, it is possible that some children classified in the Phonological Dyslexic subgroup hadlow nonword reading or low phonological awareness because of the curriculum. Alternatively, a lowemphasis on phonics instruction might have combined with otherwise mild phonological deficits toproduce more serious difficulties in nonword reading. These difficulties might be expected to lessenas children are given special education services focusing on phonics. Until such instructional vari-ables are examined carefully, theoretical explanations for phonological dyslexia may be incomplete.
Language Impaired Dyslexics
A second subgroup of dyslexics fit some of the criteria typically used in studies of devel-opmental language impairments (Leonard, 1998). These children scored poorly on two separatestandardized language tests, yet had not been categorized as mentally retarded nor low in Englishproficiency by their schools. Follow-up testing also suggested that these children had normal non-verbal cognitive abilities. Past research has indicated a strong tendency for language impaired chil-dren to have significant reading difficulties (Bishop & Adams, 1990; Catts et al., 1994; Scarborough,1990), and the present results are consistent with this observation; only one non-dyslexic reader inthe overall sample also fit the language score criteria for the Language Impaired group. (As wenoted earlier, this child was not included in analyses). All other children with language difficultieshad significantly impaired reading.
In many respects the Language Impaired group’s performance was like that of the phono-logical dyslexics. In fact, 8 of the 9 children in the Language Impaired group met the criteria weused in identifying the Phonological Dyslexic group. Like the children in the Phonological Dyslexicgroup, children in the Language Impaired group were impaired in reading both exception words andnonwords, with a more severe deficit on the latter. Both groups performed poorly on the phonemedeletion task and were below average in morphological knowledge. However, the two groups dif-fered in important ways.
The Language Impaired group exhibited clearly deviant performance on the speech percep-

LANGUAGE DEFICITS AND DYSLEXIA 21
tion tasks, whereas the Phonological Dyslexic subjects did not. The results for this group are con-sistent with previous studies implicating speech perception impairments in this population (Elliott& Hammer, 1988; Stark & Heinz, 1996; Tallal & Piercy, 1974). These children also exhibitedbroader language impairments than the phonological dyslexics. Thus, in the Language Impairedgroup, impaired language and reading may be sequelae of a basic information processing deficit in-volving phoneme perception, as suggested by Bishop (1997a), Leonard (1998) and Tallal and Stark(1980), among others. This deficit appears to be severe enough to interfere with the development ofphonological representations and with learning systematic aspects of linguistic structure (Joanisse& Seidenberg, 1998).
The Phonological Dyslexic group differed from the Language Impaired group insofar as theirperformance on the speech perception tasks was apparently normal. There are two explanations forthe difference between the Phonological Dyslexic and Language Impaired subgroups. One is thatthe Phonological Dyslexic group merely has a milder form of a speech perception deficit that doesnot disrupt categorical perception severely enough to be observed experimentally. By hypothesis,this deficit is severe enough to interfere with the difficult task of learning to read and some aspects oflanguage acquisition (e.g., learning inflectional morphology), but not as severe as in developmen-tally language impaired children. The other possibility is that the Phonological Dyslexic group’sspeech perception is genuinely normal and their deficit is localized to the representation and pro-cessing of phonology. The latter alternative suggests that although both groups have phonologicalimpairments, they derive from different causes. Harm and Seidenberg’s (1998) model is sugges-tive in this regard, showing three different types of phonology-based anomalies which produced thephonological dyslexic reading pattern; not all of these anomalies resulted in a deficit to categoricalperception in the model.
Data relevant to the two alternatives are provided by the finding that children in the LanguageImpaired group were more impaired than the Phonological Dyslexics on the speech perception andmorphology tasks, but the groups did not differ on the phoneme deletion and nonword reading tasks.In fact, the Language Impaired group was numericallybetteron both the latter tasks (though pre-liminary analyses indicated these differences were not statistically significant). These results favorthe second of the two alternatives listed above. They suggest that although the Language Impairedand Phonological Dyslexic groups exhibit similar deficits in phonology and reading, their causesmay differ, with one involving a speech perception deficit, and the other involving higher-level dif-ferences in phonological representation or processing. Speech perception deficits may have a broadimpact on spoken language acquisition, affecting vocabulary, phonology, morphology, and syntax(Bishop, 1997b), whereas the effects of higher-level phonological processing deficits in Phonolog-ical Dyslexic children may be more limited. Caution needs to be exercised because of the smallsample sizes in the present study. These issues need to be investigated further with a larger numberof participants and additional measures of phonological skill and speech perception.
There is also uncertainty about how children in the Language Impaired group in the presentstudy compare to those in other studies of developmental language impairments. Since we did nottest children in this study on overall IQ, and since several children in the Language Impaired grouphad not been previously identified with specific language deficits by their schools, it is difficult todetermine how they would compare to children who meet the classical definition of SLI. In somerespects, the language impaired children in the present study fit a broad definition of SLI; they arechildren with no frank cognitive or neurological deficits who scored poorly on standardized tasks oflanguage skills, and demonstrated poor morphological, phonological, and speech perception abili-

LANGUAGE DEFICITS AND DYSLEXIA 22
ties. In addition, while these children’s nonverbal cognitive profiles were not fully assessed, theyscored normally on a follow-up test of nonverbal cognitive ability (see footnote 2), suggesting gen-eral retardation was not a factor in this group’s reading and language profiles. Nevertheless, therelatively small sample size suggests the need for caution in generalizing to the broader popula-tion of language impaired children. As well, this group’s large standard deviations on many taskssuggests that the Language Impaired group was to some degree heterogeneous. While this is oftenobserved in populations of language impaired children (Aram & Nation, 1975; Bishop, 1997b),future research will need to examine the degree to which this variability affects the phonological,speech perception and reading measures examined in this study.
Delay Dyslexics
A third subgroup of dyslexics, which we have labeled delay dyslexics, was also quite promi-nent in our sample of poor readers. Unlike the Language Impaired and Phonological Dyslexicgroups, these children’s performance on the reading, phonology, morphology, and speech percep-tion tasks was like that of younger normal readers. Hence at the point they were tested they appearedto be developmentally delayed with respect to reading, phonology, and morphology, although theirspeech perception was within normal limits. While it is clear that these children’s behavior differs inmany respects from the phonological dyslexics, the basis for their impaired performance is unclear.One possibility is that this is a heterogeneous group of poor readers whose developmental delay hasa variety of causes Manis et al. (1996), Stanovich et al. (1997), Harm and Seidenberg (1999). Thesemay include a learning impairment not specific to reading; a visual processing deficit; a cognitiveresource limitation, and environmental factors such as lack of experience. Harm and Seidenberg’ssimulations show how such factors would produce the delay pattern.
A second possibility is that these children’s impaired performance is related to a milder formof phonological impairment. The results indicate that the delay group performed more poorly thansame-aged controls on the Nonword Reading and Phoneme Deletion tasks but better than the phono-logical dyslexics. Thus these children’s mild phonological impairment may be a consequence oftheir other behavioral deficits. Our study does not rule out this possibility, which needs to be inves-tigated further. However, this hypothesis runs into two problems. First, it suggests that the delaygroup should have exhibited the same kinds of impairments as the phonological dyslexics but to alesser degree of severity. However, the delay dyslexics’ behavioral profile was not a less-impairedversion of the phonological dyslexics’; in particular, both groups were reading at a similar gradelevel, as assessed by the Woodcock Word Identification, and also had similar scores on the Ex-ception Word reading task. It would then have to be explained why the mild and severe forms ofphonological impairment fail to give rise to differences on such tasks. Second, the simulation mod-eling results Harm and Seidenberg (1999) contradict the hypothesis in two respects. The modelingdemonstrates that the delay pattern can arise from non-phonological impairments, such as ineffi-cient learning, a resource deficit, or lack of experience. There is no comparable account of how amild phonological deficit could give rise to the delay pattern. In addition, the modeling shows thata mild impairment on phonological tasks (such as Nonword Reading) is one of the consequencesof these non-phonological impairments. Segmental phonological representations normally emergein the course of learning to read an alphabetic writing system. These will affect the course of ac-quisition and are in turn modified by the knowledge that is acquired (Morais et al., 1979; Wagner,Torgesen, & Rashotte, 1994). Non-phonological factors that delay the course of acquisition alsoaffect progress in developing these representations. Thus, the mild phonological impairments seen
LANGUAGE DEFICITS AND DYSLEXIA 23
in the delay group are a consequence of other factors that are the proximal cause of the behavioraldelay.
The causes of the impairments observed in the delay group are less well understood thanthe causes of phonological dyslexia. One question that needs to be addressed in future research iswhether the delay group differs with respect to etiology. There is a need to use other behavioralmeasures to differentiate between very different causes, such as a visual processing impairment vs.a lack of experience, that nonetheless give rise to similar behavioral patterns. A second questionconcerns the nature of the phonological deficit in the delay group: is it a cause or an effect oftheir impaired reading acquisition? If the deficit is a consequence of another problem, it might beexpected to resolve in children whose reading skills eventually improve. True phonological deficits,in contrast, seem constitutional in nature, are difficult to remediate, and tend to persist even in adultdyslexics who eventually acquire greater reading proficiency (Bruck, 1992).
Conclusions
This research, along with earlier research by Manis et al. (1996), Castles and Coltheart(1993), Murphy and Pollatsek (1994), Stanovich et al. (1997) and others, suggests there is con-siderable variability among children who are classified as dyslexic, with regard to both the patternof impaired reading and the extent to which they exhibit impaired use of language. In addition, how-ever, the present results indicate that there is also variability with respect to the speech perceptionabilities of dyslexics, and that this variability is related to language deficits in dyslexics.
As Figure 4 illustrates, there is a major break between phonological and non-phonological(delay) types of dyslexia. Within the phonological subtype, there is a standard pattern in whichthe reading impairment is secondary to impaired phonology. Other phonological dyslexics exhibitbroader language impairments; their deficits appear to be strongly related to impaired speech per-ception.3 Children on the delay side exhibit a different pattern of impairment. Both their reading(e.g., exception words and nonwords) and their language (e.g., phonology, morphology) are like thatof younger normal readers. As we have suggested, this pattern may have several causes includingmere lack of reading experience or failure to learn efficiently.
Although there are two broad behavioral patterns in dyslexia, both the empirical results pre-sented here and the results of simulation modeling suggest that each pattern can have more than oneunderlying cause. Phonological dyslexia, for example, may derive from deficits in either speechperception or other aspects of phonology. The delay pattern can be produced by both endogenousfactors (such as a lack of computational resources) and exogenous factors (such as a lack of expe-rience). These results suggest that it may not be valid to assume that children who exhibit similarpatterns of impaired reading have the same underlying deficits. The different potential causes of agiven pattern can be differentiated by using additional measures that assess other aspects of languageand experience.
References
Adams, M. (1990).Beginning to read.Cambridge, MA: MIT Press.
3As we mentioned above, there might exist a third group of “instructional” phonological dyslexics who have normalphonological processing capacities but are behaviorally impaired because of teaching methods that strongly discouragereliance on phonological information in reading (e.g., Smith, 1983). We would expect these children to benefit greatlyfrom appropriate types of remediation and so their deficits may only be temporary.

LANGUAGE DEFICITS AND DYSLEXIA 24
Aram, D. M., & Nation, J. E. (1975). Patterns of language behavior in children with developmental languagedisorders.Journal of Speech and Hearing Disorders, 18, 229-241.
Berko, J. (1958). The child’s learning of English morphology.Word, 14, 150-177.
Bishop, D. V. M. (1997a). Listening out for subtle deficits.Nature, 387, 129-130.
Bishop, D. V. M. (1997b).Uncommon understanding: Development and disorders of language comprenen-sion in children.Hove, East Sussex, UK: Psychology Press.
Bishop, D. V. M., & Adams, C. (1990). A prospective study of the relationship between specific language im-pairment, phonological disorders, and reading retardation.Journal of Child Psychology and Psychiatry,31, 1027-1050.
Bowers, P. G., & Swanson, L. B. (1991). Naming speed deficits in reading disability: Multiple measures ofa singular process.Journal of Experimental Child Psychology, 51, 195-219.
Bradley, L., & Bryant, P. (1983). Categorizing sounds and learning to read – A causal connection.Nature,301, 419-421.
Bruce, D. (1964). The analysis of word sounds.British Journal of Educational Psychology, 34, 158-170.
Bruck, M. (1992). Persistence of dyslexics’ phonological awareness deficits.Developmental Psychology,28, 874-886.
Byrne, B., Fielding-Barnsley, J., Ashley, L., & Larsen, K. (1997). Assessing the child’s and the environment’scontribution to reading acquisition: What we know and what we don’t know. In B. Blachman (Ed.),Foundations of reading acquisition and dyslexia.Mahwah, NJ: Lawrence Erlbaum Associates.
Byrne, B., & Shea, P. (1979). Semantic and phonetic memory codes in beginning readers.Memory andCognition, 7, 333-338.
Castles, A., & Coltheart, M. (1993). Varieties of developmental dyslexia.Cognition, 47(2), 149-180.
Catts, H., Hu, C.-F., Larriv´ee, L., & Swank, L. (1994). Early identification of reading disabilities in childrenwith speech-language impairments. In R. Watkins & M. Rice (Eds.),Specific Language Impairments inchildren(p. 145-160). Baltimore, MD: Paul H. Brookes Publishing co.
Denckla, M., & Rudel, R. (1976). Rapid automatized naming (R.A.N.): Dyslexia differentiated from otherlearning disabilities.Neuropsychologia, 14, 471-479.
Elliott, L. L., & Hammer, M. A. (1988). Longitudinal changes in auditory discrimination in normal childrenand children with language-learning problems.Journal of Speech and Hearing Disorders, 53, 467-474.
Godfrey, J., Syrdal-Lasky, A., Millay, K., & Knox, C. (1981). Performance of dyslexic children on speechperception tests.Journal of Experimental Child Psychology, 32, 401-424.
Harm, M. W., & Seidenberg, M. S. (1999). Phonology, reading, and dyslexia: Insights from connectionistmodels.Psychological Review, 163(3), 491-528.
Hayes, D. (1988). Speaking and reading: Distinct patterns of word choice.Journal of Memory and Language,27, 572-585.
Joanisse, M. F., & Seidenberg, M. S. (1998). Specific Language Impairment: A deficit in grammar orprocessing?Trends in Cognitive Sciences, 2(7), 240-247.
Joanisse, M. F., & Seidenberg, M. S. (1999). Impairments in verb morphology following brain injury: Aconnectionist model.Proceedings of the National Academy of Science, USA, 96(13), 7592-7597.
Kamhi, A. G., & Catts, H. W. (1986). Toward an understanding of developmental language and readingdisorders.Journal of Speech and Hearing Disorders, 51(4), 337-347.

LANGUAGE DEFICITS AND DYSLEXIA 25
Keating, P., & Manis, F. (1998). The keating-manis phoneme deletion test. InUCLA working papers inphonetics(Vol. 96, p. 162-165). Los Angeles: The UCLA Phonetics Laboratory.
Klatt, D. (1990). Analysis, synthesis, and perception of voice quality variations among female and maletalkers.The Journal of the Acoustical Society of America, 87, 820-57.
Leonard, L. (1998).Children with specific language impairment.Cambridge, MA: MIT Press.
Liberman, A., Harris, K., Hoffman, H., & Griffith, B. (1957). The discrimination of speech sounds withinand across phoneme boundaries.Journal of Experimental Psychology, 54(5), 358-368.
Liberman, A. M. (Ed.). (1996).Speech: A special code.Cambridge, MA: MIT Press.
Liberman, I., & Shankweiler, D. (1985). Phonology and the problems of learning to read and write.Remedialand Speech Education, 6, 8-17.
Lyon, G. R. (1995). Toward a definition of dyslexia.Annals of Dyslexia, 45, 3-27.
Manis, F., McBride-Chang, C., Seidenberg, M. S., Keating, P., Doi, L. M., Munson, B., & Petersen, A. (1997).Are speech perception deficits associated with developmental dyslexia?Journal of Experimental ChildPsychology, 66, 211-235.
Manis, F., Seidenberg, M. S., Doi, L., McBride-Chang, C., & Petersen, A. (1996). On the basis of twosubtypes of developmental dyslexia.Cognition, 58, 157-195.
Manis, F. R., Custodio, R., & Szeszulski, P. (1993). Development of phonological and orthographic skill: A2-year longitudinal study of dyslexic children.Journal of Experimental Child Psychology, 56, 64-86.
Masterson, J., Hazan, V., & Wijatilake, L. (1995). Phonemic processing problems in developmental phono-logical dyslexia.Cognitive Neuropsychology, 12(3), 233-259.
Mody, M., Studdert-Kennedy, M., & Brady, S. (1997). Speech perception deficits in poor readers: Auditoryprocessing or phonological coding?Journal of Experimental Psychology, 64, 199-231.
Morais, J., Cary, L., Alegria, J., & Bertelson, P. (1979). Does awareness of speech as a sequence of phonesarise spontaneously?Cognition, 7, 323-331.
Murphy, L., & Pollatsek, A. (1994). Developmental dyslexia: Heterogeneity without discrete subgroups.Annals of Dyslexia, 44, 120-146.
Nittrouer, S. (1999). Do temporal processing deficits cause phonological processing problems?Journal ofSpeech, Language, and Hearing Research, 42, 925-942.
Olson, R. K., Wise, B. W., Ring, J., & Johnson, M. (1997). Computer-based remedial training in phonemeawareness and phonological decoding: Effects on the post-training development of word recognition.Scientific Studies of Reading, 1, 235-253.
Rack, J., Snowling, M., & Olson, R. (1992). The nonword reading deficit in developmental dyslexia: Areview.Reading Research Quarterly, 27, 29-53.
Reed, M. A. (1989). Speech perception and the discrimination of brief auditory cues in reading disabledchildren.Journal of Experimental Child Psychology, 48, 270-292.
Scarborough, H. (1990). Very early language deficits in dyslexic children.Child Development, 61, 1728-1743.
Semel, E., Wiig, E., & Secord, W. (1995).Clinical Evaluation of Language Fundamentals(3 ed.). SanAntonio TX: The Psychological Corporation.

LANGUAGE DEFICITS AND DYSLEXIA 26
Shankweiler, D., Crain, S., Katz, L., Fowler, A. E., Liberman, A. M., Brady, S. A., Thornton, R., Lundquist,E., Dreyer, L., Fletcher, J. M., Stuebing, K. K., Shaywitz, S. E., & Shaywitz, B. A. (1995). Cognitiveprofiles of reading-disabled children: Comparison of language skills in phonology, morphology andsyntax.Psychological Science, 6(3), 149-156.
Shankweiler, D., Liberman, I. Y., Mark, L. S., Fowler, C. A., & Fischer, F. W. (1979). The speech code andlearning to read.Journal of Experimental Psychology: Human Learning and Memory, 5, 531-545.
Smith, F. (1983). Twelve easy ways to make learning to read difficult. In F. Smith (Ed.),Essays into literacy(p. 11-25). London: Heinemann Educational Books.
Snowling, M. (1987).Dyslexia: A cognitive developmental review.Oxford: Blackwell.
Stanovich, K., Siegel, L., & Gottardo, A. (1997). Converging evidence for phonological and surface subtypesof reading disability.Journal of Educational Psychology, 89(1), 114-127.
Stanovich, K. E. (1988a). Explaining the differences between the dyslexic and the garden-variety poor reader:The phonological-core variable-difference model.Journal of Learning Disabilities, 21, 590-604.
Stanovich, K. E. (1988b). The right and wrong places to look for the cognitive locus of reading disability.Annals of Dyslexia, 38, 154-177.
Stark, R., & Heinz, J. M. (1996). Vowel perception in children with and without language impairment.Journal of Speech and Hearing Research, 39, 860-869.
Tallal, P. (1980). Auditory temporal perception, phonics, and reading disabilities in children.Brain andLanguage, 9, 182-198.
Tallal, P., & Piercy, M. (1974). Developmental aphasia: Rate of auditory processing and selective impairmentof consonant perception.Neuropsychologia, 12, 83-94.
Tallal, P., & Stark, R. E. (1980). Speech perception of language-delayed children. In G. H. Yeni-Komshian,J. F. Kavanagh, & C. A. Ferguson (Eds.),Child phonology(Vol. 2: Perception, p. 155-171). New York:Academic Press.
Tallal, P., & Stark, R. E. (1982). Perceptual/motor profiles of reading impaired children with or withoutcomcomitant oral language deficits.Annals of Dyslexia, 32, 163-176.
Thibodeau, L. M., & Sussman, H. M. (1979). Performance on a test of categorical perception of speech innormal and communication disordered children.Journal of Phonetics, 7, 379-391.
Vellutino, F. R. (1979).Dyslexia: Theory and research.Cambridge, MA: MIT Press.
Vogel, S. A. (1977). Morphological ability in normal and dyslexic children.Learning Disorders, 10(1),41-49.
Wagner, R. K., & Torgesen, J. K. (1987). The nature of phonological processing and its causal role in theacquisition of reading skills.Psychological Bulletin, 101, 192-212.
Wagner, R. K., Torgesen, J. K., & Rashotte, C. A. (1994). Development of reading-related phonologicalprocessing abilities: New evidence of bi-directional causality from a latent variable longitudinal study.Developmental Psychology, 30, 73-87.
Werker, J., & Tees, R. (1987). Speech perception in severely disabled and average reading children.CanadianJournal of Psychology, 41(1), 48-61.
Weschler, D. A. (1992).Weschler Intelligence Scale for Children – III.San Antonio, TX: The PsychologicalCorporation.
Wiig, E., Semel, E., & Crouse, M. (1973). The use of morphology by high risk and learning disabled children.Journal of Learning Disabilities, 6, 457-465.

LANGUAGE DEFICITS AND DYSLEXIA 27
Wolf, M. (1986). Rapid alternating stimulus naming in the developmental dyslexias.Brain and Language,27, 360-379.
Woodcock, R. W. (1989).Woodcock Reading Mastery Tests – Revised.Circle Pines, MN: Amercian GuidanceService.