language diversity and attainment in secondary schools · language diversity and attainment in ......
TRANSCRIPT
Language Diversity and Attainment in Secondary Schools
Feyisa Demie James McDonald Andrew Hau
Feyisa Demie James McDonald Andrew Hau Published by Lambeth Research and Statistics Unit Education, Learning and Skills International House, Canterbury Crescent, London, SW9 7QE © Authors. All rights reserved. May 2016 ISBN 978-1-910428-12-2
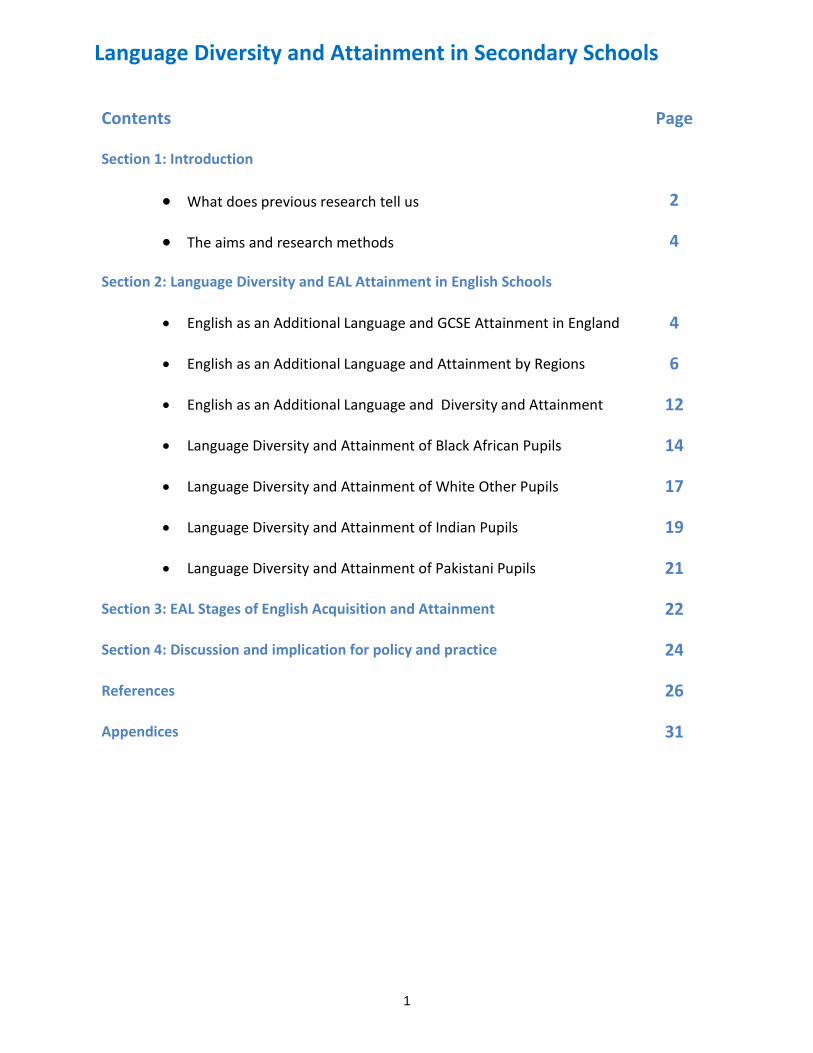
Language Diversity and Attainment in Secondary Schools
Contents Page
Section 1: Introduction
• What does previous research tell us 2
• The aims and research methods 4
Section 2: Language Diversity and EAL Attainment in English Schools
• English as an Additional Language and GCSE Attainment in England 4
• English as an Additional Language and Attainment by Regions 6
• English as an Additional Language and Diversity and Attainment 12
• Language Diversity and Attainment of Black African Pupils 14
• Language Diversity and Attainment of White Other Pupils 17
• Language Diversity and Attainment of Indian Pupils 19
• Language Diversity and Attainment of Pakistani Pupils 21
Section 3: EAL Stages of English Acquisition and Attainment 22
Section 4: Discussion and implication for policy and practice 24
References 26
Appendices 31
1
1. Introduction
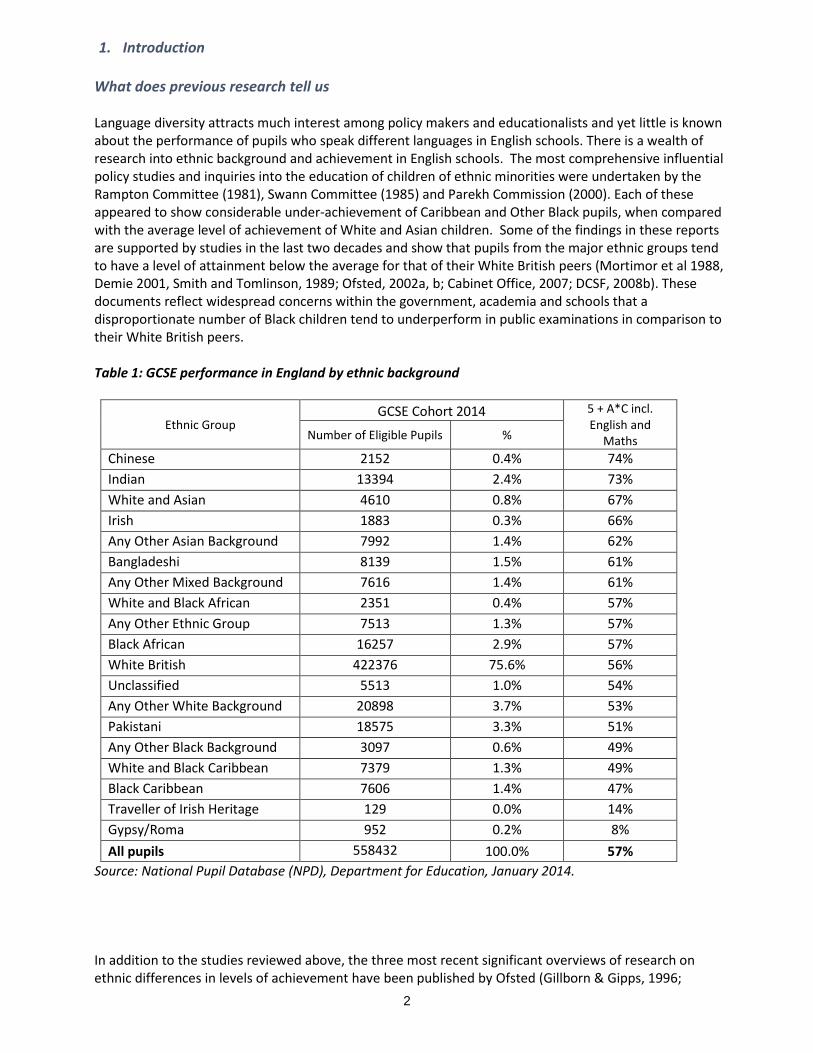
What does previous research tell us Language diversity attracts much interest among policy makers and educationalists and yet little is known about the performance of pupils who speak different languages in English schools. There is a wealth of research into ethnic background and achievement in English schools. The most comprehensive influential policy studies and inquiries into the education of children of ethnic minorities were undertaken by the Rampton Committee (1981), Swann Committee (1985) and Parekh Commission (2000). Each of these appeared to show considerable under-achievement of Caribbean and Other Black pupils, when compared with the average level of achievement of White and Asian children. Some of the findings in these reports are supported by studies in the last two decades and show that pupils from the major ethnic groups tend to have a level of attainment below the average for that of their White British peers (Mortimor et al 1988, Demie 2001, Smith and Tomlinson, 1989; Ofsted, 2002a, b; Cabinet Office, 2007; DCSF, 2008b). These documents reflect widespread concerns within the government, academia and schools that a disproportionate number of Black children tend to underperform in public examinations in comparison to their White British peers.
Table 1: GCSE performance in England by ethnic background
Ethnic Group GCSE Cohort 2014 5 + A*C incl.
English and Maths Number of Eligible Pupils %
Chinese 2152 0.4% 74% Indian 13394 2.4% 73% White and Asian 4610 0.8% 67% Irish 1883 0.3% 66% Any Other Asian Background 7992 1.4% 62% Bangladeshi 8139 1.5% 61% Any Other Mixed Background 7616 1.4% 61% White and Black African 2351 0.4% 57% Any Other Ethnic Group 7513 1.3% 57% Black African 16257 2.9% 57% White British 422376 75.6% 56% Unclassified 5513 1.0% 54% Any Other White Background 20898 3.7% 53% Pakistani 18575 3.3% 51% Any Other Black Background 3097 0.6% 49% White and Black Caribbean 7379 1.3% 49% Black Caribbean 7606 1.4% 47% Traveller of Irish Heritage 129 0.0% 14% Gypsy/Roma 952 0.2% 8% All pupils 558432 100.0% 57%
Source: National Pupil Database (NPD), Department for Education, January 2014. In addition to the studies reviewed above, the three most recent significant overviews of research on ethnic differences in levels of achievement have been published by Ofsted (Gillborn & Gipps, 1996;
2
Gillborn & Mirza, 2000), DfE (2009), Bradbury (2011), and Strand (2013, 2010 and 2012). These research reports also reviewed the stage of recent changes in the educational achievements of ethnic minority pupils. The results confirm previous research findings which suggest considerable under-achievement of Caribbean and Other Black pupils, on average, compared with White British and Asian children. This concern has increased in the wake of recent KS1, KS2, KS3 and GCSE results which show the under-achievement of Black African, Pakistani and Black Caribbean pupils in both primary and secondary schools (DfE 2006; Demie 2001; Strand 2012). This is further supported by recent studies by Dustmann et al (2010) which argued that at the start of school, pupils from most ethnic groups substantially lag behind White British pupils and the gaps decline for all groups through compulsory schooling. The Department for Education (DfE) School Census also suggests that amongst those ending their compulsory education in the UK, Black Caribbean and Pakistani pupils were least successful academically with only 47% of Black Caribbean, 51% of Pakistani pupils achieving 5 or more GCSEs at grade A* to C including English and Maths (Table 1). However, we need to be cautious as ethnicity categorisation has not always been helpful to study achievement of the performance of all pupils in English schools. We would argue that none of these ethnic categories are homogenous. Research shows that the worryingly low achievement levels of many pupils in British schools are masked by Government statistics that fail to distinguish between different European, African and Asian ethnic groups (Hollingsworth and Mansaray 2012; Demie 2011; Demie and Lewis 2010, 2011). Previous research has noted that the recording of ethnicity in England usually refers, confusingly, to a combination of national boundaries (Indian, Pakistani, Bangladeshi) but also colour (Black, White) and more general geographic distinctions, that supersede national boundaries (Black Caribbean, Black African) (see Hollingsworth and Mansaray 2012;Von Ahn et all 2010; Mitton 2011; Demie 2011). Research shows that collapsing into White Other makes comparison problematic as this group contains a range of other European ethnic groups such as Polish, Czech, Portuguese, Spanish, Turkish, Albanian, Russian etc. Similarly the conflation of the Black African, Black Caribbean, Indian, Pakistani and Bangladeshi ethnic groups is not helpful and tells us little about the role of language. There is therefore a need to unpick how national ethnic categorisations may be used to improve our understanding of the performance of pupils who speak different languages in schools. However, even in the few studies where ethnic differences and educational achievement are considered, the importance of language spoken at home and of English language fluency in achievement between ethnic groups is rarely reported. Thus, it is not possible to tell from most studies whether pupils who are fully fluent in English from different ethnic groups do better than those who are not fluent in English. Furthermore, previous studies lacked data on differences in performance between the different ethnic groups by language spoken. The few recent studies of attainment and language spoken show that there are significant differences between ethnic categories. For example Demie and McLean (2007) KS2 and GCSE data analysis of Black African ethnic group achievement by language confirm that Igbo, Yoruba and Twi- Fante speaking Black African pupils achieved better than other ethnic groups including Indian and White British at a national level. In contrast, Somali and Lingala speakers tend to have very low attainment compared to other groups. This is further supported by Von Ahn et al (2010:7) analysis of KS2 results that indicate the ‘Black African group has some of the highest and some of the lowest achieving groups. For example, the three lowest achieving groups – Lingala, French and Somali speakers tend to have low attainment well below that of the lowest attaining ethnic group overall (Black Caribbean), whilst Igbo, Yoruba and English speaking Black Africans achieve as well as the White British group.’ These research findings also suggest that ‘some of the ethnic grouping may be too broad to be useful, and that language data can provide more insight into which pupils may be in need of particular support.’ We would argue that there are large attainment gaps in England when data is analysed further by language spoken and English proficiency in addition to ethnic background.
3
The Aims and Research Methods
Research questions This research paper considers empirical evidence from England and examines pupil performance differences among the main ethnic groups, by language spoken at home. Three overarching questions guided this research:
• What does the data tell us about language diversity and attainment? • What is the relationship beteen English language proficiency and attainment? • What are the implications for policy and practice?
The data The strength of the article is its data source of the National Pupil Database. The National Pupil Database (NPD) is a pupil level database which matches pupil and school characteristic data to pupil level attainment. The sample size of the pupils who completed GCSE in summer 2014 is 558,432. The data on state schools is highly accurate and has a number of key features. Firstly, the fact that it is a census dataset containing the population of all pupils in state schools is very helpful for a number of different analyses, compared to a dataset based on just a sample of schools. It provides a much richer set of data on school and pupil characteristics. The dataset includes information on language spoken at home, ethnicity, free school meals, gender and results at Key Stage 4. Measures of pupil background Pupil Performance - It is important to note that in the English education system, pupils aged 15 to 16 years at the end of KS4 take General Certificate of Secondary Education (GCSE) exams. These are the major qualifications taken by pupils at the end of compulsory schooling at the age of 16, and are a series of examinations in the individual subjects the pupils have been studying. For the purpose of this paper underachievement is defined as low attainment which is attainment that is below national average or below age-related expectations. 2. Language Diversity and Attainment in English Schools
English as an Additional Language and GCSE Attainment in England
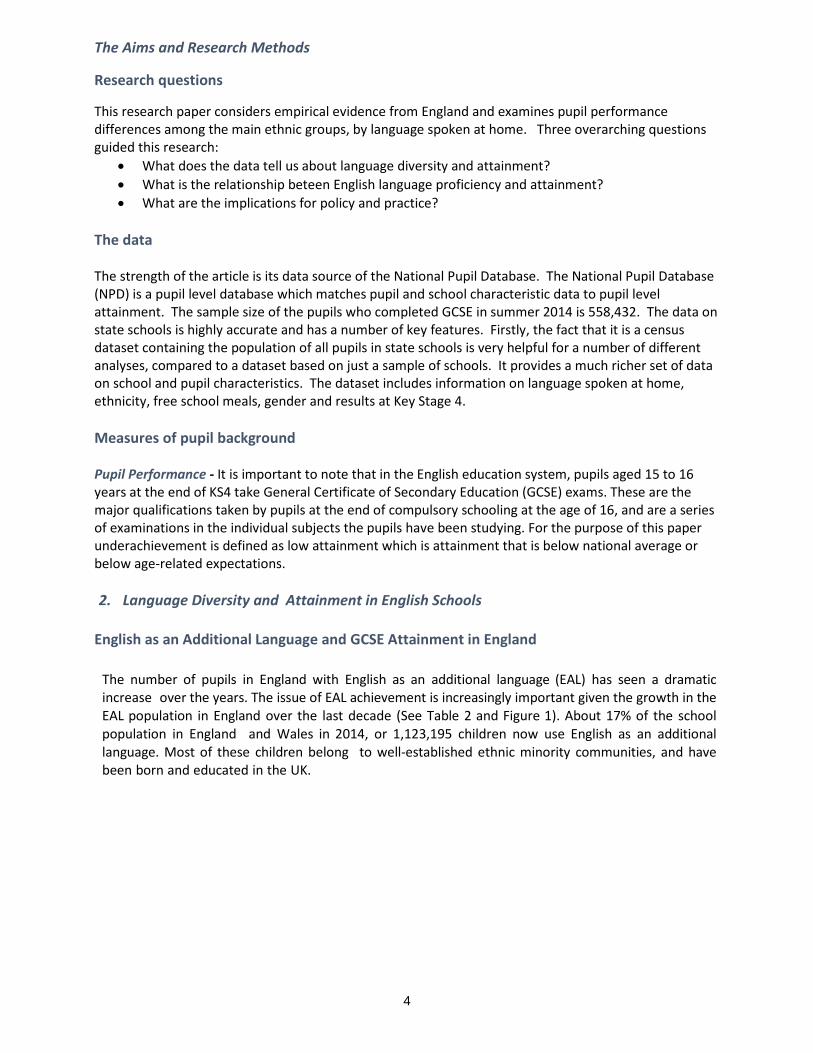
The number of pupils in England with English as an additional language (EAL) has seen a dramatic increase over the years. The issue of EAL achievement is increasingly important given the growth in the EAL population in England over the last decade (See Table 2 and Figure 1). About 17% of the school population in England and Wales in 2014, or 1,123,195 children now use English as an additional language. Most of these children belong to well-established ethnic minority communities, and have been born and educated in the UK.
4

Table 2. EAL population in primary, secondary and special schools in England, 1997-2014
PRIMARY SECONDARY TOTAL
No. of pupils with
EAL
% of pupils with EAL
No. of pupils with
EAL
% of pupils with EAL
No. of pupils with
EAL
% of pupils with EAL
1997 276,200 7.8 222,800 7.3 499,000 7.6 1998 303,635 8.5 238,532 7.8 542,167 8.2 1999 301,800 8.4 244,684 7.8 546,484 8.1 2000 311,512 8.7 255,256 8.0 566,768 8.4 2001 331,512 9.3 258,893 8.0 590,405 8.7 2002 350,483 10.0 282,235 8.6 632,718 9.3 2003 362,690 10.4 291,110 8.8 653,800 9.6 2004 376,600 11.0 292,890 8.8 669,490 9.9 2005 395,270 11.6 299,200 9.0 694,470 10.3 2006 419,600 12.5 314,950 9.5 734,550 11.0 2007 447,650 13.5 342,140 10.5 789,790 12.0 2008 470,080 14.4 354,300 10.8 824,380 12.6 2009 491,340 15.2 362,600 11.1 853,940 13.1 2010 518,020 16.0 378,210 11.6 896,230 13.8 2011 547,030 16.8 399,550 12.3 946,580 14.6 2012 577,555 17.5 417,765 12.9 995,320 15.2 2013 612,160 18.1 436,150 13.6 1,061,010 15.9 2014 654,405 18.7 455,205 14.3 1,123,195 16.6
Figure 1. EAL population in secondary schools in England, 1997-2014
Historically, nationally at Key Stage 4, pupils with English as an additional language achieved less well at GCSE than those with English as their first language. However, in 2014, both EAL and non-EAL pupils achieved 57% for the indicator 5 or more A* to C including English and Maths. The gap in performance
0
50,000
100,000
150,000
200,000
250,000
300,000
350,000
400,000
450,000
500,000
1997 1998 1999 2000 2001 2002 2003 2004 2005 2006 2007 2008 2009 2010 2011 2012 2013 2014
5
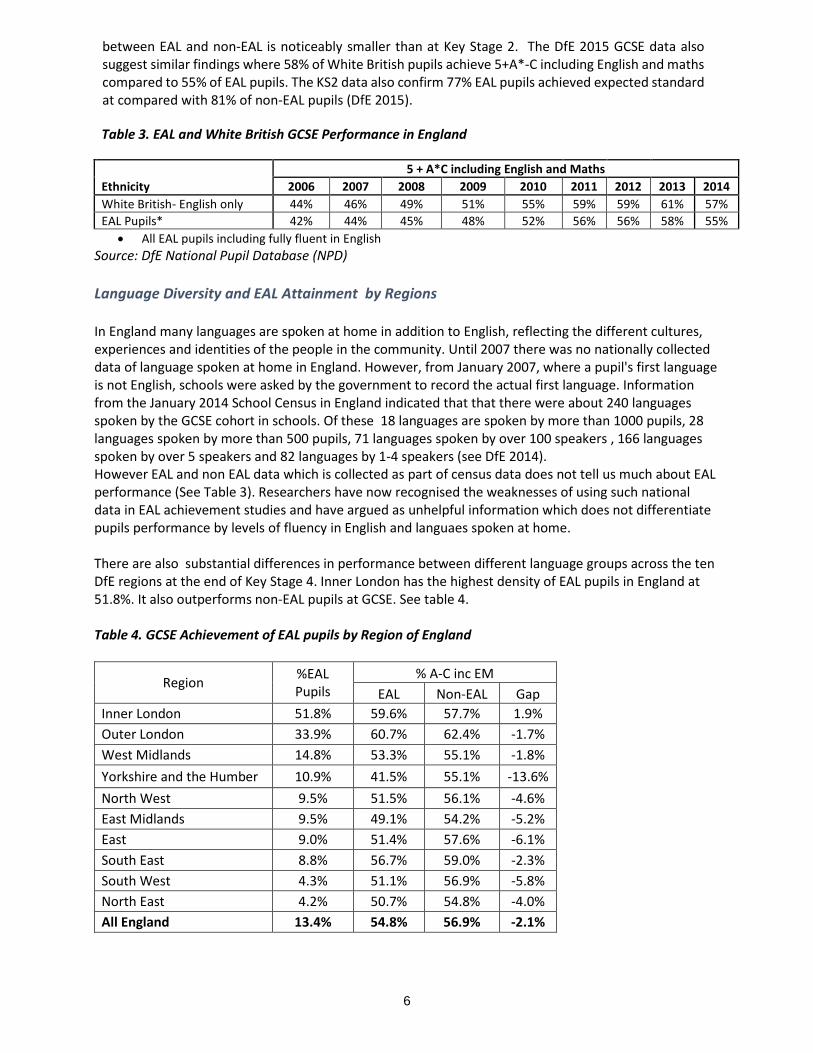
between EAL and non-EAL is noticeably smaller than at Key Stage 2. The DfE 2015 GCSE data also suggest similar findings where 58% of White British pupils achieve 5+A*-C including English and maths compared to 55% of EAL pupils. The KS2 data also confirm 77% EAL pupils achieved expected standard at compared with 81% of non-EAL pupils (DfE 2015). Table 3. EAL and White British GCSE Performance in England
5 + A*C including English and Maths Ethnicity 2006 2007 2008 2009 2010 2011 2012 2013 2014 White British- English only 44% 46% 49% 51% 55% 59% 59% 61% 57% EAL Pupils* 42% 44% 45% 48% 52% 56% 56% 58% 55%
• All EAL pupils including fully fluent in English Source: DfE National Pupil Database (NPD)
Language Diversity and EAL Attainment by Regions In England many languages are spoken at home in addition to English, reflecting the different cultures, experiences and identities of the people in the community. Until 2007 there was no nationally collected data of language spoken at home in England. However, from January 2007, where a pupil's first language is not English, schools were asked by the government to record the actual first language. Information from the January 2014 School Census in England indicated that that there were about 240 languages spoken by the GCSE cohort in schools. Of these 18 languages are spoken by more than 1000 pupils, 28 languages spoken by more than 500 pupils, 71 languages spoken by over 100 speakers , 166 languages spoken by over 5 speakers and 82 languages by 1-4 speakers (see DfE 2014). However EAL and non EAL data which is collected as part of census data does not tell us much about EAL performance (See Table 3). Researchers have now recognised the weaknesses of using such national data in EAL achievement studies and have argued as unhelpful information which does not differentiate pupils performance by levels of fluency in English and languaes spoken at home. There are also substantial differences in performance between different language groups across the ten DfE regions at the end of Key Stage 4. Inner London has the highest density of EAL pupils in England at 51.8%. It also outperforms non-EAL pupils at GCSE. See table 4. Table 4. GCSE Achievement of EAL pupils by Region of England
Region %EAL Pupils
% A-C inc EM EAL Non-EAL Gap
Inner London 51.8% 59.6% 57.7% 1.9% Outer London 33.9% 60.7% 62.4% -1.7% West Midlands 14.8% 53.3% 55.1% -1.8% Yorkshire and the Humber 10.9% 41.5% 55.1% -13.6% North West 9.5% 51.5% 56.1% -4.6% East Midlands 9.5% 49.1% 54.2% -5.2% East 9.0% 51.4% 57.6% -6.1% South East 8.8% 56.7% 59.0% -2.3% South West 4.3% 51.1% 56.9% -5.8% North East 4.2% 50.7% 54.8% -4.0% All England 13.4% 54.8% 56.9% -2.1%
6

In Figure 2, we can see that the density of pupils with English as an Additional Language varies widely across England, with as many as 70% to 79% of pupils recorded in some areas, particularly inner-cities. If we look at languages with a cohort of more than 1000 nationally, the highest performing language group is Tamil with 75% achieving 5 or more GCSEs graded A* to C including English and Maths. The lowest performing group is Pashto/Pakhto with only 37% of its cohort of 1023 achieiving this indicator. The highest cohort for a language other than English was Urdu with 7012 speakers. Nationally, their performance is below the national average at 53%, but in Inner London they are 2 percentage points above the national average, and in Outer London 6 percentage points above. On the other hand, in Yorkshire and the Humber, a not insignificant cohort of 966 Urdu speakers are 12 percentage points below the national average. Polish and Somali speakers, with cohorts of 4064 and 3084 pupils, whilst achieving at the national average in Inner London, are below in all other regions. Portuguese speaking pupils with a cohort of 1973, are below the national average in all regions, ranging from 12 percentage points below in Inner London to 32 percentage points below in Yorkshire and the Humber. Cohort-wise, Yoruba is the highest African language spoken after Somali pupils with 1001 speakers. In every DfE region in England they are between 10 and 43 percentage points above the national average. See Annex B for details.
7
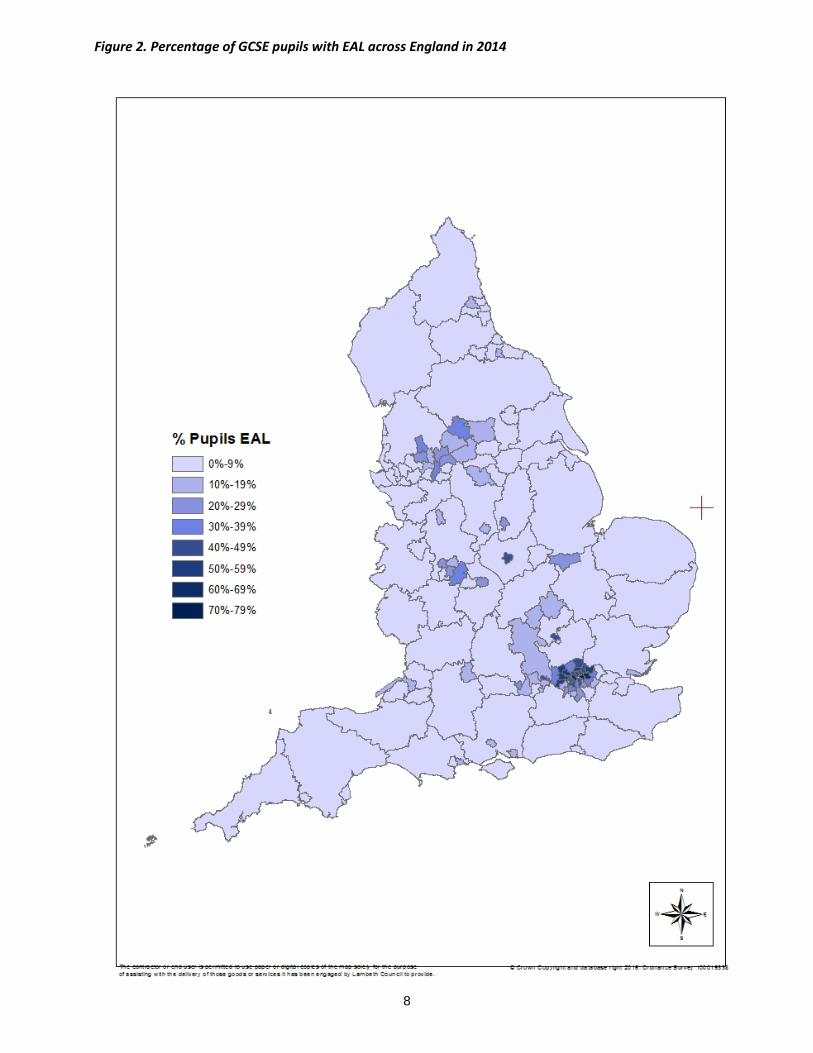
Figure 2. Percentage of GCSE pupils with EAL across England in 2014
8

Overall the analysis by language category illuminates the spread of attainment within ethnic categories and suggests that some of the commonly used ethnic groupings may be too broad to be useful, and that language data can provide greater insight into which pupils may be in need of particular support. Figure 3, shows the gap by region between EAL and non-EAL pupils and the national GCSE average of 57%. Fig 3: EAL and non-EAL Achievement by Region at GCSE 2014
Figure 4, overleaf, shows the distribution of GCSE results for EAL pupils in 2014 across England reduced further to a Local Authority Level.
However, it is important to note from the above analysis that using EAL status alone is not necessarily an accurate marker for studying the impact on attainment. Knowing that a pupil has English as an additional language has limited use when researching underachieving groups. EAL is a very heterogeneous group made up of pupils from many different ethnic and cultural backgrounds, which are likely to show a wide variation in achievement. We need to be cautious and recognise that ‘EAL is not a precise measure of language proficiency at pupil-level. ‘First language’ which is used here is the language to which a child was initially exposed during early development and continues to be exposed to in the home or in the community. It does not mean that pupils are necessarily fluent in a language other than English, or that they cannot speak English fluently. Pupils can therefore be identified in the census as EAL when they are bilingual and have no specific need of support to access mainstream education in English.’ (See DfE 2016a:27)
-16%
-14%
-12%
-10%
-8%
-6%
-4%
-2%
0%
2%
4%
6%
OuterLondon
InnerLondon
SouthEast
WestMidlands
NorthWest
East SouthWest
NorthEast
EastMidlands
Yorkshireand theHumber
% point gap from national GCSE Average
Non-EAL EAL
9

A number of researchers have also commented on the inadequacy of EAL/not EAL as an accurate marker in statistical studies e.g.
‘Using EAL status alone is not necessarily an accurate marker for studying the impact on attainment. Knowing that a pupil has English as an additional language has limited use when researching underachieving groups. EAL is a very heterogeneous group made up of pupils from many different ethnic and cultural backgrounds, which are likely to show a wide variation in achievement.’ (Demie, Hau and McDonald, 2016: 7)
Other researchers have also argued that:-
‘The NPD EAL data clearly needs to be interpreted with some caution. It is explicitly not a measure of the pupil’s fluency in English: pupils recorded as EAL may speak no English at all or they may be fully fluent in English. Indeed there is huge heterogeneity within the group coded as EAL. On the one hand, this might include second or third generation ethnic minority students who may be exposed to a language other than English as part of their cultural heritage but use it rarely if at all, using English as their everyday language and being quite fluent in it. At the other extreme it might include new migrants arriving in England who speak no English at all, and may have varying levels of literacy in their previous country of origin’ (Strand et al 2015).
Leedham (2016) also noted that as a result of using EAL status, undifferentiated by stages or levels of proficiency and language spoken at home, a number of previous researchers and policy makers ‘reinforced a misleading and inaccurate picture of EAL achievement by repeating a familiar narrative that EAL learners outperforming their monolingual peers. She argued that meaningful analysis of outcomes of EAL pupils achievement is only achieved through data disaggregated by stages of fluency in English, languages and ethnic background.’ We would further argue that EAL and non EAL data which is collected as part of census data does not tell us much about EAL performance (Demie and Strand 2006, Strand et al 2015). Researchers have now recognised the weaknesses of using such national data in EAL achievement studies and have argued as unhelpful information which does not differentiate pupils performance by levels of fluency in English or language background (Demie 2015, Von Ahn et al 2011, Demie and Strand 2006). There is a need for more research on langaes spoken at home and attainment including the relationship between stages of fluency in English and attainment to improve our knowledge about EAL pupils performance schools. Other languages spoken at home and stage of fluency in English is therefore potentially a powerful predictor of differential attainment among EAL pupils at all key stages and an important factor in pupil achievement. This will be examined in the following sections.
10

Figure 4. EAL Pupils achieving 5 or more GCSEs at grades A* to C including English and Maths
11

English as an Additional Language and Diversity and Attainment The above analysis of EAL performance by regions is invaluable in improving our knowledge related to a pupil’s background and achievement, but it is useful to be cautious when using the national School Census categories. Even in the few studies where EAL educational achievement are considered, the importance of language diversity in achievement between language groups is rarely reported. EAL is clearly an important category which is connected to ethnicity, though obviously does not map straightforwardly onto it. Table 5 shows language spoken for pupils nationally at Key Stage 4. After English speakers (86.6% of KS4 pupils), the most common groups were the Asian languages of Urdu, Panjabi, and Bengali respectively. Table 5: Main Language Groups (1000 peakers of more) in England at KS4 2014
Language Total Overall Main ethnic Groups English 482436 57% White British, Black African, Black Caribbean Other than English 13057 57% Urdu 7012 53% Pakistani Panjabi 6378 51% Indian, Pakistani Bengali 4952 61% Bangladeshi Polish 4064 43% White Other Gujarati 3155 71% Indian Somali 3084 50% Black African Arabic 2182 58% Any other Group, Black African Portuguese 1973 39% White Other, Any Other Group Turkish 1445 49% White Other Tamil 1388 75% Asian Other French 1331 57% White Other, Black African
Bengali (Sylheti) 1183 62% Bangladeshi Spanish 1052 54% White Other Pashto/Pakhto 1023 37% Asian Other
Yoruba 1001 71% Black African Total 57%
Source: National Pupil Database (NPD), Department for Education, January 2014.
This was followed by sizeable groups of Polish, Gujarati, Somali, Arabic, Portuguese, Turkish, Tamil, French, Bengali, Spanish, Pashto and Yoruba speaking pupils. The 2014 NPD records 250 different languages (including English) spoken by pupils at Key Stage 4. Of these, 123 languages were spoken by 20 or more pupils. There were 56 of the language groups with 20 or more speakers above the national average for Key Stage 4. The highest performing language groups were the Indian languages of Marathis (89.5%) and Telugu (88.9%) speaking pupils who were over 30 percentage points higher than the national figure. Also achieving well were Japanese (85.4%), Sinhala (80.3%), Croatian (78.6%), Malayalaam (78.5%), Danish (78.3%), Chinese (77.3%) and Vietnamese (77.2%) all being twenty percent or more higher than the national figure. The lowest achieving groups were Czech (10.4%), Romani (14.3%), Slovak (14.4%) and Romany/English Romanes (17.0%) speaking pupils. Figure 5, shows the breadth of GCSE results by language in England. Using five or more GCSEs including English and maths as an indicator, outcomes vary from Japanese speakers achieving 85.4% to Czech speakers achieving 10.4% compared to the national average of 57%. Only pupil cohorts over 80 were used in this analysis.
12

Figure 5 - Five or more A*-C including English and Maths 2014 ( Languages with over 80 pupils in cohort)
13

Language Diversity and Attainment of Black African Pupils The above analysis on performance by ethnic group is valuable in improving our knowledge related to ethnic background and achievement. However, even in the few studies where ethnic differences and educational achievement are considered, the importance of language diversity in achievement between ethnic groups is rarely reported. As argued earlier, the ethnic categories used above are often imprecise for a number of ethnic categories and this is constrained by categorisation of the official data available at national level. The national data suggests that some of the ethnic groups demonstrate a high degree of linguistic homogeneity. For example, 98% of White British and 94% of Black Caribbean children spoke English at home compared to 84% of the Bangladeshi ethnic group who spoke Bengali. However other ethnic groups are very linguistically diverse. In particular, the Black African , White Other, Indian and Pakistani ethnic categories gloss over enormous linguistic diversity. It is useful to be cautious when using the national School Census ethnic categories. Ethnicity is clearly an important category which is connected to language, though obviously does not map straightforwardly onto it. As Von Ahn et al noted ‘while many languages “attach” to particular ethnic groups … knowing a person’s language does not tell us about their country of origin or ethnic heritage’ (2010, p. 6). The empirical evidence from English schools in this research showed that the Black African category is one of the most linguistically diverse with 37% speaking English as their language at home, followed by Somali (18%), Yoruba (7%), Twi-Fante (4%), French (4%), Swahili (2%) and Lingala (1%). Other languages such as Tigrinya, Arabic, Igbo, Amharic, Luganda, Krio and Ga, have each between 20 and 300 speakers. There are further languages with an even smaller number of speakers. Figure 6. Five or more GCSE including English and maths for Black African Languages (0ver 20 speakers)
1. Igbo 8. Akan/Twi-Fante 15. Akan (Fante) 22. Ndebele 29. Bemba
2. Edo/Bini 9. Arabic 16. Other 23. Italian 30. Hausa
3. Yoruba 10. Akan (Twi/Asante) 17. Caribbean Creole Eng 24. Ndebele (Zimbabwe) 31. Lingala
4. Swedish 11. Swahili (any other) 18. Krio 25. Zulu 32. Wolof
5. Amharic 12. Shona 19. Ga 26. Tigrinya 33. Portuguese
6. English 13. German 20. Dutch/Flemish 27. Chichewa/Nyanja
7. Luganda 14. Swahili/Kiswahili 21. Somali 28. French
-35%
-30%
-25%
-20%
-15%
-10%
-5%
0%
5%
10%
15%
20%
1 2 3 4 5 6 7 8 9 10 11 12 13 14 15 16 17 18 19 20 21 22 23 24 25 26 27 28 29 30 31 32 33% pointsdifference
from national average
14

In terms of educational attainment, there are significant differences within ethnic categories, when the data is disaggregated by language spoken. The Black African ethnic group contains some of the highest achieving language groups, but also some of the lowest. Igbo, Edo/Bini, Yoruba, Swedish, Amharic, English, Luganda, Akan Twi-Fante, and Arabic speaking pupils do better than the national average, but many other languages are underachieving (see Table 6 and Figure 6). Table 6: GCSE performance of Black African pupils by language spoken at home (5+A*-C incl. English & Maths)
Languages spoken by Black African Associated Country English as an official language
5+ GCSE incl. English and
Maths Cohort
Igbo Nigeria Yes 75% 187
Edo/Bini Nigeria Yes 73% 33
Yoruba Nigeria Yes 71% 929
Swedish Sweden/Somalia No 70% 23
Amharic Ethiopia Yes 65% 79
English Yes 64% 6054
Luganda Uganda Yes 61% 93
Akan/Twi-Fante Ghana Yes 59% 328
Arabic Various 58% 260
Akan (Twi/Asante) Ghana Yes 57% 160
Swahili (any other) Other Yes 55% 104
Shona Zimbabwe No 54% 632
German Namibia Yes 54% 81
Swahili/Kiswahili Tanzania, Kenya Yes 53% 223
Akan (Fante) Ghana Yes 53% 30
Other/Believed to be other than English n/a 53% 1827
Caribbean Creole Eng n/a 52% 21
Krio Sierra Leone Yes 52% 48 Ga Ghana Yes 51% 41
Dutch/Flemish Suriname No 51% 85
Somali Somalia No 50% 2959
Ndebele South Africa Yes 47% 60
Italian Libya No 46% 102
Ndebele (Zimbabwe) Zimbabwe Yes 45% 22
Zulu South Africa Yes 45% 40
Tigrinya Eritrea, Ethiopia Yes 43% 170
Chichewa/Nyanja Malawi/Zimbabwe Yes 42% 24
French Ivory Coast, Senegal, Gabon No 39% 560
Bemba Zambia Yes 37% 30
Hausa Nigeria Yes 36% 25
Lingala Congo No 32% 242
Wolof Senegal, Gambia No 28% 43
Portuguese Angola, Cape Verde No 26% 251
Black African - All Pupils 57% 15766
National Average 57% 558432 Source: National Pupil Database (NPD), Department for Education, January 2014
15
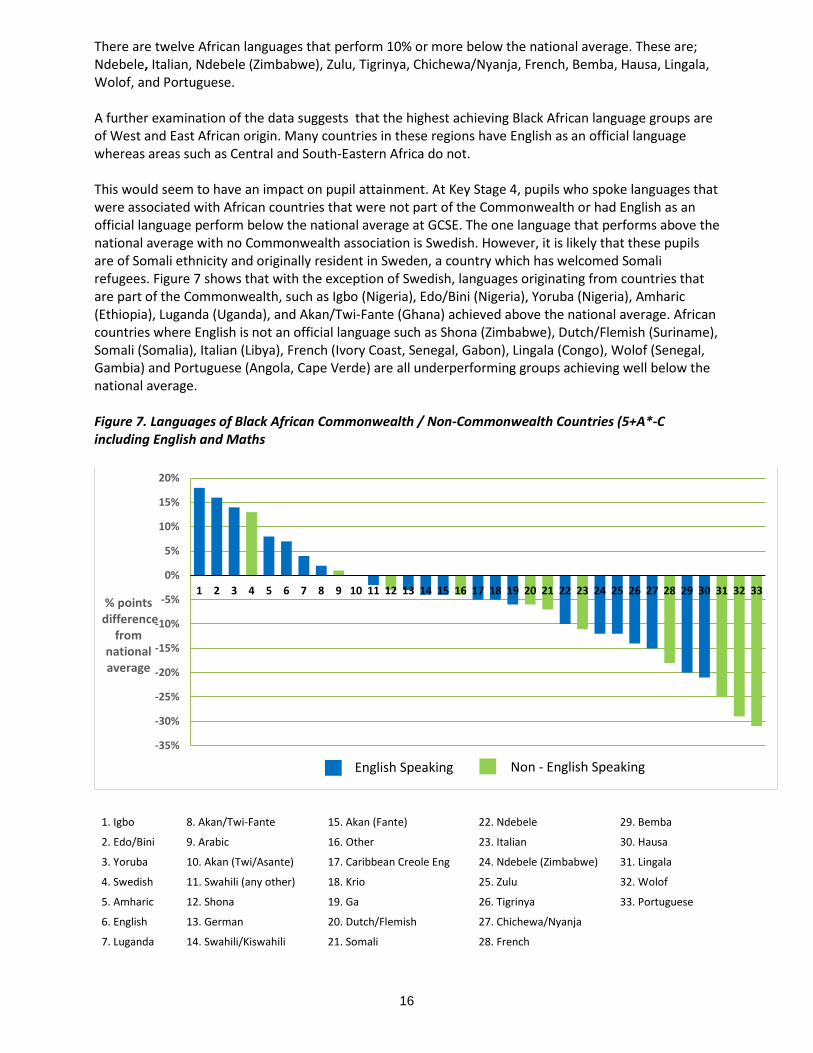
There are twelve African languages that perform 10% or more below the national average. These are; Ndebele, Italian, Ndebele (Zimbabwe), Zulu, Tigrinya, Chichewa/Nyanja, French, Bemba, Hausa, Lingala, Wolof, and Portuguese. A further examination of the data suggests that the highest achieving Black African language groups are of West and East African origin. Many countries in these regions have English as an official language whereas areas such as Central and South-Eastern Africa do not. This would seem to have an impact on pupil attainment. At Key Stage 4, pupils who spoke languages that were associated with African countries that were not part of the Commonwealth or had English as an official language perform below the national average at GCSE. The one language that performs above the national average with no Commonwealth association is Swedish. However, it is likely that these pupils are of Somali ethnicity and originally resident in Sweden, a country which has welcomed Somali refugees. Figure 7 shows that with the exception of Swedish, languages originating from countries that are part of the Commonwealth, such as Igbo (Nigeria), Edo/Bini (Nigeria), Yoruba (Nigeria), Amharic (Ethiopia), Luganda (Uganda), and Akan/Twi-Fante (Ghana) achieved above the national average. African countries where English is not an official language such as Shona (Zimbabwe), Dutch/Flemish (Suriname), Somali (Somalia), Italian (Libya), French (Ivory Coast, Senegal, Gabon), Lingala (Congo), Wolof (Senegal, Gambia) and Portuguese (Angola, Cape Verde) are all underperforming groups achieving well below the national average. Figure 7. Languages of Black African Commonwealth / Non-Commonwealth Countries (5+A*-C including English and Maths
1. Igbo 8. Akan/Twi-Fante 15. Akan (Fante) 22. Ndebele 29. Bemba
2. Edo/Bini 9. Arabic 16. Other 23. Italian 30. Hausa
3. Yoruba 10. Akan (Twi/Asante) 17. Caribbean Creole Eng 24. Ndebele (Zimbabwe) 31. Lingala
4. Swedish 11. Swahili (any other) 18. Krio 25. Zulu 32. Wolof
5. Amharic 12. Shona 19. Ga 26. Tigrinya 33. Portuguese
6. English 13. German 20. Dutch/Flemish 27. Chichewa/Nyanja
7. Luganda 14. Swahili/Kiswahili 21. Somali 28. French
-35%
-30%
-25%
-20%
-15%
-10%
-5%
0%
5%
10%
15%
20%
1 2 3 4 5 6 7 8 9 10 11 12 13 14 15 16 17 18 19 20 21 22 23 24 25 26 27 28 29 30 31 32 33% pointsdifference
from national average
English Speaking Non - English Speaking
16
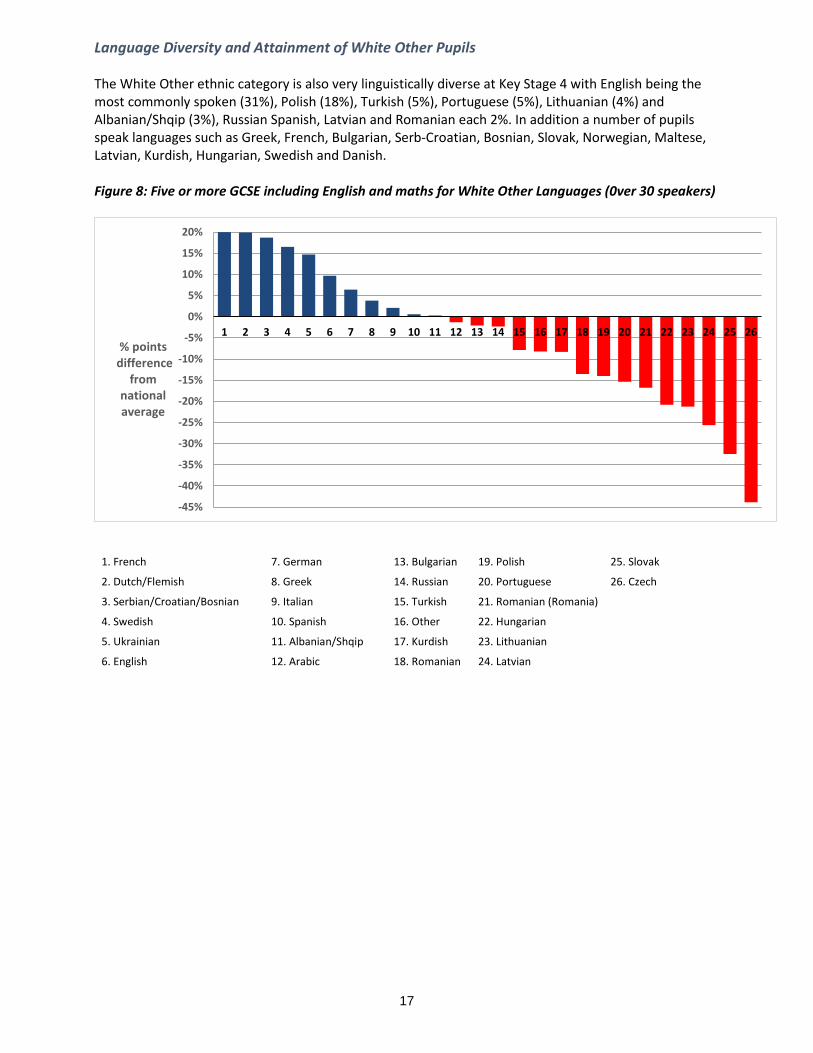
Language Diversity and Attainment of White Other Pupils The White Other ethnic category is also very linguistically diverse at Key Stage 4 with English being the most commonly spoken (31%), Polish (18%), Turkish (5%), Portuguese (5%), Lithuanian (4%) and Albanian/Shqip (3%), Russian Spanish, Latvian and Romanian each 2%. In addition a number of pupils speak languages such as Greek, French, Bulgarian, Serb-Croatian, Bosnian, Slovak, Norwegian, Maltese, Latvian, Kurdish, Hungarian, Swedish and Danish. Figure 8: Five or more GCSE including English and maths for White Other Languages (0ver 30 speakers)
1. French 7. German 13. Bulgarian 19. Polish 25. Slovak
2. Dutch/Flemish 8. Greek 14. Russian 20. Portuguese 26. Czech
3. Serbian/Croatian/Bosnian 9. Italian 15. Turkish 21. Romanian (Romania)
4. Swedish 10. Spanish 16. Other 22. Hungarian
5. Ukrainian 11. Albanian/Shqip 17. Kurdish 23. Lithuanian
6. English 12. Arabic 18. Romanian 24. Latvian
-45%
-40%
-35%
-30%
-25%
-20%
-15%
-10%
-5%
0%
5%
10%
15%
20%
1 2 3 4 5 6 7 8 9 10 11 12 13 14 15 16 17 18 19 20 21 22 23 24 25 26% points
difference from
national average
17
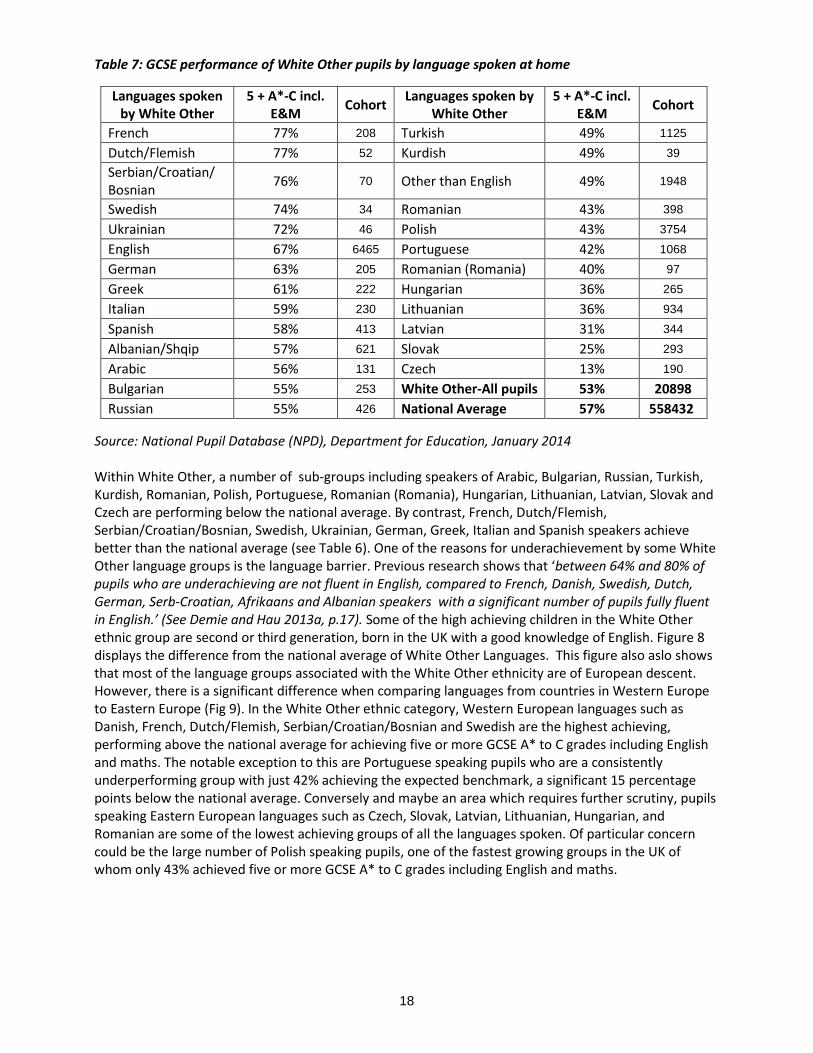
Table 7: GCSE performance of White Other pupils by language spoken at home
Languages spoken by White Other
5 + A*-C incl. E&M Cohort Languages spoken by
White Other 5 + A*-C incl.
E&M Cohort
French 77% 208 Turkish 49% 1125
Dutch/Flemish 77% 52 Kurdish 49% 39 Serbian/Croatian/ Bosnian 76% 70 Other than English 49% 1948
Swedish 74% 34 Romanian 43% 398
Ukrainian 72% 46 Polish 43% 3754
English 67% 6465 Portuguese 42% 1068
German 63% 205 Romanian (Romania) 40% 97
Greek 61% 222 Hungarian 36% 265
Italian 59% 230 Lithuanian 36% 934
Spanish 58% 413 Latvian 31% 344
Albanian/Shqip 57% 621 Slovak 25% 293
Arabic 56% 131 Czech 13% 190
Bulgarian 55% 253 White Other-All pupils 53% 20898
Russian 55% 426 National Average 57% 558432 Source: National Pupil Database (NPD), Department for Education, January 2014 Within White Other, a number of sub-groups including speakers of Arabic, Bulgarian, Russian, Turkish, Kurdish, Romanian, Polish, Portuguese, Romanian (Romania), Hungarian, Lithuanian, Latvian, Slovak and Czech are performing below the national average. By contrast, French, Dutch/Flemish, Serbian/Croatian/Bosnian, Swedish, Ukrainian, German, Greek, Italian and Spanish speakers achieve better than the national average (see Table 6). One of the reasons for underachievement by some White Other language groups is the language barrier. Previous research shows that ‘between 64% and 80% of pupils who are underachieving are not fluent in English, compared to French, Danish, Swedish, Dutch, German, Serb-Croatian, Afrikaans and Albanian speakers with a significant number of pupils fully fluent in English.’ (See Demie and Hau 2013a, p.17). Some of the high achieving children in the White Other ethnic group are second or third generation, born in the UK with a good knowledge of English. Figure 8 displays the difference from the national average of White Other Languages. This figure also aslo shows that most of the language groups associated with the White Other ethnicity are of European descent. However, there is a significant difference when comparing languages from countries in Western Europe to Eastern Europe (Fig 9). In the White Other ethnic category, Western European languages such as Danish, French, Dutch/Flemish, Serbian/Croatian/Bosnian and Swedish are the highest achieving, performing above the national average for achieving five or more GCSE A* to C grades including English and maths. The notable exception to this are Portuguese speaking pupils who are a consistently underperforming group with just 42% achieving the expected benchmark, a significant 15 percentage points below the national average. Conversely and maybe an area which requires further scrutiny, pupils speaking Eastern European languages such as Czech, Slovak, Latvian, Lithuanian, Hungarian, and Romanian are some of the lowest achieving groups of all the languages spoken. Of particular concern could be the large number of Polish speaking pupils, one of the fastest growing groups in the UK of whom only 43% achieved five or more GCSE A* to C grades including English and maths.
18

Figure 9: Five or more GCSE including English and maths for White Other European Languages (0ver 25 speakers)
1. Danish 7. English 13. Bulgarian 19. Polish 25. Slovak
2. French 8. German 14. Russian 20. Portuguese 26. Czech
3. Dutch/Flemish 9. Greek 15. Turkish 21. Romanian (Romania)
4. Serbian/Croatian/Bosnian 10. Italian 16. Other 22. Hungarian
5. Swedish 11. Spanish 17. Kurdish 23. Lithuanian
6. Ukrainian 12. Albanian/Shqip 18. Romanian 24. Latvian Language Diversity and Attainment of Indian Pupils The Indian ethnic group are one of the highest achieving groups of pupils in England. They consistently achieve well above expected levels at GCSE. The empirical evidence demonstrates a high level of achievement at 5+A*-C including English and Maths. In 2014, 73% of Indian pupils achieved 5+A*-C compared to the national average of 53%. However, India is a very linguistically diverse country with many regions with different dialects spoken. The GCSE national data showed a remarkable 58 different languages spoken within the Indian ethnic category of 13,394 pupils. All but 15 of the 58 languages spoken by Indian pupils achieved less than the national figure at GCSE in 2014. In the languages with cohorts over 20 pupils, the highest performing language groups were Marathi (89%), Telugu (88%), Bengali (83%), Malayam (79%) and English and Hindi (78%). The lowest performing were Konkani (53%) and Portuguese (55%). In regards to the cohort, English speakers account for a third of the cohort, whilst Gujurati and Panjabi speakers make up a further 40% of the total. The remaining 27% of the cohort account for the other 55 recorded languages.
-45%-40%-35%-30%-25%-20%-15%-10%
-5%0%5%
10%15%20%25%30%
1 2 3 4 5 6 7 8 9 10 11 12 13 14 15 16 17 18 19 20 21 22 23 24 25 26% pointsdifference
from national average
- Western Europe - Eastern Europe
19

Table 8: GCSE performance of Indian pupils by language spoken at home (cohort over 20)
Language 5+ GCSE including English and Maths Cohort % of Cohort
English 78% 4438 33.1% Gujarati 71% 2952 22.0% Panjabi 65% 2393 17.9% Other 74% 1497 11.2% Hindi 78% 424 3.2% Malayalam 79% 410 3.1% Urdu 72% 253 1.9% Panjabi (Gurmukhi) 74% 184 1.4% Tamil 72% 159 1.2% Panjabi (any other) 57% 154 1.1% Konkani 53% 118 0.9% Katchi 71% 66 0.5% Guarani 60% 43 0.3% Bengali 83% 42 0.3% Telugu 88% 40 0.3% Marathi 89% 37 0.3% Portuguese 55% 22 0.2% All Indian 73% 13394 National 57% 558432
Figure 10: Five or more GCSE including English and maths for Indian Languages (0ver 20 speakers)
-5%
0%
5%
10%
15%
20%
25%
30%
35%
% pointsdifference
from national average
20
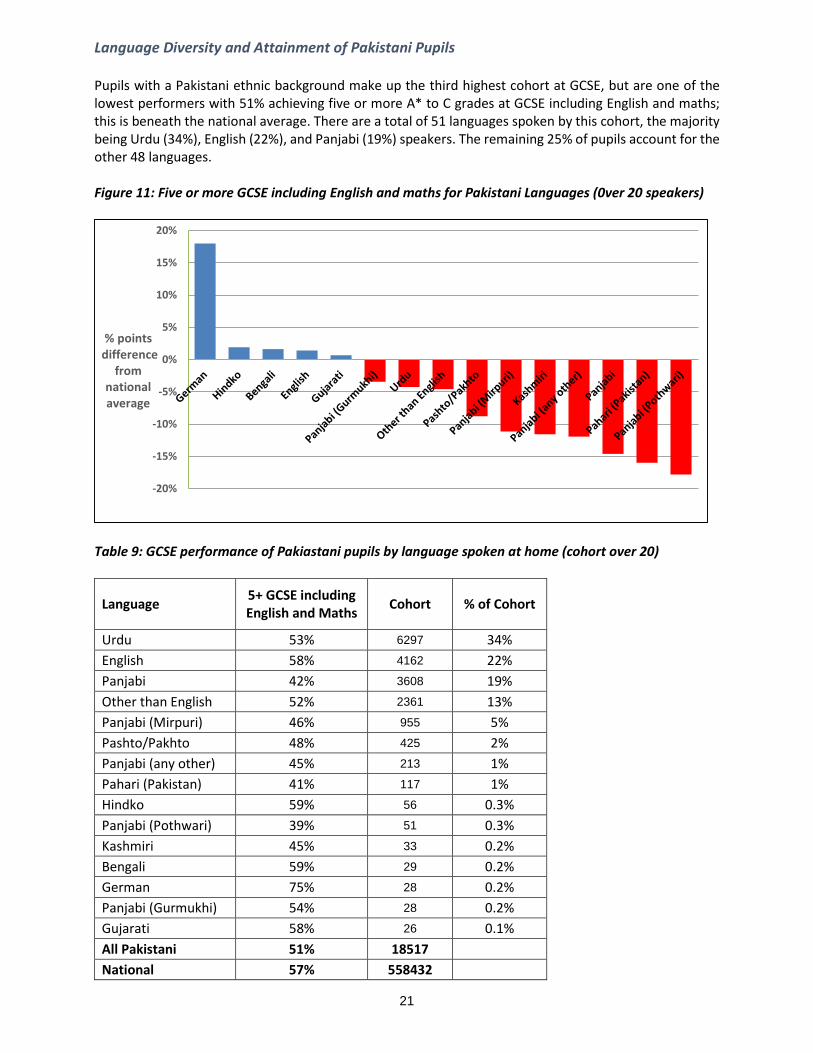
Language Diversity and Attainment of Pakistani Pupils Pupils with a Pakistani ethnic background make up the third highest cohort at GCSE, but are one of the lowest performers with 51% achieving five or more A* to C grades at GCSE including English and maths; this is beneath the national average. There are a total of 51 languages spoken by this cohort, the majority being Urdu (34%), English (22%), and Panjabi (19%) speakers. The remaining 25% of pupils account for the other 48 languages. Figure 11: Five or more GCSE including English and maths for Pakistani Languages (0ver 20 speakers)
Table 9: GCSE performance of Pakiastani pupils by language spoken at home (cohort over 20)
Language 5+ GCSE including English and Maths Cohort % of Cohort
Urdu 53% 6297 34% English 58% 4162 22% Panjabi 42% 3608 19% Other than English 52% 2361 13% Panjabi (Mirpuri) 46% 955 5% Pashto/Pakhto 48% 425 2% Panjabi (any other) 45% 213 1% Pahari (Pakistan) 41% 117 1% Hindko 59% 56 0.3% Panjabi (Pothwari) 39% 51 0.3% Kashmiri 45% 33 0.2% Bengali 59% 29 0.2% German 75% 28 0.2% Panjabi (Gurmukhi) 54% 28 0.2% Gujarati 58% 26 0.1% All Pakistani 51% 18517 National 57% 558432
-20%
-15%
-10%
-5%
0%
5%
10%
15%
20%
% pointsdifference
from national average
21

Highest performers at GCSE in pupil cohorts greater than 20, were Pakistani speakers of German (75%). They were followed by Hindko and Bengali (59%) and English and Gujurati (58%). Lowest performing were Panjabi/Pothwari (39%), Pahari/Pakistan (41%), and alarmingly the third highest cohort in England with 3608 pupils, Panjabi (42%). All but 5 languages; German, Hindko, Benglai, English and Gujurati, performed below the national average of 57% (see figure 11). EAL Stages of English Acquisition and GCSE Attainment English language proficency is the major factor to study the performance of EAL pupils. Research on the relationship between fluency in English and attainment in inner London also confirms that language barriers remain one of the key factors affecting the performance of English as Additional Language (EAL) pupils in British schools (Demie 2011 and 2012; Strand 2006 and Strand and Demie 2005). There are no national validated scales that are complementary to the current English assessment scales used in the national curriculum (NALDIC 2005). However, this study; based on well moderated English fluency stages at a Local authority level by EAL professionals, teachers and LA advisers (see Strand and Demie 2005), confirmed that there is a strong relationship between stage of fluency in English and educational attainment. The results suggest that the percentage of pupils attaining level 4 or above at KS2 and 5 or more A*-C at GCSE increased as stage of proficiency in English increased. Pupils in the early stages of fluency performed at low levels, while EAL pupils who were fully fluent in English far outstripped pupils for whom English was their only language (see Strand 1999; Demie 2013; Demie and Strand 2006 and Strand and Demie 2005). However, EAL proficiency data is not available at the national level. The Government collect only Ethncity, language and EAL aggregated data. As a result of a lack of national data we will use data from Lambeth local authority as a case study. The authority has a history of collecting reliable data on level of fluency and language at home, for all pupils attending the authority schools since 1990 (Demie and Strand 2006). The case study LA is one of the most ethnically, linguistically and culturally diverse boroughs in Britain. In common with many other inner London boroughs, the LA has a high proportion of pupils whose first language is not English. The LA 2014 EAL English language fluency survey showed that overall 86.3% of pupils in schools belonged to black and other ethnic minority communities. The variety of different languages spoken has increased, with 150 different languages spoken by Lambeth pupils in 2014. Approximately 52% of pupils in primary schools and 43% in secondary schools were classed as bilingual. Of those pupils who spoke or understood a language in addition to English, 38% at KS1 and 11% at GCSE were classified as non-fluent in English (Table 10). Table 10: Pupils at each level of fluency by Key Stage in 2013-14
Fluency Level Key Stage 1
Key Stage 2
Key Stage 4
EAL Stage 1 (Beginners-New to English) 5% 2% 1% EAL Stage 2 (Becoming familiar with English) 14% 5% 2% EAL Stage 3 (Becoming confident as user of English) 19% 17% 8% EAL Stage 4 (Fully Fluent in English) 13% 29% 32% English Only 49% 47% 58%
Source: Schools Research and Statistics Unit, Lambeth LA Table 10 also shows Lambeth pupils by stages of fluency in English at KS1, KS2 and KS4. The data shows that more Key Stage 1 bilingual pupils are at low levels of English fluency, but by the time they reach secondary school there are far fewer pupils at this level.
22

The EAL learning needs of pupils vary greatly from beginners to advanced learners. Four Stages of English have been widely used to describe the different stages of English through which pupils commonly progress throughout the 1990s and 2000s, (see Demie et al 2013). For the purposes of this survey Stage 1 – 3 are classified as non-fluent. The four stages in the survey are also widely used in the LAs schools ‘as a diagnostic tool to analyse needs for future teaching focus and…to provide baseline information for statistical purposes’ (Hall, 1996:31). In general it is a very popular assessment with local schools and has been used in the LA since 1988. Table 11. GCSE performance – 5+ A*-C including English and Maths 2014 -15 in Lambeth LA (%)
GCSE by EAL Stages of English Fluency 2014 2015
EAL Stage 1 (Beginners-New to English) 0% 0%
EAL Stage 2 (Becoming familiar with English) 7% 11%
EAL Stage 3 (Becoming confident as user of English) 34% 40%
EAL Stage 4 (Fully Fluent in English) 66% 65%
English Only 55% 52%
All Pupils- LA average 57% 57%
All Pupils- National Average 53% 54%
Source: School Research and Statistics Unit, Lambeth LA Table 11 gives the average performance of EAL pupils at the end of secondary education from 2014 to 2015. The results of the GCSE analysis show that the percentage of pupils attaining 5+A*-C including English and Maths at the end of secondary education increased as the stage of proficiency in English increased. Overall, the data shows that in 2014 no pupils on stage 1 level of fluency in English achieved 5+A*-C including English and Maths compared to 11% on stage 2, 40% on stage 3 and 65% on stage 4 (fully fluent in English). EAL pupils who were fully fluent in English were also much more likely to get level 5+A*-C when compared with English-only speakers. The gap in achievement between monolingual English pupils and EAL pupils not fluent in English (stage 1-3) is 13%. Overall the data shows that there is a strong relationship between the stages of fluency in English and educational attainment. In general, empirical evidence from the LA shows that the performance level of bilingual pupils increases as fluency in English increases. Pupils in the early stages of fluency perform at low levels and EAL and pupils not fluent in English achieve significantly below White British who speak English only. The data also shows that bilingual pupils assessed as fully fluent in English perform above the LA outcomes at all key stages. These findings offer much encouragement for policy makers and school improvement practitioners. They demonstrate that once the disadvantage of language is overcome, it is possible to attain high levels of achievement. However, after 2013 the way the GCSE are assessed and reported in England has changed and may not be compared with previous years. Despite this change new data in 2014 and 2015 also shows that fully fluent bilingual pupils were the highest achieving group. (Table 11 and Figure 12). In 2015, 65% gained five good passes including English and maths. They were followed by English only speakers with 52% reaching this level. For stage 3 fluency pupils this figure was 40%. It should be remembered that pupils at the earliest stages of English fluency often comprise small cohorts, especially at secondary level. At each key stage their improvement rate was much lower than that found in the borough overall, and the gap is widening with their more fluent peers.
23
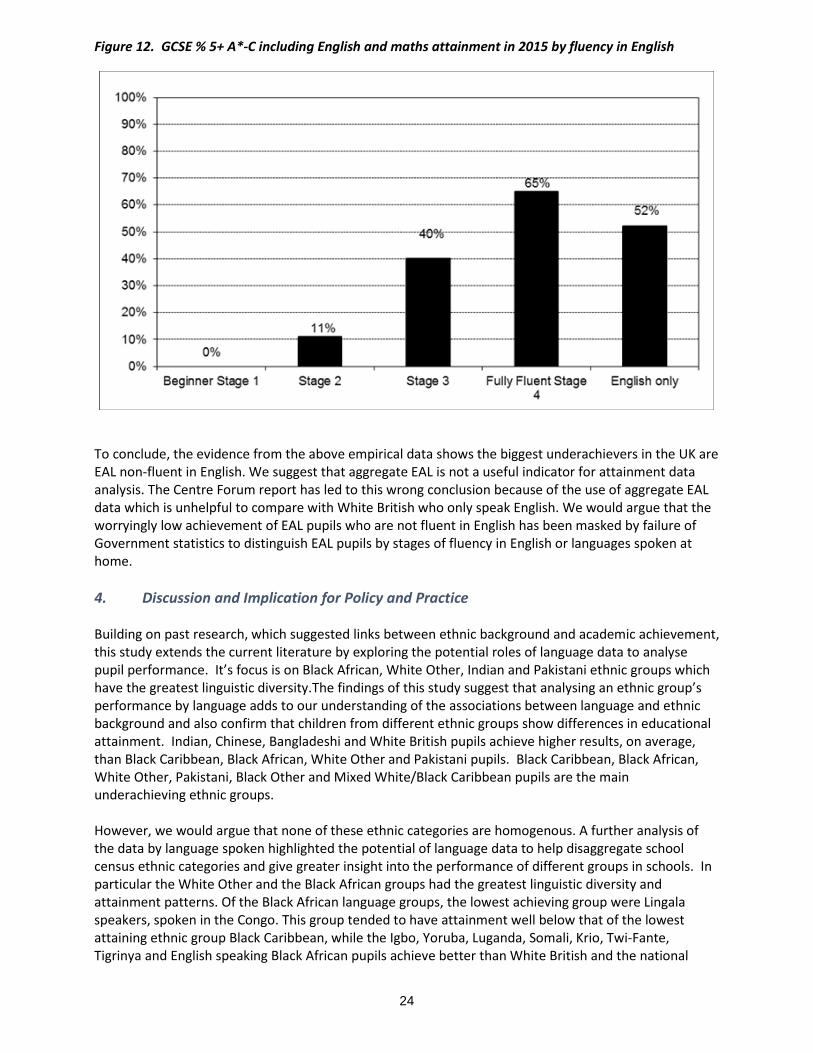
Figure 12. GCSE % 5+ A*-C including English and maths attainment in 2015 by fluency in English
To conclude, the evidence from the above empirical data shows the biggest underachievers in the UK are EAL non-fluent in English. We suggest that aggregate EAL is not a useful indicator for attainment data analysis. The Centre Forum report has led to this wrong conclusion because of the use of aggregate EAL data which is unhelpful to compare with White British who only speak English. We would argue that the worryingly low achievement of EAL pupils who are not fluent in English has been masked by failure of Government statistics to distinguish EAL pupils by stages of fluency in English or languages spoken at home. 4. Discussion and Implication for Policy and Practice Building on past research, which suggested links between ethnic background and academic achievement, this study extends the current literature by exploring the potential roles of language data to analyse pupil performance. It’s focus is on Black African, White Other, Indian and Pakistani ethnic groups which have the greatest linguistic diversity.The findings of this study suggest that analysing an ethnic group’s performance by language adds to our understanding of the associations between language and ethnic background and also confirm that children from different ethnic groups show differences in educational attainment. Indian, Chinese, Bangladeshi and White British pupils achieve higher results, on average, than Black Caribbean, Black African, White Other and Pakistani pupils. Black Caribbean, Black African, White Other, Pakistani, Black Other and Mixed White/Black Caribbean pupils are the main underachieving ethnic groups. However, we would argue that none of these ethnic categories are homogenous. A further analysis of the data by language spoken highlighted the potential of language data to help disaggregate school census ethnic categories and give greater insight into the performance of different groups in schools. In particular the White Other and the Black African groups had the greatest linguistic diversity and attainment patterns. Of the Black African language groups, the lowest achieving group were Lingala speakers, spoken in the Congo. This group tended to have attainment well below that of the lowest attaining ethnic group Black Caribbean, while the Igbo, Yoruba, Luganda, Somali, Krio, Twi-Fante, Tigrinya and English speaking Black African pupils achieve better than White British and the national
24
average. Within the White Other Category, both Portuguese and Spanish speakers showed low attainment. By contrast, Polish speakers achieved better than the national average. This research also illustrates the diverse nature of current ethnic group categories and calls for a rethink of the categories that we use to understand educational achievement in British schools. Researching the achievement of different ethnic groups in British schools is complicated by the problem of categorisation under groups which are too broadly defined nationally as Black African, White Other, Black Other, Indian, Pakistani, Other Ethnic Group etc. As a result of the lack of detailed ethnically based data, there are limitations in past research into different ethnic groups. The absence of detailed national data which identifies patterns of achievement of ethnic minority children of African, Asian and European heritage in British schools, places serious constraints on effective targeting policies and developments at national and local level. As Von Ahn et al (2011) and Demie et al (2011) have so eloquently articulated, this study suggests that language spoken provides a better means to understand the relationship between ethnicity and educational achievement. There is, therefore, a clear requirement for further research into language groups whose needs are obscured in the White Other ethnic category, speaking languages such as Polish, Albanian, German, Spanish, French, Portuguese, Italian, Turkish, Greek, Lithuanian etc. Similarly obscured are the Indian ethnic group who mainly tend to speak Gujarati, Punjabi and Hindi; the Pakistani ethnic group who tend to speak Urdu, Punjabi and the Black African ethnic group which masks the performance of pupils who tend to speak many different languages including English, Yoruba, Somali, Twi-Fante, French, Igbo, Krio, Tigrinya, Lingala, Arabic, Ga, Swahili, Luganda, Amharic, Portuguese, Shona, German, Fang, Manding, Runyakata, Temne and Zulu etc. to gain a fuller picture of their educational achievements. There are also some limitations to this study that should be noted. Previous research suggests that the number of speakers in some of these groups are too small to make any meaningful comparison with other languages (Demie and Hau 2013a; Demie 2012). As a result we have not taken into consideration any language groups with less than 20 speakers. We would argue any conclusions or interpretations drawn from these small cohorts should be made with care, since the performance of a few pupils can significantly weight the overall performance of a group. Despite these limitations, the broad findings of our research are in line with other studies (see Von Ahn et al 2011 and Demie et al 2011, Mitton 2011, Demie and Mclean 2007, Demie and Hau 2012) and offer significant new insight by extending our existing knowledge in the area of ethnicity, language and achievement. The findings of this study have implications for the collection and use of disaggregated data at national and international level. As highlighted above, the British system of data collection can be considered the most elaborate when it comes to collecting data related to ethnically based statistics. In Britain, census data is considered the most important source of information about schools and is used by Ministers, Parliament, central and local government, pressure groups and the public to monitor government policies and their effectiveness (DfE 2006; Gill and Demie 2011). We pointed out that accurate and reliable disaggregated ethnic and language data are important to address education inequalities. Such data are important to identify knowledge gaps and develop effective programmes and policies. However, the extent to which ethnic and linguistic data is collected and used varies from country to country (Goldscheider 2002; Graves 2011 and Ford 2013). We would argue, as a matter of good practice, government and public institutions need an account of peoples culture, ethnic and linguistic background in formulating national and local policy. While for example some countries such as UK, USA, Australia and Canada recognise the importance of collecting detailed data, many states believe that recognising ethnic and linguistic differences will have a negative and destabilising effect on the country (see Blum 2002, Goldscheider 2002). In some countries, efforts to deny the existence of different ethnic and linguistic groups can stem from the desire to create a homogenised identity in order to maintain national unity (Blum 2002). For example in France ‘it is illegal to include ethnic and language data in official statistics or for Census to include questions about race or origin, ethnic and linguistic background.’ (See Gray 2009:57). But the negative impact of such a policy means some communities are consistently excluded and marginalised with resources remaining in the hands of specific ethnic and linguistic groups.
25
Other researchers highlighted particularly the issues related to the ethnic classification used in census. The census in many countries collects data on ethnicity or language by asking respondents to choose the ethnic group or language they feel best describes them from the list (Gill and Demie 2011). Issues that are hotly debated in UK and USA include the use of terms such as Black, White, Asian, African, Mixed Race, Other Ethnic Groups and inconsistencies in category descriptions of different communities. Such classification is confusing, inconsistent and inaccurate and hides the real diversities within the country. There are also other concerns and a growing debate around the need to disaggregate ethnicity and language data. Some governments have been reluctant to detail disaggregated data and have argued a number of reasons related predominately to legal and moral considerations, including privacy of individual data against potential abusers. In countries such as Turkey and France, constitutional provisions and data protection laws have thus been claimed for not articulating data collection on minority groups (Blum 2002, Goldscheider 2002). Furthermore, some governments are reluctant to carry out ethnic and language monitoring to avoiding shedding light on complex problems within the country. Overall, in many countries, there is a lack of relevant disaggregated statistical data which prevents monitoring performance and measuring the effectiveness of government policies. We would argue that inequality in access in education will not end without detailed disaggregated ethnic and language data and a carefully designed targeted national programme. Detailed disaggregated data by language and ethnic background provides evidence that can be used to design interventions that tackle the root cause of underachievement of different groups in schools. The recommendations from our findings are that if any country is serious about tackling pupil underachievement in schools, they need to recognise first the importance of cultural, ethnic and linguistic diversity. In addition they must collect disaggregated ethnic data and language spoken at home to benefit all groups attending schools. Such data is fundamental in identifying which ethnic and linguistic groups are most at risk of underachievement and to design specific interventions that will be effective in raising achievement, whatever their background. References
Blum, A. (2002). Resistance to Identity Categorisation in France. In D.I Kertzer and D.Ariel (eds.), Census and Identity: the Politics of Race, Ethnicity, and Language in Censuses (pp. 121-147). Cambridge, England: Cambridge University press.
Bradbury, A. (2011). Equity, Ethnicity and the Hidden Danger of Contextual Measures of School Performances, Race Ethnicity and Education, Volume 14, Issue 3, March.
Demie, F. and Hau, A. (2013a). The Achievement of Pupils with English as an Additional Language: An empirical study, Research and Statistics Unit, Lambeth LA
Demie, F. (2013b). English as an Additional Language: How long does it takes to acquire English Fluency, Language and Education, Volume 27, Issue 1.
Demie, F. and Hau, A, Butler, R., Tong, R., Taplin, A. and McDonald, J. (2011). Language Diversity in Schools, Research and Statistics Unit, Lambeth LA. Demie, F. and Lewis, K. (2011). White Working Class Achievement: An Ethnographic Study of Barriers to Learning in Schools, Educational Studies, Vol. 37 (3), p245-264. Demie, F. and Lewis, K. (2010). Raising the Achievement of Portuguese pupils in British schools: a case study of good practice, Educational Studies, Volume 36, Number 1, February 2010 , pp. 95-109
26
Demie, F and McLean, C. (2007) The Achievement of African Heritage Pupils: A case study of good practice in British schools, Educational studies, 33:4,45-434 Demie, F. and Strand, S. (2006). English Language Acquisition and Attainment at the End of Secondary School, Educational Studies, Vol. 32, No. 2, June 2006, pp. 215–231. Demie, F. (2005). The Achievement of Black Caribbean Pupils in British Schools: Good Practice in Lambeth Schools. British Educational Research Journal, Vol. 31, No. 4, August 2005, pp. 351-378. Demie, F. (2003). Using Value-added Data for School self-evaluation: A Case Study of Practice in Inner City Schools, School Leadership and Management, Vol. 23, No.4, pp. 445-467. Demie, F. (2001). Ethnic and Gender Difference in Educational Achievement and Implications for School Improvement Strategies, Educational Research, Vol.43, Number 1, 91-106. Demie, F.; Hau, A. and Mcdonald, J. (2016). English as an Additional Language in Primary Schools in England http://www.google.co.uk/url?sa=t&rct=j&q=&esrc=s&source=web&cd=3&ved=0ahUKEwjYt4afxfLMAhUGfRoKHflsAeMQFgg1MAI&url=http%3A%2F%2Fwww.lambeth.gov.uk%2Frsu%2Fsites%2Fwww.lambeth.gov.uk.rsu%2Ffiles%2FEnglish_as_an_Additional_Language_and_Attainment_in_Primary_Schools_in_England.pdf&usg=AFQjCNG4plUv9eYmFDwiisW9Uw95hgwX1w&sig2=-jRqfG-jQ6KNHLD85pZMXA (accessed 24 May 2016) Department for Education (DfE 2012). The Statistical First Release: National Curriculum Assessment and GCSE/GNVQ attainment by pupil characteristics, in England, 2012 at http://www.dfes.gov.uk/rsgateway/DB/SFR/s000448/index.shtml Department for Education ( 2011) DfE: Schools, Pupils and their Characteristics, January 2011, http://www.education.gov.uk/rsgateway/DB/SFR/index.shtml Department for Children, Schools and Families (2008a) Raising The Attainment Of Pakistani, Bangladeshi, Somali and Turkish Heritage Pupils: Guidance For Developing Inclusive Practice, (Ref: 00043-2008BKT-EN), Nottingham: DCSF. Department for Children, Schools and Families (2008b) Excellence and Enjoyment: Learning and Teaching For Black Children In The Primary Years, (Ref: 00058-2008BKT-EN), Nottingham: DCSF. Department for Children, Schools and Families (2009) Breaking the link between special educational needs and low attainment, https://www.education.gov.uk/publications/standard/Specialeducationalneeds/Page1/DCSF-00213-2010 Department for Education and Skills (2002) Removing the Barriers: Raising Achievement Levels for Minority Ethnic Pupils Exploring Good Practice, DfES Publications.0001/2002. Department for Education and Skills (2004a) Aim High: Supporting the Use of Ethnic Minority Grant,DfE. Department for Education and Skills (2004b) Aiming High: Understanding the Educational Needs of Minority Ethnic Pupils in Mainly White Schools: A Guide to Good Practice, Nottingham: DfES. Department for Education and Skills (2005) Ethnicity and Education: The Evidence on Minority Ethnic Pupils aged 5-16, London: DfES.
27

Department for Education and Skills (2006) Ethnicity and Education: The Evidence on Minority Ethnic Pupils aged 5-16, London: DfES. DfE (2016a). Schools National Funding Formula, March https://consult.education.gov.uk/funding-policy-unit/schools-national-funding-formula/supporting_documents/Schools_NFF_consultation.pdf DfE (2016b). National tables: SFR 01/2016’- Characteristics Summary https://www.gov.uk/government/statistics/revised-gcse-and-equivalent-results-in-england-2014-to-2015 DfE (2015). ‘National tables: SFR47/2015’- Summary https://www.gov.uk/government/statistics/national-curriculum-assessments-at-key-stage-2-2015-revised Dustann, C., Machin, S. and Schonberg (2010). Ethnicity and Educational Achievement in Compulsory Schooling, The Economic Journal, 120, F272-F297. Ford, M. (2013). Achievement Gaps in Australia: What NAPLAN Reveals about Education Inequality in Australia, Race Ethnicity and Education,Volume 16, Issue 1. Gillborn, D. (2005) Education as an act of white supremacy: Whiteness, critical race theory and educational reform, Journal of Education Policy, 20 (4): 485-505. Gillborn, D. (2002) Education and Institutional Racism, London: Institute of Education. Gillborn, D. and Youdell, D. (2000). Rationing Education: Policy, Practice, Reform And Equity, Buckinghamshire: Open University Press Gillborn, D. and Mirza, H. S. (2000). Educational Inequality. Mapping Race, Class and Attainment, London: Ofsted. Gillborn, D. and Gipps, C. (1996). Recent Research on the achievement of ethnic minority pupils, OFSTED Reviews of Research, HMSO, London.
Gill, B. and Demie, F. (2011). The White Paper Teaching and Learning and Accountability: Implications for data on ethnicity and English as Additional Language, Race Equality Teaching, Spring.
Goldscheider, C. (2002). Ethnic categorisation in censuses: comparative observations from Israel, Canada and the United States. In D.I Kertzer and D.Ariel (eds.), Census and identity: the politics of race, ethnicity, and language in censuses (pp. 71-91). Cambridge, England: Cambridge University press.
Gray, Z. (2009). The importance of ethnic data for promoting the right for education, in Minority Rights Groups International (eds.) The state of the World’s minorities and indigenous peoples, p.57. Graves, S. (2011). School and Child Level Predictors of Academic Success for African American Children in Third Grade: Implications for No Child Left Behind, Race Ethnicity and Education, Volume 14, Issue 5, April.
28
Leedham, D. (2016). EAL Learners in Schools: How the Government could Help, Schools Week, 23 April http://schoolsweek.co.uk/eal-learners-in-schools-how-the-government-could-help/?utm_content=buffer5a4af&utm_medium=social&utm_source=twitter.com&utm_campaign=buffer (accessed 24 April 2016) Office for Standards in Education (2002a) Achievement of Black Caribbean Pupils: Three Successful Primary Schools, London: Ofsted (HMI447). Office for Standards in Education (2002b) Achievement of Black Caribbean Pupils: Good Practice in Secondary Schools: Ofsted (HMI448). Mitton, L (2011) The Languages of Black Africans in England, Journal of Intercultural Studies 32(2), 151-172. Mortimore, P. ;Sammons, P.; Stoll, L.; Lewis, D and Ecob, R. (1988). School matters: The Junior Years, Sommerset, Open Books. NALDIC (2011). Language in schools, National Association for Language Development in Curriculum, http://www.naldic.org.uk/research-and-information/eal-statistics/lang NALDIC (2005) Promoting EAL Teacher Professionalism http://www.naldic.org.uk/Resources/NALDIC/Home/Documents/PromotingEALTeacherProfessionalism.pdf Parekh, B. (2000). The Future of Multi-Ethnic Britain: Report of the Commission on the Future of Multi-Ethnic Britain, Profile Books. Rampton Report (1981). West Indian Children in our Schools. Interim report of the Committee of Inquiry into the Education of Children from Ethnic Minority Groups. London: Her Majesty's Stationery Office. Smith, D. and Tomlinson, S. (1989). The School Effect: A study of multi-social comprehensive, Exter, Policy Studies Institute. Strand, S., Malmberg, L. and Hall, J. (2015). English as an Additional Language (EAL) and educational achievement in England: An analysis of the National Pupil Database, University of Oxford, Department of Education January, https://www.unboundphilanthropy.org/sites/default/files/EAL_and_educational_achievement2_0.pdf Strand, S. (2014). Ethnicity, Gender, Social Class and Achievement Gaps at Age 16: Intersectionality and ‘Getting it’ for the white working class, Research Papers in Education, Vol. 29, No.2, 131-171. Strand, S. (2012) ‘The White British-Black Caribbean Achievement Gap: Tests, tiers and teacher expectations’, British Educational Research Journal. British Educational Research Journal, Vol. 38, 1, p 75-101. Strand, S. (2010) ‘Do some schools narrow the gap? Differential school effectiveness by ethnicity, gender, poverty and prior attainment’, School Effectiveness and School Improvement, Vol. 21, No.3, 89–314.
29
Strand, S and Demie, F. (2005). English Language Acquisition and Attainment at the End of Primary School, Educational Studies, Vol. 13, No.3, 275-291. Strand, S. (1999), ‘Ethnic Group, Sex and Economic Disadvantage: Associations with pupils’ educational progress from baseline to the end of Key Stage 1’, British Educational Research Journal, Vol. 25, No. 2, pp. 179–202. Swann, Lord (1985) Education For All: Final Report Of The Committee Of Inquiry Into The Education Of Children From Ethnic Minority Groups, cmnd 9453, London: HMSO. Von Ahn, M., Lupton, R., Greenwood, C., & Wiggins, R. (2010). Languages, Ethnicity, Education in London London: Department of Quantitative Social Science, Institute of Education. Von Ahn, M., Wiggins, R., Sanderson, A., Mayhew, L., & Eversley, J. (2011). Using School Census Language Data to Understand Language Distribution and Links to Ethnicity, Socio-economic Status and Educational Attainment: a guide for local authority users. London: Department of Quantitative Social Science, Institute of Education.
30

Appendix A - Achievement of Languages spoken nationally at GCSE 2014 - 5 or more A* to C grades including English and Maths
Language Cohort 5+A*-C Language Cohort 5+A*-C Language Cohort 5+A*-C Language Cohort 5+A*-C English 482436 56.9% Persian/Farsi 481 59.5% Arabic (any other) 125 51.2% British Sign Language 47 17.0%
Urdu 7012 53.4% Malayalam 437 78.5% Caribbean Creole English 124 43.5% Arabic (Yemen) 45 51.1%
Panjabi 6378 51.3% Chinese (Cantonese) 401 73.6% Swahili (any other) 124 54.0% Telugu 45 88.9%
Bengali 4952 60.5% Panjabi (any other) 388 50.5% Romanian (Romania) 115 37.4% Ga 44 50.0%
Polish 4064 43.4% Akan/Twi-Fante 359 58.5% Katchi 115 63.5% Edo/Bini 38 68.4%
Gujarati 3155 70.8% Latvian 358 30.4% Amharic 107 61.7% Marathi 38 89.5%
Somali 3084 49.7% Czech 345 10.4% Luganda 107 61.7% Akan (Fante) 37 56.8%
Arabic 2182 58.5% Hungarian 330 33.9% Swedish 101 70.3% Norwegian 37 70.3%
Portuguese 1973 39.2% Kurdish 329 50.5% Ebira 91 49.5% Kashmiri 36 47.2%
Turkish 1445 48.6% Farsi/Persian (any other) 305 60.3% Serbian/Croatian/
Bosnian 89 74.2% Bemba 35 42.9%
Tamil 1388 74.6% Bengali (any other) 304 65.5% Japanese 89 85.4% Arabic (Algeria) 30 70.0%
French 1331 56.7% Thai 297 30.0% Caribbean Creole French 85 45.9% Hausa 28 35.7%
Bengali (Sylheti) 1183 62.5% Greek 294 59.9% Korean 84 76.2% Malay/Indonesian 28 75.0%
Spanish 1052 54.4% Swahili/Kiswahili 275 53.5% Hebrew 71 74.6% Malay (any other) 28 71.4%
Pashto/Pakhto 1023 36.9% Bulgarian 274 56.2% Afrikaans 67 62.7% Romani (International) 28 14.3%
Yoruba 1001 70.8% Lingala 265 32.5% Ndebele 67 46.3% Croatian 28 78.6%
Panjabi (Mirpuri) 983 45.7% Dutch/Flemish 263 58.6% Arabic (Morocco) 62 53.2% Romany/English Romanes 27 22.2%
Lithuanian 981 36.2% Tagalog 239 65.3% Danish 60 78.3% Armenian 26 73.1%
Chinese 823 68.5% Vietnamese 232 77.2% Hindko 58 58.6% Chichewa/Nyanja 26 42.3%
Nepali 810 57.5% Panjabi (Gurmukhi) 222 72.1% Portuguese (Brazil) 58 48.3% Ndebele (Zimbabwe) 26 46.2%
Shona 714 54.8% Filipino 219 61.6% Ukrainian 58 74.1% Serbian 26 61.5%
Albanian/Shqip 711 56.4% Igbo 211 73.5% Arabic (Iraq) 56 48.2% Welsh/Cymraeg 24 70.8%
Tagalog/Filipino 702 66.0% Tigrinya 194 42.8% Krio 56 51.8% Tigre 24 62.5%
Italian 620 53.9% Dari Persian 188 42.6% Wolof 54 33.3% Fijian 23 26.1%
Slovak 571 14.4% Akan (Twi/Asante) 177 57.1% Zulu 53 39.6% Chinese (any other) 22 77.3%
Russian 521 58.0% Sinhala 142 80.3% Panjabi (Pothwari) 52 38.5% Bosnian 21 61.9%
Romanian 502 37.1% Pahari (Pakistan) 135 41.5% Mauritian/Seychelles Creole 50 42.0% Other*/Refused/
Unclassified 14830 56.2%
Hindi 499 75.6% Chinese (Mandarin/Putonghua) 129 56.6% Portuguese (any
other) 50 38.0% *Other includes language cohorts between 1 and 20 who for statistical reasons have not been included in the
analysis German 492 64.4% Konkani 127 51.2% Guarani 49 63.3%
31

Annex B: GCSE performance of language spoken at home by DfE region - 5 or more A* to C grades including English and Maths
National East East Midlands Inner London North East North West
Language Total Overall Count 5+A*-C Count 5+A*-C Count 5+A*-C Count 5+A*-C Count 5+A*-C English 482436 57% 58057 58% 44738 54% 11659 58% 26504 55% 69774 56% Other than English 13057 57% 869 52% 1077 55% 1640 60% 425 52% 2159 52% Urdu 7012 53% 549 49% 370 49% 535 59% 81 53% 996 56% Panjabi 6378 51% 281 44% 355 50% 187 47% 113 49% 980 43% Bengali 4952 61% 411 57% 118 53% 1791 61% 132 59% 537 50% Polish 4064 43% 475 39% 396 33% 306 57% 46 39% 334 40% Gujarati 3155 71% 122 88% 699 58% 225 73% 1 0% 545 71% Somali 3084 50% 24 33% 157 50% 842 57% 2 0% 212 47% Arabic 2182 58% 69 62% 65 63% 519 64% 44 52% 200 53% Portuguese 1973 39% 261 27% 105 36% 558 45% 27 30% 62 29% Turkish 1445 49% 108 44% 22 27% 498 53% 7 57% 25 28% Tamil 1388 75% 73 85% 36 69% 127 66% 5 100% 15 67% French 1331 57% 96 76% 37 51% 403 56% 12 42% 61 61% Bengali (Sylheti) 1183 62% 88 65% 36 53% 740 65% 9 33% 73 60% Spanish 1052 54% 76 68% 20 55% 456 50% 8 50% 40 53% Pashto/Pakhto 1023 37% 30 23% 38 24% 84 36% 9 11% 86 35% Yoruba 1001 71% 82 79% 14 79% 434 68% 3 100% 36 67% Total 57% 57% 54% 60% 55% 56%
32

Appendix B (continued): GCSE performance of language spoken at home by DfE region - 5 or more A* to C grades including English and Maths
National Outer London South East South West West Midlands Yorkshire and the
Humber
Language Total Overall Count 5+A*-C Count 5+A*-C Count 5+A*-C Count 5+A*-C Count 5+A*-C English 482436 57% 34225 62% 80838 59% 52537 57% 53027 55% 51077 55% Other than English 13057 57% 3422 62% 924 57% 411 54% 1336 59% 794 49% Urdu 7012 53% 1310 63% 592 54% 48 46% 1565 49% 966 45% Panjabi 6378 51% 1027 67% 627 56% 67 43% 1237 60% 1504 40% Bengali 4952 61% 622 70% 375 62% 95 61% 582 65% 289 52% Polish 4064 43% 741 56% 648 43% 318 45% 386 37% 414 35% Gujarati 3155 71% 958 77% 154 77% 34 74% 215 79% 202 58% Somali 3084 50% 1172 48% 73 48% 112 37% 379 51% 111 39% Arabic 2182 58% 675 58% 206 62% 39 64% 184 57% 181 45% Portuguese 1973 39% 432 44% 262 37% 117 38% 82 44% 67 25% Turkish 1445 49% 621 49% 85 42% 41 44% 12 42% 26 42% Tamil 1388 75% 866 76% 190 77% 19 68% 47 64% 10 50% French 1331 57% 366 51% 167 70% 52 71% 90 43% 47 36% Bengali (Sylheti) 1183 62% 26 58% 11 82% 5 40% 188 56% 7 43% Spanish 1052 54% 210 57% 140 62% 53 58% 23 35% 26 38% Pashto/Pakhto 1023 37% 278 31% 117 35% 13 62% 242 46% 126 42% Yoruba 1001 71% 336 70% 68 81% 5 100% 13 85% 10 70% Total 57% 62% 59% 57% 55% 54%
33


