language testing - η-Τάξη ΕΚΠΑ speaking 4.pdf · vocabulary knowledge, etc. for much of...
TRANSCRIPT

http://ltj.sagepub.com
Language Testing
DOI: 10.1177/026553229901600105 1999; 16; 82 Language Testing
John A. Upshur and Carolyn E. Turner method and learner discourse
Systematic effects in the rating of second-language speaking ability: test
http://ltj.sagepub.com/cgi/content/abstract/16/1/82 The online version of this article can be found at:
Published by:
http://www.sagepublications.com
can be found at:Language Testing Additional services and information for
http://ltj.sagepub.com/cgi/alerts Email Alerts:
http://ltj.sagepub.com/subscriptions Subscriptions:
http://www.sagepub.com/journalsReprints.navReprints:
http://www.sagepub.co.uk/journalsPermissions.navPermissions:
http://ltj.sagepub.com/cgi/content/refs/16/1/82 Citations
by Evdokia Karavas on April 9, 2009 http://ltj.sagepub.comDownloaded from

Systematic effects in the rating ofsecond-language speaking ability: testmethod and learner discourseJohn A. Upshur Concordia University, MontrealCarolyn E. Turner McGill University, Montreal
Major differences exist in two approaches to the study of second-language per-formance. Second-language-acquisition (SLA) research examines effects upon dis-course, and is typically unconcerned with scores. Language-testing (LT) researchinvestigates effects upon scores, generally without reference to discourse. Withina general framework of test taking and scoring, we report research from these twofields as it relates to questions of systematic effects on second-language tests. Wethen examine findings incidental to a test-development project.
The findings were consistent with LT research into systematic effects of taskand rater on ratings, and with SLA research into systematic effects of task ondiscourse. Using empirically derived scales as indicators of salient features ofdiscourse, we infer that task type influences strategies for assessing language per-formance. Explanations for these joint findings are not afforded by either standardLT or SLA perspectives. There is no theory of method to explain how particularaspects of method affect discourse, how those discourse differences are thenreflected in ratings and how task features influence the basis for judgement. Weconclude that a full account of performance testing requires a paradigm that incor-porates relationships that are not specified in either the major language-testingresearch tradition or the tradition of second-language-acquisition research.
I Introduction
Concern with systematic error effects has been reflected in language-testing (LT) research at least since early applications of Campbelland Fiske’s (1959) multitrait-multimethod approach to construct vali-dation (see, e.g., Bru¨tsch, 1979; Clifford, 1981; Corrigan and Upshur,1982). The early studies examined tests of locally independent itemsscored dichotomously. These differ greatly from tests consisting of avery few performances rated on scales with a number of levels. Morerecently, studies focusing on the systematic effects upon ratings canbe found in the research domain of language testing, but these studies
Address for correspondence: Carolyn E. Turner, McGill Univesity, Department of Second Lan-guage Education, Faculty of Education, 3700 McTavish Street, Montreal, QC, Canada H3A1Y2; e-mail: cx9xKmusica.mcgill.ca
Language Testing 1999 16 (1) 82–111 0265-5322(99)LT162OA 1999 Arnold
by Evdokia Karavas on April 9, 2009 http://ltj.sagepub.comDownloaded from

John A. Upshur and Carolyn E. Turner83
do not consider the effects upon the discourse that influence scores.This consideration appears in studies in the domain of SLA. In gen-eral, however, SLA research on task-related variation in discourse isnot concerned with scores.
In this paper we consider research from the fields of language test-ing and second-language acquisition as it relates to questions of sys-tematic effects on second-language tests. In order to illustrate thisresearch, we first develop a framework of test taking and test scoring,that is general enough to accommodate a variety of traits andmethods: from discrete-point, multiple-choice tests to rated samplesof communicative performance. We then review the locations andrelations in the frameworks that have been addressed by research inlanguage testing and in SLA. Next we report some findings incidentalto a test-development project. These confirm some findings on methodeffects reported in the LT research literature and show some discoursefeatures that are differentially important for assessing performance ondifferent performance test tasks.
II Test taking and scoring
The minimum requirements for a test are an examinee and a task.The attempt by the examinee to solve the task results in a score. Thatis, the interaction between the test taker and the test task leads to ascore on that task. This is illustrated in Figure 1. This interaction canbe expressed in terms of a psychometric model: the likelihood ofgetting a score of 1 rather than 0 on a dichotomously scored item isa function of the difference between the ability of the person and thedifficulty of the item.1
The process of test taking and scoring differs from the psycho-metric model. This process, assuming the absence of method effects,is illustrated in Figure 2. For a multiple-choice item, the interactionof an examinee with a given ability and a test task with a given abilityrequirement (i.e., difficulty) lead the examinee to make a mark on ananswer sheet. This is the test taking phase. The marked answer sheetis then compared by a human or machine scorer to an answer key;
Figure 1 Generalized model of a test
1The Rasch one-parameter model is one illustration of this. Other more complex models exist.
by Evdokia Karavas on April 9, 2009 http://ltj.sagepub.comDownloaded from

84 Rating of second-language speaking ability
Figure 2 Objective test taking and scoring, no method effects
if the two match, a score of 1 is given. Otherwise, the score is 0.This is the test-scoring phase.
Figure 2 describes the process applicable to standardized tests madeup of discrete-point tasks (i.e., locally independent, objective items).Under the assumptions of no method effect and perfectly reliableanswer marking and scoring, an examinee’s score on a task is a func-tion of (1) how much of the trait the examinee possesses and (2)how much of the trait the task requires for correct performance.
When one assumes the presence of method effects, however, ascore is a function not only of trait ability and trait requirements, butalso of other non-trait abilities and requirements. This is illustratedin Figure 3. Tests are never perfectly valid. Every test method requiresa variety of abilities for satisfactory performance. Test performancedepends, therefore, upon a number of non-trait abilities of the testtaker. These constitute systematic errors of measurement.
Figure 3 Objective test taking and scoring, with method effects
by Evdokia Karavas on April 9, 2009 http://ltj.sagepub.comDownloaded from

John A. Upshur and Carolyn E. Turner85
Figure 3 illustrates the process of objective testing when methodeffects are included. In addition to ability in the trait of interest, anexaminee’s performance is affected by other abilities and character-istics that are related to non-trait requirements of the task. Forexample, items in a test of grammatical knowledge might be influ-enced systematically by an examinee’s reading ability, visual acuity,general intelligence, gender, cultural affiliation, risk tolerance,vocabulary knowledge, etc.
For much of modern language testing this model is too limited.The assumptions of unambiguous answer marking and error-freedichotomous scoring no longer hold, even approximately. Instead offilling in squares on an answer sheet, the examinee produces, perhapstogether with an interlocutor, an oral or written discourse. This dis-course is heard or read by a human judge who refers to a scoringguide or rating scale in order to select a score to represent the exam-inee’s ability in the trait of interest. Figure 4 illustrates this extendedmodel of systematic effects on performance test scores.2 Examineeand task interaction produces a discourse, not a score as in the simplermodel. Then the three-way interaction of discourse, rater (or, judge,as often referred to) and scale yields a score that is interpreted as ameasure of the examinee’s trait ability. This elaborated modelpresents a graphic indication of systematic effects to be studied inorder to better understand performance tests.
Bachmanet al. (1995: 239) note that performance testing bringswith it ‘potential variability in tasks and rater judgements, as sourcesof measurement error.’ This has been recognized, and studies of someof these additional effects have been reported (e.g., Lumley and
Figure 4 Performance test taking and scoring (with method effects)
2This is similar to the representation independently developed by McNamara (1996: 86).
by Evdokia Karavas on April 9, 2009 http://ltj.sagepub.comDownloaded from

86 Rating of second-language speaking ability
McNamara, 1995; Tyndall and Kenyon, 1996). Most of the LT studiesfocus upon systematic effects upon scores. They do not generally takeaccount of the discourse that is a determiner of scores.
There is another research domain, SLA, that examines test factorsthat affect discourse. That literature tends not to be concerned withraters and scores, however. There is some cross-referencing of worksin LT and SLA (e.g., Bachman and Cohen, in press; Chalhoub-Deville, 1995), but we have been unable to locate any comprehensivesynthesis of findings from the two domains that addresses the questionof systematic effects on performance tests.
III Systematic error effects: the research literature
Systematic effects on the rating of writing and speaking ability havebeen investigated. The typical approach in the field of LT is to exam-ine effects on scores. On the other hand, the typical approach in thefield of SLA is to examine effects on the discourse generated in taskperformance. Studies exemplifying both approaches are cited below.
1 Systematic effects on scoresa Examinee characteristicsStudies of examinee effects are rela-tively infrequent. Simon (1994) provides a discussion on differentialitem functioning studies within a bilingual context (viz, Canada);Elder (1995) has preliminary results concerning the use of commonassessment instruments and scales to assess the language skills oflearners from different language backgrounds; Sunderland (1995) hasdemonstrated ways in which gender bias may manifest itself. Testbias has been studied in educational contexts, focusing on minoritygroups taking tests where the test language is not their first language(cf. Green, 1994; Samudaet al., 1989). Norming studies documenteffects of examinee group membership (e.g., geographical region, firstlanguage), but effects of these demographic variables cannot be disen-tangled from the many other variables with which they are con-founded. Kunnan (1995) has reported a rigorous investigation ofexaminee effects. Using structural equation modelling with two cul-turally different groups, he evaluated systematic effects of informalexposure and instruction, location of exposure, and monitoring onproficiency test performance. Speaking ability was not well accountedfor by these factors.
b Task attributes Research documenting the task effect on testscores is more abundant. In oral proficiency testing, this effect is mostoften examined in terms of task difficulty. Kenyon (1995), for
by Evdokia Karavas on April 9, 2009 http://ltj.sagepub.comDownloaded from

John A. Upshur and Carolyn E. Turner87
example, in a validation study of performance-based tests of oral pro-ficiency explores the ability demanded by different tasks. Empiricalordering of the tasks by difficulty support ana priori ordering. None-theless, Fulcher (1994) includes the effect of task difficulty on scoresas a priority area for research on oral language testing. Chalhoub-Deville (1995) points out that a construct can be represented by sev-eral tasks, but that construct dimensions are manifested differentlydepending on how the construct is operationalized. Therefore, ratingsare context-specific with regard to tasks. She calls for empiricallyderived dimensions according to the specific task and audience.
A further direction of study concerning the method effect is theinvestigation into the effects of direct versus semi-direct versions oforal proficiency tests. Stansfield and Kenyon (1992) compared directand semi-direct interviews. O’Loughlin (1995) found a high corre-lation between test scores (r = .92), but observed that the semi-directversion produced a more literate type of language than the direct orlive version. It was the degree of interactiveness in the direct versionmore than the difference in test format with the semi-direct versionthat had salient effects on the discourse produced. The more interac-tion, the lower the degree of lexical density in the discourse.
c Discourse qualities Most of the work relating discourse character-istics to scoring has been done in the field of writing assessment, andindirectly in the process of rating scale development. Vaughan(1991), for example, found that holistic raters of ESL compositionsfrequently reported six different text features that influenced theirjudgements. Weigle (1994a) documented the criteria applied by ratersin assessing writing ability before and after training. A number ofwriters have described empirical methods for constructing ratingscales (Pollitt and Murray, 1993; Stansfield, 1986; Upshur andTurner, 1995). Examination of samples of learner performance revealqualities of the discourse that affect judgements and, ultimately, thescores assigned. Another approach to relating discourse qualities toscores has been to investigate the relation of subtraits to holisticscores (see, e.g., Henning and Davidson, 1986).
d Rater characteristics A major concern with performance testingis that the tasks require subjective assessments by raters. The rater isnot only an additional source of measurement error but, as a methodfacet, may also exert systematic – although unwanted – effects uponscores. Investigating effects and ways to control them have been thefocus of several studies.
The developments in many-facet Rasch measurement (Linacre,1989–1993a) have provided improved techniques for investigating
by Evdokia Karavas on April 9, 2009 http://ltj.sagepub.comDownloaded from

88 Rating of second-language speaking ability
rater effects. It is now well established that raters differ in the severityof their judgements of ability (Lumley and McNamara, 1995; Wiggle-sworth, 1993). The seriousness of this effect has been questioned,however. Bachmanet al. (1995: 253) using both many-facet Raschmeasurement and generalizability theory found that, although therewas a wide range of judge severity, this was unlikely to produce anoverall effect on test scores that are based upon double ratings ofmultiple tasks. Going beyond questions of severity, McNamara andAdams (1991/1994) note further that raters can demonstrate a vari-ation in behaviour depending on the particular group of examinees,the particular task, and the particular occasion. Linacre (1989–1993a)uses the termbias to describe this interaction.
Rater training, as an attempt to control rater variability, has alsobeen investigated. Lunzet al. (1990) suggest that training cannotmake judges equally severe, but it can increase the consistency withwhich individual judges rate all subjects (i.e., intrarater reliability).Weigle (1994b) found changes in rater behaviour after training. Eventhough differences in severity across raters still remained, the trainingappeared to bring extreme raters within a range of tolerable severity.Individual rater consistency improved across the inconsistent raters.Lumley and McNamara (1995) suggest that results of training maynot last for long after a training session, thus demonstrating a needfor renewed training before each test administration. It has been sug-gested that information obtained from many-facet Rasch analysescould be used effectively for feedback in rater training (Tyndall &Kenyon, 1996). Using information from a bias analysis, Wiggles-worth (1993) found that raters were responsive to feedback and wereable to incorporate it into subsequent ratings so that bias was reduced.
In spite of rater training, however, each rater has a unique back-ground that may effect judgements. Elder (1993) studied rater behav-iour in the assessment of English proficiency of non-native-speakergraduate students training as secondary maths and science teachers.Raters were of two groups: ESL teachers and maths/science subjectspecialists. They gave similar ratings for overall communicativeeffectiveness, but differences were found in their ratings of particulardimensions of language use. Brown (1995) explored effects of rateroccupation and language in an occupation-specific oral-language test.Results were similar to Elder’s (1993). She found no significant dif-ferences in overall grades awarded by different rater groups. Differ-ences were found, however, on ratings for individual criteria. This isinterpreted as a demonstration of different perceptions of what consti-tutes good performance.
by Evdokia Karavas on April 9, 2009 http://ltj.sagepub.comDownloaded from
John A. Upshur and Carolyn E. Turner89
e Scale types There are a number of ways to classify rating scales.3
These may refer to the physical form or layout of the printed scale,to the latent variables assessed or to the content of descriptors. Oneway of classifying second-language rating scales is of especial rel-evance to a consideration of systematic method effects: scale typesrepresent the underlying assumptions about possible systematiceffects upon ratings. Three different assumptions about scaling langu-age performance are represented in existing scale types. The firstnotion is that of ‘absolute proficiency rating’. It assumes, implicitlyat least, that there is no task effect, or that the rating scale can itselfcompensate for task effects.
The second notion is that of ‘task proficiency rating’. It views lang-uage performance tasks as more difficult or less difficult, but holdsthat a single rating scale will apply to all tasks of a kind (e.g., speak-ing tasks). Within this view, examinee abilities are estimated fromratings of their performances on a task,adjusted bythe calibrateddifficulty of that task.
The third notion is that of rating according to a task/scale unit.Task effects are acknowledged; it is further assumed that the qualitiesof discourse that reflect progressive-ability levels will differ acrosstasks and populations. For example, the qualities of discourse thatmark competence in telemarketing will differ from those that markcompetence in psychotherapy. Rating scales developed according tothis notion are, therefore, specific to a population and task, and areoften generated from empirical data.
We have found no studies that examine effects upon test perform-ance by scales reflecting these three sets of assumptions about system-atic effects. Most studies utilize one of the first two types of ratingscales. They do not, however, analyse effects.
2 Systematic effects on discourse
Two kinds of effect upon discourse have been examined, thoseinvolving learner abilities and those involving such method effects aselicitation procedure, interlocutor characteristics, etc. In this paper weare not concerned with associations between proficiency (the trait ofspeaking ability) and performance, but rather with other systematiceffects that may obscure our estimates of learner ability. A few studiesof effects upon discourse in language testing have been conducted(e.g., O’Loughlin, 1995; Lazaraton, 1996). These are rare, however,
3In this paper we consider a scale as an ideally unidimensional measure of a single (albeitcomplex) construct or ability. We do not consider multi-scale scoring schemes such as profiles,their considerable diagnostic and prescriptive educational values notwithstanding.
by Evdokia Karavas on April 9, 2009 http://ltj.sagepub.comDownloaded from

90 Rating of second-language speaking ability
and do not as yet provide substantial links between method, discourseand scores.
Examination of systematic effects upon discourse quality has beenstudied most frequently as research in systematic variation in the fieldof second-language acquisition. Ellis (1994: 138 and 142) divides thisresearch into two general classes: (1) investigations of task-inducedvariation that documents the effects that context has upon variationbut does not identify the effective contextual factors; and (2) investi-gations of context-induced variation that have ‘examined the effectsof different aspects of context: linguistic, sociolinguistic, and psychol-inguistic’. Studies of this first sort are exemplified by Rose and Ono(1995) who found that discourse completion tasks and multiple-choice tasks elicit different forms of interrogation by Japanese lear-ners of English.
a Examinee characteristicsA large number of studies have docu-mented effects of examinee characteristics upon the discourse pro-duced by second-language learners. Among these characteristics are:ethnicity and culture (Beebe and Zuengler, 1983; Takahashi, 1989);first language (Reid, 1988); gender and status (Porter, 1991).
b Task attributes Most of the task effect studies have examinedrelations between common elicitation procedures and the incidenceof specific forms in elicited speech.
Phonology has been a common focus of study. Dickerson (1975),for example, found relation between formality and pronunciation of/z/ by Japanese learners of English. Beebe (1980) found formalityeffects for pronunciation of Thai and English variants of /r/ in a studywith Thai speakers. Sato (1985) found a clear relation between taskand pronunciation in a ten-month study of a Vietnamese learner, butcould not explain it in terms of task formality.
In studies of morphology and syntax, Tarone (1985) found relationbetween task (grammatically judgement, oral narration, interview)and accuracy of three morphemes. Like Sato she could not explainthe effects according to formality of the task. Ellis (1987) studiedaccuracy of past-tense forms produced in three tasks. He found arelation that was explainable in terms of planning time.
Another set of investigations of task effects focuses upon interlocu-tor attributes and behaviour. Studies of interlocutor effects have oftenlooked not only at specific linguistic forms, but also at broader dis-course characteristics. Beebe and Zuengler (1983), for example,found that the amount of speech produced by children during inter-views was positively related to the amount used by their interviewers.In addition to the effect of amount of interlocutor speech, documented
by Evdokia Karavas on April 9, 2009 http://ltj.sagepub.comDownloaded from

John A. Upshur and Carolyn E. Turner91
interlocutor effects include the support provided by the interlocutorto the examinee (Lazaraton, 1996).
Although there is a considerable literature in LT relating methodand scores and in SLA relating method and discourse, there is yet notheory of method to explain how particular aspects of method havesystematic effects upon discourse that are reflected in test scores.Neither is there a developed explanation of how rater and examineecharacteristics interact with one another and with discourse character-istics to yield ratings. Some tentative hypotheses have been offeredto explain the effects of method facets upon produced discourse: taskformality, planning time and social accommodation, for example(Ellis, 1994). These hypotheses are far from comprehensive, however.Descriptions of effects of discourse features and examinee character-istics upon rater judgements are virtually non-existent and, so, conse-quently, are any attempts to explain those effects.
IV Incidental findings
In this section we report some findings incidental to a test-develop-ment project. This is not a report on the validity of the developedtests for their intended purpose. The report is intended, rather, to illus-trate the framework introduced above, to report findings about methodeffects that confirm previous LT research results, to extend somewhatthe method effect findings, and finally to present new informationabout the salience for raters of task-related features of discourse. Thisinformation arises from a type of analysis different from the moreusual discourse analysis favored in SLA research.
1 The test-development project
The purpose for the project was to provide a school board with anefficient, standard measure of speaking ability. It was assumed by theboard that individual teachers were providing reliable assessments ofstudent ability within their own classrooms, but that a supplementarymeasure, common for all classes, was needed. A detailed descriptionof the project is given in Turner and Upshur (1996). An abbreviatedaccount of the project is given below.
a Setting and participants The study took place in a large urbanschool board near Montreal, Quebec. The language of instruction isFrench; English as a second language (ESL) is a required subject for120 minutes per week starting in Grade 4. At the end of Grade 6,students are graduated to secondary schools and are streamed intoESL classes as determined by their Grade 6 ESL marks. According
by Evdokia Karavas on April 9, 2009 http://ltj.sagepub.comDownloaded from
92 Rating of second-language speaking ability
to the curriculum adviser of the school board, the Grade 4–6 ESLprogram is based upon principles of communicative language teach-ing.
There were two groups of participants: (1) 12 elementary schoolteachers who served both as test developers and raters, and (2) 255Grade 6 ESL learners. Teacher participants were volunteers. Studentparticipants were enrolled in the classes of the teacher participants.Standard practices for use of human subjects were followed.
With the collaboration of the school board’s ESL curriculumadvisor, we undertook a project to develop a standardized instrumentof speaking ability which could serve as one indicator for secondary-school ESL class placement.
b Instruments This study employed two measures of speakingability developed specifically from the population. A measure isdefined here as a speech elicitation task and a rating scale. The devel-opment process involved the 12 teachers and two researchers. TheEBB scaling procedure was followed (i.e., the scale isempiricallyderived, requiresbinary choices by raters, and defines theboundariesbetween score levels; see Turner and Upshur, 1996).
Elicitation tasks Following a meeting with the 12 teachers, the cur-riculum advisor and the two researchers, two tasks were agreed uponand developed for use. This included piloting and revision. The twotasks were: Story Retell (SR) and Audio-Pal (AP).
• Story Retell (SR) – The students watch a two-and-a-half minutevideo. They are instructed to draw a picture after viewing thevideo to help them remember the story. They are asked to savetheir pictures. Individually they go to a quiet place where theyfind a tape recorder and an instruction sheet. They retell the storyin their own words, using their pictures.
• Audio-Pal (AP) – Students go individually to a recording site.They are informed that English-speaking exchange students of thesame grade from other provinces are coming to live and attendschool with them for a month. Each student is then instructed tocompose a letter in the form of a tape recording to an exchangestudent. They are guided to talk about topics like: ‘yourself andfamily, your hobbies and interests, things you might do together,what school is like’.
Rating scale Rating-scale development took place after the teachershad administered the elicitation tasks to a sample of 36 Grade 6 lear-ners from across the school board and recorded their performances.
by Evdokia Karavas on April 9, 2009 http://ltj.sagepub.comDownloaded from

John A. Upshur and Carolyn E. Turner93
A sample set of 12 performances was identified for each task (i.e.,one sample set from SR responses and one sample set from APresponses).
Scales were constructed in accordance with the third notion of rat-ing scales as outlined above, namely that tasks affect both score andtype of discourse. Two rating scales were empirically developed fromthe sample sets: one scale specific to the Story Retell task, and theother specific to the Audio-Pal task. Six teachers and one of theresearchers developed one scale, while the other six teachers andsecond researcher developed the other scale. For both tasks the teach-ers found that they were able to distinguish six ability levels. Theythen devised rating procedures for two different six-level scales. Thescale development procedure is described briefly below in the sectionon task effects on discourse.
c Testing procedure Near the end of the school year, teachers usedthe two tasks to test their students. Students were individually calledout from their regular classrooms activities for testing. All responseswere taperecorded for subsequent scoring.
d Scoring procedure Soon after testing, a scoring day session wasset up. The teachers brought in the tape recordings of their students.They rated the students from their own classes and the students fromtwo other classes taught by different teachers. In this way, each stud-ent recording was rated independently by three of the participatingteachers.
e Analysis The data set was analysed using many-facet Raschmeasurement with the program FACETS, Version 2.75 (Linacre,1994). To examine the measurement characteristics of the tests, threefacets were specified: subject, rater and task. The partial-credit modelwas chosen instead of the rating scale model because the scoring cri-teria for the two scales were qualitatively different (see also Pollittand Hutchinson, 1987). In addition, a bias analysis was performed toexamine the interactions between rater and task.
The model for this analysis was:
log S Pnijk
Pnijk–1D = Bn – Di – Cj – Fk
Where:Pnijk is the probability of examineen being awarded on taski by judgej a rating ofk;Pnijk–1 is the probability of examineen being awarded on taski byjudge j a rating ofk–1;
by Evdokia Karavas on April 9, 2009 http://ltj.sagepub.comDownloaded from

94 Rating of second-language speaking ability
Bn is the ability of examineen;Di is the difficulty of taski;Cj is the severity of raterj;Fk is the difficulty of the step up from categoryk–1 to categoryk.
The use of FACETS permitted a second analysis in which studentsabilities for the two genders and across the different schools in thedistrict were compared. These were matters of concern to the localschool commission, but will not be reported here.4
A final, two-facet analysis (subjects and raters) was performed withthe AP data set in order to compare the harshness of teachers whohad developed the scale with the harshness of those who haddeveloped the other rating scale. There was insufficient data to per-form a comparable analysis with the SR data. Two hundred and fifty-five students performed either SR or AP. Forty-two of those studentsdid both tasks. For reasons discovered later, the majority of teachersadministered AP, thus resulting in an imbalance in data collectionacross the two tasks.
The FACETS analysis was performed on a total of 805 ratingsgiven by 12 raters to 297 speech performances produced by 255 chil-dren. Seventy-two of the responses were rated in the lowest (1) orhighest (6) score level and could not be used for estimating the para-meters of the measurement model. An initial concern with a FACETSanalysis is whether the mathematical measurement model fits the dataone is working with. Convergence was achieved in 63 iterations usingthe program default values. Three of the 733 measurable responseswere unexpectedly high or low. These were ratings given by threedifferent raters to speech samples produced by three different stu-dents; two ratings were unexpectedly high and one low. There was,therefore no apparent pattern to the few unexpected responses. Abili-ties of 250 of the 255 students were adequately estimated.5 In brief,the data fitted the model quite well, and most of the children’s abilitieswere well measured.
FACETS provides a graphical summary of all facets and theirelements (Figure 5). They are positioned on a common logit scalewhich facilitates comparisons across and within facets. This commonscale appears as the first column in Figure 5. The second columnshows the subjects by open and filled circles, the latter representingthree subjects and the open circle representing one or two. Subjects
4No substantive or statistical differences were found between genders. The difference in meanlogits was .02; the probability for a fixed (both the same) chi-square was .87. Mean logits forschools had a standard deviation of .24. Fixed chi-square= 17.9; df = 13; p = .16.
5Of the 255 students, five had high (. u2.0u) standardized infit indices. For four of these fivechildren standardized outfit indices were also extreme.
by Evdokia Karavas on April 9, 2009 http://ltj.sagepub.comDownloaded from

John A. Upshur and Carolyn E. Turner95
Figure 5 All facets summary
by Evdokia Karavas on April 9, 2009 http://ltj.sagepub.comDownloaded from

96 Rating of second-language speaking ability
are ranked by ability, with high ability at the top portion of the col-umn and low ability at the bottom. The third column shows task dif-ficulty with more difficult tasks at the top of the column. Rater sever-ity is indicated in the fourth column, with the more severe raters atthe top of the column and the more lenient at the bottom. The lasttwo columns graphically describe the two rating scales. Each task hasits own scale. Abilities are represented by the different scale levelsacross each task. On the scales, numerical values are positioned atinteger-expected scores and the horizontal lines are positioned at half-score points (i.e., the point at which the likelihood of getting the nexthigher rating begins to exceed the likelihood of getting the next lowerrating; Myford et al., 1996: 21). To summarize, the most likely scalescore for each ability level is shown.
FACETS provides several indications of the reliability of differ-ences among the elements of each facet. Helpful ones to examine are:Separation, Reliability and Fixed (all same) chi-square. The separ-ation index is a measure of the spread of the estimates relative totheir precision. It is the ratio of the adjusted standard deviation ofelement measures to the root mean-square standard error. One maythink of this as follows. If two subjects differ in estimated ability byone standard deviation and the standard error is one-third as large(separation index= 3.0), one would be quite confident that there wasa true difference in real subject ability. The reliability coefficient indi-cates how well the analysis distinguishes among the elements. It isthe Rasch equivalent to the KR20 or Cronbach’sa statistic, that is,the ratio of true variance to observed variance (Linacre, 1989–1993b:65). Wright and Masters (1982: 105–6) characterize it as the testreliability of (element) separation, that is, the proportion of theobserved variance in measurements of ability (severity, etc.) whichis not due to measurement error. The fixed (all same) chi-square teststhe null hypothesis that all elements of the facet are equal. Thesethree statistics are reported below as appropriate.
2 Measurement characteristics
The measurement characteristics of SR and AP are reported here toprovide evidence that the data from the project are reliable, that find-ings based upon them are credible. Two specific questions wereaddressed in the FACETS analysis in order to evaluate the metricquality of the tests: (1) Is student ability effectively measured? and(2) Are scales efficient and consistent with assumptions about distri-butions of student ability?
1) Is student ability effectively measured?As shown in Figure 5,subject ability estimates range from a high of approximately 6 logits
by Evdokia Karavas on April 9, 2009 http://ltj.sagepub.comDownloaded from
John A. Upshur and Carolyn E. Turner97
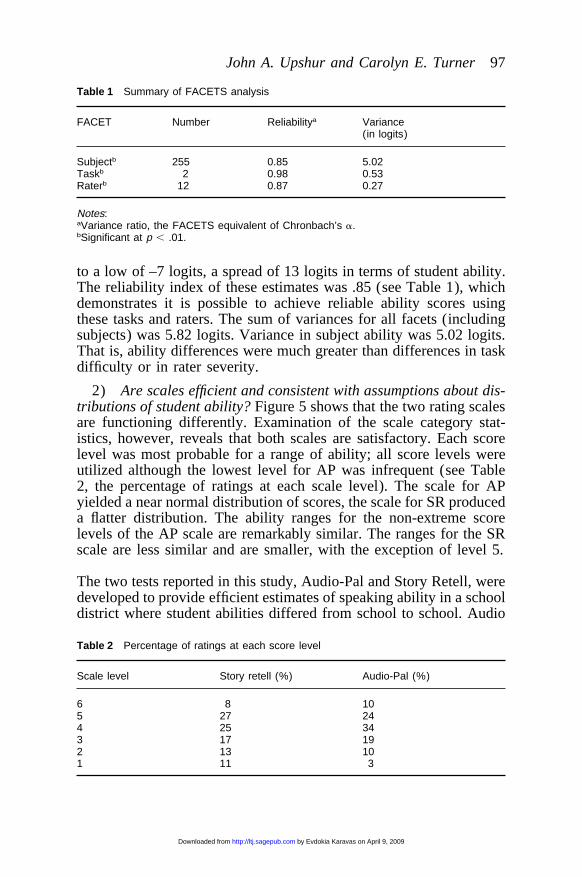
Table 1 Summary of FACETS analysis
FACET Number Reliabilitya Variance(in logits)
Subjectb 255 0.85 5.02Taskb 2 0.98 0.53Raterb 12 0.87 0.27
Notes:aVariance ratio, the FACETS equivalent of Chronbach’s a.bSignificant at p , .01.
to a low of –7 logits, a spread of 13 logits in terms of student ability.The reliability index of these estimates was .85 (see Table 1), whichdemonstrates it is possible to achieve reliable ability scores usingthese tasks and raters. The sum of variances for all facets (includingsubjects) was 5.82 logits. Variance in subject ability was 5.02 logits.That is, ability differences were much greater than differences in taskdifficulty or in rater severity.
2) Are scales efficient and consistent with assumptions about dis-tributions of student ability?Figure 5 shows that the two rating scalesare functioning differently. Examination of the scale category stat-istics, however, reveals that both scales are satisfactory. Each scorelevel was most probable for a range of ability; all score levels wereutilized although the lowest level for AP was infrequent (see Table2, the percentage of ratings at each scale level). The scale for APyielded a near normal distribution of scores, the scale for SR produceda flatter distribution. The ability ranges for the non-extreme scorelevels of the AP scale are remarkably similar. The ranges for the SRscale are less similar and are smaller, with the exception of level 5.
The two tests reported in this study, Audio-Pal and Story Retell, weredeveloped to provide efficient estimates of speaking ability in a schooldistrict where student abilities differed from school to school. Audio
Table 2 Percentage of ratings at each score level
Scale level Story retell (%) Audio-Pal (%)
6 8 105 27 244 25 343 17 192 13 101 11 3
by Evdokia Karavas on April 9, 2009 http://ltj.sagepub.comDownloaded from

98 Rating of second-language speaking ability
Pal could be recommended for that purpose. Reliability was satisfac-tory; the rating scale functioned well; teachers rated well with littletraining; it was an easy test to administer and was well accepted byall of the teachers who participated in the study. We suspect, more-over, that differences in rater performance could be reduced withsome group scoring experience (cf. Tyndall and Kenyon, 1996; Wei-gle, 1994a; Wigglesworth, 1993). More important to this paper, weare justified in accepting the results obtained incidentally to develop-ment of the tests.
3 Systematic effects on scores
Three questions, answerable through the FACETS analysis, relate tosystematic method effects upon test scores. A further question investi-gates a possible source for severity differences among raters.
1) How much do tasks (i.e., tests) that are designed to be equivalentactually differ in difficulty?
2) Are teacher-raters equally severe? Are they individually consist-ent?
3) Are teacher-raters biased with respect to test tasks?4) Do teachers who have been scale constructors rate differently
from other raters?
1) How much do tasks (i.e., tests) that are designed to be equival-ent actually differ in difficulty?The analysis reports a 1.48 logit dif-ference in the difficulty level of the two tasks. SR is .74 logits andAP is –.74 logits. This difference is shown in Figure 5. The separationindex is 7.76 and the reliability coefficient is .98. The analysis reliablydistinguishes between different levels of task difficulty. The fixed (allsame) chi-square is 122.3 withdf = 1 andp = .00, therefore the nullhypothesis of no difference must be rejected. Furthermore, not onlydo the tasks present different levels of difficulty, but differences inthe respective scale steps lead to different scoring on the two tasks.Although most students, regardless of ability level, would be rated atthe same or the adjacent scale level on the two tasks, the two testsexamined here cannot be considered equivalent.
2) Are teacher-raters equally severe? Are they individually con-sistent?Rater behaviour can be analysed in terms of relative severity,and also in terms of consistency within individual raters.
Figure 5 reveals that, although eight raters appear to cluster aroundthe center of 0, three raters are near the extremes of 1 and –1 logits,approximately 2 logits difference in severity. The fixed chi-square forrater severity is 93.2 withdf = 11 andp = .00. In other words, theraters are not equally severe. Separation of raters is 2.54, with a
by Evdokia Karavas on April 9, 2009 http://ltj.sagepub.comDownloaded from

John A. Upshur and Carolyn E. Turner99
reliability of .87. This reliability coefficient indicates that the analysisis fairly reliably separating raters into different levels of severity.
Within-rater consistency measures are represented in FACETS bytwo measures of fit: the infit and the outfit. The infit is the weightedmean-squared statistic which is sensitive to unexpected responses nearthe point where decisions are made. The outfit has the same form butis the unweighted mean-squared statistic and is more sensitive to out-liers (extreme scores). For the purposes of this study the infit statisticwill be analysed. The literature provides no hard and fast rules forsetting upper and lower limits. These would depend on the nature ofthe study. As guidelines, however, Lunz and Stahl (1990) have sug-gested lower and upper limits of .5 and 1.5 respectively. Lower than.5 indicates too little variation, lack of independence, or overfit.Greater than 1.5 indicates too much unpredictability in rater scores.Linacre (1989–1993b) suggests .7 or .8 and 1.3 or 1.2. The ratermeasurement report of infit statistics shows four who are extreme byLinacre’s standards: raters 6 and 12 highly conforming at .6; rater 1at 1.4 and rater 7 at 1.5 tend towards unpredictability. None of theseraters exceed the limits proposed by Lunz and Stahl, however.FACETS also provides standardized infit statistics with an expectedmean of 0 and standard deviation of 1. This shows the degree ofvariability in individual rater scores relative to the amount of varia-bility in the entire data set and proves helpful in comparing elementsof a facet. Greater than 2 or less than –2 are considered indicationsof misfit. None of the raters have standardized infit statistics outsideof this range.
In summary, raters are not equally harsh, but they rank students inmuch the same way and they are reasonably consistent in their ownrating behaviour.
3) Are teacher-raters biased with respect to test tasks?To furtherexplore rater behaviour, a bias analysis was conducted between raterand task. After correcting for bias, there were 3 unexpected responsesthat remained. This is an acceptably low number.
The Bias/Interaction Calibration Report lists the extent of bias foreach rater. Rater 8 had significant bias, being unexpectedly severe onSR (Z-score of 3.3, with Z. 2.0 indicating significant bias). Raters2 and 10 showed no bias on either SR or AP. All other raters demon-strated bias, but the direction of bias differed. Severity bias againstSR (i.e., judging SR more harshly than AP) was shown by Raters 3,6, 8 and 12. There was no severity bias for AP. Leniency bias wasshown for SR by Raters 1, 4, 5 and 7. Leniency for AP was shownby Raters 9 and 11. In summary, 10 of the raters showed bias, withonly Rater 8 showing significant bias. Eight of the 10 raters showed
by Evdokia Karavas on April 9, 2009 http://ltj.sagepub.comDownloaded from

100 Rating of second-language speaking ability
a greater degree of bias towards SR than AP. To summarize, one ofthe raters showed significant bias, giving unexpectedly severe ratingsfor SR. Although there were no other significant rater-by-task biases,there was a clear tendency for raters to agree on AP scores, but togive unexpectedly high or low ratings on SR.
4) Do teachers who have been scale constructors rate differentlyfrom other raters?A two-facet analysis, subjects and raters, was runon the AP data set. Only the AP results provided a sufficient amountof data for meaningful analysis, so a comparable analysis on the SRdata set was not undertaken. The range in harshness of the 12 ratersis 3.44 logits, with the most severe at 1.74 and the most lenient at –1.70. The six most severe raters were the developers of the scale.They ranged from 1.74 to .35 logits. The remaining raters, who didnot construct the scale, were more lenient with a range from .00 to –1.70 logits. See Table 3. The probability for such a split is less than.005. We have no evidence pointing towards a particular explanationfor this finding. It seems, however, that raters tend to be lenient whenrating instructions or scale descriptors are less well understood orinternalized.
Summary of findings on method effectsThe Facets analysis of thetest development data modelled the trait of speaking ability and threedifferent method effects: task difficulty, rater severity and scale step.The results confirm the findings of others that task differences affectscores (cf. Bru¨tsch, 1979; Chalhoub-Deville, 1995; Clifford, 1981;Corrigan and Upshur, 1982; Fulcher, 1994; Kenyon, 1995; O’Lough-lin, 1995; Stansfield and Kenyon, 1992). It also confirms general fin-dings that judges differ in severity (cf. Bachmanet al., 1995; Elder,1993; Lumley and McNamara, 1995; Myfordet al., 1996; Weigle,
Table 3 Teacher severity on Audio-Pal in relation to the scale constructed
Teacher Severity (in logits) Scale construction team
4 1.74 AP5 0.87 AP1 0.49 AP2 0.44 AP7 0.38 AP9 0.35 AP6 0.00 SR8 –0.37 SR
11 –0.38 SR12 –0.69 SR10 –1.13 SR3 –1.70 SR
by Evdokia Karavas on April 9, 2009 http://ltj.sagepub.comDownloaded from

John A. Upshur and Carolyn E. Turner101
1994b; Wigglesworth, 1993). Although severity may be related topermanent characteristics of raters, we found evidence that it mightbe also related to a rater’s involvement in construction of the scaleused for ratings. We also found rater by task bias (cf. Brown, 1995;Elder, 1993; Wigglesworth, 1993 for other findings of rater bias).
4 Task effects on discourse
At issue in our examination of the project is: What features of dis-course are salient for the assessment of speech generated by two dif-ferent tasks?
The procedure for developing the rating scales for SR and APyielded an analysis of those features. This ‘analysis’ differs consider-ably from the types of analysis generally employed in SLA researchin which an investigator either looks for the existence of preselectedfeatures or attempts to provide a comprehensive account of a text.
Before creating a rating scale, the construction team agree in gen-eral terms upon the ability, construct or attribute that they wish tomeasure. The essentials of the scale-making procedure itself can bedescribed as a repeated sequence of three operations: first, a groupof scale constructors individually divide a sample of performances(e.g., voice recordings or compositions, etc.) into a better half and apoorer half; then, as a group, they discuss their divisions of the sampleand reconcile any differences; finally, they find some characteristicof the samples that distinguishes the two halves, and they state thatcharacteristic in the form of a binary question that can be used insorting other samples. The procedure is applied to successive sub-samples of the original sample. The outcome is a set of questionsreflecting characteristics of the performances that are salient for dis-tinguishing among the different ability levels of the group. Figure 6illustrates formally a set of five binary questions devised by this pro-cedure to sort a set of performances into six levels.
Rating scales developed for different tasks may reveal differentfeatures that are salient for demonstrating ability to perform thosetasks. For example, the feature that distinguished upper half perform-ance on SR was ‘Did the learner produce a coherent story with allthree story elements without long pauses?’ Better performance on APwas distinguished by ‘Did the learner use a variety of structure (atleast 2 sentence patterns, with expansions)?’ The complete set of sali-ent features for the two tests appear as Figure 7.6
6The rating procedure involves a hierarchical comparison of scale questions with studentperformance. In this way a performance is rated by considering only two or three features. Itis possible, therefore, for a higher rated performance to lack some quality that is present in alower rated performance. The full scales are presented in Turner and Upshur (1996).
by Evdokia Karavas on April 9, 2009 http://ltj.sagepub.comDownloaded from

102 Rating of second-language speaking ability
Figure 6 Sample and subsamples for developing scale questions
Figure 7 Salient discourse characteristics for two tests at different ability levels
by Evdokia Karavas on April 9, 2009 http://ltj.sagepub.comDownloaded from

John A. Upshur and Carolyn E. Turner103
The highest level students are distinguished from the next highestlevel by fluency regardless of task or scale. Lowest students are typi-cally marked by reliance upon their L1. Otherwise, SR students atintermediate levels on the scale are differentiated by considerationsof content in their responses. AP students differ according to formalfeatues of phonology and grammar.
V Conclusions and implications
1 Scale making as analysis of discourse
In addition to confirming findings by other investigators, the studyshows how the tasks stimulate discourse that is judged according toquite different criteria. This difference appeared during scale develop-ment. The development teams had to identify salient characteristicsof the two sets of discourses that were significant indicators of speak-ing ability. These different characteristics are incorporated in the twotask-specific rating scales. It has not been determined, however,whether the different sets of criteria are themselves ordered in termsof how difficult they are to satisfy.
Although this type of analysis of salient features is useful for scaleconstruction and may be useful for some other purposes (e.g., ident-ifying developmental sequences), it should be recognized that it is byno means comprehensive. Features that do not distinguish learners atdifferent ability levels do not emerge in the scale construction pro-cedure. There may also be other features that distinguish among lear-ners at different ability thresholds, but which were not recognizedbecause of the thresholds selected for scale-making. Also, there maybe alternatives to the identified features at the selected level bound-aries, alternatives that just happened to be less salient to the scaleconstruction team.
2 Strategies for judgement: bias and rating of pseudo-communication
The bias analysis of our test development data showed that raterswere unexpectedly severe or lenient in scoring Story Retell. Thereare two possible explanations for this finding that have occurred tous. One is related to the overall severity of scale developers in ratingAudio-Pal. The second assumes that raters employ different assess-ment strategies when judging communicative success when theyknow what a student is trying to convey.
The overall severity explanation is that most of the data are gener-ated by performance on the Audio-Pal task. Therefore, rater severityis determined largely by ratings of Audio-Pal. Any bias is demonstrated
by Evdokia Karavas on April 9, 2009 http://ltj.sagepub.comDownloaded from

104 Rating of second-language speaking ability
in FACETS for or against Story Retell, the test with the smaller datasubset. In fact, however, it seems that the experience of constructingthe Audio-Pal scale may influence the scale makers to be more severe.Because of data limitations, it is not possible to know whether thedevelopers of the scale for Story Retell are more severe in their useof that scale. Without this information we cannot generalize about arelation between scale construction and rating severity.
The assessment strategy explanation is based upon consideration ofthe observed bias and also upon qualitative differences in the ratingscales for the two tests. In Story Retell a student’s intentions are fullypredictable by the rater; the rater knows the story. In Audio-Pal, incontrast, the rater cannot predict precisely what a student might chooseto say. For this reason it is impossible for a judge to be certain if agiven interpretation corresponds to speaker intentions. Furthermore, itis often impossible to verify student assertions. These differences inpredictability and possibilities for judgement seem to be reflected inthe two sets of scale descriptors. The most important quality in ratingStory Retell was the inclusion of elements of the story. This may bebecause it is possible to determine whether they are included. In ratingAudio-Pal it was variety of sentence structure. This seems to be a fall-back procedure for inferring communicative language ability. In sum-mary, it seems that if raters know what the child wants to say (possiblewith Story Retell), they can check to see if it is said. However, if theydo not know what is intended (as in Audio-Pal), they tend to estimatethe formal resources at the speaker’s command, and then from thatestimate they infer success in communicating.
Different rating strategies can account for some raters being unex-pectedly lenient in judging Story Retell and others being unexpectedlysevere. Their own knowledge of the story allowed some raters tobetter understand what a student was trying to say and to rate theperformance according to this enhanced understanding. For other rat-ers, their story knowledge seemed to provide a standard by whichthey could identify a student’s communicative infidelities. Thus, theremay be two sorts of strategies that define judges of pseudo-communi-cative task performance. Knowledge of communicative intent allows,probably unconsciously, some to overrate for success and others tounderrate for failures.
In this way we are able to infer a plausible difference in strategyfor rating pseudo-communicative discourse that could account for thebias noted in this study.
3 Nature of performance-test scalesNone of the literature cites direct comparisons among the three scaletypes described above: absolute proficiency ratings, task proficiency
by Evdokia Karavas on April 9, 2009 http://ltj.sagepub.comDownloaded from

John A. Upshur and Carolyn E. Turner105
ratings and task-specific rating. The test development project alsoemployed only one type of scale. Tentative conclusions may bedrawn, however.
First, we noted important qualitative differences in the salientcharacteristics of discourse produced in the two tasks and also foundreliable differences in task difficulty. These findings agree with SLAstudies on linguistic variation and with the LT studies that have exam-ined task effects: one cannot ignore systematic task effects upon per-formance test scores. Confidence in absolute proficiency ratings doesnot appear warranted.
Second, the findings also cast doubt upon the validity of task pro-ficiency ratings. One reason for doubt is the differences between thesalient qualities of discourse that emerged in the construction of thescales. As noted above, these differences appear to be related to thepredictability of speaker intentions in the tasks, and are therefore notlikely to be artifacts of having two-scale development teams. Asecond reason is the functional difference between the scales asshown in Figure 5. This reason is less persuasive as it might possiblybe caused by differences in student ability levels in the scale-develop-ment samples.
The weight of evidence suggests, therefore, that rating scalesshould be task-specific, not just population-specific. If this is true forbrief performance tasks designed to measure a single, higher-orderconstruct, it may be true as well when one is designing lengthier tasksto test for multiple constructs. On the basis of our evidence we do notbelieve that a more general scale-type should be assumed. A furtherimplication of our findings is that effective rating scales may reflecttask demands as well as discourse types. This relation between taskand rating scale has not been studied in either the LT or the SLAtraditions. Reliance upon task-specific rating scales does nothing tosolve the problem of generalization. One would clearly like to havegeneral rating scales that could be applied to a wide range of tasksin a manner such that a given rating would always have the sameinterpretation. Claims that some scales do actually have such a gen-eral nature should be received with skepticism. One can speculatethat raters who employ a single, standard scale to rate performanceon a variety of tasks may in fact reinterpret that scale for each differ-ent task. In this way the actual rating scales may reflect task influenceseven though the ostensible rating scale is invariant.
4 Test taking and rating
In this article we have reported findings consistent with (1) LTresearch on systematic effects on ratings and (2) SLA research on
by Evdokia Karavas on April 9, 2009 http://ltj.sagepub.comDownloaded from

106 Rating of second-language speaking ability
systematic effects of task on discourse. These consistencies give con-fidence that our findings are valid. An adequate explanation for themis lacking, however, because there is no theory of method to explainhow particular aspects of method affect discourse and how those dis-course differences are then reflected in test scores. We proposed thepresence of different rating strategies as a result of the way task typedetermines the importance of various discourse characteristics. Wefind no theory to explain this relationship. Nor is there a developedexplanation of how rater and examinee characteristics interact withone another and with discourse characteristics to yield ratings, or howtasks relate to well-functioning rating scales. We find that simply con-catenating the traditional research approaches of LT and SLA, asschematized in Figure 4, fails to consider a number of relationshipsthat must be addressed in a full account of performance testing. Asomewhat more complex model is sketched in Figure 8. We haveincluded a relation between task and rater to indicate our finding thatjudges seem to adapt their strategies to task demands. We have notincluded other relations that we have speculated upon in this paper.However, we think that they should be investigated. Developing andevaluating a more sophisticated model of performance testing appearsan important challenge for LT and for SLA.
We have demonstrated that the use of task-specific rating scales isintegral to a more comprehensive view of the process of performance
Figure 8 Augmented model: Performance test taking and scoring
by Evdokia Karavas on April 9, 2009 http://ltj.sagepub.comDownloaded from

John A. Upshur and Carolyn E. Turner107
test taking and scoring. We are encouraged that others are suggestingthat empirical procedures be used in the development of rating scalesand that rating scales be task-specific (e.g., Chalhoub-Deville, 1995;Fulcher, 1987; 1988; Shohamy, 1990). Moreover, some are even put-ting this into practice (Fulcher, 1996). Based on his own research,Fulcher (1996: 228) suggests ‘. . . that a data-based approach to ratingscale development appears to be promising, and that further researchshould be carried out into the description and operationalization ofconstructs for language testing, reinforcing the necessary link betweenapplied linguistics, second language acquisition research and languagetesting theory and practice’. Within this view there are still manyunresolved issues. When using empirical methods of scale construc-tion, the composition of construction teams and the make-up ofsamples of performances may have effects that deserve study. A morepressing issue relates to the tension between the needs for accuracyin assessing a particular performance and generalization to broaderdomains of language use.
Acknowledgements
We should like to acknowledge gratefully the assistance of DorryKenyon, Michael Laurier, Patsy Lightbown and Nina Spada who readearlier versions of this manuscript and provided useful advice andencouragement. They are absolved from responsibility for any short-comings that remain. Special thanks are due to Dorry for criticaladvice on the best way to employ FACETS in the analysis of ourdata. We thank also the anonymous reviewers forLanguage Testingwhose insightful comments have guided us in making neededrevisions.
VI References
Bachman, L. 1990: Fundamental considerations in language testing.Oxford: Oxford University Press.
Bachman, L.F. and Cohen, A.D., editors, in press:Interfaces betweensecond language acquisition and language testing research. NewYork: Cambridge University Press.
Bachman, L.F., Lynch, B.K. andMason, M. 1995: Investigating variabilityin tasks and rater judgements in a performance test of foreign languagespeaking.Language Testing12, 238–52.
Beebe, L.1980: Sociolinguistic variation and style-shifting in second langu-age acquisition.Language Learning30: 433–47.
Beebe, L.and Zuengler, J. 1983: Accommodation theory: an explanationfor style-shifting in second language dialects. In Wolfson, N. and Judd,
by Evdokia Karavas on April 9, 2009 http://ltj.sagepub.comDownloaded from

108 Rating of second-language speaking ability
E., editors,Sociolinguistics and second language acquisition. Rowley,MA: Newbury House, 195–213.
Brown, A. 1993: The role of test-taker feedback in the test developmentprocess: test-takers’ reactions to a tape-mediated test of proficiency inspoken Japanese.Language Testing10, 277–303.
Brown, A. 1995: The effect of rater variables in the development of anoccupation-specific language performance test.Language Testing12,1–15.
Bru tsch, S.1979: Convergent-discriminant validation of prospective teacherproficiency in oral and written French by means of the MLA Cooperat-ive Language Proficiency Tests for Teachers (TOP and TWP), andself-ratings. Unpublished PhD dissertation, University of Minnesota,Minneapolis, MN.
Campbell, D. andFiske, D. 1959: Convergent and discriminant validationby the multitrait–multimethod matrix.Psychological Bulletin56, 81–105.
Chalhoub-Deville, M. 1995: Deriving oral assessment scales across differ-ent tests and rater groups.Language Testing12, 16–33.
Clifford, R. 1981: Convergent and discriminant validation of integrated andunitary language skills: the need for a research model. In Palmer, A.,Groot, P. and Trosper, G., editors.The construct validation of tests ofcommunicative competence. Washington DC: TESOL, 62–70.
Corrigan, A. and Upshur, J. 1982: Test method and linguistic factors inforeign language tests.IRAL XX, 313–21.
Dickerson, L. 1975: The learner’s interlanguage as a system of variablerules.TESOL Quarterly9, 401–7.
Douglas, D. and Selinker, L. 1985: Principles for language tests withinthe discourse domains: theory of interlanguage.Language Testing2,203–26.
Elder, C. 1993: How do subject specialists construe language proficiency?Language Testing10, 235–54.
Elder, C. 1995: The effect of language background on ‘foreign’ languagetest performance: Problems of classification and measurement.Langu-age Testing Update17, 36–38.
Ellis, R. 1987: Interlanguage variability in narrative discourse: style-shiftingin the use of the past tense.SSLA9, 1–20.
Ellis, R. 1994: The study of second language acquistion. Oxford: OxfordUniversity Press.
Fulcher, G. 1987: Test of oral performance: The need for data-based cri-teria. English Language Teaching Journal41, 287–91.
Fulcher, G. 1988:Lexis and reality in oral testing. Washington DC: ERICClearing House on Languages and Linguistics (ED 298 759).
Fulcher, G. 1994: Some priority areas for research in oral language testing.Language Testing Update15, 39–47.
Fulcher, G. 1996: Does thick description lead to smart tests? A data-basedapproach to rating sclae construction.Language Testing13, 208–38.
Green, B.F. 1994: Differential item functioning: techniques, findings andprospects. In Laveault, D., Zumbo, B.D., Gessaroli, M.E. and Boss,
by Evdokia Karavas on April 9, 2009 http://ltj.sagepub.comDownloaded from

John A. Upshur and Carolyn E. Turner109
M.W., editors,Modern theories of measurement: problems and issues.Ottawa, ON: University of Ottawa, 141–62.
Henning, G. andDavidson, F.1986: Scalar analysis of composition ratings.In Baily, K., Dale, T. and Clifford, R., editors,Language testingresearch, selected papers from the 1986 colloquium. Monterey, CA:Defense Language Institute, 24–38.
Kenyon, D.M. 1995: An investigation of the validity of the demands oftasks on performance-based tests of oral proficiency. Paper presentedat the 17th annual Language Testing Research Colloquium, LongBeach, CA.
Kunnan, A.J. 1995: Test taker characteristics and test performance: a struc-tural modelling approach. In Milanovic, M., series editor,Studies inlanguage testing, Number 2. Cambridge: University of CambridgeLocal Examinations Syndicate.
Lazaraton, A. 1996: Interlocutor support in oral proficiency interviews: thecase of CASE.Language Testing13, 151–72.
Linacre, J.M. 1989–1993a:Many-facet Rasch measurement. Chicago, IL:MESA Press.
Linacre, J.M. 1989–1993b:Users guide to Facets: Rasch measurementcomputer program. Chicago, IL: MESA Press.
Linacre, J.M. 1994: FACETS (Version 2.75)[Computer software].Chicago, IL: MESA Press.
Lumley, T. andMcNamara, T.F. 1995: Rater characteristics and rater bias:implications for training.Language Testing12, 54–71.
Lunz, M.E. and Stahl, J.A. 1990: Judge severity and consistency acrossgrading periods.Evaluation and the health professions13, 425–44.
Lunz, M.E., Wright, B.D. andLinacre, J.M. 1990: Measuring the impactof judge severity on examination scores.Applied Measurement in Edu-cation 3, 331–45.
McNamara, T.F. 1990: Item Response Theory and the validation of an ESPtest for health professionals.Language Testing7, 52–75.
McNamara, T.F. 1996: Measuring second language performance. Lon-don: Longman.
McNamara, T.F. and Adams, R.J. 1991/1994: Exploring rater character-istics with Rasch techniques. InSelected papers of the 13th LanguageTesting Research Colloquium (LTRC). Princeton, NJ: ETS (ERICDocument Reproduction Service ED 345 498).
Myford, C.M., Marr, D.B. and Linacre, J.M. 1996: Reader calibrationand its potential role in equating for the TWE(TOEFL) ResearchReport No. 52). Princeton, NJ: Educational Testing Service.
O’Loughlin, K. 1995: Lexical density in candidate output on direct andsemi-direct versions of an oral proficiency test.Language Testing12,217–37.
Pavesi, M.1986: Markedness, discoursal modes and relative clause forma-tion in a formal and an informal context.SSLA8, 38–55.
Pica, T., Holliday, L., Lewis, N., Berducci, D. and Newman, J. 1991:Language learning through interaction: what role does gender playSSLA13, 343–76.
by Evdokia Karavas on April 9, 2009 http://ltj.sagepub.comDownloaded from

110 Rating of second-language speaking ability
Plough, I. and Gass, S.1993: Interlocutor and task familiarity: effects oninteractional structure. In Crookes, G. and Gass, S., editors,Tasks andlanguage learning: integrating theory and practice(35–56). Cleveden,UK: Multilingual Matters.
Pollitt, A. andHutchinson, C. 1987: Calibrated graded assessments: Raschpartial credit analysis of performance in writing.Language Testing4,72–82.
Pollitt, A. andMurray, N. 1993: What raters really pay attention to. Paperpresented at the Language Testing Research Colloquium, Arnhem.
Porter, D. 1991: Affective factors in the assessment of oral interaction:gender and status. In S. Anivan, editor,Current developments in langu-age testing. Singapore: SEAMEO RELC, 99–102.
Reid, J. 1988: Quantitative differences in English prose written by Arabic,Chinese, Spanish and English writers. Unpublished doctoral disser-tation, Colorado State University, Fort Collins, CO.
Rose, K.R. and Ono, R. 1995: Eliciting speech act data in Japanese: theeffect of questionnaire type.Language Learning45, 191–223.
Samuda, R.S., Kong, S.L., Cummin, J., Lewis, J.andPascual-Leone, J.,editors, 1989:Assessment and placement of minority students. Kings-ton, ON: C.J. Hogrefe.
Sato, C.1985: Task variation in interlanguage phonology. In Gass, S. andMadden, C., editors,Input in second language acquisition. Rowley,MA: Newbury House, 181–96.
Shohamy, E.1990: Discourse analysis in language testing.Annual Reviewof Applied Linguistics11, 115–28.
Simon, M.G. 1994: Differential item functioning: applicability in a bilingualcontext. In Laveault, D., Zumbo, B.D., Gessaroli, M.E. and Boss,M.W., editors,Modern theories of measurement: problems and issues.Ottawa, ON: University of Ottawa, 163–69.
Stansfield, C.1986: A history of the Test of Written English: the develop-ment year.Language Testing3, 224–34.
Stansfield, C.andKenyon, D. 1992: Research on the comparability of theoral proficiency interview and the simulated oral proficiency interview.SYSTEM20, 347–64.
Sunderland, J. 1995: Gender and language testing.Language TestingUpdate17, 24–35.
Takahashi, T. 1989: The influence of the listener on L2 speech. In Gass, S.,Madden, C., Preston, D. and Selinker, L., editors,Variation in secondlanguage acquisition, volume I: discourse and pragmatics. Clevedon,UK: Multilingual Matters, 245–79.
Tarone, E. 1985: Variability in interlanguage use: a study of style-shfitingin morphology and syntax.Language Learning35, 373–403.
Turner, C. andUpshur, J. 1996: Developing rating scales for the assess-ment of second language performance. In Wigglesworth, G. and Edler,C., editors,Australian review of Applied Lingustics, series S, number13: the language testing cycle: from interception to washback. Mel-bourne: ARAL, 55–79.
Tyndall, B. and Kenyon, D.M. 1996: Validation of a new holistic rating
by Evdokia Karavas on April 9, 2009 http://ltj.sagepub.comDownloaded from

John A. Upshur and Carolyn E. Turner111
scale using Rasch multi-facted analysis. In Cumming, A. and Berwick,R., editors,Validation in language testing. Clevedon, UK: MultilingualMatters, 39–57.
Upshur, J. and Turner, C. 1995: Constructing rating scales for secondlanguage tests.ELT Journal49, 3–12.
Varonis, E. and Gass, S.1985: Non-native/non-native conversations: amodel for negotiation of meaning.Applied Linguistics6, 71–90.
Vaughan, C.1991: Holistic assessment: what goes on in the reader’s mind?In Hamp-Lyons, editor,Assessing second language writing in aca-demic contexts. Norwood, NJ: Ablex Publishing Corporation, 111–25.
Weigle, S.C.1994a: Effects of training on raters of ESL compositions.Lan-guage Testing11, 197–223.
Weigle, S.C.1994b:Using FACETS to model rater training effects, Paperpresented at the 16th annual Language Testing Research Colloquium,Washington DC.
Wigglesworth, G. 1993: Exploring bias analysis as a tool for improvingrater consistency in assessing oral interaction.Language Testing10,305–35.
Wright, B.D. andMasters, G.N.1982:Rating scale analysis. Chicago, IL:MESA Press.
by Evdokia Karavas on April 9, 2009 http://ltj.sagepub.comDownloaded from