lao, p.d.r baseline report - resource centre | save the ... · pdf filetable 2: literacy boost...
TRANSCRIPT

1
Literacy Boost Lao, P.D.R
Baseline Report December 2013
Lauren Pisani, Vilasack Viraphahn, Vanhbouasy Phommachanh, and Thaythor
Vongxaytongyao
With special thanks to: Darasavanh Phonasa (MOES); Thonekeo Thammavong
(RIES); Chanthi Minavong (PESS-BOL) and Phoutdavanh Kenesane (PESS-ATT);
Somvang Vilyavanh (DESB-BOL) and Thongxay Bouthongdy (DESB-ATT);
Phonesavanh Phothichanh and Souksavanh Xayarath (Assessors)

2
I. Executive Summary This report examines the results of a student background survey and reading assessment conducted in
October 2013. The survey and reading assessment covered 714 grade 2 learners throughout 40 schools
in two provinces in Lao P.D.R. Twenty-five of the schools are located in Bolikhamxay province, in a Save
the Children International (SCI) intervention area, and 15 are located in Attapeu province, in a World
Food Program (WFP) intervention area. The 40 schools are split into 23 primary schools designated to
receive Save the Children’s Literacy Boost program and 17 comparison primary schools receiving no
intervention. The Literacy Boost program includes teacher training, community reading activities, and
age-appropriate local language material creation to support emergent literacy skills among early-grade
children.
In both Attapeu and Bolikhamxay children in comparison and intervention schools are found to be
similar almost all background characteristics and literacy skills. The only difference noted was that
comparison students in Attapeu have higher average socioeconomic status than intervention students.
Taking this slight difference into account, we confirm that comparison students in both provinces will
serve as an appropriate control groups against which to compare learning growth for Literacy Boost
students.
However, there are differences between students in Attapeu and Bolikhamxay that make it appropriate
to separate the two groups for the skill-by-skill review of students’ early literacy abilities. Most notably,
children in the two provinces have different ethnicities and therefore different home languages. Fifty-
one percent of children in Attapeu identified as Khmer, where as 46 percent of children in Bolikhamxay
were Hmong. The other main ethnic group in both provinces is Lao-Thai (38 and 48 percent,
respectively). There were also background and family differences between students in the two
provinces, but no differences were found on composite indicators like socioeconomic status, home
literacy environment, and chore/work responsibilities. Finally, analyses find that children in Attapeu
have significantly stronger literacy skills than their peers in Bolikhamxay in two of the four skills
analyzed, common word identification and listening comprehension.
Overall, children in this sample have very low literacy skills in the Lao language. On average, Literacy
Boost and comparison learners in Attapeu and Bolikhamxay correctly identified 45 percent of all letters
presented (15 letters). Literacy Boost and comparison learners in Attapeu were able to read significantly
more common words than students in Bolikhamxay (four compared to two common words read
correctly). On average, children in Attapeu and Bolikhamxay were able to decode 1.5 new words
correctly. Finally, only seven percent of students were able to independently read a short story
presented by assessors. Therefore, most children were assessed on their listening comprehension
ability, and there was not enough variation in the fluency, accuracy, or reading comprehension
measures to discuss results in this report. There were no statistically significant differences between the
proportion of readers in Attapeu and Bolikhamxay but, on average, children in Attapeu were able to
answer more comprehension questions correctly (three compared to one question). There were no

3
statistically significant differences between intervention and control groups in either province for any
skills.
The Literacy Boost program emphasize students’ home literacy environment (HLE) as an important
factor for children’s reading skill development. In this sample, HLE is relatively high with 87 percent of
children report having some kind of reading material at home, and 86 percent having seen someone at
home reading. However, the majority of books that children have at home are textbooks and only 21
percent of students have access to a storybook at home. In general, students are experiencing some
type of literacy activities at home such as being read to, receiving help with homework or being told
stories. There were no differences between the HLE of students in Attapeu or Bolikhamxay or between
comparison and intervention students.
Looking at factors that are related to children’s baseline literacy skills which may also have implications
for the equity of Literacy Boost program implementation, multivariate regression analysis find several
notable trends. First, ethnicity has the strongest correlation with early reading ability for children in this
sample, with Hmong and Khmer children scoring significantly lower than Lao-Thai children in all skill
areas. This is not surprising given that these children are learning a second language, whereas Lao-Thai
children are not, but it is notable for programming nonetheless. Beyond ethnicity, analyses find that half
of the skills analyzed are significant related to gender, attendance at school, and home literacy
environment. Specifically, girls, children who attend school more often, and those with more literacy
activities at home tend to score higher than their peers without these characteristics. Boys, children
often absent, and those with few literacy resources at home represent important target groups for
support.

4
Contents I. Executive Summary ............................................................................................................................... 2
Introduction .................................................................................................................................................. 5
II. Methods .................................................................................................................................................... 5
Sampling .................................................................................................................................................... 5
Measurement............................................................................................................................................ 6
Analysis ..................................................................................................................................................... 7
Note about benchmarks ........................................................................................................................... 7
III. Children’s Background ............................................................................................................................. 7
Student background in Attapeu ................................................................................................................ 8
Student background in Bolikhamxay ........................................................................................................ 9
Gender Differences in both provinces ...................................................................................................... 9
IV. Children’s Reading Skills .......................................................................................................................... 9
Letter Identification .................................................................................................................................. 9
Single Word Reading: Most Used Words .................................................................................................. 9
Decoding Words ........................................................................................................................................ 9
Fluency and Accuracy .............................................................................................................................. 10
Comprehension ....................................................................................................................................... 10
V. Children’s Home Literacy Environment .................................................................................................. 11
Differences in the Home Literacy Environment ...................................................................................... 11
Gender Differences ................................................................................................................................. 13
VI. Literacy Boost Site profiles: Skills and Home Literacy Environment ..................................................... 13
VII. Relationships between Skills and Home Literacy Environment ........................................................... 18
Student Background................................................................................................................................ 18
Home Literacy Environment ................................................................................................................... 19
VIII. Conclusion ............................................................................................................................................ 20
Appendix A: Inter-rater reliability ............................................................................................................... 22
Appendix B. Additional Descriptive Statistics ............................................................................................. 23
Appendix C. Individual Item Scores............................................................................................................. 27
Appendix D. Regression Results .................................................................................................................. 30

5
Introduction This report examines the results of a student background survey and reading assessment conducted in
October 2013. The survey and reading assessment covered 714 grade 2 learners throughout 40 schools
in two provinces of Lao P.D.R. Twenty-five of the schools are located in Bolikhamxay province, in a Save
the Children International (SCI) intervention area, and 15 are located in Attapeu province, in a World
Food Program (WFP) intervention area. The Literacy Boost program includes teacher training,
community reading activities, and age-appropriate local language material creation to support emergent
literacy skills among early-grade children. These skills include letter awareness, single word reading of
common words, decoding of simple words, reading fluency, reading accuracy, and listening/reading
comprehension. As part of Literacy Boost, learners are periodically assessed in each of these skills
through an adaptable assessment tool to inform programming and estimate program impact. The data
gathered from these schools is analyzed to present a snapshot of the emergent literacy skills of grade 2
learners in these schools and to inform the adaptation of Save the Children’s Literacy Boost program to
this context.
The key research questions to be explored in this report include:
How comparable are learners in Literacy Boost schools versus comparison schools in terms of
reading skills, background characteristics, home literacy environment?
What can the baseline tell us about learners’ emergent reading skills? What does this mean for
Literacy Boost programming?
How do learners’ reading skills vary by student background, and home literacy environment?
What does this mean for targeting Literacy Boost’s two strands of intervention?
To investigate these questions, this report will first describe the research methods used; including
sampling, measurement, and analysis. Next, in order to see if groups are statistically similar, the
comparability of Literacy Boost and comparison schools will be examined through clustered t-tests. The
comparability of Literacy Boost and comparison learners’ scores for each of the emergent literacy skills,
exploring learners’ strengths and weaknesses in each skill will also be examined. The report will then
examine what are the literacy skills that are already present in the sample, and what areas should
Literacy Boost focus on. The report will then investigate student backgrounds examined through
clustered t-tests. Finally, the report will investigate any correlations with student background, school
environment, or home literacy practices and environment variables using multilevel regression analysis.
II. Methods
Sampling
The sample for this baseline assessment encompasses 714 grade 2 learners, divided between 23 schools
set to receive the Literacy Boost intervention (494 learners) and 17 comparison schools (290 learners).
Schools were selected based on multiple characteristics (e.g., population served, school size, distance
from urban areas, access to early childhood programs, etc.). As seen in Table 1, the schools are located
in two different provinces in Lao.

6
Table 1. Sample schools, by province
Attapeu Bolikhamxay
Comparison school 7 10
Literacy Boost school 8 15
At each of the Literacy Boost and comparison schools where data was collected, 20 children in grade 2
were targeted for sampling. If there was more than one section of grade 2 at a given school, one section
was randomly selected. Ten boys and ten girls were randomly and voluntarily selected where there were
more than 20 learners in the classroom. In schools with less than 20 children in grade 2, all of the
children who consented to participating were surveyed. As a result, the sample consists of 355 boys and
359 girls, and the Literacy Boost sample is 49.7 percent male and the comparison sample is 50.3 percent
female.
Measurement
School profile data were collected via direct observation and a survey of school head teachers or
principals at every school in the sample. This data includes information on enrolment and class size,
availability of textbooks, school facilities and construction, and teacher backgrounds. For the student
assessment, all learners in the sample were asked about their background characteristics (age,
household possessions, household building materials, etc.). Learners were also asked about their family
members and reading habits in their home (who they had seen reading in the week prior to the
assessment, who had read to them, etc.). Table 2 describes the information collected from students
during the baseline assessment in October 2013.
Table 2: Literacy Boost Assessment Instruments
Student background Examples
General Sex, age, language spoken at home, work/chores
School-related Attendance, repetition history
Socioeconomic status Type of home, household size, household amenities/possessions
Health Sickness, breakfast, vision, hearing
Home Literacy Environment
Access to print Materials present in home, types of materials
Reading activities at home Presence and percentage of family members who children see read, and who engage in literacy activities with children
Reading Outcome Description
Alphabet knowledge Number of letters/sounds known of 33
Single word reading Number of single words read correctly of 20
Decoding skills Number of constructed words read correctly of 20
Fluency Number of words in a short story read correctly in a minute
Accuracy Percentage of words in a short story read correctly
Comprehension Questions related to short story read aloud by student or assessor

7
After collecting background information, all learners were also given an emergent literacy test
composed of six components administered through five sub-tests: letter awareness, single word
recognition (reading of most used words), decoding of nonsense words, reading fluency and accuracy
(words per minute read correctly and total percentage of passage read correctly; both within the same
sub-test), and a set of comprehension questions linked to the fluency and accuracy passage. The same
set of comprehension questions were administered for both those learners who could read
independently (reading comprehension) and those who could not and thus had the assessor read to
them (listening comprehension). Details on inter-rater reliability are provided in Appendix A.
Analysis
To test the comparability of learners in the Literacy Boost and comparison samples, this report will use
comparison of means through t-tests, with clustered standard errors to account for the grouping of
student-level data within schools. Summary statistics, accompanied by clustered t-tests, will be used to
analyze learners’ performance in each of the reading sub-tests. Finally, this report will look to
multivariate regression models to explore relationships between literacy skills and student background
characteristics, school environment, and home literacy environment.
Note about benchmarks
While Save the Children has implemented the Literacy Boost approach to reading assessment and
intervention in Afghanistan, Bangladesh, Burundi, El Salvador, Ethiopia, Guatemala, Indonesia, Kenya,
Malawi, Mali, Mozambique, Pakistan, Peru, the Philippines, Rwanda, South Africa, Sri Lanka, Uganda,
Zimbabwe, comparison across countries and languages is less helpful than more detailed contextual
information for setting expectations of impact. For each measure used in these assessments, the upper
end of the range of scores can be used to consider what is currently possible among these children.
III. Children’s Background Important differences exist between children in Attapeu (ATP) and Bolikhamxay (BOL) provinces, and
therefore students’ literacy skills will be discussed separately. Most notably, children in Bolikhamxay are
more likely to identify as being Hmong whereas children in Attapeu identify as Khmer (see Figure 1 & 2).
In fact, Hmong people do not live in Attapeu so the identification of children as Hmong in this province
was likely due to child or assessor error. Lao-Thai, Hmong and Khmer are the three major ethnic groups
in Lao and are associated with speaking the Lao, Hmong or Khmer languages at home, respectively.
Given that Lao is the language of instruction in schools, the Hmong and Khmer-speaking children are
learning to read in a second language. Within each province, there was no statistically significant
difference in the ethnic make-up of the comparison samples versus the Literacy Boost samples.

8
Further, as seen in Table 3, children in Attapeu tend to be older and are more likely to have repeated a
grade than children in Bolikhamxay. Whereas children in Bolikhamxay reported attending school more
regularly, feeling ill less frequently, and eating breakfast more often than children in Attapeu. Finally,
students in Attapeu tended to have higher emergent literacy skills than children in Bolikhamxay,
specifically in the areas of common word knowledge and listening comprehension.
Students in Bolikhamxay and Attapeu were comparable on indexes of socioeconomic status (SES Index),
home literacy environment (HLE), and chore/work responsibilities (Chore-work Index). The SES index
was created by combining information about the type of house a child lives in as well as possessions
owned by their family (e.g., radio, electricity, refrigerator, bicycle, latrine, mobile phone, television,
motorbike, car, tractor). The HLE index is a combination of information about the types of reading
materials students have access to outside of school and the literacy activities their family engages in.
The chore-work index is a creating by combining the amount of time children spend on chores within
their homes or work outside their homes.
Student background in Attapeu
As seen in Table 4, control and intervention students in Attapeu were found to be comparable on all
background characteristics, except their average SES quintile in SES Index. On average, grade students in
Attapeu were 8.5 years old, 39 percent had attended early childhood development programs, 53
percent had repeated grade 1 and 28 percent had repeated grade 2. Children reported attending school
4.3 out of 5 days per week and the majority of children reported having breakfast every day before
going to school. Finally, comparison and intervention students in Attapeu were also comparable on
indexes of home literacy environment and chore/work responsibilities.
Hmong 2%
Khmer 51%
Lao/Thai 38%
Other 9%
Figure 1. Student Ethnicity, Attapeu
Hmong 46%
Khmer 3%
Lao/Thai 48%
Other 3%
Figure 2. Student Ethnicity, Bolikhamxay
9
Student background in Bolikhamxay
Control and intervention students in Bolikhamxay were found to be comparable on all background
characteristics (see Table 5). On average, 38 percent of children had attended early childhood
development programs, 30 percent had repeated grade 1 and 13 percent had repeated grade 2.
Children reported attending school 4.5 out of 5 days per week and the majority of children reported
having breakfast every day before going to school. Finally, comparison and intervention students in
Bolikhamxay were also comparable on indexes of socioeconomic status, home literacy environment, and
chore/work responsibilities.
Gender Differences in both provinces
Overall, boys and girls in this sample are very similar on measurable background characteristics that
were captured by the assessment. In fact, no statistically significant differences were found between
boys and girls in either Attapeu or Bolikhamxay. See Appendix B for full details.
IV. Children’s Reading Skills
Letter Identification A chart of 33 letters was shown to children and they were asked to name each letter or pronounce the letter sound. On average, Literacy Boost and comparison learners in Attapeu correctly identified 54 percent of all letters presented (18 letters), and students in Bolikhamxay correctly identified 42 percent (13 letters) of all letters presented. The most difficult letters were combination letters that indicate tonal changes. These combinations are taught after the most basic consonants and vowels, and are foundational learning to read words correctly. There were no significant differences between the skills of Literacy Boost and comparison students in either province.
Single Word Reading: Most Used Words
The single word reading or most used words (MUW) sub-test consists of a chart of 20 words that each student is asked to read. Words are typically identified as ‘most used’ by tabulating the number of times they appear in learners’ language textbooks. However, in this case the team was able to build on work already completed for the EGRA launched in Lao earlier in 2013, and 20 words from the 50-word EGRA list were chosen. On average, learners in Literacy Boost and comparison schools in Attapeu were able to read 4 common words and there were no statistically significant differences between these groups of students. Learners in Literacy Boost and comparison schools in Bolikhamxay were able to read an average of 2 common words correctly and there were no statistically significant differences between the two groups of students.
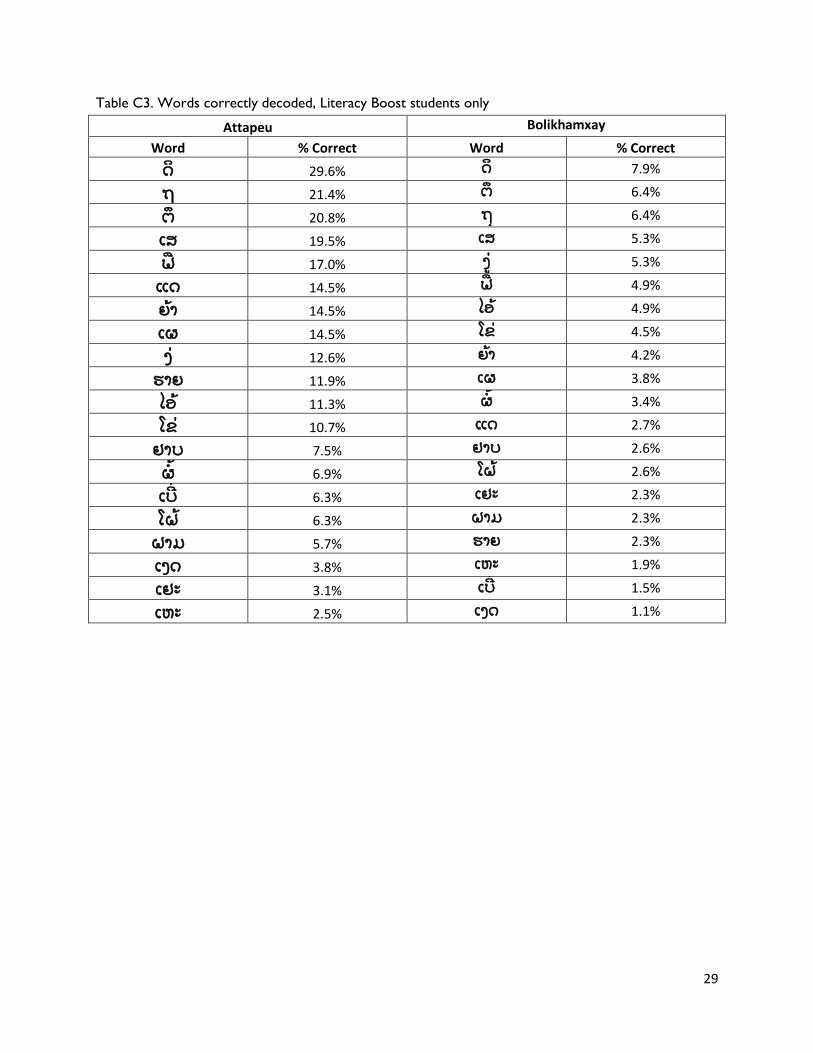
Decoding Words The decoding word sub-test consists of a chart of 20 nonsense words that a student is asked to read to the best of their ability. Nonsense words, also called pseudo-words, are created by analyzing common spelling patterns in the language and then, following those patterns, new words that don’t actually mean anything in that language are created using predictable orthographical patterns. They serve to test whether the child can read new words that he/she has never encountered before. The 20 nonsense

10
words in this assessment were also taken from the 50 nonsense words chosen for the decoding portion of the 2013 EGRA assessment launched in Lao. On average, children in Attapeu were able to decode two words and learners in Literacy Boost and comparison schools in Bolikhamxay were able to decode one word. There were no statistically significant differences between intervention and control groups in either province.
Fluency and Accuracy
Fluency (words per minute read correctly) and accuracy (percent of the passage read correctly) are presented together here because they are measured together in a single sub-test in which learners are asked to read a passage aloud. The number of words students read correctly in one minute is tracked for fluency. As the student continues to read after the first minute, the total number of words read correctly from the passage as a whole, no matter how long it takes the student, is computed for accuracy. Nine percent of children in Attapeu and four percent in Bolikhamxay were able to read the passage independently. There were no differences between the proportions of intervention and comparison students identified as independent readers in either province. However, due to the small percentage of children able to read the story, there is not enough variation to investigate differences between the fluency and accuracy of intervention and comparison students at this time.
Comprehension
For the final sub-test, learners were asked a series of eight comprehension questions related to the reading passage presented in the fluency and accuracy sub-test. For those learners who were unable to read five words of the passage within 30 seconds, the assessor read the passage to the student before asking the comprehension questions. As mentioned previously, very few children were able to read the passage to themself so most were tested for listening comprehension. In general, Literacy Boost and comparison students in Bolikhamxay answered one listening comprehension question correctly, compared to 3 questions answered correctly in Attapeu. There were no statistically significant differences between the scores of Literacy Boost students and comparison students in either province. The Literacy Boost program classifies students into Emergent, Beginning, and Reading with Comprehension tiers based on their fluency, accuracy and comprehension skills. In this sample, we see that 95 and 96 percent of Literacy Boost students are classified as being non-readers in Attapeu and Bolikhamxay, respectively (Figure 3 & 4). This indicates that reading and comprehension skills are quite low. There were no statistical differences in the scores of Literacy Boost students and comparison students or between students in either province.

11
Note: Emergent Readers correctly answers less than 40-50 percent of the comprehension questions; Beginning readers correctly answers between 40-50 and 75-80 percent of the questions correctly; Readers with Comprehension correctly answers more that 75-80 percent of the comprehension questions. Tier cut-offs were set in combination with associated fluency and accuracy levels in each language and country, vary based on the number of comprehension questions asked.
V. Children’s Home Literacy Environment
Differences in the Home Literacy Environment
An important aspect of reading development concerns children’s home literacy environment (HLE).
How are children exposed to the printed word in their homes? How much access do they have to books
and print to practice their nascent reading skills? Many Literacy Boost activities are centered on helping
parents and communities to enhance their HLE. As such, it is important to measure where learners'
HLEs begin, and how they change over time.
95% 1% 4% Baseline
Figure 3. 2013 Baseline Reading with Comprehension Tiers, Attapeu
Emergent Beginning Reading with Comprehension
96% 2% 2% Baseline
Figure 4. 2013 Baseline Reading with Comprehension Tiers, Bolikhamxay
Emergent Beginning Reading with Comprehension

12
The HLE is not only about materials in the home, but also how those materials are used to engage the
child in reading and learning. Hess and Holloway (1984) identified five dimensions of the home literacy
environment that are theoretically related to reading achievement in children. The first is value placed
on literacy, which we operationalize by asking the learners whether they see anyone reading at home.
The second is press for achievement, which we operationalize as individuals telling or helping the
student to study. The third is the availability and use of reading materials, which we operationalize as
the amount of printed materials at home. The fourth dimension is reading with children, which we
operationalize by asking the learners whether anyone reads to them at home. The last is opportunities
for verbal interaction, which we operationalize as family members telling stories to learners. There were
no significant differences between children’s HLE in Attapeu and Bolikhamxay so averages are presented
together in Table 6.
Table 6. Home literacy environment, by group
Average Comparison Literacy Boost Significant Difference
Textbook 85.2% 86.8% 84.1% Magazine 7.1% 4.9% 8.6% Newspaper 10.0% 8.7% 10.9% Story book 21.4% 21.5% 21.4% Coloring book 47.0% 51.7% 43.7% # reading materials types 1.7 1.7 1.7 Someone at home seen reading 86.7% 87.9% 85.8% Someone at home helping child study 90.2% 91.4% 89.4% Someone at home reading to child 80.4% 85.2% 77.1% Someone at home telling stories to child 62.9% 65.2% 61.3% Lend books with family/community 40.9% 43.6% 39.0% Read books with family/community 52.1% 55.2% 50.0%
Nearly all learners have some type of reading materials at home. In both provinces, the most common
reading resource in students’ homes is a textbook, and the least common is a magazine. In terms of
child-friendly reading materials, 21 percent of learners report having storybooks at home and 47
percent have a story book at home. No statistically significant differences exist between Literacy Boost
and comparison children in either province.
Over 85 percent of learners in both provinces come from a home that has at least one person who
actively reads. In addition, almost 90 percent of children have someone at home who tells or helps them
study and more than half of students have someone at home who reads to them or tells them stories.
Relatively lower levels of community reading activities were reported but half of children reported
reading with someone in their family or community. No significant differences exist between Literacy
Boost and comparison schools in Attapeu or Bolikhamxay.
13
Gender Differences
No differences exist between the reading materials or home literacy activities available to boys and girls
in either province.
VI. Literacy Boost Site profiles: Skills and Home Literacy Environment
This section summarizes reading skills and home literacy environments across Literacy Boost schools. It
includes a chart summarizing letter identification, single word reading, fluency, accuracy, and
comprehension scores as well as a chart summarizing students’ home literacy environments. Figure 5
displays Literacy Boost students’ average scores on all literacy sub-skill assessments, with the white
segments on top of the red baseline averages representing the benchmarks against which to measure
Literacy Boost students’ skill growth at the end-line assessment. Students from Attapeu and
Bolikhamxay are both included in this figure. While there are differences between these two groups of
students the overall skill profile is similar and we would hope that with similar levels of implementation,
children in different areas could reach the same literacy levels. Endline benchmarks indicate suggested
goals for skill gains in each area. Due to the low skill level in this sample, we propose two benchmarks –
one for all children (including nonreaders) as well as a benchmark for the small sample of children who
could read independently at baseline. Finally, Figure 6 displays students’ average home literacy
environment.

14
45%
12% 7% 1 4% 5% 20%
65%
35%
68% 73%
14
71%
45% 30%
20%
Figure 5. Literacy Skill Profile with Endline Benchmarks, Literacy Boost
Baseline Gain
55%
21% 12% 3 5% 6% 5%
76%
25%
59% 68%
13
70% 44% 45%
9%
Figure 5a. Literacy Skill Profile with Endline Benchmarks, Literacy Boost Attapeu
Baseline Gain

15
40%
7% 4% 1 3% 4% 2%
54%
40%
73% 76%
14
72%
46% 48%
31%
0%
20%
40%
60%
80%
100%
Figure 5b. Literacy Skill Profile with Endline Benchmarks, Literacy Boost Bolikhamxay
Baseline Gain

16
21%
44%
86% 77%
89%
61%
0%
20%
40%
60%
80%
100%
Story book athome
Coloring book athome
Someone athome seen
reading
Someone athome reading to
child
Someone athome helping
child study
Someone athome telling
stories to child
Figure 6. HLE Profile, Literacy Boost
22%
35%
87% 93%
83%
69%
0%
20%
40%
60%
80%
100%
Story book athome
Coloring book athome
Someone athome seen
reading
Someone athome helping
child study
Someone athome reading to
child
Someone athome telling
stories to child
Figure 6a. HLE Profile, Literacy Boost Attapeu
21%
49%
85% 88%
74%
57%
0%
20%
40%
60%
80%
100%
Story book athome
Coloring book athome
Someone athome seen
reading
Someone athome helping
child study
Someone athome reading to
child
Someone athome telling
stories to child
Figure 6b. HLE Profile, Literacy Boost Bolikhamxay

17
The average literacy skills and home literacy environments seen in Figures 5 and 6 will be used to help decide on appropriate benchmarks for Literacy Boost students at the end-line assessment. The following is an outline of the skill goals we have for students as well as in-school and out-of-school activities associated with improving these skills.
1. Letter identification – Endline benchmark: 80 percent
a. Given that combination letters and were the most difficult for students to identify and
are also foundational to word reading, the teacher training activities should encourage
teachers to focus on daily activities that emphasize these letters.
2. Single Word Reading (MUW) – Endline benchmark: 80 percent
a. Single word reading should be a strong focus of in and out of school programming,
especially as children gain more comfort with letter identification. Most children report
having textbooks at home which contain exactly the grade level words that students
should be gaining familiarity with and can be used as a resource here.
3. Decoding – Endline benchmark: 80 percent
a. Decoding is a foundational skill related to the ability to read fluently and this skill can be
practiced in school with teachers and also at reading camps. In addition, children can
practice this skill by reading aloud or silently.
4. Student is a reader – Endline benchmark: 50%
a. A primary goal for this group of students is to increase the number of independent
readers. Teachers and community leaders should work with children on the letter, word,
and decoding skills needed to begin reading on their own. Practice reading aloud in
small groups in classrooms or in reading camps, with supervision if possible, can be
helpful.
5. Fluency & Accuracy – Endline benchmark: 15 words per minute & 75 percent correct
a. Given that a major goal is for more children to become independent readers, only
modest fluency gains are expected because more children will be beginning to read at a
basic level. Teachers and community leaders should work with children on the letter,
word, and decode skills needed to begin reading with fluency.
6. Reading Comprehension (all) – Endline benchmark: 50 percent
a. Given the baseline scores and existing second language learning issues listening
comprehension is an important skill to focus on for the children in this sample.
Improving students’ oral language stills is crucial to their success in school and can be
practiced both in class and at home.
7. Reading Comprehension (readers) – Endline benchmark: 85%
a. For those students who can read on their own, it is recommend that teachers and
program staff work with them independently so that they can continue to improve their
comprehension skills and not become bored with reading. In addition, if possible, they
can be used to help other students who are struggling to read.
Figure 6 displays that students’ home literacy environment are generally strong with reading materials
and literacy activities occurring in most homes. However, almost 80 percent of students do not have
story books at home so Book Banks have the opportunity to encourage more child-friendly books in the

18
home. In addition, efforts should be made to reach those students who do not have family members
reading to them or telling them stories as they are the vulnerable to falling behind their peers living in
stronger home literacy environments.
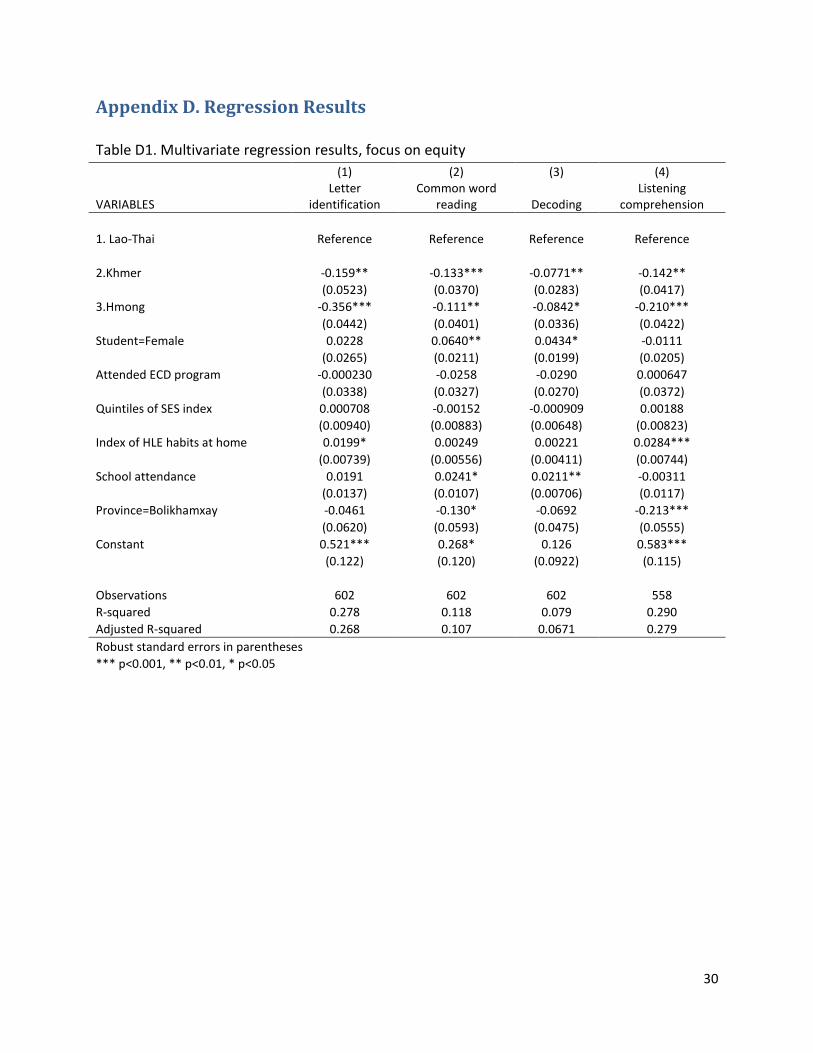
VII. Relationships between Skills and Home Literacy Environment
This final section explores the results of a series of multivariate regressions, accounting for clustering of
students within schools. To arrive at the most relevant regression model, the significance of student
background and home literacy environment variables were tested in both univariate and combined
multivariate models, using reading skill sub-tests as the dependent variables. Variables associated with
equity were areas of specific focus. In addition, children from Attapeu and Bolikhamxay were analyzed
together with province used as a control variable in order to increase the power of the analysis and
create an overall picture of factors driving early literacy development in Lao. Appendix D presents the
results of the final multivariate models for each literacy sub-test. It should be noted that these
relationships are correlations, and do not imply that causation. To establish causation requires a more
rigorous research design with a much larger sample.
Student Background
Overall analyses show consistent relationships between student characteristics and reading skills. First,
as discussed earlier, the results find that children in Bolikhamxay have lower literacy skills than children
in Attapeu. However, the most notable and consistent result was that students from the Hmong and
Khmer ethnic groups scored statistically significantly lower in all areas assessed when compared to
students from a Lao-Thai background (Figure 7).
Note: Lao-Thai children significantly outperform Hmong and Khmer children on all sub-tests (p<.05).
26%
8% 4%
12%
46%
6% 5%
19%
62%
19% 12%
33%
0%
10%
20%
30%
40%
50%
60%
70%
80%
90%
100%
Letter identification Common word reading Decoding Listening comprehension
Figure 7. Relationship of ethnicity with emergent literacy skills
Hmong Khmer Lao-Thai

19
In addition to these results we see that girls have stronger emergent skills than boys in common word
knowledge and decoding, and students who report attending school more often tend to have stronger
skills in the same areas (Figure 8 & 9). Finally, in some Literacy Boost samples analyses find that children
who attended an early childhood education program or those who have families with greater relative
wealth (measured by SES Index) have stronger literacy skills at baseline compared to children who did
not attend an ECD program or who come from poorer families. However, we do not see any significant
connections between participation in an early childhood program or SES Index with baseline skills.
Note: All differences in relationships shown are statistically significant (p<.05).
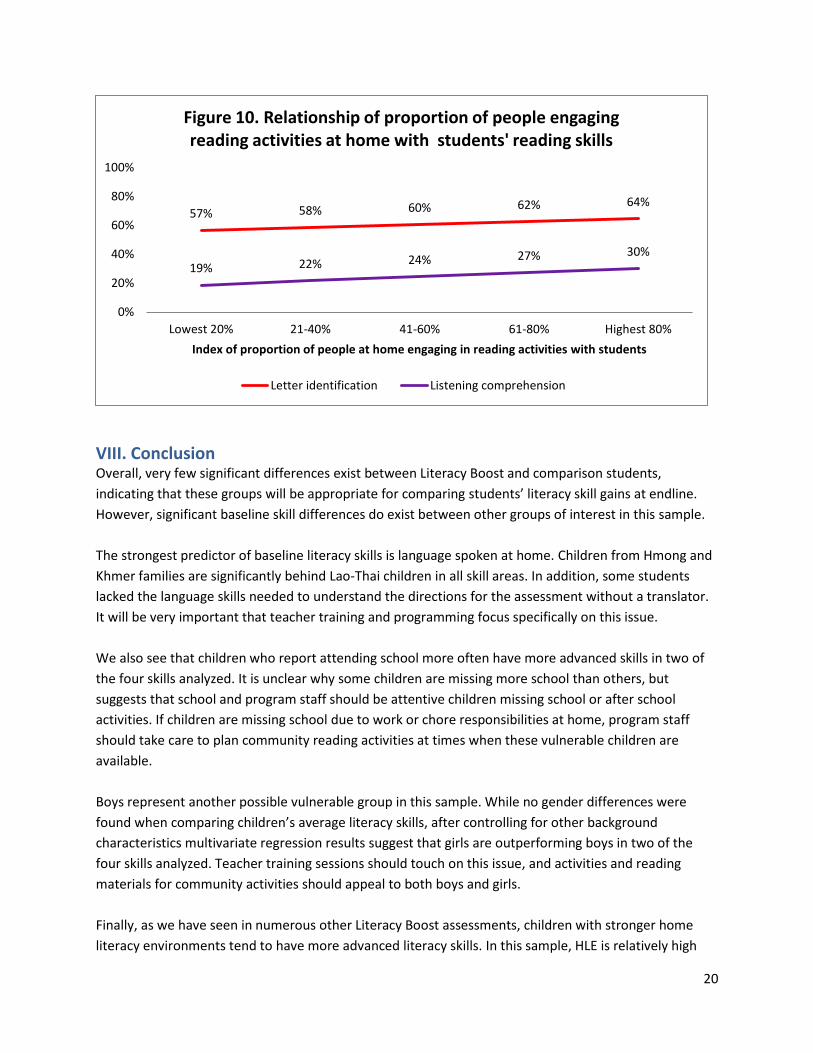
Home Literacy Environment Similar to trends seen in other Literacy Boost countries, strong home literacy environments are found to
be positively related to early literacy skills. Specifically, having more people at home participating in
home literacy activities (e.g., reading to children or telling stories) was related to increased letter
knowledge and listening comprehension (Figure 10).
16% 10%
23%
15%
0%
10%
20%
30%
40%
50%
Common wordreading
Decoding
Figure 8. Relationship of gender with reading skills
Boys Girls
11% 14%
16% 18%
21%
5% 7% 9% 12% 14%
0%
10%
20%
30%
40%
50%
1 2 3 4 5
Days in school last week
Figure 9. Relationship of school attendance with reading skills
Common word reading Decoding
20
VIII. Conclusion Overall, very few significant differences exist between Literacy Boost and comparison students,
indicating that these groups will be appropriate for comparing students’ literacy skill gains at endline.
However, significant baseline skill differences do exist between other groups of interest in this sample.
The strongest predictor of baseline literacy skills is language spoken at home. Children from Hmong and
Khmer families are significantly behind Lao-Thai children in all skill areas. In addition, some students
lacked the language skills needed to understand the directions for the assessment without a translator.
It will be very important that teacher training and programming focus specifically on this issue.
We also see that children who report attending school more often have more advanced skills in two of
the four skills analyzed. It is unclear why some children are missing more school than others, but
suggests that school and program staff should be attentive children missing school or after school
activities. If children are missing school due to work or chore responsibilities at home, program staff
should take care to plan community reading activities at times when these vulnerable children are
available.
Boys represent another possible vulnerable group in this sample. While no gender differences were
found when comparing children’s average literacy skills, after controlling for other background
characteristics multivariate regression results suggest that girls are outperforming boys in two of the
four skills analyzed. Teacher training sessions should touch on this issue, and activities and reading
materials for community activities should appeal to both boys and girls.
Finally, as we have seen in numerous other Literacy Boost assessments, children with stronger home
literacy environments tend to have more advanced literacy skills. In this sample, HLE is relatively high
57% 58% 60% 62% 64%
19% 22% 24% 27% 30%
0%
20%
40%
60%
80%
100%
Lowest 20% 21-40% 41-60% 61-80% Highest 80%
Index of proportion of people at home engaging in reading activities with students
Figure 10. Relationship of proportion of people engaging reading activities at home with students' reading skills
Letter identification Listening comprehension

21
with 87 percent of children report having some kind of reading material at home, and 86 percent having
someone at home who reads. However, the majority of books that children have at home are textbooks
and only 21 percent of students have access to a storybook at home. In general, students are
experiencing some type of literacy activities at home and more family members’ engaging in these
activities is related to stronger early reading skills. If more child-friendly reading materials can be
brought into the home, these activities could be made even more engaging and meaningful.

22
Appendix A: Inter-rater reliability To test inter-rater reliability, about 6 percent of learners (43 out of 714) were assessed by two enumerators simultaneously. Long one-way ANOVA techniques were used to calculate the intra-class correlation within pairs of assessors for a measure of reliability. Using Fleiss’ benchmarks for excellent (ICC>0.75), good or fair (0.75>=ICCA>0.4), and poor (0.4>=ICC) we find that all of the literacy outcome variables exhibited excellent inter-rater reliability. Table A1 shows the percent of agreement between the raters.
Table A1. Inter-rater Reliability
Literacy Skill Sub-Test Inter-rater Reliability Rating
Letter Knowledge .958 Excellent
Most Used Words .994 Excellent
Decoding Words .973 Excellent
Fluency .999 Excellent
Accuracy .776 Excellent
Comprehension .994 Excellent
Inter-rater reliability was excellent on all measures except accuracy. It should be noted that while the IRR for fluency and accuracy is in the acceptable range, there were very few students who were able to read independently so there was an extremely small sample of readers with which to establish this reliability. Overall, inter-rater reliability was very high and therefore we can be confident that the internal validity of the scores is good.

23
Appendix B. Additional Descriptive Statistics
Table B1. Student Background Information in Attapeu, by Intervention Group
Comparison (N=126)
Literacy Boost (N=159)
Significant Difference
Female 48.4% 51.6% Age 8.49 8.54 Attended ECD 37.8% 39.0% Repeated Grade 1 54.7% 51.6% Repeated Grade 2 29.1% 27.7% Lao-Thai ethnicity 43.0% 34.8% Khmer ethnicity 52.3% 49.4% Hmong ethnicity 0.0% 3.2% Other ethnicity 4.6% 12.6% Days per week attending school 4.4 4.2 Frequency of illness (Never=0, a few times=1,
sometimes=2, many times=3) 1 1 Eats breakfast (Never=0, sometimes=1, always=2) 1.7 1.7 Has trouble seeing in class 3.9% 10.7% Has trouble hearing in class 8.7% 21.4% # of people at home 4.3 4.1 Average SES Index 2.7 2.4 Average HLE Index 3.1 2.5 *
Average Chore-work Index 3.0 2.6 Someone at home seen reading 89.1% 86.8% Someone at home helping child study 93.0% 92.5% Someone at home reading to child 89.1% 83.0% Someone at home telling stories to child 68.8% 69.2% # types of reading materials at home 1.6 1.5 *p<.05, **p<.01, ***p<.001

24
Table B2. Student Background Information in Bolikhamxay, by Intervention Group
Comparison
(N=162) Literacy Boost
(N=265) Significant difference
Female 50.0% 50.6% Age 7.4 7.8 Attended ECD 41.6% 35.2% Repeated Grade 1 24.2% 33.8% Repeated Grade 2 10.6% 14.1% Lao/Thai ethnicity 46.5% 49.0% Khmer ethnicity 1.3% 3.5% Hmong ethnicity 49.7% 44.9% Other ethnicity 2.5% 3.5% Days per week attending school 4.5 4.5 Frequency of illness (Never=0, a few times=1,
sometimes=2, many times=3) 0.6 0.7 Eats breakfast (Never=0, sometimes=1, always=2) 1.9 1.9 Has trouble seeing in class 8.7% 7.2% Has trouble hearing in class 10.6% 7.2% # of people at home 4.6 4.6 Average SES Index 2.9 2.7 Average HLE Index 3.2 2.9 Average Chore-work Index 3.2 3.0 Someone at home seen reading 87.0% 85.3% Someone at home helping child study 90.1% 87.5% Someone at home reading to child 82.1% 73.6% Someone at home telling stories to child 62.3% 56.6% # types of reading materials at home 1.8 1.8 *p<.05, **p<.01, ***p<.001
25
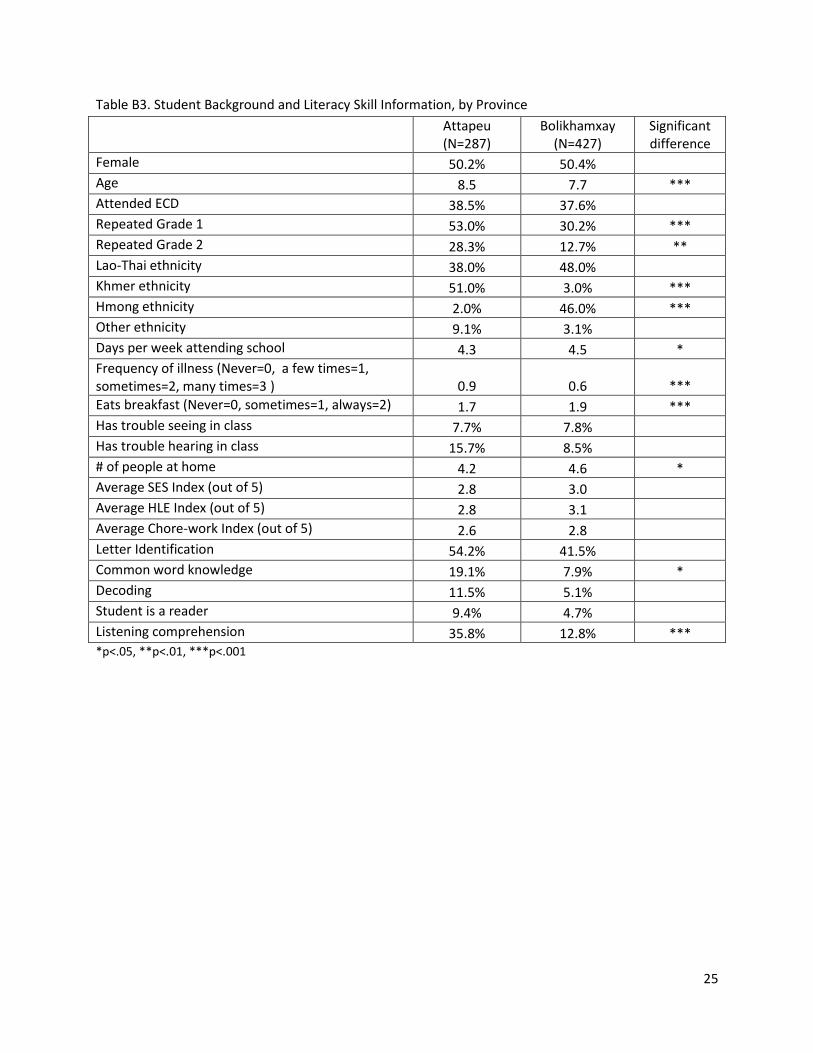
Table B3. Student Background and Literacy Skill Information, by Province
Attapeu (N=287)
Bolikhamxay (N=427)
Significant difference
Female 50.2% 50.4% Age 8.5 7.7 ***
Attended ECD 38.5% 37.6% Repeated Grade 1 53.0% 30.2% ***
Repeated Grade 2 28.3% 12.7% **
Lao-Thai ethnicity 38.0% 48.0% Khmer ethnicity 51.0% 3.0% ***
Hmong ethnicity 2.0% 46.0% ***
Other ethnicity 9.1% 3.1% Days per week attending school 4.3 4.5 *
Frequency of illness (Never=0, a few times=1, sometimes=2, many times=3 ) 0.9 0.6 ***
Eats breakfast (Never=0, sometimes=1, always=2) 1.7 1.9 ***
Has trouble seeing in class 7.7% 7.8% Has trouble hearing in class 15.7% 8.5% # of people at home 4.2 4.6 *
Average SES Index (out of 5) 2.8 3.0 Average HLE Index (out of 5) 2.8 3.1 Average Chore-work Index (out of 5) 2.6 2.8 Letter Identification 54.2% 41.5% Common word knowledge 19.1% 7.9% *
Decoding 11.5% 5.1% Student is a reader 9.4% 4.7% Listening comprehension 35.8% 12.8% ***
*p<.05, **p<.01, ***p<.001

26
Table B4. Student Background Information, by Sex and Province
Attapeu Bolikhamxay
Boys (N=143)
Girls (N=144)
Significant difference
Boys (N=212)
Girls (N=215)
Significant difference
Age 8.6 8.4
7.756 7.546 Attended ECD 37.1% 39.9%
36.5% 38.8%
Repeated Grade 1 51.7% 54.2%
31.8% 28.6% Repeated Grade 2 34.5% 22.2%
13.3% 12.1%
Lao-Thai ethnicity 38.0% 38.9%
46.4% 49.8% Khmer ethnicity 50.7% 50.7%
2.4% 2.8%
Hmong ethnicity 2.8% 0.0%
48.8% 43.6% Other ethnicity 4.5% 9.7%
2.4% 3.8%
Days per week attending school 4.2 4.3
4.5 4.6 Frequency of illness (Never=0, a
few times=1, sometimes=2, many times=3) 1.0 0.9
0.6 0.7
Eats breakfast (Never=0, sometimes=1, always=2) 1.7 1.7
1.9 2.0
Has trouble seeing in class 6.3% 9.0%
8.1% 7.5% Has trouble hearing in class 15.4% 16.1%
7.6% 9.3%
# of people at home 4.3 4.1
4.5 4.7 Average SES Index 2.8 2.7
3.0 3.0
Average HLE Index 2.7 2.8
2.9 3.2 Average Chore-work Index 2.7 2.5
2.6 3.0
*p<.05, **p<.01, ***p<.001

27
Appendix C. Individual Item Scores
Table C1. Letter identification scores, Literacy Boost students only
Attapeu Bolikhamxay
Letter % Correct Letter % Correct
ກ 82.4% ກ 60.2%
ປ 81.1% ຈ 58.9%
ອ 79.9% ດ 56.8%
ນ 78.6% ຊ 56.2%
ຈ 78.0% ປ 56.1%
ດ 78.0% ອ 55.8%
ມ 75.5% ນ 55.5%
ຕ 73.6% ມ 52.7%
ງ 71.1% ງ 51.7%
ສ 70.4% ສ 51.3%
ວ 69.2% ຂ 51.1%
ຊ 68.6% ຮ 50.6%
ທ 68.6% ຕ 50.4%
ລ 67.9% ວ 50.2%
ບ 67.3% ບ 49.8%
ຍ 66.7% ລ 49.1%
ຂ 65.4% ທ 47.2%
ຄ 65.4% ຖ 45.3%
ຖ 62.3% ຄ 45.3%
ຢ 57.9% ຫ 44.9%
ຮ 55.3% ຍ 42.6%
ພ 54.7% ພ 38.1%
ຫ 50.3% ຜ 38.1%
ຝ 47.2% ຢ 36.6%
ຜ 42.8% ຟ 34.7%
ຟ 40.3% ຝ 31.1%
ຮ 27.7% ຮ 26.0%
ໝ 13.8% ໝ 9.8%
ຫຍ 11.3% ຫຼ 4.9%
ໜ 9.4% ໜ 4.9%
ຫວ 8.8% ຫຍ 3.0%
ຫຼ 8.8% ຫວ 1.9%
ຫງ 6.9% ຫງ 1.1%

28
Table C2. Common word reading, Literacy Boost students only
Attapeu Bolikhamxay
Word % Correct Word % Correct
ດີ 40.3% ດີ 16.7%
ມາ 39.6% ໄປ 14.0%
ໄປ 37.7% ແມ່ 12.1%
ອາ 34.6% ອາ 11.7%
ໄກ່ 34.6% ມາ 10.9%
ແມ່ 32.7% ໄກ່ 9.8%
ທຸງ 20.8% ຂ້ອຍ 6.0%
ຂ້ອຍ 17.0% ທຸງ 5.3%
ເສ ້ ອ 16.4% ຝົນຕົກ 5.3%
ໂສ້ງ 16.4% ໂສ້ງ 4.9%
ຝົນຕົກ 15.7% ເອ້ 4.5%
ງາມ 15.1% ຕ ່ ງ 4.5%
ຍ່າງ 15.1% ຍ່າງ 4.2%
ຕ ່ ງ 14.5% ເອ ້ ອຍ 4.2%
ລ້າງມ 13.8% ລ້າງມ 4.2%
ເອ ້ ອຍ 12.6% ດ ງ 3.8%
ດ ງ 10.1% ງາມ 3.8%
ເອ້ 9.4% ອ້າຍ 3.8%
ອ້າຍ 9.4% ໝ ່ ເພ ່ ອນ 3.4%
ໝ ່ ເພ ່ ອນ 8.8% ເສ ້ ອ 3.4%
29
Table C3. Words correctly decoded, Literacy Boost students only
Attapeu Bolikhamxay
Word % Correct Word % Correct
ດິ 29.6% ດິ 7.9%
ຖຸ 21.4% ຕຶ 6.4%
ຕຶ 20.8% ຖຸ 6.4%
ເສ 19.5% ເສ 5.3%
ຟ 17.0% ງ ່ 5.3%
ແດ 14.5% ຟ 4.9%
ຍ້າ 14.5% ໄອ້ 4.9%
ເຜ 14.5% ໂຂ່ 4.5%
ງ ່ 12.6% ຍ້າ 4.2%
ຮາຍ 11.9% ເຜ 3.8%
ໄອ້ 11.3% ຜ ້ 3.4%
ໂຂ່ 10.7% ແດ 2.7%
ຢາບ 7.5% ຢາບ 2.6%
ຜ ້ 6.9% ໂຝ້ 2.6%
ເບີ່ 6.3% ເຢະ 2.3%
ໂຝ້ 6.3% ຝາມ 2.3%
ຝາມ 5.7% ຮາຍ 2.3%
ເງດ 3.8% ເຫະ 1.9%
ເຢະ 3.1% ເບີ່ 1.5%
ເຫະ 2.5% ເງດ 1.1%
30
Appendix D. Regression Results
Table D1. Multivariate regression results, focus on equity
(1) (2) (3) (4)
VARIABLES Letter
identification Common word
reading Decoding Listening
comprehension
1. Lao-Thai Reference Reference Reference Reference
2.Khmer -0.159** -0.133*** -0.0771** -0.142**
(0.0523) (0.0370) (0.0283) (0.0417)
3.Hmong -0.356*** -0.111** -0.0842* -0.210***
(0.0442) (0.0401) (0.0336) (0.0422)
Student=Female 0.0228 0.0640** 0.0434* -0.0111
(0.0265) (0.0211) (0.0199) (0.0205)
Attended ECD program -0.000230 -0.0258 -0.0290 0.000647
(0.0338) (0.0327) (0.0270) (0.0372)
Quintiles of SES index 0.000708 -0.00152 -0.000909 0.00188
(0.00940) (0.00883) (0.00648) (0.00823)
Index of HLE habits at home 0.0199* 0.00249 0.00221 0.0284***
(0.00739) (0.00556) (0.00411) (0.00744)
School attendance 0.0191 0.0241* 0.0211** -0.00311
(0.0137) (0.0107) (0.00706) (0.0117)
Province=Bolikhamxay -0.0461 -0.130* -0.0692 -0.213***
(0.0620) (0.0593) (0.0475) (0.0555)
Constant 0.521*** 0.268* 0.126 0.583***
(0.122) (0.120) (0.0922) (0.115)
Observations 602 602 602 558
R-squared 0.278 0.118 0.079 0.290
Adjusted R-squared 0.268 0.107 0.0671 0.279
Robust standard errors in parentheses
*** p<0.001, ** p<0.01, * p<0.05