lappeenranta-lahti university of technology lut degree
TRANSCRIPT

Lappeenranta-Lahti University of Technology LUT
School of Energy Systems
Degree Program in Bioenergy Technology
Anna Telegina
NUMERICAL INVESTIGATION OF NON-EQUILIBRIUM STEAM
CONDENSING FLOW IN VARIOUS LAVAL NOZZLES
Master's Thesis
Supervisor: Professor Teemu Turunen-Saaresti
Examiners: Professor Teemu Turunen-Saaresti
Professor Aki Grönman

ABSTRACT
Lappeenranta-Lahti University of Technology LUT
School of Energy Systems
Degree Program in Bioenergy Systems
Anna Telegina
Numerical investigation of non-equilibrium steam condensing flow in various Laval
nozzles
Master’s Thesis
2020
81 pages, 53 figures, 4 tables, 1 appendix.
Examiners: Professor Teemu Turunen-Saaresti
Professor Aki Grönman
Keywords: condensation, steam turbines, CFD, two-phase flow, Laval nozzles
Investigation of condensing steam flow plays an important role due to the significance of the
steam turbines which is a considerable part of global power generation. Condensation has
an enormous impact on the efficiency of the low-pressure turbine which is lower in
comparison with high-pressure steam turbine efficiency and study of this problem highly
important. Turbine blade erosion, thermodynamic and aerodynamic losses, high level of the
liquid mass fraction are caused by condensation in the low-pressure turbine stages.
Experiments and numerical studying should be conducted to examine the condensation
process and various losses caused by condensation.
In present work, the computational fluid dynamic (CFD) simulations were carried out to
research the behaviour of non-equilibrium condensing steam flow inside the last turbine
stages. For the CFD simulation, the Eulerian-Eulerian approach was applied. The shear stress
transport (SST) k-ω turbulence model was used for solving the turbulence of steam flow.
Various convergent-divergent (CD) nozzles were modelled for investigation of the surface
tension effect on condensing steam flow. The model was validated with experimental data
from literature sources. The results showed that the nucleation rate, droplet numbers and
wetness are highly sensitive to the bulk tension factor. The surface tension of the liquid
droplets significantly influences the correctness of simulated results provided by the
nucleation model. The accuracy of the applied model is satisfactory to capture the
condensation shock.

CONTENTS
Abstract 2
Nomenclature 4
1 Introduction 6
1.1 Background ............................................................................................... 6
1.2 Objectives of the thesis .............................................................................. 9
1.3 Thesis overview ....................................................................................... 10
2 Literature review 12
2.1 Theoretical studies ................................................................................... 12
2.2 Experimental studies ............................................................................... 16
2.3 State of art ............................................................................................... 25
3 Physical models 29
3.1 CFD approaches ...................................................................................... 29
3.2 Governing equations of ANSYS CFX .................................................... 29
3.3 Nucleation and droplet growth model ..................................................... 31
4 CFD modelling 33
4.1 Moore nozzles ......................................................................................... 33
4.2 Barschdorff nozzle .................................................................................. 35
5 Simulation results and discussions 38
5.1 Moore nozzles ......................................................................................... 38
5.1.1 Grid independence study and convergence criteria .................... 38
5.1.2 Bulk tension factor effect ............................................................ 47
5.2 Barschdorff nozzle .................................................................................. 57
5.3 Bulk tension factor selection ................................................................... 61
6 Conclusion 65
References 67
Appendix A 73

NOMENCLATURE
Latin alphabet
H Total enthalpy J/kg
J Nucleation rate 1/m3 s
Kb Boltzmann’s constant
kv Theram conductivity of vapour phase W/m K
Kn Knudsen number
𝑙 ̅ Mean free path m
Mm Molecular mass of water kg
m* Mass of stable nucleus kg
n Number of molecules
n* Critical size of cluster
p Pressure bar, Pa
qc Condensation coefficient
qe Evaporation coefficient
R Gas constant J/kg K, J/mol K
r Radius of nuclei m
r* Critical radius of droplet m
S Supesaturation ratio
S2 Strane rate 1/s
Se1, Se2 Energy sourse term W/m3
T Temperature °C, K
u Velocity 1/s
ΔG Gibbs free energy J
ΔT Supercooling level
Greek alphabet
α Phase volume fraction
Γ𝐸 Thermal diffusion coefficient W/m K
𝛾 Specific heat capacity ratio

5
ρn Number density 1/m
σ Coefficient of surface tension N/m
Subscript
g Saturated water vapour
v Water vapour, vapour phase
l Liquid phase
Abbreviations
CD Convergent-divergent
CFD Computational fluid dynamics
CNT Classical nucleation theory
LP Low pressure
SST Shear stress transport
1D One-dimensional
2D Two-dimensional
3D Three-dimensional

6
1 INTRODUCTION
1.1 Background
The condensation of steam in the LP turbine part is a quite difficult process which leads to
undesirable consequences such as efficiency decrease of the stage. In the last stages of the
LP part, there is a rapid steam expansion which causes the temperature to drop below the
steam saturation line (SSL). When steam goes through the SSL it is subcooling and after
that, the condensation starts. This process presents the nucleation of water droplets. Hence,
one-phase dry steam transforms into a two-phase mixture of water droplets and saturated
steam. Figure 1.1 shows a condensation process in CD nozzle (Kornet & Badur 2014, 194).
Figure 1.1. Condensation process in Laval nozzle (Kornet & Badur 2014, 194).
During condensation, homogeneous and heterogeneous or binary nucleation occurs. The first
type is non-equilibrium and usually happens when subcooling pure steam expands under the
steam saturation line. After reaching of saturation conditions steam continues to undergo the
expansion until it achieves the supersaturation state. According to the research of Lee &

7
Rusak (2001, 694), the supersaturation ratio is 𝑆 = 𝑝𝑣/𝑝𝑔 where pv is the pressure of water
vapour and pg is the pressure of saturated water vapour. Even if 𝑆 ≫ 1 the condensation may
not start. It occurs at supersaturation state (critical) when the droplets achieve the critical
size.
In Figure 1.2, there is a salt solution zone (SSZ) above the steam saturation line which is a
start location of equilibrium heterogeneous nucleation. In superheated steam, there are two
types of impurities: solid particles and chemical matters. The concentration of the first one
is too small and has a negligible impact on nucleation. If the superheated steam has dissolved
chemical impurities the nucleation occurs on them (Šťastný & Pekárek 2018, 2) and the
process of condensation starts rapidly after the steam achieves the saturation state.
Figure 1.2. H-S diagram of the steam expansion in the LP turbine part (Šťastný & Pekárek 2018,
2).

8
The abrupt phase change causes the release of a considerable amount of heat to the flow.
This results in the rise of pressure and temperature and the drop of flow velocity
(Senguttuvan & Lee 2019, 4823).
Figure 1.3 shows the p-v diagram of vapour with equilibrium and non-equilibrium
condensation isentropes which are the lines of constant entropy. The equilibrium
condensation starts when the vapour crosses the saturation line at point (C). Non-
equilibrium condensation starts after the steam reaches the supersaturation conditions at
point (E). The zone from (E) to (B) is an abrupt non-equilibrium condensation phase change
(Senguttuvan & Lee 2019, 4823).
Figure 1.3. P-v steam diagram (Senguttuvan & Lee 2019, 4824).
Experiments with turbine generally have extremely high costs and, therefore, conducting
experimental researching of the non-equilibrium condensation inside the turbine stage is

9
quite complex. Besides, modelling of the whole turbine is too difficult to implement
numerical research. Consequently, the homogeneous condensing flow inside the turbine
stage is studied through convergent-divergent nozzles. This way is the most common due to
the simplicity of one-dimensional flow. Experimental studies related to steam turbines will
be considered in section 0.
1.2 Objectives of the thesis
The major concern of many design engineers is to understand the condensing flow in the
different environmental and technological applications. Nuclear and turbomachinery
industries face such problem as condensing flow in various applications. The existence of
moisture in steam turbines causes erosion in turbine blades and thermodynamic and
aerodynamic losses. In power generation, wet steam usually undergoes the reheating system
before entering the LP part of the turbine and the wetness is reduced, but this process requires
large investment costs. Steam turbine plays a substantial role in the power generation, and it
is highly important to extend existing knowledge about condensing flow which takes place
in the steam generation cycle. It is of particular importance in the development of energy-
efficient turbines. The objective of this study is to enhance the research field in the topic of
condensing steam flow using CFD simulation.
For understanding the process of condensation, the expansion process of dry superheated
steam to wet steam in supersonic nozzles was selected for the study. As the quality of
nucleation and droplet growth theories influence the precision of condensing flow
modelling, the motivation of present work is to obtain physical comprehension about the
nucleation and droplet growth approaches.
Another target of this thesis is to develop the CFD model based on Eulerian-Eulerian
approach and which can predict the spontaneous condensation precisely. The focus of
present work is on the non-equilibrium condensation triggered by homogeneous nucleation
process. The computing of condensation rests on classical nucleation theory (CNT).
10
The precision of the nucleation rate calculation stands upon the accuracy of properties of the
small radius droplets. Surface tension significantly determines the nucleation rate (Lai &
Kadambi 1993, 22). Therefore, the objective of present work is to find out and to investigate
this dependence and to achieve enough accuracy of modelling of condensing flow due to
changing of bulk tension factor.
The following tasks were performed in present work:
• Understanding and reviewing of the spontaneous condensation process though
literature researching
• Development of precise condensing flow model based on classical nucleation theory
• Estimation of developed code for its accuracy in predicting condensing flow
parameters
• Examination of the sensitivity of condensing flow parameters to surface tension
• Assessing the surface tension effect on the model accuracy
1.3 Thesis overview
The present study includes six chapters. The brief overview of each chapter is provided in
this section.
Chapter 1 illustrates the background of steam condensing flow and value of knowledge
providing the understanding of this phenomena in steam turbines. This chapter also contains
the motivation of present work and outline of the thesis.
Chapter 2 consists of a literature survey describing the efforts of other researchers in the
field of condensing flow and CFD modelling of turbine phenomenon. Theoretical,
experimental and numerical investigations are considered in this chapter.
Chapter 3 provides details of numerical methods utilised in the present study. Nucleation
and droplet growth models are described in this section.

11
Chapter 4 consists of the geometry description of selected CD nozzles and the grid
generation for these cases. Boundary conditions and setups are also provided in this section.
Chapter 5 includes the results of the simulation and discusses the surface tension effect on
condensing water-steam flow and accuracies of models concerning the experimental data.
Chapter 6 presents the conclusion of the thesis and future development related to condensing
flow modelling.
12
2 LITERATURE REVIEW
Understanding of condensation process in turbine and losses is one of the greatest concerns
of turbine designers. Condensation is a subject of numerous theoretical, experimental, and
numerical studies last years. In comparison with homogeneous condensation, the
significance of binary condensation is comparatively small and present modelling
experience of heterogeneous condensation flow is quite poor (Patel 2016, 27). This part
provides a review of present studies related to homogeneous steam condensation in the
turbine.
2.1 Theoretical studies
This part briefly describes some of the most important theoretical studies related to
condensation flow.
Nucleation accompanies phase transitions of the first order occurring in the initial metastable
phase as a result of fluctuating formation and growth of new phase nuclei (clusters). In 1878,
Gibbs (1906) was the first to theoretically describe the formation process of a new phase. He
gave a rigorous thermodynamic definition of critical new phase nuclei and laid the basis for
a formalized description of the nucleation rate. Half a century later Volmer and Weber
(1926) developed the Gibbs theory. Volmer (1926) quantitively described the growth of new
phase nuclei during the crystallization. He introduced the concept of 2D and 3D nuclei of
the new phase and connected their fluctuation formation with nucleation rate and
crystallization rate. Then researchers have focused on findings of more rigorous theoretical
justification of considered process kinetic. Farkas (1927) solved the system of Szilard
equations described the formation of vapour droplets. Becker and Döring (1935) finished the
work at the definition of constants of Szilard equations, and along with other researchers
such as Zeldovich (1942), they contributed to the theory of nucleation.
According to simplified steady-state model considered in the statistical theory of Becker and
Döring (1935), the average number of nuclei comprising 2, 3, 4, …, n molecules do not vary

13
in time although it depends on the external conditions. If the size of the cluster is larger than
the critical size, then such cluster is removed from the model and the pressure is kept constant
utilizing monomer input. The rates of evaporation and condensation are balanced for nuclei
of each size. The authors of theory estimated the nucleation rate J which equalled the number
of clusters capable of growth formed in a unit of volume (1 sm3) in a unit of time (1 sec). It
was supposed that clusters consisting of n molecules were formed from nuclei consisting of
(n – 1) molecules. This theory was completed and formulated by Zeldovich (1942) and
Frenkel (1946) and now it is known as classical nucleation theory.
It had been considered that the nucleation theory correctly described the homogeneous
condensation of supersaturated steam until it became possible to determine the dependence
of nucleation rate on supersaturation. As a result, dozens of equations for the nucleation rate
of new phase nuclei appeared.
Although the supersaturation state was discussed previously in Chapter 1.1, it is necessary
to establish the concept of supersaturation in more detail. If the pressure of vapour is greater
than the pressure of saturated vapour at a given temperature, then this vapour is called
supersaturated. The pressure of vapour, coexisting in equilibrium with liquid is defined by
the temperature of the system. When the temperature drops at constant pressure, the content
of molecules per unit volume is much higher than possible for new equilibrium condition at
temperature T, hence, the steam becomes supersaturated (Luijten 1999, 3).
As supersaturated steam is metastable, it will converge to equilibrium. If S is much more
than one, clusters can be formed by steam and play the role of condensation cores thus run
the process of homogeneous nucleation. In case of not too significant saturation ratio, the
steam slowly condenses as long as the pressure of steam becomes equal the pressure of a
new equilibrium state.
According to the nucleation theory, new phase clusters are formed by molecular
agglomeration. Clusters consisting of n molecules increase their size due to the addition of
single molecules:

14
𝐴1 + 𝐴1 ↔ 𝐴2
𝐴2 + 𝐴1 ↔ 𝐴3
… … … … … …
𝐴𝑛−1 + 𝐴1 ↔ 𝐴𝑛,
where A1, A2, …, An is accordingly a monomer, a dimer and an n-mer.
The formation of nuclei of critical size is possible when the cluster breaks the nucleation
barrier. According to the Gibbs (1906) thermodynamics, the free energy of cluster formation
in capillarity approximation can be express as:
𝛥𝐺 = 4𝜋𝑟2𝜎 − 𝐾𝑏𝑇 ln 𝑆 (2.1)
𝑟 = radius of nuclei [m]
𝜎 = coefficient of surface tension [N/m]
𝐾𝑏 = Boltzmann’s constant [J/K]
𝑇 = temperature [K]
Boltzmann law determines the distribution of clusters in equilibrium:
𝜌𝑛 ∝ 𝑒𝑥𝑝(−𝛥𝐺/𝑘𝑇) (2.2)
𝜌𝑛 = number density [1/m]
For unsaturated and saturated steam 𝑆 ≤ 1 the free energy ΔG constantly increasing with
growing cluster size n. For supersaturated vapour (𝑆 > 1) ΔG has a maximum point at some
critical value n* as shown in Figure 2.1. Upon reaching critical size n* evaporation of one
molecule leads to reducing in the size of the associate and, usually, to the subsequent
evaporation of the cluster (Luijten 1999, 4). As it was said above, the size of the cluster
increases by adding the molecule, the equilibrium steam pressure above the cluster decreases
and the cluster begins to grow spontaneously. It is accompanied by a decrease of Gibbs free
energy.

15
Figure 2.1. Dependence of free energy on the number of cluster molecules (Luijten 1999, 4).
According to a study conducted by Guha (1997, 296), after nucleation process droplets begin
to exchange energy and mass with vapour and thus increase in size. In research of Gyarmathy
(1962) differentiation of different droplet, growth regimes were suggested. The regimes were
characterised by Knudsen number 𝐾𝑛 = 𝑙/̅2𝑟 where Kn is a ratio of a steam molecular mean
free path to the diameter of a droplet. In the case of small Knudsen number 𝐾𝑛 < 0.01, the
regime (continuum flow) of growth is defined by molecules diffusion. For large Knudsen
number 𝐾𝑛 > 4.5, the regime is free molecular flow and the growth is controlled by kinetic
theory. There are also two intermediate regimes with 0.01 < 𝐾𝑛 < 0.18 and 0.18 < 𝐾𝑛 <
4.5 which correspond to slip flow and transition flow regimes respectively (Gyarmathy
1962, 41). According to Gyarmathy, droplet growth is expressed as:
𝑑𝑟
𝑑𝑡=
𝑘𝑣 (1 −𝑟∗
𝑟 )
(1 + 3.18𝐾𝑛)
𝑇𝑙 − 𝑇𝑣
(ℎ𝑣 − ℎ𝑙)𝜌𝑙
(2.3)
𝑘𝑣 = thermal conductivity of vapour [W/m K]
𝑟∗ = critical droplet radius [m]

16
𝜌𝑙 = water density [kg / m3]
𝐾𝑛 = Knudsen number [-]
Subsequently, the model of Gyarmathy (1962) was adjusted by Young (1982) to provide the
validity of equations under any flow conditions. The Young’s numerical research provided
the model of vapour condensation inside the supersonic nozzles and the results were in good
agreement with experimental data. It was detected that correlation of experimental data can
be done very accurately if there is an assumption that the condensation coefficient qc drops
with increasing pressure. The condensation coefficient is defined as (Young 1982, 9):
𝑞𝑐 = 4𝜋𝑟2𝑞𝑒
𝑃𝑠(𝑇𝑠, 𝑟)
√2𝜋𝑅𝑇𝐿
(2.4)
𝑞𝑒 = evaporation coefficient [-]
R = specific gas constant [J / kg K]
The condensation coefficient is characterized as the fraction of molecules striking the
condensing liquid surface. There was a lot of discussions about values of condensation
coefficient qc and evaporation coefficient qe where the qe is determined as a correction factor
of the absolute evaporating molecular flux. In a study conducted by Wilhelm (1964, 28) it
had been noticed that in some researches these coefficients were assumed to be equal to
simplify the analysis. Along with Young (1982, 13), Wilhelm supposed that there were no
reasonable experimental or theoretical reasons to equate these values.
2.2 Experimental studies
In this section, a brief overview of some important experimental studies related to
condensation flow is presented.
As it was noticed in section 1.1, the experimental researching of the condensation process in
the steam turbine can be extremely complicated and problematic because of the difficulty of
turbine installation. Moreover, numerical investigation of turbine processes can represent a

17
challenge due to the modelling of the whole turbine requires a significant amount of
resources and time. To solve this problem most of the researches study the steam
condensation in the turbine via the condensation in CD nozzles.
Stodola (1915) was one of the first to experimentally study the process of vapour
condensation in CD nozzles. It was detected that condensation occurred in the supersonic
nozzle part with delay. After that, many researchers conducted experiments on condensation
flow in nozzles.
In their research, Gyarmathy & Lesch (1969) used the optical technique and were one of the
researchers who provided the data of droplet size which used for validation of theoretical
and numerical studies. Figure 2.2 present the droplet growth measured value obtained from
the experiment. According to the study, fog droplet sizes ranged in 0.07-0.2 μm radius were
found in the exhaust flow of an experimental five-stage LP turbine. Figure 2.3 shows these
measured values.
Figure 2.2. Growth of fog droplets in a Laval nozzle (Gyarmathy & Lesch 1969, 33)

18
Figure 2.3. Fog droplet size in turbine exhaust (Gyarmathy & Lesch 1969, 35)
Moore et al. (1973) implemented the experiments with a series of CD nozzles for steam non-
equilibrium condensation studying the distribution of pressure in the nozzles. Laval nozzles
used in experiments were placed in turn in the test section. Figure 2.4 shows the geometry
of nozzles, where b is the nozzle throat height and e is the nozzle exit height. The expansion
rates of nozzles decreased for any given static pressure due to varying the height of throat
and divergence angle. The results of this experimental study have been still used by many
researchers for the validation of numerical simulation of non-equilibrium condensation.
Figure 2.5 shows the data of experiments with initially superheated steam where nucleation
occurs in the divergent section of the nozzle. Radii of droplets were also measured in these
experiments.

19
Figure 2.4. Geometry of nozzles (Moore et al. 1973)
Figure 2.5. Experimental data of nozzle flows with initially superheated steam (Moore et al. 1973)
Other scientists who utilize optical technique were Moses & Stein (1978) who organized the
experiments with a series of CD nozzles. In their research, they studied how the initial
temperature and pressure varying affected the condensation zone. Due to this study, the
average size of droplet created by nucleation was first found and documented. The nozzle

20
used in experiments was made of black anodised aluminium with a throat 1 cm x 1 cm and
had a window on one sidewall.
In the experimental study conducted by White et al. (1996) non-equilibrium steam
condensation process was researched in turbine cascade blades with the transonic operation.
Four different levels of inlet superheat ΔT were studied and for each level, three test cases
were conducted. They are classified as Low – ΔT = 4-8°C, Medium – ΔT = 13-15°C, High
– ΔT = 26-28°C, and Very High – ΔT = 39°C. Experiments aimed to obtain the colour
schlieren photos of the structure of shock wave, the static pressure distribution along with
the blades and to fixate the changing of the mean droplet radius pitch-wise. Figure 2.5
present experimental data obtained from one of the test cases and predicted blade surface
pressure distribution. Experimental data were compared to theoretical study provided by
White & Young (1993) and the results had an excellent agreement. Figure 2.7 present the
comparison of measured and predicted mean droplet radii for three Low tests. In these
figures, black dots are measured radii and lines are calculated values.
Figure 2.6. Blade surface pressure distribution for L1 test (White et al. 1996)

21
Figure 2.7. Comparison of measured and predicted mean droplet radii for L1, L2 and L3 tests
(White et al. 1996).
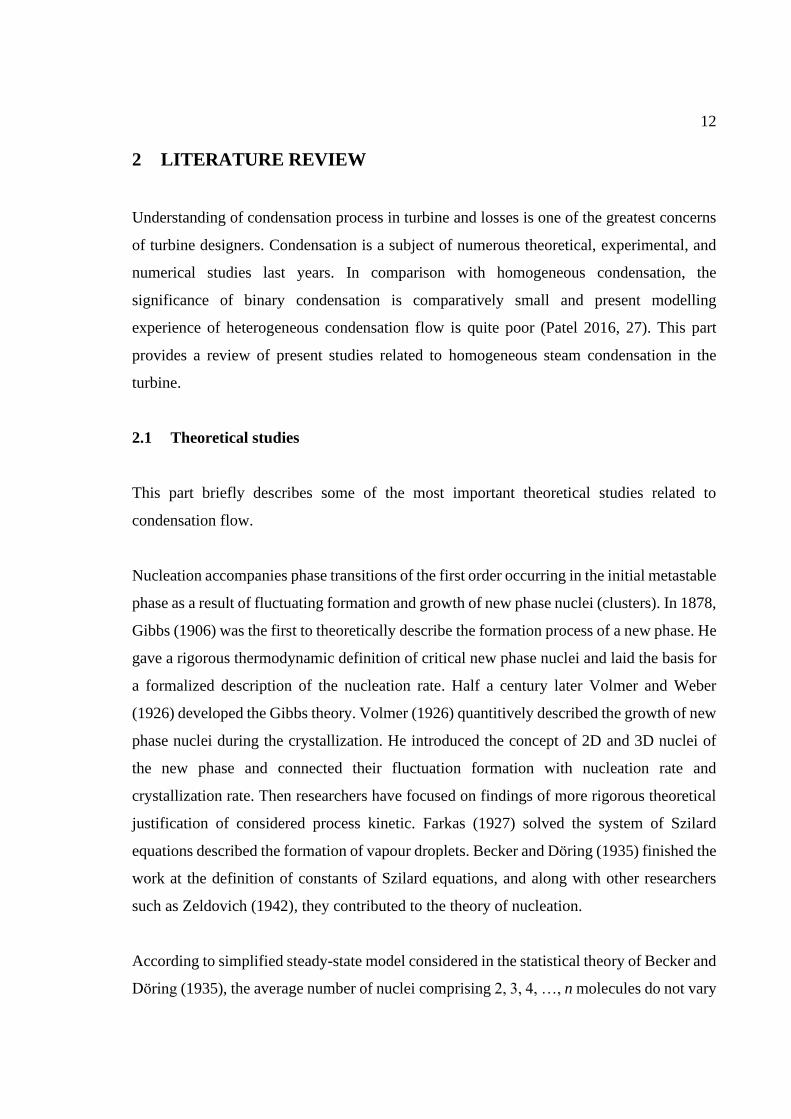
Majkut et al. (2014) conducted the experiments on condensation in nozzles and linear
cascades with steam tunnel facility. The facility provided the steam flow at conditions
dominating in LP turbine. The static pressure measurement was carried out during the
measuring campaign. In Figure 2.8, there are the positions of the pressure taps on the blade
surface and some geometry details of blades. Each measurement series lasted 30 seconds.
The comparison of the calculated static pressure and static pressure measured during the
campaign is shown in Figure 2.9. The static pressure obtained from the experiment had
relatively high deviation which was caused by the fluctuation due to the water film
interaction with the shock wave.
22
Figure 2.8. Position of the pressure taps for investigated blade-to-blade channel (Majkut et al.
2014)
Figure 2.9. Measured and calculated static pressure on the blade (Majkut et al. 2014)
The experiments showed the formation of coarse droplets in proximity to the shock waves
due to water membrane separation on the blade suction side. Besides, it was suggested that

23
the water membrane was presented on a strong shock wave because of the deceleration of
tiny droplets. Behind the water membrane, there was coarse water moving chaotically and
formed by the collision of small droplets. Coarse droplets and their chaotic moving lead to
the instability of flow.
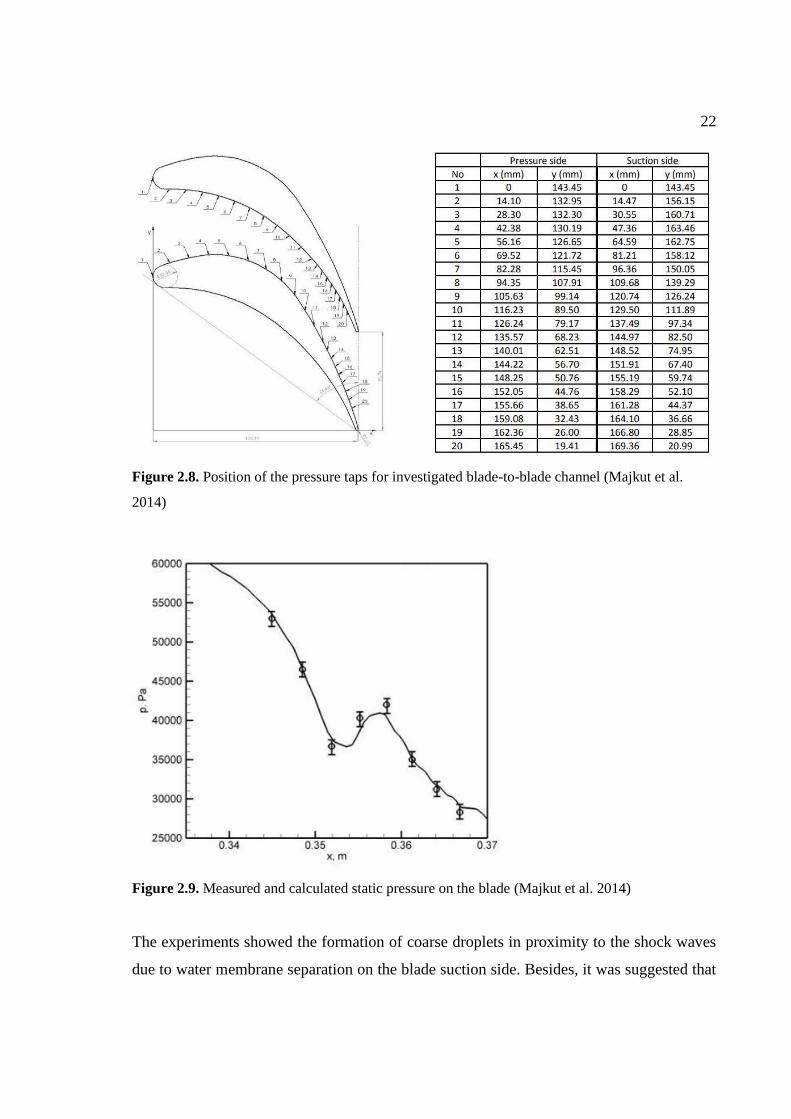
In the same year, Eberle et al. (2014) performed the experiments on multistage LP turbine
(Figure 2.10) and varied the inlet temperature studying the effect on the homogeneous
condensation and wetness topology. Three cases with various inlet temperature were
conducted. Researchers also measured wetness fraction and droplet spectrum through an
optical-pneumatic probe. The measured diameters for case 1 show different distributions
across the span in Figure 2.11. In this figure, the measured wetness fraction can also be seen.
Figure 2.10. Schematical view of the turbine with measuring plane E30 (Eberle et al. 2014)
24
Figure 2.11. (a) Measured Sauter diameter D32 across the span in plane E30 for case 1, (b) calculated
and measured wetness fraction, and (c) measured Sauter diameters and calculated droplet size (Eberle
et al. 2014)
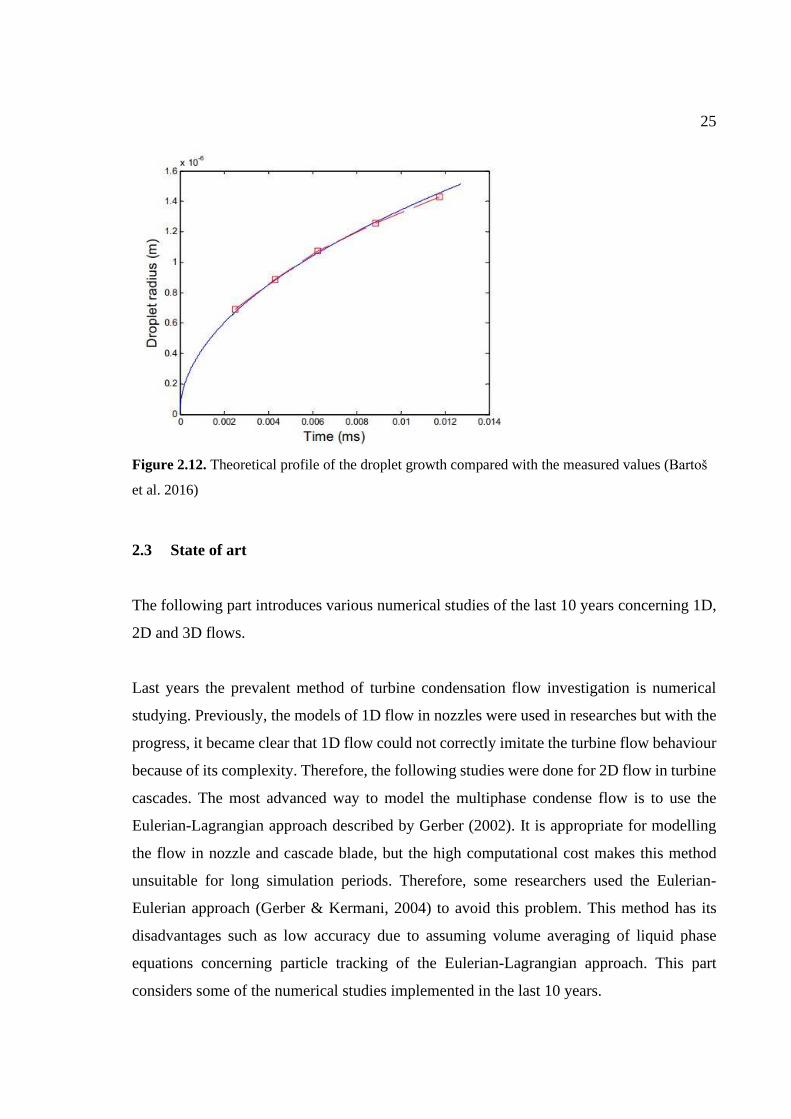
For experimental research of binary and homogeneous nucleation process, Bartoš et al.
(2016) developed a mobile steam expansion chamber. They provided the measurements of
droplet growth using the light scattering analysis. Figure 2.12 present the comparison
between the theoretical profile of the droplet growth over time and the experimental data.
25
Figure 2.12. Theoretical profile of the droplet growth compared with the measured values (Bartoš
et al. 2016)
2.3 State of art
The following part introduces various numerical studies of the last 10 years concerning 1D,
2D and 3D flows.
Last years the prevalent method of turbine condensation flow investigation is numerical
studying. Previously, the models of 1D flow in nozzles were used in researches but with the
progress, it became clear that 1D flow could not correctly imitate the turbine flow behaviour
because of its complexity. Therefore, the following studies were done for 2D flow in turbine
cascades. The most advanced way to model the multiphase condense flow is to use the
Eulerian-Lagrangian approach described by Gerber (2002). It is appropriate for modelling
the flow in nozzle and cascade blade, but the high computational cost makes this method
unsuitable for long simulation periods. Therefore, some researchers used the Eulerian-
Eulerian approach (Gerber & Kermani, 2004) to avoid this problem. This method has its
disadvantages such as low accuracy due to assuming volume averaging of liquid phase
equations concerning particle tracking of the Eulerian-Lagrangian approach. This part
considers some of the numerical studies implemented in the last 10 years.

26
The model in a numerical study performed by Halama & Fort (2012) was based on CNT
with surface tension corrections. The following formula of nucleation rate is modified with
correction factor β (Halama & Fort 2012, 2):
𝐽 =𝑝𝑣
2
𝑝𝑙· √
2𝜎
𝑚𝑣3𝜋
𝑒−𝛽
4𝜋𝑟2𝜎3𝐾𝑏𝑇𝑣 (2.5)
J = nucleation rate [1/m3 s]
𝑚𝑣 = molecular mass of water [kg]
𝛽 = correction factor
The model consisted of Euler equations. The results were compared to data obtained from
experiments on flow in CD nozzles. The model from this research can successfully simulate
the 2D flows in nozzles and flows in single turbine cascade because of only primary
nucleation. In case of appearance of secondary nucleation, there will be two groups of
droplets with different sizes and the results of the simulation can be quite inaccurate.
Multistage turbine simulation also is too challenging for this model.
In the same year, Hasini et al. (2012) simulated the model of wet steam flow in the turbine
channel. The model was applied for dry steady flow and wet steady flow. Two different
methods of polydispersed droplet calculation were tested utilizing this model. According to
the first one, the groups of droplets was united in one population with average properties. In
the second method, every droplet groups were individual with their properties. The
comparison of these two methods showed that even though some inaccuracy in droplet radius
calculation of the “average” method the calculation error was quite negligible. As the
difference between these two methods is minor therefore the first method is cheaper due to
the significant saving of the computer resource and the computation time.
In research provided by Ju et al. (2012), authors studied the effect of velocity slip and
spontaneous condensation on total pressure of steam phase and other parameters at the outlet
of the cascade. The model based on two-phase non-equilibrium condensation flow had been

27
developed to simulate the flow in 2D nozzle, 2D Bakhtar cascade and 3D last turbine stage
stator cascade. The Eulerian-Eulerian approach is used for the development of the model
which can be applied for prediction of the location of the non-equilibrium phase transition.
Pandey (2014) focused on his work on the non-equilibrium condensing steam flow in the
nozzles. Barschdorff (1971) and Moore et al. (1973) CD nozzles were chosen for validation
of the CFD approach. Provided model quite accurately simulates the condensation shock and
calculates the droplet size.
In the study conducted by Han et al. (2017) the total variation diminishing discrete method
was represented. This method is appropriate for 2D condensing flow and used for accuracy
improvement and making the program more universal. The experiments made by White et
al. (1996) were used as validation research.
Giacomelli et al. (2017) provided the results of simulation of 2D wet steam flow performed
employing ANSYS Fluent. The model was based on Mixture approach. For validation of
this model, the study provided by White et al. (1996) was also used for the previous study.
The research can be used for prediction of main aspects of spontaneous steam condensation.
Šťastný & Pekárek (2018) conducted the numerical study which considered homogeneous
and heterogeneous 2D condensation flow in the nozzle-blade cascades in the one-stage
turbine. The research showed high losses related to homogeneous condensation and. For
reduction thermodynamic losses it is suggested to realise heterogeneous nucleation of steam
and NaCl for initial condensation.
In the same year, Hughes et al. (2018) studied the phenomenon that distinguishes steam
turbine condensation from condensation in nozzle and cascade. Non-equilibrium steam
model based on the 3D viscous Euler model was represented in the research for studying the
nucleation location impact. For wake-chopping effect investigation authors used the model
of three-stage quasi three-dimensional (Q3D) turbine having the repeating stage design. The
advantages of such kind designate similar expansion profile and the identical upstream wake
of each turbine blade. The simulation of the Q3D model was done for steady and unsteady

28
conditions to isolate the impact of wake-chopping. The number of blades under the steady
conditions was constant. The investigation of phase change loss and droplet spectra was
conducted by varying inlet temperature and inlet subcooling.
Senguttuvan & Lee (2019) performed their study using Eulerian-Eulerian approach to
simulate 2D steady flow. The CNT was improved by Hill’s droplet growth law. Authors
modelled only half of a nozzle to save the resources and time. Supersonic Moore nozzles
(Moore et al., 1973) were used for validation of results. The research showed that the
increment of the nozzle area ratio affected the condensation onset. As the area ratio grew the
condensation shock became more intensive.
There are a few works which study the model of a multistage turbine and significantly fewer
works consider the condensation model in a multistage turbine. Researchers performed their
studies for different kinds of turbines utilising varying fluids as a working medium.
Durham University provided the 3D steam turbine flutter test case (Burton 2014) in open
sources. On the base of this model, various studies were carried out. The model consists of
stator, rotor, and diffuser. The flow conditions are typical for the LP turbine. Burton (2014)
conducted CFD modelling of LP steam turbine exhaust hood flow. The pressure gradient of
condenser cooling water impact on the hood flow was modelled in this study. The same test
case was used by Qi (2016) for flutter analysis.
The Institute of Thermal Turbomachinery and Machinery Laboratory provided an LP steam
turbine test case for studying aeromechanical phenomena and condensation (Fuhrer et al.
2019). The 3D model consists of two last LP steam turbine stages. The test case is
appropriate for the investigation of spontaneous condensation in the LP turbine.

29
3 PHYSICAL MODELS
The focus of this chapter is on physical modelling of homogeneous nucleation and the
droplet growth playing a key role in the condensing steam flow.
3.1 CFD approaches
The condensing flow presents a two-phase flow consisted of the dispersed and the
continuous phases. For CFD modelling of condensing flow, two approaches are usually
used: Euler-Euler approach and Euler-Lagrangian approach. The dispersed phase is treated
differently in both the Euler-Euler model and Euler-Lagrangian model. The Euler-
Lagrangian model follows all the particles individually as they shift in continuous phase
flow. Using this method, it is necessary to know the characteristics of each particle and
equations are solved for every droplet separately. As a result, the Euler-Lagrangian approach
is a very precise method in case of two-phase flow and requires a considerable amount of
time.
Euler-Euler approach does not track every particle. A specific point of space is fixated, and
the properties of the flow are recorded. Equations are solved contemporaneously for each
node in the domain. A set of equations is analogous for both the dispersed and the continuous
phase. Monitored properties are related to a particular location in flow with different number
of droplets at different time. The disadvantage of the Euler-Euler approach was a fact that
particle-particle interactions are not taken into account, but the development of this method
fixed this problem (Utkilen et al. 2014, 91).
3.2 Governing equations of ANSYS CFX
For two-phase flow undergoing the fast pressure drop which causes the nucleation and
condensation process, there is the Droplet Condensation Model in ANSYS CFX. This model
can be used for the flows have already contained a considerable number of droplets. Equation

30
system consists of one continuous phase and any number of dispersed (condensed) phases.
The droplets (condensed phase) move at the speed of the continuous phase.
The mass conservation equations for vapour and liquid phases are expressed as (Patel 2016,
38):
𝜕(𝜌𝑣𝛼𝑣)
𝜕𝑡+
𝜕(𝜌𝑣𝑢𝑗𝑣𝛼𝑣)
𝜕𝑥𝑗= − ∑ 𝑆𝑙
𝑛
𝑖=1
− ∑ 𝑚∗𝛼𝑣𝐽
𝑛
𝑖=1
(3.1)
𝛼 = phase volume fraction [-]
𝑢 = velocity [m/s]
𝑆𝑙 = mass source term [kg/m2 s]
𝑚∗ = mass of a nucleated droplet [kg]
where v is a vapour phase.
𝜕(𝜌𝑙𝛼𝑙)
𝜕𝑡+
𝜕(𝜌𝑙𝑢𝑗𝑙𝛼𝑙)
𝜕𝑥𝑗= ∑ 𝑆𝑙
𝑛
𝑖=1
+ ∑ 𝑚∗𝛼𝑣𝐽
𝑛
𝑖=1
(3.2)
where l is a liquid phase.
The momentum equation of the vapour phase is (Patel 2016, 39):
𝜕(𝜌𝑣𝛼𝑣𝑢𝑖𝑣)
𝜕𝑡+
𝜕(𝜌𝑣𝑢𝑖𝑣𝑢𝑗𝑣)
𝜕𝑥𝑗= −𝛼𝑣
𝜕𝑃
𝜕𝑥𝑖+
𝜕(𝛼𝑣𝜏𝑖𝑗𝑣)
𝜕𝑥𝑗+ 𝑆𝐹,𝑚 (3.3)
𝑃 = pressure [Pa]
𝜏 = viscous stress tensor [Pa]
The energy conservation equation for the vapour phase is defined as (Patel 2016, 39):

31
𝜕(𝜌𝑣𝛼𝑣𝐻𝑣)
𝜕𝑡+
𝜕(𝜌𝑣𝛼𝑣𝑢𝑗𝑣𝐻𝑣)
𝜕𝑥𝑗
= −𝛼𝑣
𝜕𝑃
𝜕𝑥𝑗+
𝜕 (𝛼𝑣Г𝐸𝜕𝑇𝑣
𝜕𝑥𝑗)
𝜕𝑥𝑗+
𝜕(𝛼𝑣𝑢𝑖𝑣𝜏𝑖𝑗𝑣)
𝜕𝑥𝑗+ 𝑆𝑒1 + 𝑆𝑒2
(3.4)
Г𝐸 = thermal diffusion coefficient [W/m K]
3.3 Nucleation and droplet growth model
Nucleation and droplet growth accompany the phase change in a steam turbine. The
following formula can be used to estimate the nucleation rate (Bian et al., 2019):
𝐽 = 𝑞𝑐 ·𝑝𝑣
2
𝑝𝑙· √
2𝜎
𝑀𝑚3 𝜋
𝑒−
4𝜋𝑟2𝜎3𝐾𝑏𝑇𝑣 (3.5)
In this formula, the condensation coefficient qc is defined by Eq. (2.4)
For both small and large droplets the Droplet Condensation model is appropriate. Droplets
which are smaller than 1 μm can be estimated through the Small Droplet heat transfer model.
The temperature of droplets is defined as (Gyarmathy, 1962):
𝑇𝑙 = 𝑇𝑠(𝑝) − 𝛥𝑇𝑟∗
𝑟 (3.6)
𝑇𝑠 = saturation temperature [K]
𝛥𝑇 = supercooling level in gas phase [-]
𝑟∗ = droplet radius at the formation of the dispersed phase [m]
The critical droplet radius is defined as (Young, 1992):

32
𝑟∗ =2𝜎
𝑝𝑙𝛥𝐺
(3.7)
The droplet growth rate is written as (Gyarmathy, 1976):
𝑑𝑟
𝑑𝑡=
𝑘𝑣
𝑟(1 + 𝑐𝐾𝑛)·
𝑇𝑙 − 𝑇𝑣
(ℎ𝑣 − ℎ𝑙)𝜌𝑙
(3.8)
𝑐 = constant value [-]
The accuracy of the nucleation theory and droplet growth theory highly affects the
correctness of modelling of non-equilibrium condensing flow. The accuracy of nucleation
rate calculation is influenced by the precision of properties of the small radius droplets. The
nucleation rate is highly affected by surface tension (Lai & Kadambi 1993, 22). Eq. (3.5)
present the nucleation rate dependence on the droplet surface tension in the exponential term.
This dependence causes the dramatical changing in nucleation rate due to small changing of
surface tension magnitude. Lai and Kadambi (1993) showed in their study that a small
change in the surface tension ratio 𝜎𝑟/𝜎∞ (the ratio of surface tension for extremely curved
surface (droplet surface) to surface tension for a flat surface) is a reason for significant
changing in the pressure ratio, droplet diameter, and droplet size distribution. According to
Lai and Kadambi’s study (1993), a larger surface tension ratio causes the delay of onset of
spontaneous condensation and, consequently, to decrease the pressure in Wilson point.
Nucleation rate is lower, and the nucleation zone is wider for higher surface tension ratio.
As it was mentioned before, the results highly depend on the changing of surface tension
ratio.

33
4 CFD MODELLING
ANSYS 2020 R1 was used as a numerical tool for this study. Geometry preparation for grid
generation was made utilizing DesignModeler and Pointwise. The simulation was running
with ANSYS CFX. Setup, solving, and post-processing was made with CFX-pre, CFX-
solver and CFD-post, correspondently.
Converging-diverging nozzles have been simulated in the present study. In this chapter, there
are geometry description, boundary conditions and grid generation of simulated models.
4.1 Moore nozzles
The Moore’s et al. (1973) experiments were conducted on a series of Laval nozzles which
were placed in turn in the test section. Figure 2.4 shows the geometry of nozzles, where b is
the nozzle throat height and e is the nozzle exit height. In the present work, nozzles A, B and
C were simulated.
The boundary conditions were applied the same as that of Moore et al. (1973) experiment.
The inlet total pressure for all selected test cases was 25 kPa and the inlet total temperature
varied. The outlet pressure for nozzles A and B was 4 kPa. The pressure at the outlet of
nozzle C was 9 kPa (Kim et al. 2015). At the nozzle walls, adiabatic no-slip wall boundary
was defined.
Figure 4.1 presents the mesh of nozzle A. The mesh consists of 64 620 nodes and 31 862
elements. For nozzle A, the inlet total temperature was 354.6 K.

34
Figure 4.1. Mesh of Moore et al. (1973) nozzle A
Figure 4.2 shows the nozzle B grid containing 100 440 nodes and 49 714 hexahedral
elements. The total temperature at the inlet was 358.6 K.
Figure 4.2. Mesh of Moore et al. (1973) nozzle B
Figure 4.3 shows the nozzle C grid consisted of 140 760 nodes and 69 810 hexahedral
elements. The total temperature at the inlet was 359.11 K.

35
Figure 4.3. Mesh of Moore et al. (1973) nozzle C
During the simulation of Moore et al. (1973) cases, the grid resolution effect on simulation
results was noticed. For all three meshes, the grid independence study was done. The details
of grid sensitivity analysis are provided in section 5.1.1. The main solver settings are
summarised in Table 1.
Table 1. Summary of setup
Working fluid Two-phase, IAPWS library
Turbulence model SST k-ω
Turbulence intensity 5 %
Iterations 500-1000
Residual target 10-6
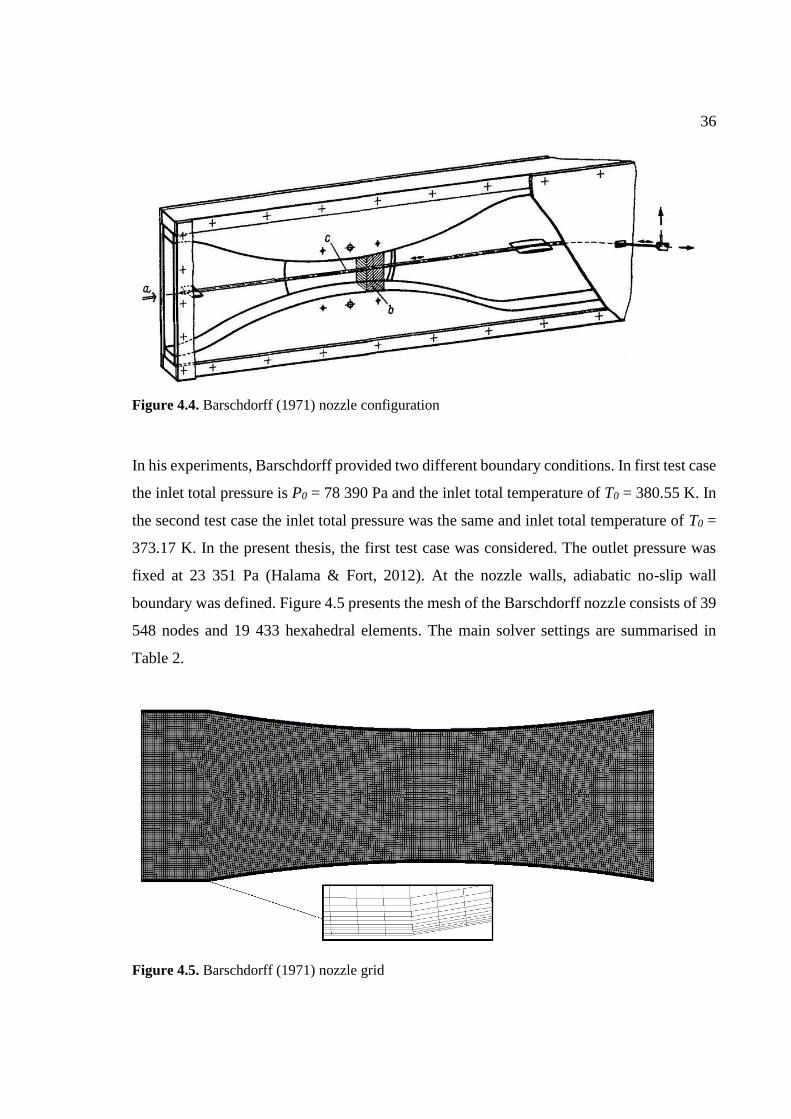
4.2 Barschdorff nozzle
The experiment conducted by Barschdorff (1971) on a supersonic nozzle is the first test case
selected for simulation. Figure 4.4 shows the schematic view of the nozzle. Barschdorff used
in his experiments an arc Laval nozzle with the wall radius curvature of 584 mm and the
throat height of 60 mm.
36
Figure 4.4. Barschdorff (1971) nozzle configuration
In his experiments, Barschdorff provided two different boundary conditions. In first test case
the inlet total pressure is P0 = 78 390 Pa and the inlet total temperature of T0 = 380.55 K. In
the second test case the inlet total pressure was the same and inlet total temperature of T0 =
373.17 K. In the present thesis, the first test case was considered. The outlet pressure was
fixed at 23 351 Pa (Halama & Fort, 2012). At the nozzle walls, adiabatic no-slip wall
boundary was defined. Figure 4.5 presents the mesh of the Barschdorff nozzle consists of 39
548 nodes and 19 433 hexahedral elements. The main solver settings are summarised in
Table 2.
Figure 4.5. Barschdorff (1971) nozzle grid

37
Table 2. Summary of setup
Working fluid Two-phase, IAPWS library
Turbulence model SST k-ω
Turbulence intensity 5 %
Iterations 500-1000
Residual target 10-6

38
5 SIMULATION RESULTS AND DISCUSSIONS
In present work, the impact of bulk tension factor on condensing steam flows is investigated
using ANSYS CFX. The bulk tension factor significantly effects on the nucleation rate in
Eq.(3.5). As it was mentioned in section 0, the surface tension effect causes the significant
changing in nucleation rate due to small changing of surface tension magnitude. Lai and
Kadambi (1993) showed in their study that a small change in the surface tension ratio σr / σ∞
results in significant changing in the pressure ratio, droplet diameter, and droplet size
distribution. For purposes of studying this influence, two different nozzle models were
simulated: Barschdorff (1971) and Moore et al. (1973). For more detailed research and
demonstration variety of bulk tension factor effect, Moore et al. (1973) nozzles A, B, and C
were selected for the simulation. This chapter presents the results of the simulation and
discusses them.
5.1 Moore nozzles
5.1.1 Grid independence study and convergence criteria
The grid independence study of Moore et al. (1973) nozzle meshes is presented in this
chapter. Table 3 provides information about mesh statistics. The details of grids and
boundary conditions are presented in chapter 4.1. The bulk tension factor was applied
equally to 1 for these simulations.
Table 3. Statistics of nozzle meshes
Grid resolution
Coarse Medium Fine
Nozzle A Number of nodes 12 720 28 800 64 620
Number of elements 6 162 14 101 31 862
Nozzle B Number of nodes 19 800 44 820 100 440
Number of elements 9 676 22 072 49 714

39
Nozzle C Number of nodes 27 840 63 120 140 760
Number of elements 13 667 31 178 69 810
Figure 5.1, Figure 5.2, and Figure 5.3 show the pressure contours of Moore et al. (1973)
nozzles A, B and C for different mesh resolutions. Nozzles B and C provided more detailed
and relatively similar pressure distribution.
Figure 5.1. Contours of the pressure distribution of the Moore nozzle A predicted with (a) coarse
grid, (b) medium grid, and (c) fine grid
Figure 5.2. Contours of the pressure distribution of the Moore nozzle B predicted with (a) coarse
grid, (b) medium grid, and (c) fine grid

40
Figure 5.3. Contours of the pressure distribution of the Moore nozzle C predicted with (a) coarse
grid, (b) medium grid, and (c) fine grid
Figure 5.4, Figure 5.5, and Figure 5.6 present the nucleation rate along the centreline of
Moore et al. (1973) nozzles A, B and C for different mesh resolutions. Predicted nucleation
rate values are more sensitive to the grid density.
Figure 5.7 and Figure 5.8 show the pressure ratio and wetness fraction distribution along the
centrelines of nozzles A, B, and C for different grid resolutions. Obtained results are quite
similar.
According to conducted grid independence study, fine meshes of nozzles A, B, and C were
selected for the following simulations.

41
Figure 5.4. Nucleation rate along the Moore nozzle A centreline for different grid resolutions
Figure 5.5. Nucleation rate along the Moore nozzle B centreline for different grid resolutions

42
Figure 5.6. Nucleation rate along the Moore nozzle C centreline for different grid resolutions
Figure 5.7. Pressure ratio along the Moore nozzles A, B, and C centreline for different grid
resolutions

43
Figure 5.8. Wetness fraction along the centreline of Moore nozzles A, B, and C for different grid
resolutions
Figure 5.9, Figure 5.10, and Figure 5.11 present the convergence of mass and momentum
and imbalance for nozzle A, nozzle B and nozzle C, correspondently. In present work, it is
assumed that the solution was converged to RMS residuals of 10-6. As can be seen from
Figure 5.9, Figure 5.10, and Figure 5.11, the level of 10-6 is achieved for all solutions. The
difference between results (pressure distribution, droplet number, liquid mass fraction)
obtained with about 400 iterations and with 5000 iterations (in case of nozzle A) or 2000
iterations is negligible, therefore, the solution does not depend on the number of iterations
and it is converged with about 400 iterations. The imbalances for all cases are sufficiently
small to consider the solution converged.

44
Figure 5.9. Convergence criteria for nozzle A.

45
Figure 5.10. Convergence criteria for nozzle B.

46
Figure 5.11. Convergence criteria for nozzle C.

47
5.1.2 Bulk tension factor effect
The accuracy of non-equilibrium condensing flow modelling is highly affected by the quality
of the nucleation and the droplet growth estimations. The tests for the precision of these
theories can be conducted in case of availability of the experimental data. In the present
study, the condensation models are validated by flow in various supersonic nozzles. For this
purpose, the pressure distribution along the centreline of the nozzle was compared with
available experimental data. The surface tension of droplets has a considerable impact on
nucleation theory accuracy.
Figure 5.12, Figure 5.13, and Figure 5.14 provide the pressure ratio and droplet radius along
the centreline of nozzle A, B and C with different bulk tension factors.
Nozzle A has the poorest agreement with experimental data in comparison with other cases.
The bulk tension factor for this simulation was 1.1. The pressure distribution curve obtained
from the simulation is lower than experimental data curve, but condensation shock appears
almost in the same distance from the throat. According to Figure 5.9, the RMS residual target
of 10-6 was achieved for momentum and mass and imbalances are sufficiently small to
assume the solution converged for the present case. Besides, the difference between results
with 400 iterations and 5000 iterations is negligible.
As can be seen, the best agreement of pressure distribution with experimental data achieved
in the simulation of nozzle B. The bulk tension factor for this case was 1.025. This value
was obtained through testing different bulk tension factor. For nozzle С simulation, the bulk
tension factor was equal to 1.01. For all three cases, the droplet radius distribution obtained
from simulation has a poor agreement with experimental data.

48
Figure 5.12. Pressure distribution and droplet radius along the centreline of nozzle A compared to
experimental data
Figure 5.13. Pressure distribution and droplet radius along the centreline of nozzle B compared to
experimental data
0,00E+00
1,00E-08
2,00E-08
3,00E-08
4,00E-08
5,00E-08
6,00E-08
0,00
0,10
0,20
0,30
0,40
0,50
0,60
0,70
0,80
-0,10 0,00 0,10 0,20 0,30 0,40 0,50
r, [
m]
P/P
tot
Distance from throat, [m]
Pressure (Numerical Simulation) Pressure (Experiment)
Droplet Radius (Numerical Simulation) Droplet Radius (Experiment)
0,00E+00
2,00E-08
4,00E-08
6,00E-08
8,00E-08
1,00E-07
1,20E-07
0,00
0,10
0,20
0,30
0,40
0,50
0,60
0,70
0,80
-0,10 -0,05 0,00 0,05 0,10 0,15 0,20 0,25 0,30 0,35 0,40 0,45 0,50
r, [
m]
P/P
tot
Distance from throat, [m]
Pressure (Numerical Simulation) Pressure (Experiment)
Droplet Radius (Numerical Simulation) Droplet Radius (Experiment)

49
Figure 5.14. Pressure distribution and droplet radius along the centreline of nozzle C compared to
experimental data
In Figure 5.12, Figure 5.13, and Figure 5.14, it can be noticed that at the nozzle axis of about
x = 0.13, x = 0.14 and x = 0.22, respectively, the pressure growth called the condensation
shock appears. In the nozzle B and nozzle C simulations, it is captured quite good. This
pressure growth which also can be seen in Figure 5.15 (a), Figure 5.16 (a), and Figure 5.17
(a), is caused by heat released due to the condensation process. As the temperature increases
by the result of a latent heat release from liquid droplets to the vapour phase, the local speed
of sound rises as well. As a result, the flow velocity decreases which can be seen from the
drop in Mach number in condensation zone in Figure 5.15 (b), Figure 5.16 (b), and Figure
5.17 (b) for appropriate bulk tension factors. The intensity of the shock wave directly
depends on pressure jump magnitude: the greater the pressure increment, the higher the
shock wave intensity.
0,00E+00
2,00E-08
4,00E-08
6,00E-08
8,00E-08
1,00E-07
1,20E-07
1,40E-07
1,60E-07
0,00
0,10
0,20
0,30
0,40
0,50
0,60
0,70
0,80
-0,10 0,00 0,10 0,20 0,30 0,40 0,50
r, [
m]
P/P
tot
Distance from throat, [m]
Pressure (Numerical Simulation) Pressure (Experiment)
Droplet Radius (Numerical Simulation) Droplet Radius (Experiment)

50
Figure 5.15. Nozzle A contours of (a) the pressure and (b) the Mach number predicted with different
bulk tension factors

51
Figure 5.16. Nozzle B contours of (a) the pressure and (b) the Mach number predicted with
different bulk tension factors

52
Figure 5.17. Nozzle C contours of (a) the pressure and (b) the Mach number predicted with different
bulk tension factor

53
Figure 5.18, Figure 5.19, and Figure 5.20 present the results of simulation nozzles A, B and
C, correspondently, for various bulk tension factors. As it was mentioned above, the quality
of the nucleation and the droplet growth theories significantly influence the accuracy of
condensing flow models. The nucleation rate is a function of bulk tension factor, as it can be
seen in Eq. (3.5). As shown in Figure 5.18, Figure 5.19, and Figure 5.20, the higher bulk
tension factor causes the later start of the condensation process.
At the inlet of the nozzle where the supersaturation ratio is lower than 1, the steam is dry and
superheated. When the steam expands in a nozzle and becomes closer to the saturation line,
the supersaturation ratio tends to 1. But even steam crossed the saturation line, the nucleation
does not start until the supersaturation ratio will be large enough. Supersaturation ratio
continues to increase, and the flow goes to the nucleation zone. In this zone, the droplets of
critical size r* start to form. As shown in Figure 5.18 (d), Figure 5.19 (d), and Figure 5.20
(d), the highest nucleation rate is achieved in the Wilson point, where subcooling becomes
larger than its maximum. Supersaturation decreases by cause of the release of latent heat
which leads to nucleation rate drop. This phenomenon can be illustrated by a pressure rise
in Figure 5.18 (a), Figure 5.19 (a), and Figure 5.20 (a). The subcooling level also falls due
to heat released during condensation which is shown in Figure 5.18 (e), Figure 5.19 (e), and
Figure 5.20 (e). The liquid mass fraction, presented in Figure 5.18 (b), Figure 5.19 (b), and
Figure 5.20 (b), continue to rise due to droplets starts to form more rapidly and the flow
enters the condensation zone (Mccallum & Roland 1999, 1816). The number of droplets
remains almost the same (see Figure 5.18 (c), Figure 5.19 (c), and Figure 5.20 (c)), but the
droplets increase in size by cause of condensation occurring on them. As a result, the wetness
grows. Droplets do not form any more after the spontaneous condensation has taken place
(Pandey 2014, 37).
The following bulk tension factor effects can be noticed. The higher bulk tension factor
provides a higher level of subcooling, as shown in charts. As it was mentioned before, higher
bulk tension factor delays the onset of condensation. Consequently, the nucleation rate starts
to grow in downstream of the nozzle in comparison with the case with lower bulk tension
factor. The pressure jump also occurs farther away from the throat. However, the nucleation

54
rate is much lower in case of higher bulk tension factor. As a result, droplet number and
wetness mass fraction are reduced too.
Figure 5.18. Simulation results of the (a) pressure ratio, (b) wetness fraction, (c) nucleation rate,
(d) droplet number, and (e) supercooling along the nozzle A centreline.

55
Figure 5.19. Simulation results of the (a) pressure ratio, (b) wetness fraction, (c) nucleation rate,
(d) droplet number, and (e) supercooling along the nozzle B centreline.

56
Figure 5.20. Simulation results of the (a) pressure ratio, (b) wetness fraction, (c) nucleation rate,
(d) droplet number, and (e) supercooling along the nozzle C centreline.

57
The contours of the vapour mass fraction and the nucleation rate predicted with different
bulk tension factors for nozzles A, B and C are shown in Figure A.1, Figure A.2, and Figure
A.3 in Appendix A. It is captured that for larger bulk tension factor, nucleation rate starts to
grow closer to the nozzle outlet. The moisture of flow also becomes higher at the outlet of
the nozzle, but the flow remains dryer for a long time while going through the nozzle. The
greater bulk tension factor also leads to wider nucleation zone, but less intensity of
nucleation rate.
Figure A.4, Figure A.5, and Figure A.6 present the droplet diameter and the droplet number
contours predicted with different bulk tension factors for nozzle A, B, and C. According to
these results, the size of droplets grows with the rise of bulk tension factors, and in contrast,
the number of droplets decreases with increasing bulk tension factor. For the smaller value
of bulk tension factor (σbulk < 1.1) the droplets form mainly near the walls of the nozzles,
while for larger bulk tension factor (σbulk > 1.1) the droplet forming prevalent in the nozzle
centre. It can be seen from the droplet number contour in Figure A.4 (b), Figure A.5 (b), and
Figure A.6 (b). The width of the nozzle also affects the location of condensation onset. In
nozzle C, which is wider, the nucleation rate starts to increase more later (closer to the exit
of the nozzle) than in nozzle A or B. As a result, droplet number, wetness and pressure begin
to rise farther away from the throat as well.
5.2 Barschdorff nozzle
In the present study, the first test case of Baschdorff experiment was simulated. Boundary
conditions were highlighted in section 4.2.
Figure 5.21 present the pressure ratio and droplet radius along the centreline of the nozzle.
As can be seen, the pressure distribution captured quite accurate in this simulation.
According to available experimental data of droplet radius, the distribution obtained from
simulation also is close to the experiment, but one experimental point is not sufficient for
conclusions. The bulk tension factor for this simulation was 1.085. The series of test
simulation was conducted to establish the flow parameters dependence on the bulk tension

58
factor. The physical processes described in 5.1.2 have taken place in these simulations as
well.
In Figure 5.22, the results of Baschdorff nozzle predicted with different bulk tension factors
are shown. As it can be noticed from Figure 5.22 (a), the pressure rise called “condensation
shock”, occurs closer to the outlet of the nozzle with higher bulk tension factor. At the same
time, this pressure jump begins to be less rapid with rising bulk tension factor, and the
pressure curve becomes smoother. From Figure 5.22 (c) can be mentioned that Wilson point
“goes” downstream with increasing bulk tension factor, as the peaks of nucleation rates are
achieved further from the nozzle throat. As a result, the liquid mass fraction (Figure 5.22
(b)) and the number of droplets (Figure 5.22 (d)) become lower as well. The subcooling level
is higher for a larger value of bulk tension factor (Figure 5.22 (e)).
Figure 5.21. Pressure distribution and droplet radius along the Barschdorff nozzle centreline
compared to experimental data
Figure 5.23 presents the (a) pressure and the (b) Mach number contours of the Barschdorff
nozzle. In Figure 5.23 (a) it can be mentioned that lower bulk tension factor provides a higher
peak of pressure. The flow slows down in this region which has an impact on the Mach
0,00E+00
1,00E-08
2,00E-08
3,00E-08
4,00E-08
5,00E-08
6,00E-08
7,00E-08
8,00E-08
9,00E-08
0,00
0,10
0,20
0,30
0,40
0,50
0,60
0,70
0,80
0,90
-0,13 -0,08 -0,03 0,02 0,07
r, [
m]
P/P
tot
Distance from throat, [m]
Pressure (Numerical Simulation) Pressure (Experiment)
Droplet Radius (Numerical Simulation) Droplet Radius (Experiment)

59
number (Figure 5.23 (b)). The Mach number drop is larger for larger pressure rise and,
consequently, lower bulk tension factor.
Figure 5.22. Simulation results of the (a) pressure ratio, (b) wetness fraction, (c) nucleation rate, (d)
droplet number, and (e) supercooling along the nozzle A centreline.

60
Figure 5.23. Barschdorff contours of (a) the pressure and (b) the Mach number predicted with
different bulk tension factor

61
In Appendix A there is a Figure A.7 which represent the vapour mass fraction and the
nucleation rate predicted with different bulk tension factors. The character of contours for
both vapour mass fraction and nucleation rate is the same. Liquid mass fraction and
nucleation rate start to increase further from the throat of the nozzle for higher bulk tension
rate. However, the values of vapour mass fraction and nucleation decrease very
monotonically with rising bulk tension factor.
Figure A.8 shows the droplet diameter and the droplet number predicted with different bulk
tension factors. Droplet diameter becomes larger if the bulk tension factor higher, but the
region of “large” droplet, in contrast, is getting smaller. For σbulk >1.1 this zone presents a
small dot immediately after the nozzle throat. With the rising of bulk tension factor, more
than 1.1 this region becomes wider. The droplet number monotonically decrease for bulk
tension factor from 0.95 to 1.2 and the region of forming of droplets shifts downstream.
5.3 Bulk tension factor selection
In this section, the recommended value of the bulk tension factor is discussed. To analyse
the variation of bulk tension factor depending on the nozzle parameters and boundary
conditions, results of all the models were compared with each other.
Firstly, Barschdorff (1971) nozzle was considered. The second test case was implemented
to investigate the relationship between bulk tension factor and total temperature at the inlet.
In the second experiment of Barschdorff, the same nozzle was used as in the first case,
therefore, there is no influence of nozzle geometry on the bulk tension factor value.
Figure 5.24 presents the ratio of pressure to total pressure depending on the distance from
the nozzle throat for both test cases. The first test case was discussed in section 5.2. The bulk
tension factors for T1 = 380.50 K and T1 = 373.11 K were 1.085 and 1.075, respectively. It
can be noticed that for T1 = 373.11 K the location of condensation shock is captured accurate,
but the pressure rise is smaller in comparison with experimental data. According to these
results, the lower bulk tension factor correlates with the early onset of the condensation

62
process and lower inlet total temperature. Besides, if condensation shock appears earlier than
the pressure jump is higher.
Figure 5.24. Pressure distribution along the Barschdorff nozzle centreline compared to experimental
data for T1 = 380.50 K and T1 = 373.11 K
Figure 5.25 presents droplet number, vapor mass fraction, nucleation rate and Mach number
for (a) first test case (T1 = 380.50 K) and (b) second test case (T1 = 373.11 K). The higher
droplet number and the nucleation rate correspond to the higher bulk tension factor and the
higher inlet total temperature. Furthermore, the vapour mass fraction at the outlet of the
nozzle is higher in case of delay onset of spontaneous condensation. According to Mach
number contours, the flow velocity at the outlet is higher for the more upstream location of
the start of condensation.

63
Figure 5.25. Droplet number, vapor mass fraction, nucleation rate and Mach number for Barschdorff
(1971) (a) first test case (T1 = 380.50 K) and (b) second test case (T1 = 373.11 K).
In the following part of the present section, Moore et al. (1973) nozzles were compared.
Table 4 present the parameters of nozzles A, B and C and corresponding bulk tension factors.
According to this table, there is a relationship between geometrical parameters of nozzles
and bulk tension factor value. It can be observed that the larger the diameter of the throat
and outlet of the nozzle are, the lower is the bulk tension factor.
As it was shown above, there is linear proportionality between inlet total temperature and
bulk tension factor, but it is also can be noticed that in Moore et al. (1973) nozzle simulation,
even though temperature rises the bulk tension factor drops. The reason can be in a small

64
temperature difference (2 K on average), wherein the bulk tension dependence on geometry
is higher than the relationship with temperature.
Table 4. Correlation between Moore et al. (1973) nozzle parameters and bulk tension factor values.
Nozzle A B C
Bulk tension factor 1.100 1.025 1.010
Throat/outlet diameter, mm 63/114 100/144 120/150
Inlet temperature / total pressure, К / kPa 354.6/25 358.6/25 359.11/25

65
6 CONCLUSION
During working of the last stages of the LP steam turbine, the steam intersection of saturation
line leads to the appearance of liquid fraction. LP turbine operation on two-phase flow causes
erosion of blades and thermodynamic and aerodynamic losses. Comprehensive
understanding of condensing phenomena optimizes the design of steam turbines and results
in more effective utilizing of steam in the power generation cycle. The significant number
of various theoretical, experimental, and numerical studies were conducted to extend
existing knowledge in the field of non-equilibrium condensing steam flow. Considerable
contribution in investigation of condensing flow was done by several researchers who
carried out experiments on nozzles, single and multi-stage turbine cascades. Nevertheless,
the accurate measurement of non-equilibrium condensing steam flow is quite complex. But
due to the availability of these studies, numerical research of condensing phenomena is
possible. As shown in the literature survey, CFD modelling is becoming more accessible and
applicable for optimization of steam turbines in the last decades.
In the present thesis, the Eulerian-Eulerian approach was performed to solve the wet steam
flow in CD nozzles. The CNT underlies in the principle of modelling the condensing flow
in this work. The two-phase flow was calculated with the IAPWS library. Moore et al. (1973)
and Barschdorff (1971) supersonic nozzles were used for analysing of steam flow to achieve
the goals of the present study. The results of the simulation were compared to experimental
data available in open sources. Analysis of obtained results showed that the implemented
model provided expected characteristics of condensing steam flow. The condensation model
is physically accurate and has a good agreement with experimental data. In the study, it is
shown that the location and intensity of condensation shock can be predicted by the model
quite precise.
The crucial role of bulk tension factor in model accuracy is also noticed. As it was mentioned
in sections 5.1.2 and 5.2, it was quite important to select correct bulk tension factor to
achieve the accurate prediction of pressure distribution along the nozzle centerline. In some
cases (Figure 5.13 and Figure 5.21), this value was applied with 10-3 target. The variation of

66
bulk tension factor causes the shift of condensation shock location and changing in
nucleation rate intensity, droplet number and the overall amount of moisture in the nozzle.
There is no universal value of bulk tension factor for any nozzle, but there is a correlation
between bulk tension factor and size of the nozzle and inlet total temperature. In practical
CFD modelling, it is reasonable to use lower bulk tension factor for nozzles with a large
throat. In the case of higher inlet temperature, the higher bulk tension factor should be
selected. The geometry significantly affects the bulk tension factor selection.
The present study is a simple and effective way to investigate the condensing flow and
research the effect of surface tension on the wet steam flow. The extension of this work can
be in the development of turbine stator cascade and single or multi-stage turbine models.
Study of bulk tension effect on the flow in more complex domains can be interesting and
may lead to more valuable conclusions. Implementation of a particle tracking model can also
provide some new data for future studies.

67
REFERENCES
Barschdorff, D., 1971. Verlauf der Zustandsgrossen und gasdynamische
Zusammenhaenge der spontanen Kondensation reinen Wasserdampfes in Lavalduesen.
Forsch, Ingenieurwes, vol. 37, no. 5, pp. 146–157.
Bartoš, O., Kolovratník, M., Šmíd B., Hrubý, J., 2016. Experimental research of
heterogeneous nuclei in superheated steam. EPJ Web of Conferences 114, 02002.
Available at: https://doi.org/10.1051/epjconf/201611402002
Becker, R., Döring, W., 1935. Kinetische Behandlung der Keimbildung in übersättigten
Dämpfen. Ann. Phys., vol. 416, no. 8, pp. 719-752. Available at:
https://doi.org/10.1002/andp.19354160806
Bian, J., Cao, X., Yang, W., Song, X., Xiang, C., Gao, S., 2019. Condensation
characteristics of natural gas in the supersonic liquefaction process. Energy, vol. 168, pp.
99–110. Available at: https://doi.org/10.1016/j.energy.2018.11.102
Burton, Z., 2014. Analysis of Low Pressure Steam Turbine Diffuser and Exhaust Hood
Systems. PhD thesis, Durham University. 163 p. Available at:
http://etheses.dur.ac.uk/10531/
Eberle, T., Schatz, M., Starzmann, J., Grubel, M., Casey, M., 2014. Experimental study
of the effects of temperature variation on droplet size and wetness fraction in a low-
pressure model steam turbine. Proc IMechE Part A: J Power and Energy, vol. 228(1), pp.
97–106
Farkas, L., 1927. Z. Phys. Chem., 125, 236.
Frenkel, J., 1946. Kinetic theory of liquids. Oxford University Press, New York

68
Fuhrer C., Grübel M., Vogt, D. M. 2019. A generic low-pressure steam turbine test case
for aeromechanics and condensation. Proceedings of the Institution of Mechanical
Engineers, Part A: Journal of Power and Energy, vol. 233, no 7, pp. 953-958. Available
at: https://doi.org/10.1177/0957650919833207
Gerber, A., 2002. Two-phase Eulerian-Lagrangian model for nucleating steam flow.
ASME J. Fluids Eng., vol. 124, no 2, pp. 465-475. Available at:
https://doi.org/10.1115/1.1454109
Gerber, A., Kermani, M., 2004. A pressure based Eulerian-Eulerian multiphase model for
non-equilibrium condensation in transonic steam flow. International Journal of Heat and
Mass Transfer, vol. 47, no 10-11, pp. 2217-2231. Available at:
https://doi.org/10.1016/j.ijheatmasstransfer.2003.11.017
Giacomelli, F., Mazzelli, F., Milazzo, A., 2017. CFD modelling of the condensation
inside a cascade of steam turbine blades: comparison an experimental test case. Energy
Procedia, vol. 126, 201709, pp. 730–737.
Gibbs, J., 1906. Scientific papers of Josiah Willard Gibbs. Vol. 1. Longmans Green,
London.
Guha, A. 1997. Analysis and computation of non-equilibrium two-phase flows. Sadhana,
vol. 22, pp. 295–321
Gyarmathy, G., 1962. Grundlagen einer Theorie der Nassdampfturbine, Diss. Techn.
Wiss. Nr. 3221, Ref.: W. Traupel, Korref.: J. Ackeret. Zürich, ETH Zürich.
Gyarmathy, G., 1976. Condensation in flowing steam. A von Karman Institute Book on
Two-Phase Steam Flow in Turbines and Separators, Hemisphere, London, pp. 127-189.

69
Gyarmathy, G., Lesch, F., 1969. Fog droplet observations in Laval nozzles and in an
experimental turbine. Proc. Instn Mech. Engrs, 184, (3G), pp. 88–95.
Halama, J., Fort, J., 2012. Numerical simulation of steam condensation in a nozzle. EPJ
Web of Conferences 25, 01020. Available at:
https://doi.org/10.1051/epjconf/20122501020
Han, Z., Han, X., Wang, Z., 2017. Numeric simulation of wet‑steam two‑phase
condensing flow in a steam turbine cascade. J Braz. Soc. Mech. Sci. Eng., vol. 39, pp.
1189–1199. Available at: https://doi.org/10.1007/s40430-016-0655-y
Hasini, H., Yusoff, M. Z., Malek, N. A., 2012. Numerical Modeling of Wet Steam Flow
in Steam Turbine Channel. Mechanical Engineering, pp. 443-462. Available at:
https://doi.org/10.5772/37394
Hughes, F. R., Starzmann, J., White, A. J., 2018. Nucleation and wake-chopping in low
pressure steam turbines. Proc IMechE Part A: J Power and Energy, vol. 232(5), pp. 490–
500
Ju, F., Yan, P., Han, W., 2012. Numerical investigation on wet steam non-equilibrium
condensation flow in turbine cascade. Journal of Thermal Science, vol. 21, no 6, pp.
525−532. Available at: https://doi.org/10.1007/s11630-012-0577-7
Kim, C. H., Park, J. H., Ko, D. G., Kim, D. I., Kim, Y.S., Baek, J. H., 2015. Analysis on
steam condensing flow using non-equilibrium wet-steam model. J. Comput. Fluids Eng.
vol. 20, no. 3, pp.1-7.
Kornet S., Badur J., 2014. Comparison of two models of condensation. PhdD
Interdisciplinary Journal, pp. 193-203.

70
Lai, D.-S., Kadambi, J. 1993. Generation of Monodisperse Droplets by Spontaneous
Condensation of Flow in Nozzles. Final Technical Report Nasa Grant Nag 3-831. 168 p.
Lee, J.-C., Rusak, Z., 2001. Transonic flow of moist air around a thin airfoil with
equilibrium condensation. Journal of Aircraft, vol. 38, no. 4, pp. 693-702. Available at:
https://www.researchgate.net/publication/245430019
Luijten, C. C. M., 1999. Nucleation and Droplet Growth at High Pressure. PhD Thesis,
Technical University of Eindhoven, 196 p.
Majkut, M., Dykas, S., Strozik, M., Smołka, K., 2014. Experimental and numerical study
on condensation in transonic steam flow. Conference paper. Available at:
https://doi.org/10.1515/eng-2015-0035
Mccallum, M., Roland, H. 1999. The flow of wet steam in a one-dimensional nozzle.
International Journal for Numerical Methods in Engineering, vol. 44, no. 12, pp. 1807-
1821. Available at: https://doi.org/10.1002/(SICI)1097-
0207(19990430)44:12<1807::AID-NME563>3.0.CO;2-Z
Moore, M. J., Walters, P. T., Crane, R. I., Davidson, B. J., 1973. Predicting the fog drop
size in wet-steam turbines. Warwick, s.n.
Moses, C. A., Stein, G. D., 1978. On the growth of steam droplets formed in a Laval
nozzle using both static pressure and light scattering measurements. J. Fluids Eng., vol.
100, pp. 311–322.
Pandey, A. 2014. Numerical Modeling of Non-Equilibrium Condensing Steam Flows.
MS thesis, Delft University of Technology. 56 p.

71
Patel, Y., 2016. Computational modelling of non-equilibrium condensing steam flows in
low-pressure steam turbines. PhD thesis, Lappeenranta University of Technology. 162 p.
ISBN 978-952-265-975-0
Senguttuvan, S., Lee, J.-C., 2019. Numerical study of wet-steam flow in Moore nozzles.
Journal of Mechanical Science and Technology, vol. 33, no. 10, pp. 4823–4830.
Available at: https://doi.org/10.1007/s12206-019-0923-8
Šťastný, M., Pekárek, K., 2018. Losses connected with steam condensation in turbine
cascades. AIP Conf. Proc. 2047, 020022-1–020022-8. Available at:
https://doi.org/10.1063/1.5081655
Stodola, A., 1915. Undercooling of steam in nozzles. Engineering, pp. 643–646.
Utkilen, H., Balakin, B., Kosonski, P. 2014. Numerical study of dust lifting using the
EulerianeEulerian approach. Journal of Loss Prevention in the Process Industries, vol. 27,
no 1, pp. 89-98. Available at: https://doi.org/10.1016/j.jlp.2013.11.009
Volmer, M. 1926. Kinetik der Phasenbildung. Steinkopf Verlag, Dresden, Leipzig.
Volmer, M., Weber, A., 1926. Z. Phys. Chem. A, vol. 119, 277-301
Wilhelm, D. J., 1964. Condensation of Metal Vapors: Mercury and the Kinetic Theory of
Condensation. PhD thesis, United States, 159 p.
White, A. J, Young, J. B., 1993. Time-marching method for the prediction of two-
dimensional, unsteady flows of condensing steam. AIAA Jl Propuls. Power 9, pp. 579-
587.

72
White, A. J, Young, J. B., Walters, P. T., 1996. Experimental validation of condensing
flow theory for a stationary cascade of steam turbine blades. Phil. Trans. R. Soc. Lond.
A. 354, pp. 59–88. Available at: https://doi.org/doi:10.1098/rsta.1996.00036.
Young, J. B., 1982. The spontaneous condensation of steam in supersonic nozzles.
Physico Chemical Hydrodynamics, vol. 3, pp. 57–82.
Young, J. B., 1992. Two-Dimensional, Nonequilibrium, Wet-Steam Calculations for
Nozzles and Turbine Cascades. Journal of Turbomachinery, vol. 114, no. 3, pp. 569-579.
Zeldovich, J., 1942. Theory of the formation of a new phase. J. Expl. Theoret. Physics,
Vol. 12, p. 525

73
APPENDIX A
This section provides the simulation results of some specific parameters. The discussion
of these results was conducted in sections 5.1.2 and 5.2.
Figure A.1, Figure A.2, and Figure A.3 present the contours of the vapour mass fraction
and the nucleation rate predicted with different bulk tension factors for Moore et al.
(1973) nozzles A, B, and C, respectively. The droplet diameter and the droplet number
predicted with different bulk tension factors for Moore et al. (1973) nozzles A, B, and C
are shown in Figure A.4, Figure A.5, and Figure A.6, correspondently.
Figure A.7 represents the vapour mass fraction and the nucleation rate contours predicted
with different bulk tension factors for Barschdorff (1971) nozzle. Figure A.8 shows the
droplet diameter and the droplet number contours predicted with different bulk tension
factors for Barschdorff (1971) nozzle.

74
Figure A.1. Nozzle A contours of the (a) vapour mass fraction and the (b) nucleation rate
predicted with different bulk tension factors

75
Figure A.2. Nozzle B contours of the (a) vapour mass fraction and the (b) nucleation rate
predicted with different bulk tension factors
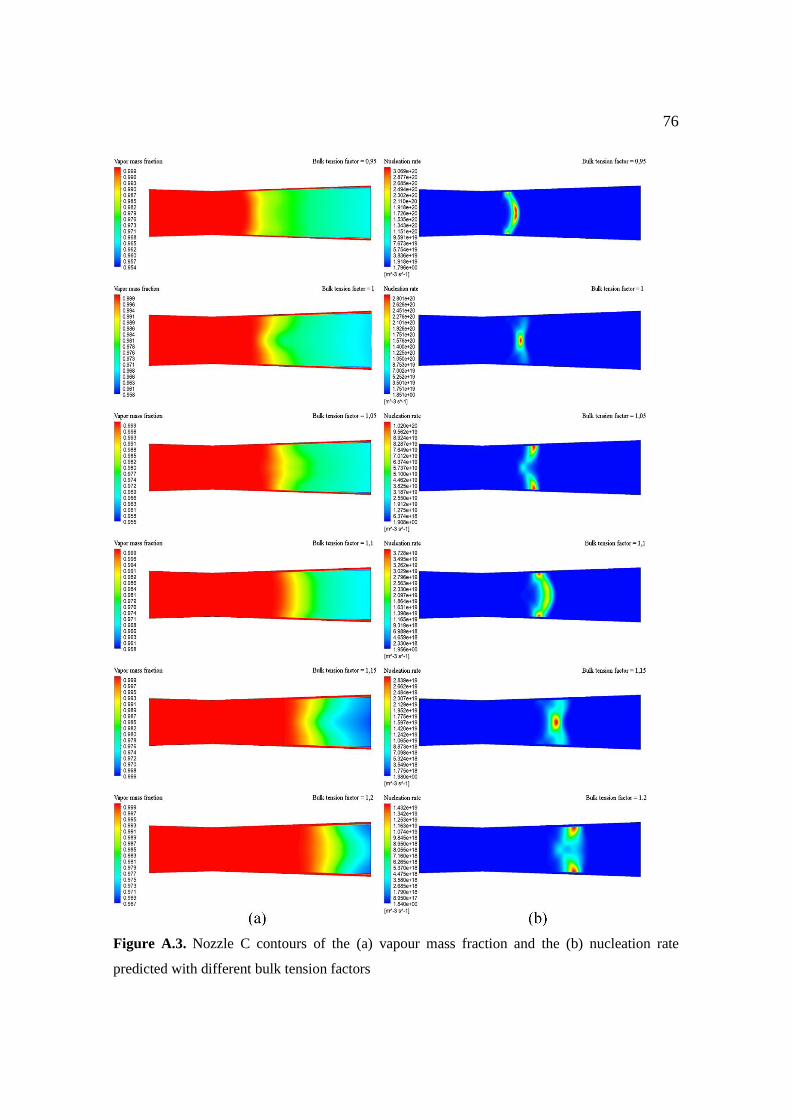
76
Figure A.3. Nozzle C contours of the (a) vapour mass fraction and the (b) nucleation rate
predicted with different bulk tension factors

77
Figure A.4. Nozzle A contours of the (a) droplet diameter and the (b) droplet number predicted
with different bulk tension factors

78
Figure A.5. Nozzle B contours of the (a) droplet diameter and the (b) droplet number predicted
with different bulk tension factors

79
Figure A.6. Nozzle C contours of the (a) droplet diameter and the (b) droplet number predicted
with different bulk tension factors

80
Figure A.7. Barschdorff nozzle contours of the (a) vapour mass fraction and the (b) nucleation
rate predicted with different bulk tension factors

81
Figure A.8. Barschdorff nozzle contours of the (a) droplet diameter and the (b) droplet number
predicted with different bulk tension factors