large cap blend equity strategy jma large cap blend equity strategy performance june 30, 2004...
TRANSCRIPT

JMA
Large Cap Blend Equity Strategy
June 2004
JENNISON MANAGED ACCOUNTSA Division of Jennison Associates LLC

JMA
Investment Strategy & Process
2JMA
To outperform the S&P 500 Index over the long term by investing in a portfolio that has earnings growth greater than the index.
Large Cap Blend Investment Objective
3JMA
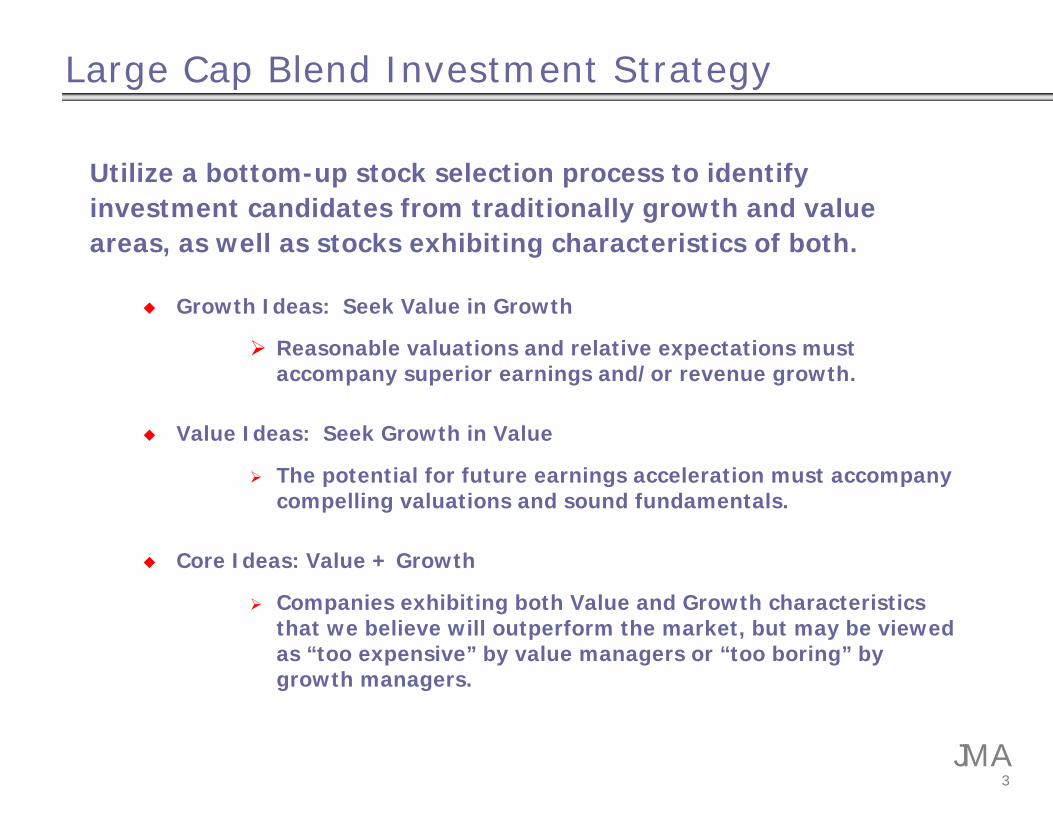
Utilize a bottom-up stock selection process to identify investment candidates from traditionally growth and value areas, as well as stocks exhibiting characteristics of both.
Growth Ideas: Seek Value in Growth
Reasonable valuations and relative expectations must accompany superior earnings and/or revenue growth.
Value Ideas: Seek Growth in Value
The potential for future earnings acceleration must accompany compelling valuations and sound fundamentals.
Core Ideas: Value + Growth
Companies exhibiting both Value and Growth characteristics that we believe will outperform the market, but may be viewed as “too expensive” by value managers or “too boring” by growth managers.
Large Cap Blend Investment Strategy

4JMA
Stock Selection Drives Investment Process
Bottom-up Stock Picking
Fundamental research is key to stock selection
The investment decision-making process is interactive
Daily morning meeting
Meetings and calls with company and external contacts
Large Cap Blend Investment Process
5JMA
Team of highly experienced analysts
Large Cap Blend universe of 900 companies
Regular meetings with company managements
Leverage insights from Wall Street
Portfolio Manager makes final investment decision, with benefit of input from all Equity Professionals
Fundamental Research Key to Stock Selection
6JMA
Bottom-up Approach
“Right Stock is the Most Important Factor”
Superior management
Strong market position
Unique marketing ability
Outstanding research & development
Global leadership
Large Cap Blend Buy Discipline

7JMA
GrowthGrowth
Qualitative Screening
Value Value
Favorable P/E ratio vs Projected
Growth Rates
Improving:Profitability &/or sales & earnings
growth
Low Price to Sales Significant
earnings stability
Low Price to Book Value
Above Average earnings & revenue
growth
Strong management teams
Unique Marketing Competence
Consistent track records
Strong research& development
Return on equity
Large Cap Blend
Stock Selection Criteria (Buy Discipline)
Financial Discipline

8JMA
Generally stocks may be sold or positions trimmed if we believe:
Company and/or industry fundamentals are deteriorating
Valuation becomes excessive
Security and/or sectors become too large relative to potential appreciation
Outlook no longer seems promising
A more attractive stock emerges
Large Cap Blend Sell Discipline

9JMA
Jeffrey P. SiegelExecutive Vice President, Portfolio Manager
19 Years of Experience
Joined Jennison in 1999
B.A., Rutgers University
Large Cap Blend Portfolio Manager

10JMA
Ted BrindisiPortfolio Advisor
35 Years of Experience
B.B.A. and M.B.A. Bernard Baruch College
Portfolio Advisors
Abhi KamerkarPortfolio Advisor
14 Years of Experience
B.A. (Economics) and M.B.A. (Finance) Rutgers University
11JMA
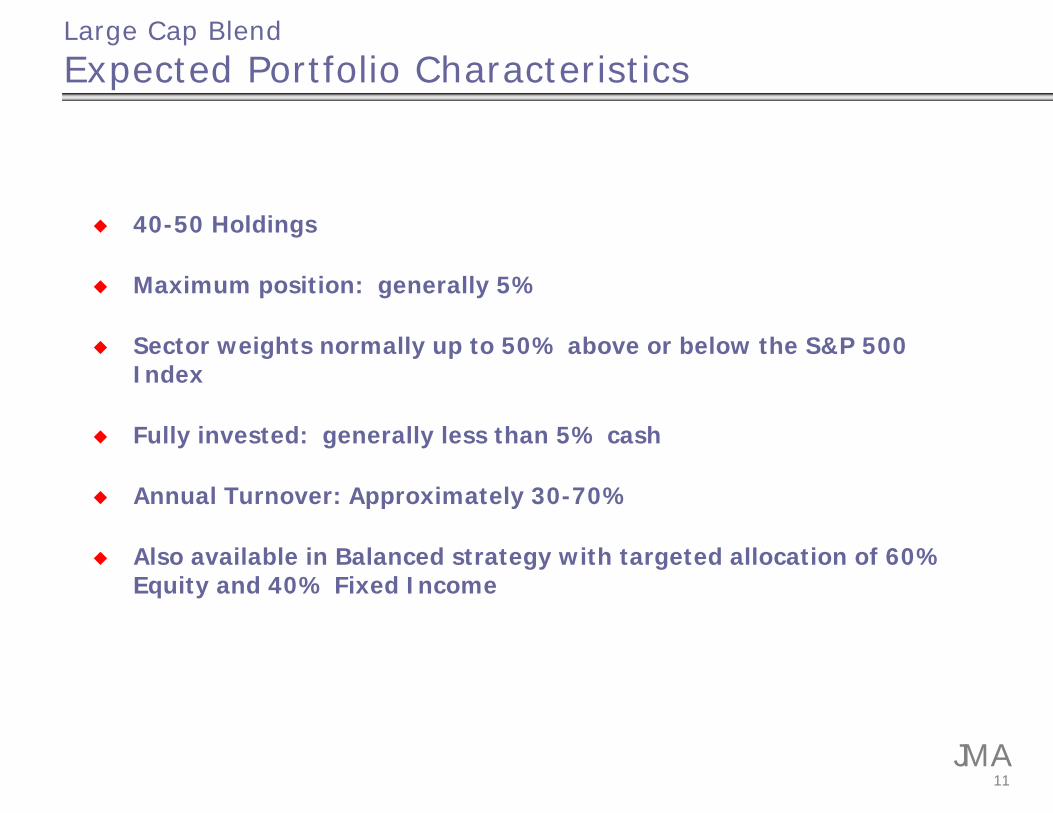
40-50 Holdings
Maximum position: generally 5%
Sector weights normally up to 50% above or below the S&P 500 Index
Fully invested: generally less than 5% cash
Annual Turnover: Approximately 30-70%
Also available in Balanced strategy with targeted allocation of 60% Equity and 40% Fixed Income
Large Cap Blend
Expected Portfolio Characteristics

12JMA
Balanced Option Lowers Total Portfolio Risk
Fixed Income target allocation is 40%35% to 45% range
High quality focus with U.S. government and agency securities (AAA Rated)
Strategic yield curve positioning to add incremental value
Maximum final maturity of all holdings is 10 years
JMA
Performance

14JMA
Large Cap Blend Equity Strategy PerformanceJune 30, 2004
*Inception date of Jennison’s portfolio management.Source for performance: Prudential Investments. Net performance reflects the deduction of actual program fees. Actual fees may vary depending on, among other things, the applicable fee schedule and portfolio size. Past performance does not guarantee future results. See Notes to Presentation 1 and 3.
2Q 2004 YTD 1 Year 3 Year Since
9/30/2000*
Gross 0.91% 1.60% 20.65% -2.42% -7.65%
Net 0.32 0.44 17.92 -4.73 -9.84
Russell® 1000 Index 1.40 3.33 19.48 -0.32 -4.65
S&P 500 Index 1.72 3.44 19.10 -0.69 -4.48

15JMA
Large Cap Blend Balanced Strategy PerformanceJune 30, 2004
*Inception date of Jennison’s portfolio management.Source for performance: Prudential Investments. Net performance reflects the deduction of actual program fees. Actual fees may vary depending on, among other things, the applicable fee schedule and portfolio size. Past performance does not guarantee future results. See Notes to Presentation 2 and 3.
2Q 2004 YTD 1 Year 3 Year Since
9/30/2000*
Gross -0.31% 0.95% 12.09% 1.89% -0.40%
Net -0.89 -0.24 9.46 -0.49 -2.71
60/40 Russell® 1000/LB Int. Gov. -0.08 1.94 11.27 2.72 0.37
60/40 S&P 500/LB Int. Gov. 0.11 2.01 11.06 2.48 0.46

JMA
Portfolio Characteristics

17JMA
%
19
6
17
13
23
6
9
5
0 0
3
11 1113
20
17
11
7
3 3 3
00
5
10
15
20
25
30
ConsumerDiscretion.
ConsumerStaples
Health Care Financials InformationTech.
Industrials Energy Materials Telecomm.Services
Utilities Cash
Portfolio Sector AllocationAs of June 30, 2004
See Notes to Presentation 4 and 5.
S&P 500 Index
Large Cap Blend Equity Strategy Model Portfolio

18JMA
Starbucks Corporation 3.5%Cisco Systems, Inc. 3.4Pfizer Inc. 3.3Yahoo! Inc. 3.2Intel Corporation Citigroup Inc. 3.0Merrill Lynch & Co., Inc. 3.0eBay Inc. 2.8Citigroup Inc. 2.7American Express Company 2.5Amgen Inc. 2.5
Total 29.9%
Largest Equity HoldingsAs of June 30, 2004
% of Model Portfolio
See Notes to Presentation 6.
19JMA
231917 16
0
10
20
30
40
2004E 2005E
See Notes to Presentation 4 and 7.
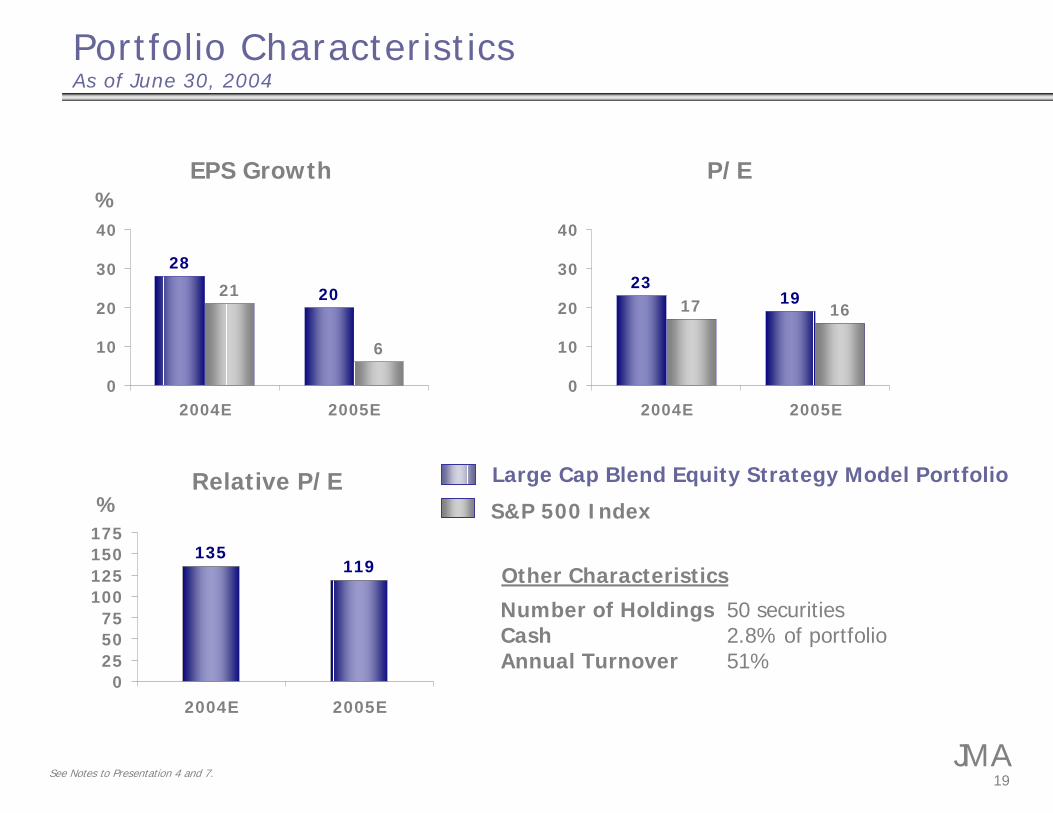
Portfolio CharacteristicsAs of June 30, 2004
EPS Growth P/E
Relative P/E
28
2021
6
0
10
20
30
40
2004E 2005E
%
S&P 500 Index
Large Cap Blend Equity Strategy Model Portfolio
135119
0255075
100125150175
2004E 2005E
%
Other Characteristics
Number of HoldingsCashAnnual Turnover
50 securities2.8% of portfolio51%
JMA
Summary

21JMA
“Growth In Value & Value In Growth”
Large Cap Blend Equity Strategy

22JMA
S&P Barra Value / S&P Barra Growth Relative Performance
1.0
1.2
1.4
1.6
1.8
2.0
74 76 78 80 82 84 86 88 90 92 94 96 98 00 02 04
VV VVVVVVGG GG GG
Value and Growth Perform in Cycles
Chart prepared by Jennison Associates LLC using information from Bloomberg. In order to construct the S&P 500 Barra Value and Growth Indices, companies are split into two groups based on price-to-book ratio to create growth and value indices. The Value index contains companies with lower price-to-book ratios, while the Growth index contains those with higher ratios. As of 6/30/04. See Notes to Presentation 4.

23JMA
-15%
-10%
-5%
0%
5%
10%
15%
20%
75 76 77 78 79 80 81 82 83 84 85 86 87 88 89 90 91 92 93 94 95 96 97 98 99 00 01 02 03
S&P BARRA Value minus Growth Quarterly Return Differences
Value Outperforms
Growth Outperforms
Value and Growth Performance Varies
Chart prepared by Jennison Associates LLC using information from Bloomberg. In order to construct the S&P 500 Barra Value and Growth Indices, companies are split into two groups based on price-to-book ratio to create growth and value indices. The Value Index contains companies with lower price-to-book ratios, while the Growth Index contains those with higher ratios. As of 6/30/04. See Notes to Presentation 4.
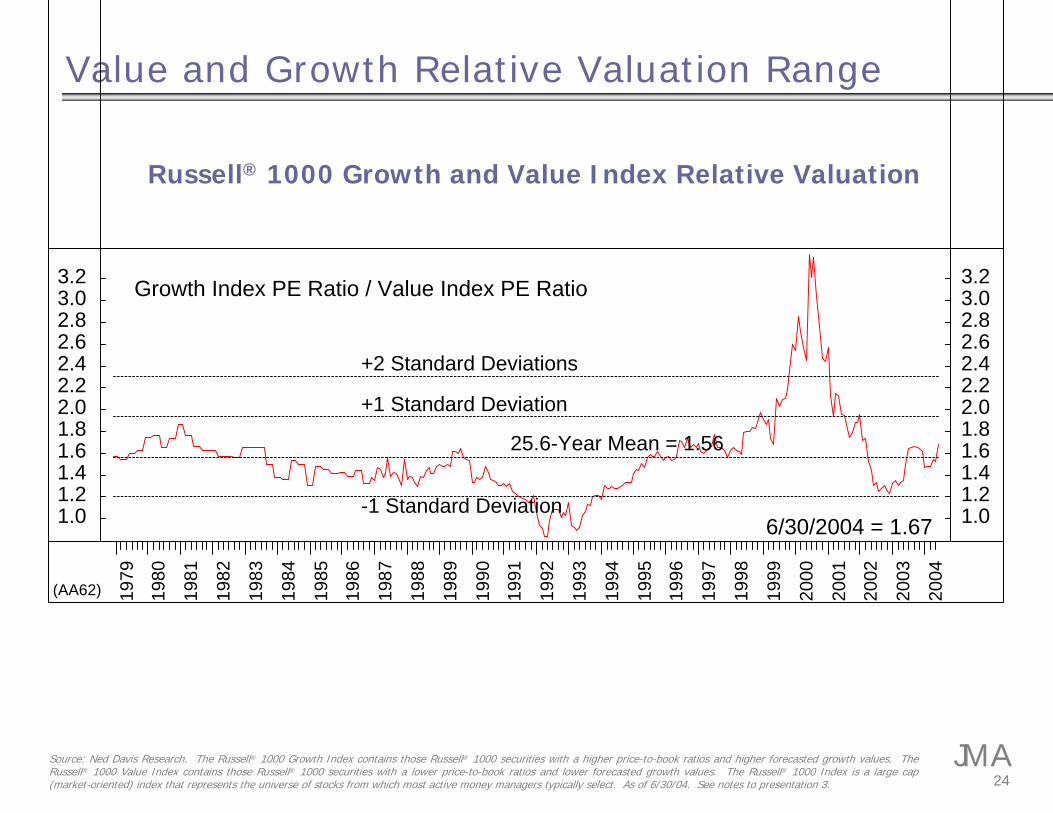
24JMASource: Ned Davis Research. The Russell® 1000 Growth Index contains those Russell® 1000 securities with a higher price-to-book ratios and higher forecasted growth values. The
Russell® 1000 Value Index contains those Russell® 1000 securities with a lower price-to-book ratios and lower forecasted growth values. The Russell® 1000 Index is a large cap (market-oriented) index that represents the universe of stocks from which most active money managers typically select. As of 6/30/04. See notes to presentation 3.
Value and Growth Relative Valuation Range
Russell® 1000 Growth and Value Index Relative Valuation
(AA62)
25.6-Year Mean = 1.56
+1 Standard Deviation
+2 Standard Deviations
-1 Standard Deviation
Growth Index PE Ratio / Value Index PE Ratio
6/30/2004 = 1.671.01.21.41.61.82.02.22.42.62.83.03.2
1.01.21.41.61.82.02.22.42.62.83.03.2
1979
1980
1981
1982
1983
1984
1985
1986
1987
1988
1989
1990
1991
1992
1993
1994
1995
1996
1997
1998
1999
2000
2001
2002
2003
2004

25JMA
Style diversification – Growth & Value
Access to attractive companies whose blend of growth and value characteristics may escape single-style managers
Access to experienced institutional portfolio management
Highly experienced, specialized blend equity team
Original Research
Selecting Jennison Large Cap Blend Equity

26JMA
Notes to Presentation1 The inception date of the Jennison Large Cap Blend strategy (formerly Prudential Investments Crossroads Equity) is July 1, 1995. Jennison became responsible for the portfolio management
of the Prudential Investments Large Cap Blend Strategy in September of 2000 pursuant to a transition of Prudential Financial's active public equity capabilities to Jennison. Performance forperiods since 9/30/2000 reflects returns generated solely by Jennison. The investment returns shown represent the historical performance of all fully discretionary accounts that have been managed under the Large Cap Blend strategy for at least one full calendar quarter. Returns for periods longer than one year are annualized. Some of the performance represented was achieved during a period of unprecedented returns in certain market sectors and may not be repeated. Past performance does not guarantee future results. The Russell® 1000 Index measures the performance of the 1,000 largest companies in the Russell® 3000 Index, which represents approximately 92% of the total market capitalization of the Russell® 3000 Index. The Standard & Poor’s 500 (S&P 500) Index is a market capitalization-weighted index of the common equity of 500 companies primarily traded on the NYSE. Investors cannot directly invest in an index.
2 The inception date of the Jennison Large Cap Blend Balanced strategy (formerly Prudential Investments Crossroads Balanced) is July 1, 1995. Jennison became responsible for the portfolio management of the equity portion of this strategy in September of 2000 pursuant to a transition of Prudential Financial's active public equity capabilities to Jennison. Performance for periods since 9/30/00 reflects returns generated by both Jennison and Prudential Investment Management (PIM). The investment returns shown represent the historical performance of all fully discretionary accounts that have been managed under the Large Cap Blend strategy for at least one full calendar quarter. Returns for periods longer than one year are annualized. Some of the performance represented was achieved during a period of unprecedented returns in certain market sectors and may not be repeated. Past performance does not guarantee future results. The 60/40 Russell® 1000 Index/Lehman Brothers Intermediate Government Bond Index is a blended index with 60% Russell® 1000 Index and 40% Lehman Brothers Intermediate Government Bond Index. The 60/40 S&P 500 Index/Lehman Brothers Intermediate Government Bond Index is a blended index with 60% S&P 500 Index and 40% Lehman Brothers Intermediate Government Bond Index. The Russell® 1000 Index measures the performance of the 1,000 largest companies in the Russell® 3000 Index, which represents approximately 92% of the total market capitalization of the Russell® 3000 Index. The Standard & Poor’s 500 (S&P 500) Index is a market capitalization-weighted index of 500 companies primarily traded on the NYSE. The Lehman Brothers Intermediate Government Index is an unmanaged index, and comprises U.S. Treasuries and agencies having 1- to 10-year maturities. Investors cannot directly invest in an index.
3 The Russell® Indicies are a trademark/service mark of the Frank Russell Company. Russell® is a trademark of the Frank Russell Company. The information in this presentation is confidential and further redistribution is prohibited.
4 Source for S&P 500 Index, S&P Barra Growth Index and S&P Barra Value Index: Bloomberg, Standard & Poor’s and FT Interactive Data Corporation. Jennison does not compile statistical or other data itself and relies on third-party vendors to provide such data. Although Jennison utilizes vendors that it believes are reliable, we can not guarantee the accuracy of such information as we do not control the methods used to compile such data.
5 Source for all data: Jennison Managed Accounts. Due to rounding, sector percentages may not sum to 100%. Sector classification of individual stocks is determined by Global Industry Classification standard developed by Standard & Poor’s in collaboration with Morgan Stanley Capital International. However, after periodic review, Jennison investment professionals may reclassify certain securities held in the portfolio. The cash percentage represents trade date cash and cash equivalents. It should not be assumed that future investments made on behalf of the Jennison Managed Accounts Large Cap Blend Equity Strategy Model Portfolio will be of comparable size in terms of percentage of the portfolio or will be as profitable or equal the performance of the securities currently held in the portfolio.
6 Source for all data: Jennison Managed Accounts. Due to rounding, percentages may not sum to total shown. These securities represent the largest positions held in the Jennison Managed Accounts Large Cap Blend Equity Strategy Model Portfolio as of 6/30/04 and do not represent all of the securities held in the model portfolio. Since accounts are individually managed actual holdings may vary from the holdings shown here and among other accounts. Neither the information contained herein nor any opinion expressed shall be construed to constitute an offer to sell or a solicitation to buy any securities mentioned herein. It should not be assumed that future investments made on behalf of the Jennison Managed Accounts Large Cap Blend Equity Strategy Model Portfolio will be of comparable size in terms of percentage of the portfolio or will be as profitable or equal the performance of the securities mentioned herein as well as those currently held in the portfolio. A list of all investments made on behalf of Jennison Managed Accounts throughout the past twelve months is available upon request.
7 Source for all data: Jennison Managed Accounts. The EPS Growth and P/E listed above are estimates determined by Jennison investment professionals. They are based on operating earnings per share and are subject to periodic change. Portfolio P/E is calculated using harmonic mean methodology. Certain securities for which earnings is not a primary basis for evaluation have been excluded from the calculation of EPS Growth and P/E. A list of those securities is available upon request. Relative P/E is the portfolio P/E divided by the Index P/E. The cash percentagerepresents trade date cash and cash equivalents. It should not be assumed that future investments made on behalf of the Jennison Managed Accounts Large Cap Blend Equity Strategy Model Portfolio will be of comparable size in terms of percentage of the portfolio or will be as profitable or equal the performance of the securities currently held in the portfolio. A list of allinvestments made on behalf of Jennison Managed Accounts throughout the past twelve months is available upon request.

27JMA
Why Core Mutual Funds?
Potential problems with separate growth and value funds:
Too much concentration in one sector and/or stock
Too much cash over market cycle
Core Fund Managers have the option to retain stocks that transition from value to growth or growth to value
The GOAL is Selecting and Keeping the Best Stocks
Growth Funds+
Value FundsCORE
TMahoney:
Use this additional slide?
TMahoney:
Use this additional slide?