large scale genomes comparisons bioinformatics aspects fredj tekaia institut pasteur...
TRANSCRIPT

Large scale genomes comparisonsBioinformatics aspects
Fredj TekaiaInstitut Pasteur
EMBO - IP, HKU-Research Centre Hong Kong, August 16 - 29, 2009
Plan:
• Completely sequences genomes ;
• Large scale genome comparisons;
• Results mining: clusters of orthologs and analyses;
• References.
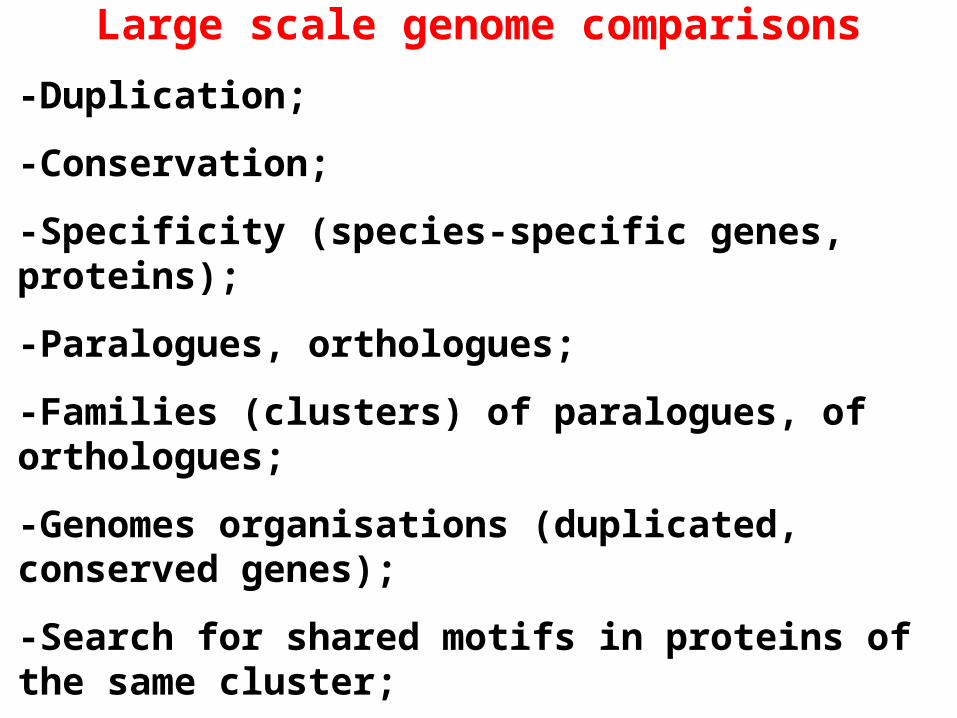
Large scale genome comparisons
-Duplication;
-Conservation;
-Specificity (species-specific genes, proteins);
-Paralogues, orthologues;
-Families (clusters) of paralogues, of orthologues;
-Genomes organisations (duplicated, conserved genes);
-Search for shared motifs in proteins of the same cluster;
-Protein conservation profiles;
-Selection pressure analyses
(synonymous, non synonymous substitutions,..),….
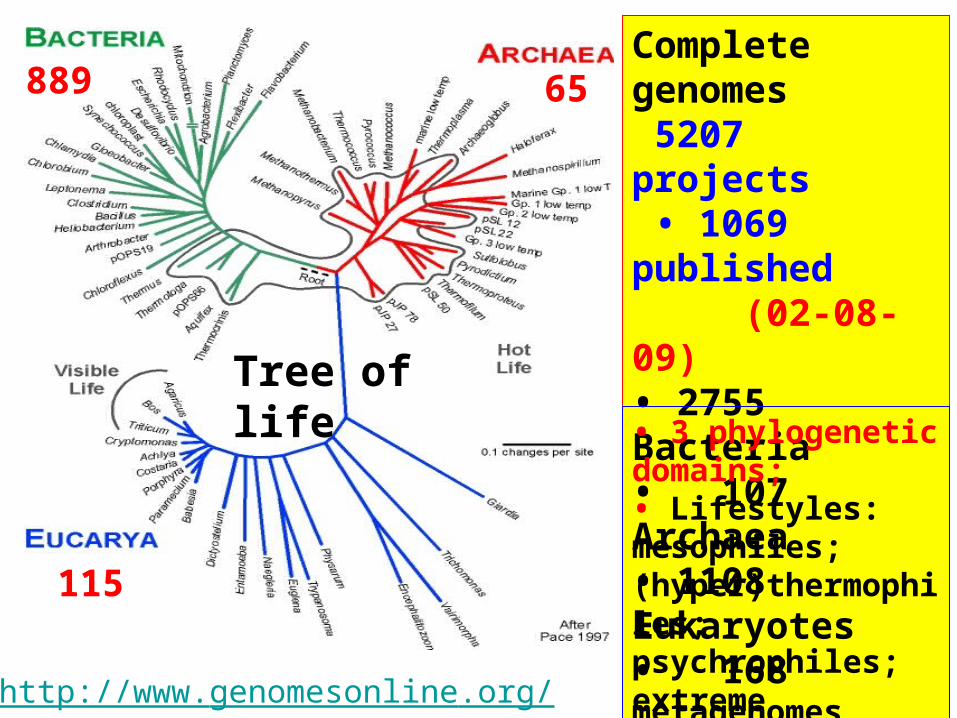
889 65
115
http://www.genomesonline.org/
Tree of life
Complete genomes 5207 projects • 1069 published (02-08-09)• 2755 Bacteria• 107 Archaea• 1108 Eukaryotes• 168 metagenomes
• 3 phylogenetic domains;• Lifestyles: mesophiles; (hyper)thermophiles; psychrophiles; extreme conditions,...
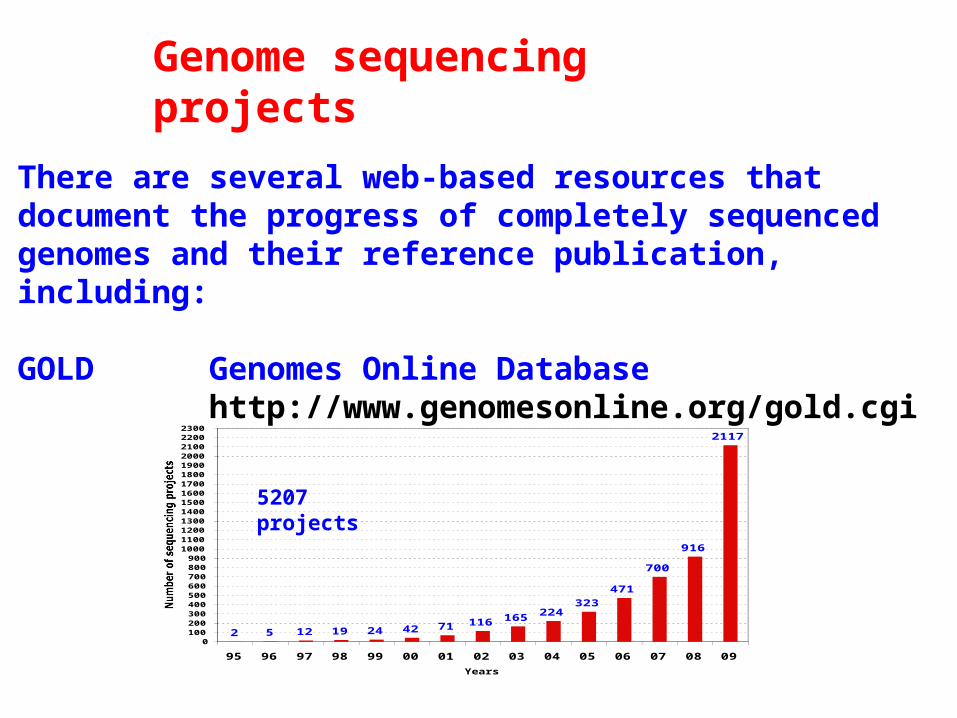
Genome sequencing projects
There are several web-based resources that document the progress of completely sequenced genomes and their reference publication, including:
GOLD Genomes Online Databasehttp://www.genomesonline.org/gold.cgi
2 5 12 19 24 42 71 116 165 224323
471
700
916
2117
0100200300400500600700800900
10001100120013001400150016001700180019002000210022002300
95 96 97 98 99 00 01 02 03 04 05 06 07 08 09
Years
Number of sequencing projects
5207 projects

Resources for genomesThere are two main resources for genomes:
EBI European Bioinformatics Institutehttp://www.ebi.ac.uk/genomes/
NCBI National Center for Biotechnology Informationhttp://www.ncbi.nlm.nih.gov/genomes/
But many others resources from sequencing Institutions:
Sanger The welcome Trust Sanger Instituthttp://www.sanger.ac.uk/
Broad Institut http://www.broad.mit.edu/tools/data/seq.html
Genolevures http://cbi.labri.fr/Genolevures/index.php

DefinitionsGenomeThe genome of a cell is formed by the collection of the DNA it comprises.The genome size is the total of its DNA bases.
Gene
Is a particular DNA sequence situated in a specific position on a chromosome and that codes for a specific function.
Protein
Is a sequence composed of amino-acids ordered according to the DNA sequences of the gene it codes for.
Proteome
Is the set of proteins in an organism.
Genomics
Is the exhaustive study of genomes: genetic material, genes; their functions, their organization....
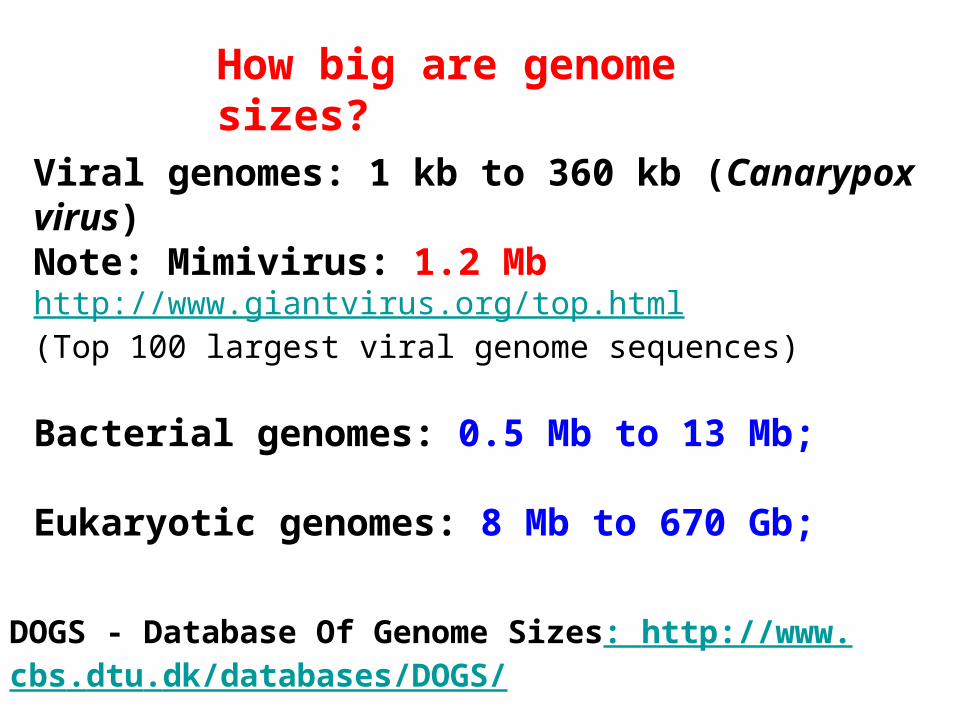
How big are genome sizes?
Viral genomes: 1 kb to 360 kb (Canarypox virus) Note: Mimivirus: 1.2 Mbhttp://www.giantvirus.org/top.html (Top 100 largest viral genome sequences)
Bacterial genomes: 0.5 Mb to 13 Mb;
Eukaryotic genomes: 8 Mb to 670 Gb;
DOGS - Database Of Genome Sizes: http://www.cbs.dtu.dk/databases/DOGS/

Comparative genomics
• Analysis and comparisons of genomes from different species.
• Helps understanding the similarity and differences between genomes, their evolution and the evolution of their genes.
• Intra-genomic comparisons help understanding the degree of duplication (genome regions; genes) and genes organization,...
• Inter-genomic comparisons help understanding the degree of similarity between genomes; degree of conservation between genes;
Determination of syntenic regions i.e regions conserved in different species;

2a 4a
Organism A
Organism B
1a 3a 5a 6a
2b 4b7b 3b 8b 9b
Block of synteny
Synteny
Evolution

Time
Duplication
Speciation
A B
Duplication
G
G1 G2
B-G21 B-G22
A-G2A-G1 B-G1
orthologs
outparalogs
inparalogsoutparalogs
•Speciation
•Duplication
•Inparalogs
•Orthologs
•Outparalogs
•Loss of genes
Predict these events by comparing genomes?
Speciation - Duplication

Orthologs / Paralogs
• How to detect orthologous genes?
- easy way: best reciprocal hit (RBH)
2.1a
3a
2.1b
3b
1a 1b
2.2a 2.2b
Organism A Organism B
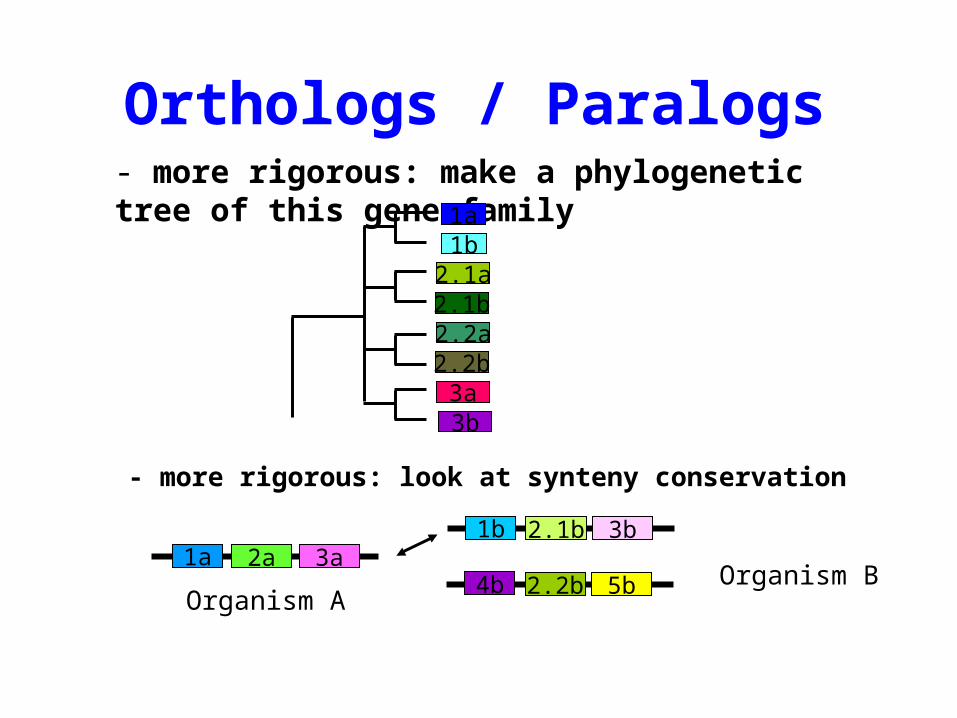
Orthologs / Paralogs- more rigorous: make a phylogenetic tree of this gene family
2.1b
3a
2.1a
3b
1a1b
2.2b2.2a
- more rigorous: look at synteny conservation
2a 3a1a2.1b 3b1b
2.2b 5b4bOrganism A
Organism B
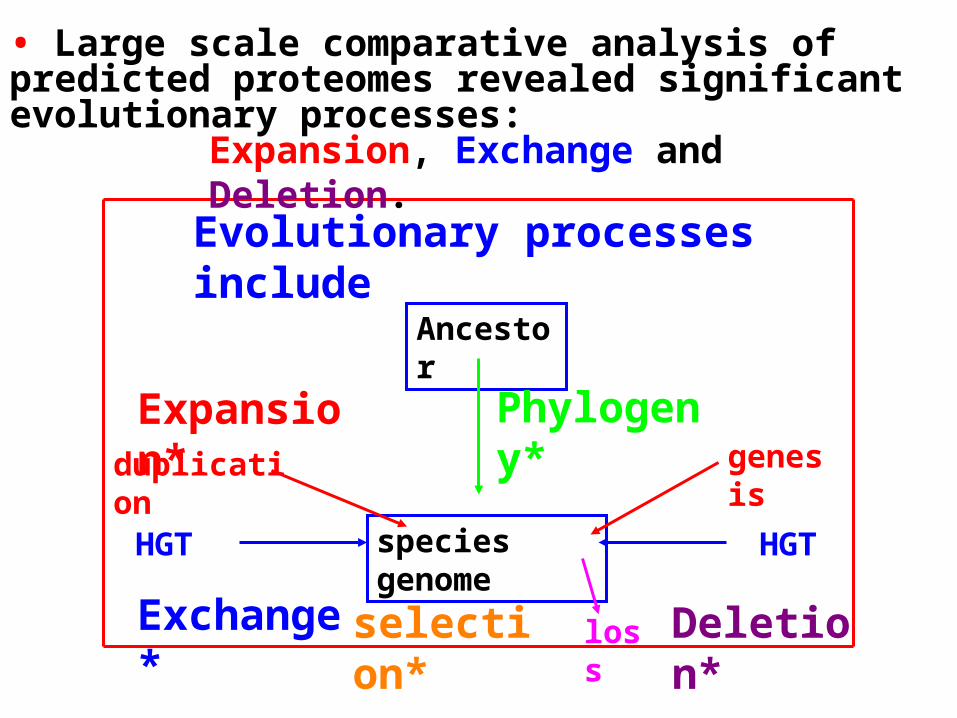
Ancestor
species genome
Evolutionary processes include
Phylogeny*duplication genesis
Expansion*
HGT HGT
Exchange* loss Deletion*selection*
Expansion, Exchange and Deletion.
• Large scale comparative analysis of predicted proteomes revealed significant evolutionary processes:

Gene duplications are traditionally considered as a major evolutionary source for protein new functions
Understanding how duplications happened and how important is this evolutionary process is a key goal of genome analysis
> Some examples
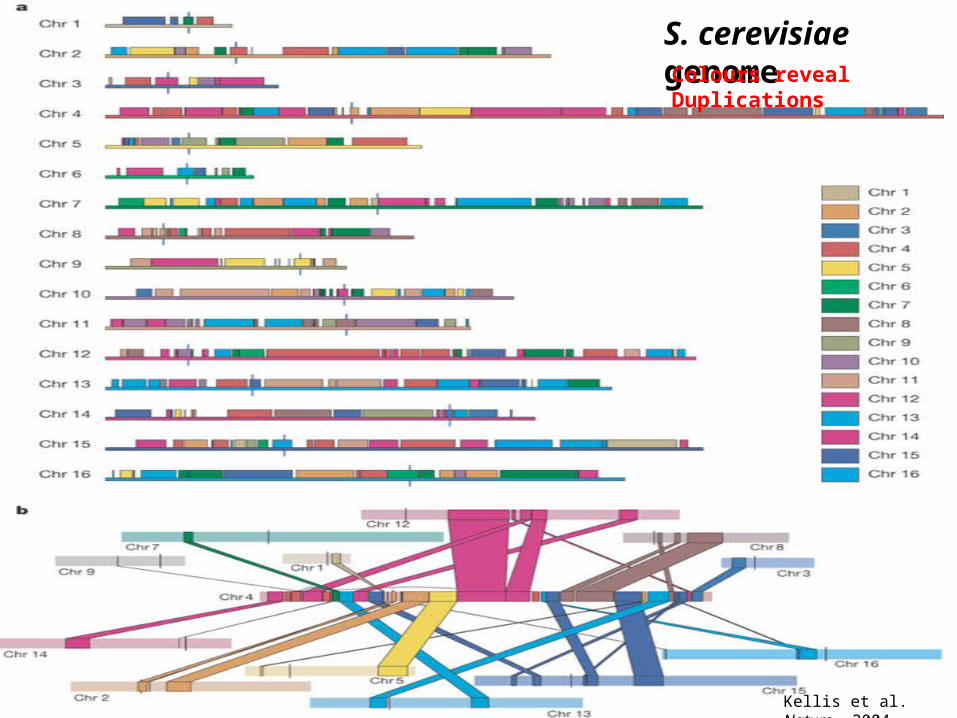
Kellis et al. Nature, 2004
S. cerevisiae genomeColours reveal Duplications

Kellis et al. Nature, 2004
SpeciationDuplication
Deletion
Actual content of the 2 copies
Reconstruction of the ancestral organization

Hurles M (2004) Gene Duplication: The Genomic Trade in Spare Parts. PLoS Biol 2(7): e206.
Original version
Actual version
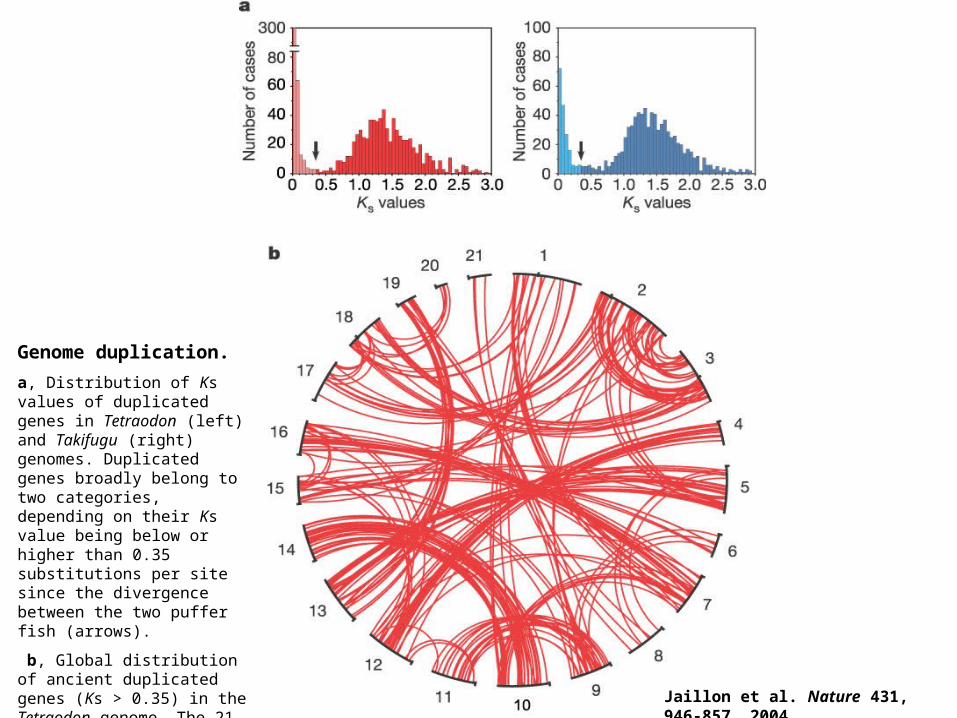
Genome duplication.
a, Distribution of Ks values of duplicated genes in Tetraodon (left) and Takifugu (right) genomes. Duplicated genes broadly belong to two categories, depending on their Ks value being below or higher than 0.35 substitutions per site since the divergence between the two puffer fish (arrows).
b, Global distribution of ancient duplicated genes (Ks > 0.35) in the Tetraodon genome. The 21 Tetraodon chromosomes are represented in a circle in numerical order and each line joins duplicated genes at their respective position on a given pair of chromosomes. Jaillon et al. Nature 431, 946-857. 2004.

Jaillon et al. Nature 431, 946-857. 2004.
Simple description(old figures but still significant)
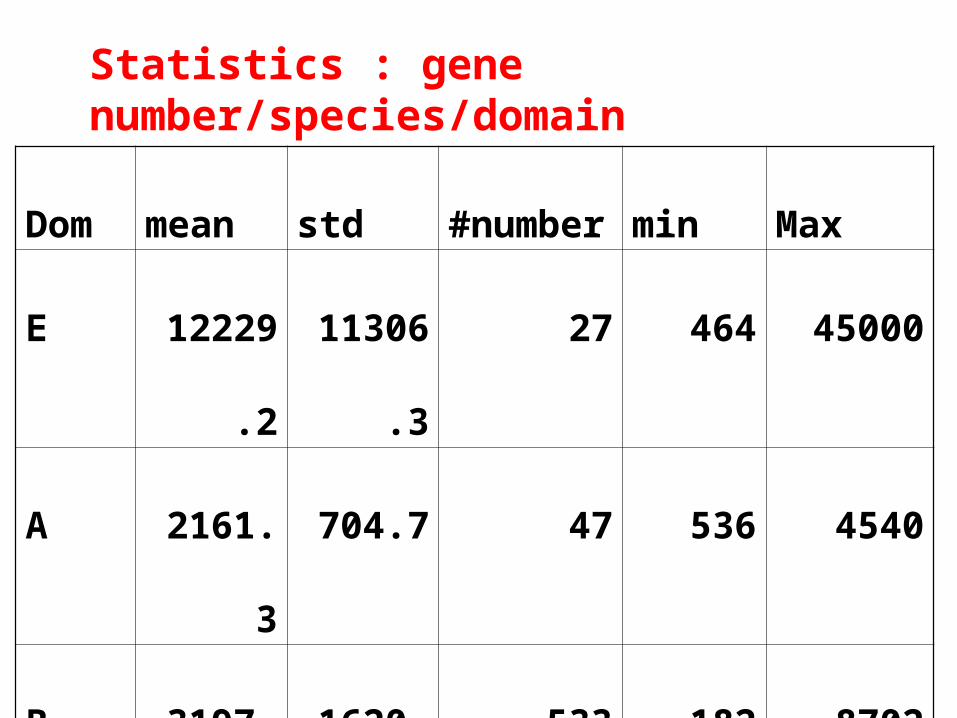
Dom mean std #number min Max
E 12229.2 11306.3 27 464 45000
A 2161.3 704.7 47 536 4540
B 3197.6 1620.8 533 182 8702
Statistics : gene number/species/domain
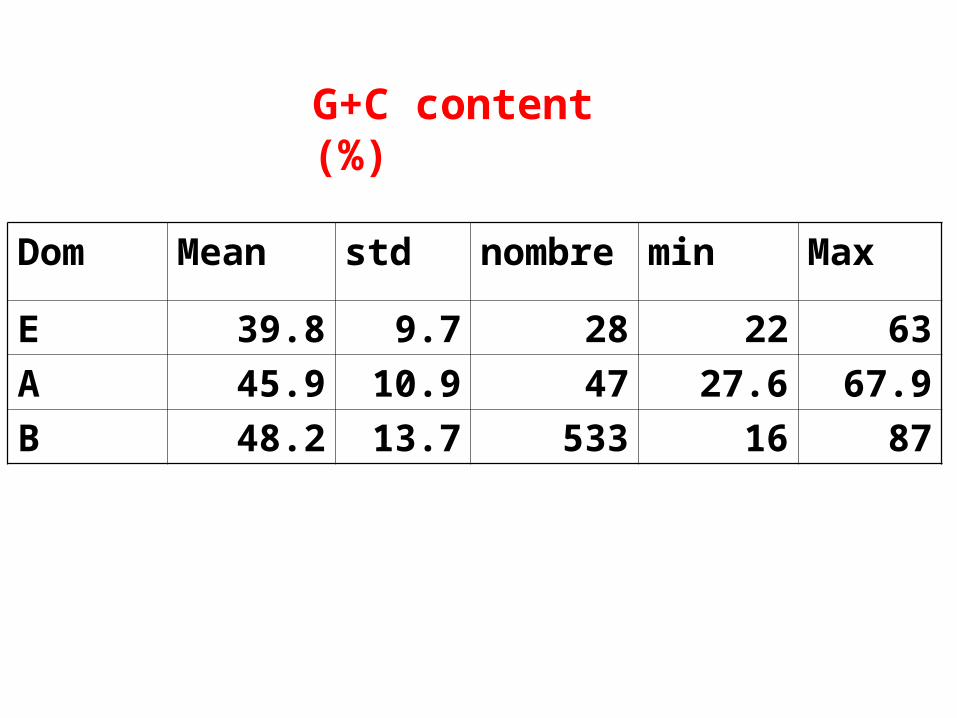
Dom Mean std nombre min Max
E 39.8 9.7 28 22 63
A 45.9 10.9 47 27.6 67.9
B 48.2 13.7 533 16 87
G+C content (%)

Dom spec prots Mean Std Min Max Fungi 25 223040 441.4 370.2 10 9579 NonFungi 11 234310 424.4 419.5 10 9638 E 36 480071 430.7 394.4 10 9638 A 35 86316 292.8 207.1 10 6715 B 56 166336 310.4 231.0 11 7463
ORF products mean size

Amino acid composition
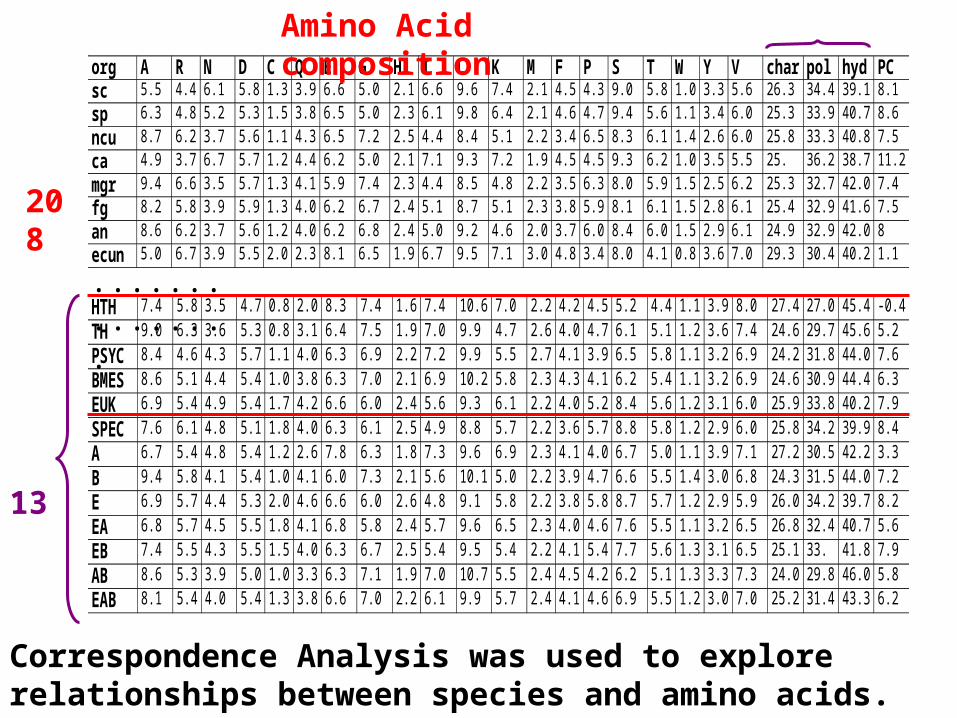
org A R N D C Q E G H I L K M F P S T W Y V char pol hyd PCsc 5.5 4.4 6.1 5.8 1.3 3.9 6.6 5.0 2.1 6.6 9.6 7.4 2.1 4.5 4.3 9.0 5.8 1.0 3.3 5.6 26.3 34.4 39.1 8.1
sp 6.3 4.8 5.2 5.3 1.5 3.8 6.5 5.0 2.3 6.1 9.8 6.4 2.1 4.6 4.7 9.4 5.6 1.1 3.4 6.0 25.3 33.9 40.7 8.6
ncu 8.7 6.2 3.7 5.6 1.1 4.3 6.5 7.2 2.5 4.4 8.4 5.1 2.2 3.4 6.5 8.3 6.1 1.4 2.6 6.0 25.8 33.3 40.8 7.5
ca 4.9 3.7 6.7 5.7 1.2 4.4 6.2 5.0 2.1 7.1 9.3 7.2 1.9 4.5 4.5 9.3 6.2 1.0 3.5 5.5 25. 36.2 38.7 11.2
mgr 9.4 6.6 3.5 5.7 1.3 4.1 5.9 7.4 2.3 4.4 8.5 4.8 2.2 3.5 6.3 8.0 5.9 1.5 2.5 6.2 25.3 32.7 42.0 7.4
fg 8.2 5.8 3.9 5.9 1.3 4.0 6.2 6.7 2.4 5.1 8.7 5.1 2.3 3.8 5.9 8.1 6.1 1.5 2.8 6.1 25.4 32.9 41.6 7.5
an 8.6 6.2 3.7 5.6 1.2 4.0 6.2 6.8 2.4 5.0 9.2 4.6 2.0 3.7 6.0 8.4 6.0 1.5 2.9 6.1 24.9 32.9 42.0 8
ecun 5.0 6.7 3.9 5.5 2.0 2.3 8.1 6.5 1.9 6.7 9.5 7.1 3.0 4.8 3.4 8.0 4.1 0.8 3.6 7.0 29.3 30.4 40.2 1.1
HTH 7.4 5.8 3.5 4.7 0.8 2.0 8.3 7.4 1.6 7.4 10.6 7.0 2.2 4.2 4.5 5.2 4.4 1.1 3.9 8.0 27.4 27.0 45.4 -0.4
TH 9.0 6.3 3.6 5.3 0.8 3.1 6.4 7.5 1.9 7.0 9.9 4.7 2.6 4.0 4.7 6.1 5.1 1.2 3.6 7.4 24.6 29.7 45.6 5.2
PSYC 8.4 4.6 4.3 5.7 1.1 4.0 6.3 6.9 2.2 7.2 9.9 5.5 2.7 4.1 3.9 6.5 5.8 1.1 3.2 6.9 24.2 31.8 44.0 7.6
BMES 8.6 5.1 4.4 5.4 1.0 3.8 6.3 7.0 2.1 6.9 10.2 5.8 2.3 4.3 4.1 6.2 5.4 1.1 3.2 6.9 24.6 30.9 44.4 6.3
EUK 6.9 5.4 4.9 5.4 1.7 4.2 6.6 6.0 2.4 5.6 9.3 6.1 2.2 4.0 5.2 8.4 5.6 1.2 3.1 6.0 25.9 33.8 40.2 7.9
SPEC 7.6 6.1 4.8 5.1 1.8 4.0 6.3 6.1 2.5 4.9 8.8 5.7 2.2 3.6 5.7 8.8 5.8 1.2 2.9 6.0 25.8 34.2 39.9 8.4
A 6.7 5.4 4.8 5.4 1.2 2.6 7.8 6.3 1.8 7.3 9.6 6.9 2.3 4.1 4.0 6.7 5.0 1.1 3.9 7.1 27.2 30.5 42.2 3.3
B 9.4 5.8 4.1 5.4 1.0 4.1 6.0 7.3 2.1 5.6 10.1 5.0 2.2 3.9 4.7 6.6 5.5 1.4 3.0 6.8 24.3 31.5 44.0 7.2
E 6.9 5.7 4.4 5.3 2.0 4.6 6.6 6.0 2.6 4.8 9.1 5.8 2.2 3.8 5.8 8.7 5.7 1.2 2.9 5.9 26.0 34.2 39.7 8.2
EA 6.8 5.7 4.5 5.5 1.8 4.1 6.8 5.8 2.4 5.7 9.6 6.5 2.3 4.0 4.6 7.6 5.5 1.1 3.2 6.5 26.8 32.4 40.7 5.6
EB 7.4 5.5 4.3 5.5 1.5 4.0 6.3 6.7 2.5 5.4 9.5 5.4 2.2 4.1 5.4 7.7 5.6 1.3 3.1 6.5 25.1 33. 41.8 7.9
AB 8.6 5.3 3.9 5.0 1.0 3.3 6.3 7.1 1.9 7.0 10.7 5.5 2.4 4.5 4.2 6.2 5.1 1.3 3.3 7.3 24.0 29.8 46.0 5.8
EAB 8.1 5.4 4.0 5.4 1.3 3.8 6.6 7.0 2.2 6.1 9.9 5.7 2.4 4.1 4.6 6.9 5.5 1.2 3.0 7.0 25.2 31.4 43.3 6.2
208
13
...............
Amino Acid composition
Correspondence Analysis was used to explore relationships between species and amino acids.

•
•
•••
Eukaryotes
Hyperthermophiles
Psychrophiles Prokaryotes mesophiles
Thermophiles
Encephalitozoon cuniculi
Thermosynechococcus
elongatus
Tekaia & Yeramian, 2006, BMC Genomics 7:307

GC%
growth t°
•
•
•••
Mycoplasma mycoides
23%
Nocardia farcinica:
70%
Streptomyces coelicolor: 72%
Tetrahymena thermophila (Protists)
Saccharomyces
Entamoeba histolytica (Protists)
Cryptosporidium hominis Leishmania major:60%
Cyanidioschyzon merolae
Aspergilus fumigatus:50%Homo sapiens
Methanococcus jannaschii:31%Pyrococcus abyssi:44%
Methanopyrus kandleri:61%
Thermus-thermophilus:69%
Colwellia psychrerythraea Pseudoalteromonas haloplanktis
Encephalitozoon cuniculi
A. nidulans
A. oryzae
C. neoformansMus musculus
Rat
Candida Glabrata
Tekaia & Yeramian, 2006, BMC Genomics 7:307

Search for similarity
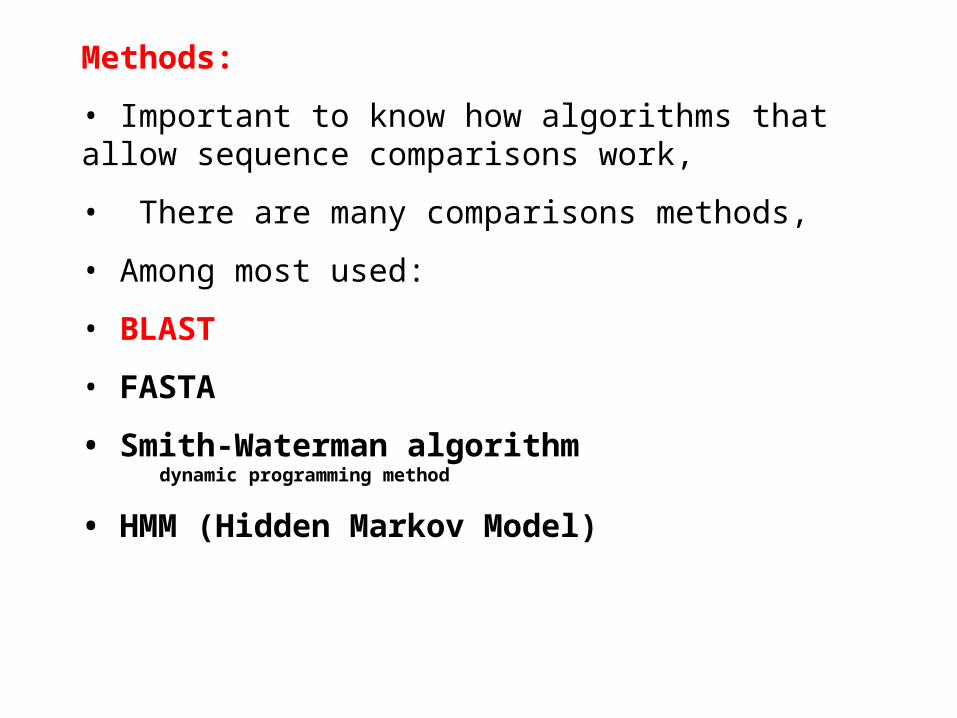
Methods:
• Important to know how algorithms that allow sequence comparisons work,
• There are many comparisons methods,
• Among most used:
• BLAST
• FASTA
• Smith-Waterman algorithm dynamic programming method
• HMM (Hidden Markov Model)
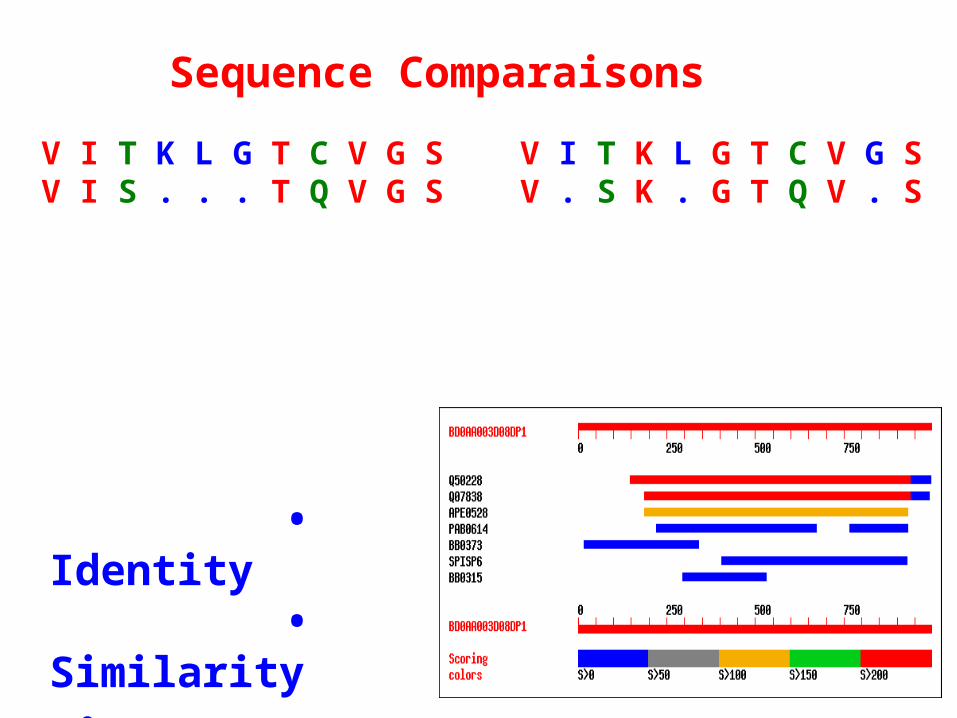
Sequence Comparaisons
V I T K L G T C V G S V I T K L G T C V G SV I S . . . T Q V G S V . S K . G T Q V . S
• Identity • Similarity • Homology

Comparison of 2 sequences
• Aims at finding the optimal alignment: the one that shows most similar regions and regions that are less similar.
• In describing sequence comparisons, three different terms are commonly used :
Identity, Similarity and Homology.
Need for a score that evaluates:
- matches
- mismatches
- gaps
and a method that evaluates the numerous possible alignments.

Identity
• Refers to the occurence of identical nucleotides or amino acids in the same position in aligned sequences ;
• Identity is objective and well defined;
• Identity can be quantified: Percent i.e the number of identical matches divided by the length of the aligned region.
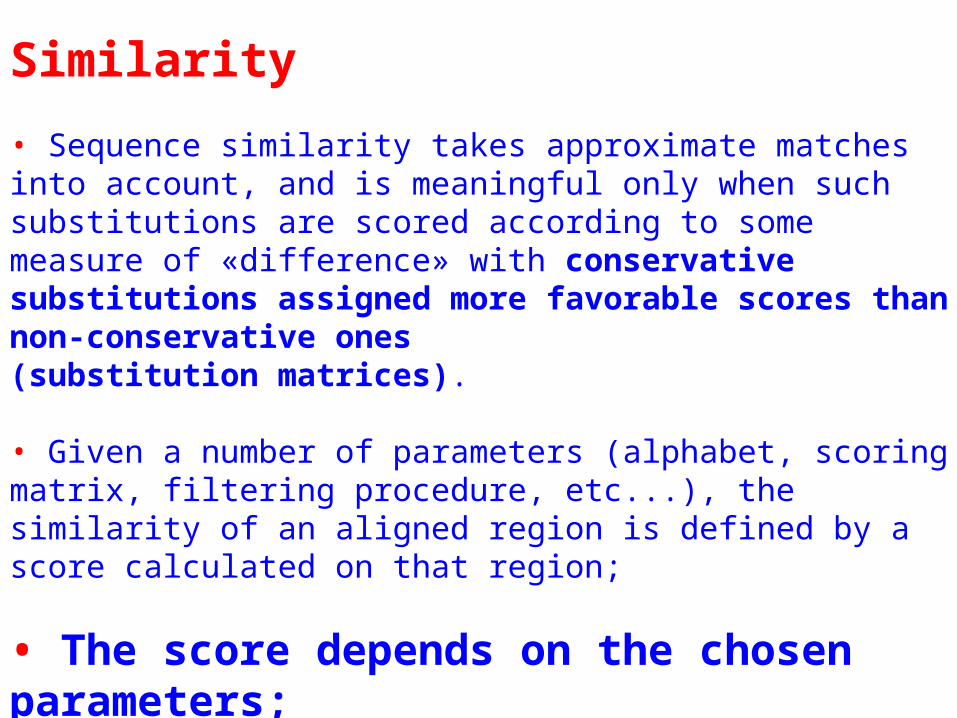
Similarity
• Sequence similarity takes approximate matches into account, and is meaningful only when such substitutions are scored according to some measure of «difference» with conservative substitutions assigned more favorable scores than non-conservative ones (substitution matrices). • Given a number of parameters (alphabet, scoring matrix, filtering procedure, etc...), the similarity of an aligned region is defined by a score calculated on that region;
• The score depends on the chosen parameters;• Contrarily to homology : expression like significant or weak similarity are often used.
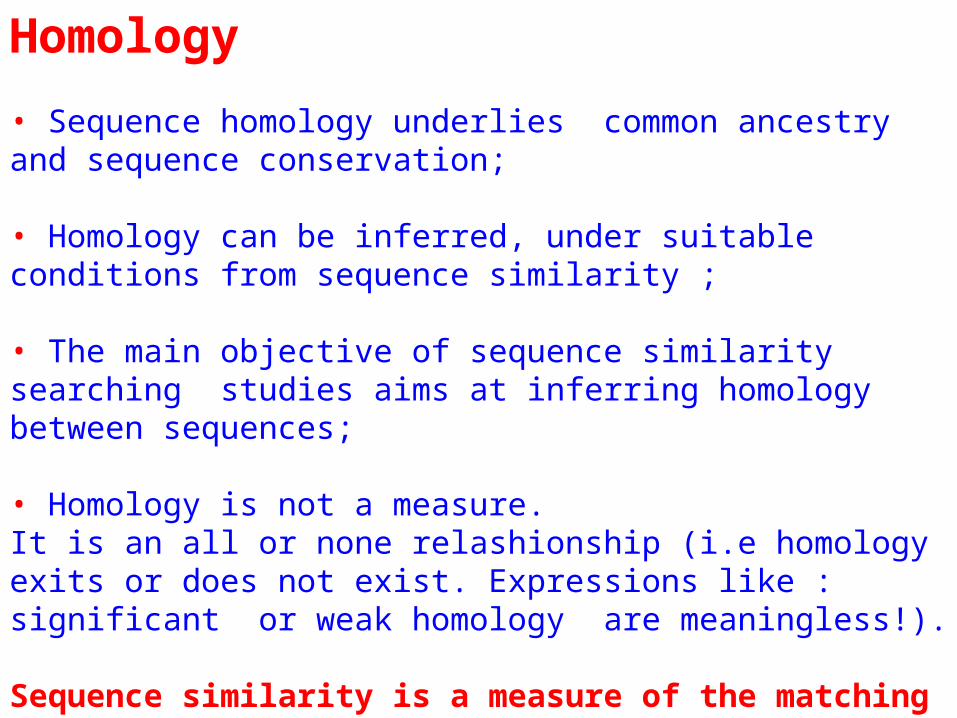
Homology
• Sequence homology underlies common ancestry and sequence conservation;
• Homology can be inferred, under suitable conditions from sequence similarity ;
• The main objective of sequence similarity searching studies aims at inferring homology between sequences;
• Homology is not a measure.It is an all or none relashionship (i.e homology exits or does not exist. Expressions like : significant or weak homology are meaningless!).
Sequence similarity is a measure of the matching characters in an alignment, whereas homology is a statement of common evolutionary origin.

A
B
Local alignment
A
B
Global alignment
Local Alignement
Global Alignement

Compare one query sequence to a BLAST formatted database
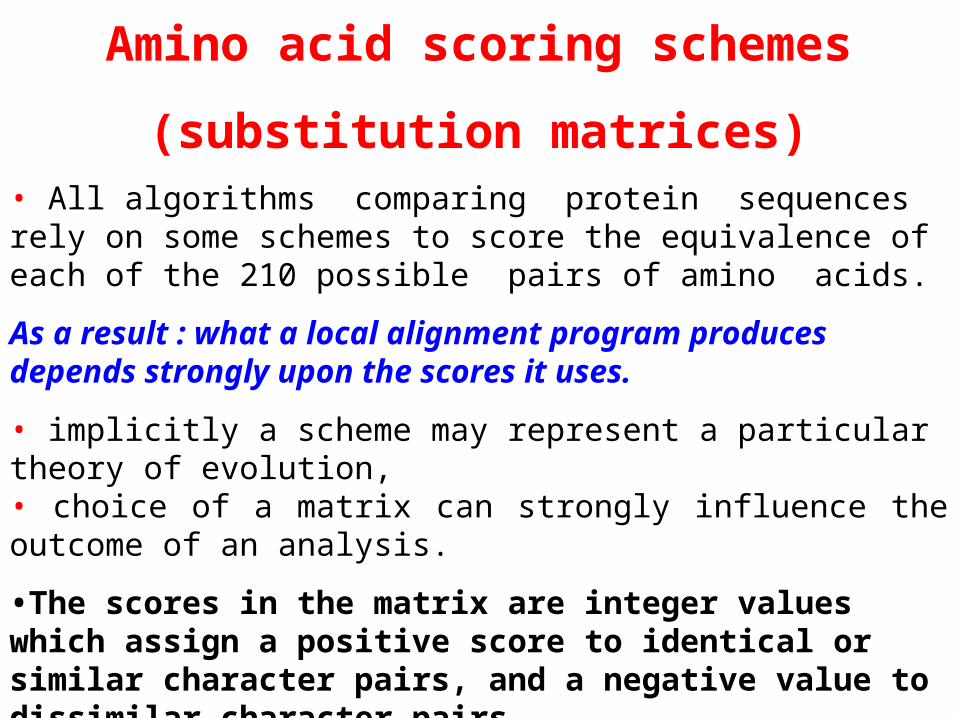
Amino acid scoring schemes
(substitution matrices)• All algorithms comparing protein sequences rely on some schemes to score the equivalence of each of the 210 possible pairs of amino acids.
As a result : what a local alignment program produces depends strongly upon the scores it uses.
• implicitly a scheme may represent a particular theory of evolution,• choice of a matrix can strongly influence the outcome of an analysis.
•The scores in the matrix are integer values which assign a positive score to identical or similar character pairs, and a negative value to dissimilar character pairs.
Sij = (ln(qij/pipj))/u; qij are target frequencies for aligned pairs of amino acids, the pi and pj are background frequencies, and u is a statistical parameter.

Examples of substitution matrices# PAM250 substitution matrix, scale = ln(2)/3 = 0.231049# Expected score = -0.844, Entropy = 0.354 bits# Lowest score = -8, Highest score = 17
A R N D C Q E G H I L K M F P S T W Y V B Z X *A 2 -2 0 0 -2 0 0 1 -1 -1 -2 -1 -1 -3 1 1 1 -6 -3 0 0 0 0 -8R -2 6 0 -1 -4 1 -1 -3 2 -2 -3 3 0 -4 0 0 -1 2 -4 -2 -1 0 -1 -8N 0 0 2 2 -4 1 1 0 2 -2 -3 1 -2 -3 0 1 0 -4 -2 -2 2 1 0 -8D 0 -1 2 4 -5 2 3 1 1 -2 -4 0 -3 -6 -1 0 0 -7 -4 -2 3 3 -1 -8C -2 -4 -4 -5 12 -5 -5 -3 -3 -2 -6 -5 -5 -4 -3 0 -2 -8 0 -2 -4 -5 -3 -8Q 0 1 1 2 -5 4 2 -1 3 -2 -2 1 -1 -5 0 -1 -1 -5 -4 -2 1 3 -1 -8E 0 -1 1 3 -5 2 4 0 1 -2 -3 0 -2 -5 -1 0 0 -7 -4 -2 3 3 -1 -8G 1 -3 0 1 -3 -1 0 5 -2 -3 -4 -2 -3 -5 0 1 0 -7 -5 -1 0 0 -1 -8H -1 2 2 1 -3 3 1 -2 6 -2 -2 0 -2 -2 0 -1 -1 -3 0 -2 1 2 -1 -8I -1 -2 -2 -2 -2 -2 -2 -3 -2 5 2 -2 2 1 -2 -1 0 -5 -1 4 -2 -2 -1 -8L -2 -3 -3 -4 -6 -2 -3 -4 -2 2 6 -3 4 2 -3 -3 -2 -2 -1 2 -3 -3 -1 -8K -1 3 1 0 -5 1 0 -2 0 -2 -3 5 0 -5 -1 0 0 -3 -4 -2 1 0 -1 -8M -1 0 -2 -3 -5 -1 -2 -3 -2 2 4 0 6 0 -2 -2 -1 -4 -2 2 -2 -2 -1 -8F -3 -4 -3 -6 -4 -5 -5 -5 -2 1 2 -5 0 9 -5 -3 -3 0 7 -1 -4 -5 -2 -8P 1 0 0 -1 -3 0 -1 0 0 -2 -3 -1 -2 -5 6 1 0 -6 -5 -1 -1 0 -1 -8S 1 0 1 0 0 -1 0 1 -1 -1 -3 0 -2 -3 1 2 1 -2 -3 -1 0 0 0 -8T 1 -1 0 0 -2 -1 0 0 -1 0 -2 0 -1 -3 0 1 3 -5 -3 0 0 -1 0 -8W -6 2 -4 -7 -8 -5 -7 -7 -3 -5 -2 -3 -4 0 -6 -2 -5 17 0 -6 -5 -6 -4 -8Y -3 -4 -2 -4 0 -4 -4 -5 0 -1 -1 -4 -2 7 -5 -3 -3 0 10 -2 -3 -4 -2 -8V 0 -2 -2 -2 -2 -2 -2 -1 -2 4 2 -2 2 -1 -1 -1 0 -6 -2 4 -2 -2 -1 -8B 0 -1 2 3 -4 1 3 0 1 -2 -3 1 -2 -4 -1 0 0 -5 -3 -2 3 2 -1 -8Z 0 0 1 3 -5 3 3 0 2 -2 -3 0 -2 -5 0 0 -1 -6 -4 -2 2 3 -1 -8X 0 -1 0 -1 -3 -1 -1 -1 -1 -1 -1 -1 -1 -2 -1 0 0 -4 -2 -1 -1 -1 -1 -8* -8 -8 -8 -8 -8 -8 -8 -8 -8 -8 -8 -8 -8 -8 -8 -8 -8 -8 -8 -8 -8 -8 -8 1
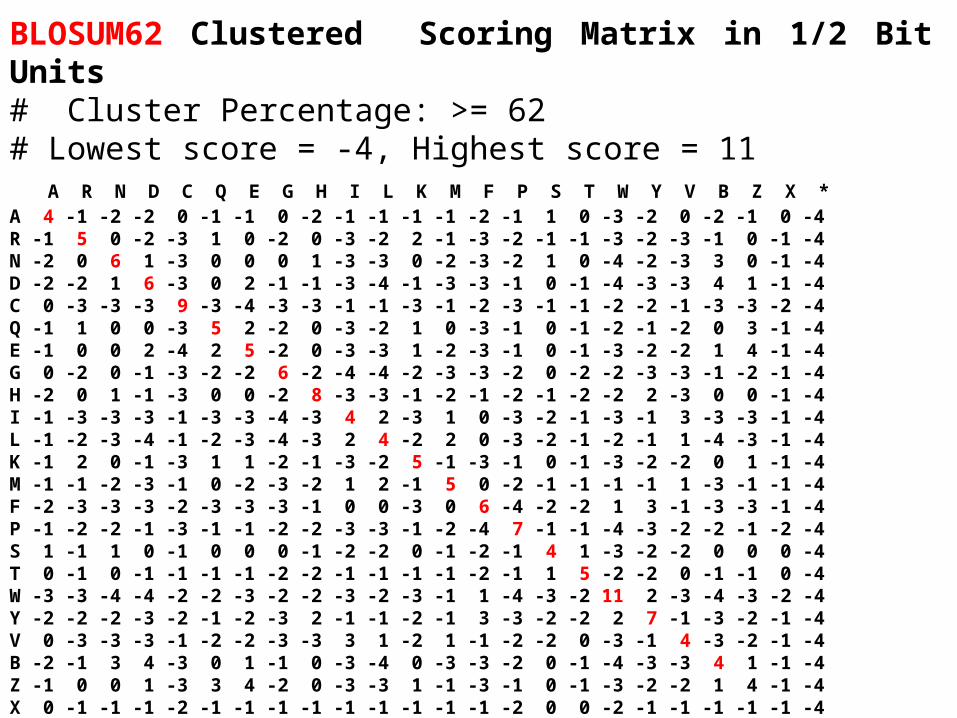
BLOSUM62 Clustered Scoring Matrix in 1/2 Bit Units# Cluster Percentage: >= 62# Lowest score = -4, Highest score = 11 A R N D C Q E G H I L K M F P S T W Y V B Z X *A 4 -1 -2 -2 0 -1 -1 0 -2 -1 -1 -1 -1 -2 -1 1 0 -3 -2 0 -2 -1 0 -4R -1 5 0 -2 -3 1 0 -2 0 -3 -2 2 -1 -3 -2 -1 -1 -3 -2 -3 -1 0 -1 -4N -2 0 6 1 -3 0 0 0 1 -3 -3 0 -2 -3 -2 1 0 -4 -2 -3 3 0 -1 -4D -2 -2 1 6 -3 0 2 -1 -1 -3 -4 -1 -3 -3 -1 0 -1 -4 -3 -3 4 1 -1 -4C 0 -3 -3 -3 9 -3 -4 -3 -3 -1 -1 -3 -1 -2 -3 -1 -1 -2 -2 -1 -3 -3 -2 -4Q -1 1 0 0 -3 5 2 -2 0 -3 -2 1 0 -3 -1 0 -1 -2 -1 -2 0 3 -1 -4E -1 0 0 2 -4 2 5 -2 0 -3 -3 1 -2 -3 -1 0 -1 -3 -2 -2 1 4 -1 -4G 0 -2 0 -1 -3 -2 -2 6 -2 -4 -4 -2 -3 -3 -2 0 -2 -2 -3 -3 -1 -2 -1 -4H -2 0 1 -1 -3 0 0 -2 8 -3 -3 -1 -2 -1 -2 -1 -2 -2 2 -3 0 0 -1 -4I -1 -3 -3 -3 -1 -3 -3 -4 -3 4 2 -3 1 0 -3 -2 -1 -3 -1 3 -3 -3 -1 -4L -1 -2 -3 -4 -1 -2 -3 -4 -3 2 4 -2 2 0 -3 -2 -1 -2 -1 1 -4 -3 -1 -4K -1 2 0 -1 -3 1 1 -2 -1 -3 -2 5 -1 -3 -1 0 -1 -3 -2 -2 0 1 -1 -4M -1 -1 -2 -3 -1 0 -2 -3 -2 1 2 -1 5 0 -2 -1 -1 -1 -1 1 -3 -1 -1 -4F -2 -3 -3 -3 -2 -3 -3 -3 -1 0 0 -3 0 6 -4 -2 -2 1 3 -1 -3 -3 -1 -4P -1 -2 -2 -1 -3 -1 -1 -2 -2 -3 -3 -1 -2 -4 7 -1 -1 -4 -3 -2 -2 -1 -2 -4S 1 -1 1 0 -1 0 0 0 -1 -2 -2 0 -1 -2 -1 4 1 -3 -2 -2 0 0 0 -4T 0 -1 0 -1 -1 -1 -1 -2 -2 -1 -1 -1 -1 -2 -1 1 5 -2 -2 0 -1 -1 0 -4W -3 -3 -4 -4 -2 -2 -3 -2 -2 -3 -2 -3 -1 1 -4 -3 -2 11 2 -3 -4 -3 -2 -4Y -2 -2 -2 -3 -2 -1 -2 -3 2 -1 -1 -2 -1 3 -3 -2 -2 2 7 -1 -3 -2 -1 -4V 0 -3 -3 -3 -1 -2 -2 -3 -3 3 1 -2 1 -1 -2 -2 0 -3 -1 4 -3 -2 -1 -4B -2 -1 3 4 -3 0 1 -1 0 -3 -4 0 -3 -3 -2 0 -1 -4 -3 -3 4 1 -1 -4Z -1 0 0 1 -3 3 4 -2 0 -3 -3 1 -1 -3 -1 0 -1 -3 -2 -2 1 4 -1 -4X 0 -1 -1 -1 -2 -1 -1 -1 -1 -1 -1 -1 -1 -1 -2 0 0 -2 -1 -1 -1 -1 -1 -4* -4 -4 -4 -4 -4 -4 -4 -4 -4 -4 -4 -4 -4 -4 -4 -4 -4 -4 -4 -4 -4 -4 -4 1

• PAM matrices (Dayhoff et al. (1978))
PAM stands for “point accepted mutation”. • 1 PAM corresponds to 1 amino acid change per 100 residues,• 1 PAM ~1% divergence,• Extrapolate to predict patterns at longer distances.Assumptions :
• replacements are independent of surrounding residues,• sequences being compared are of average composition,• all sites are equally mutable,
Source of error : • small, globular proteins were used to derive PAM matrices (departure from average composition) • errors in PAM1 are magnified up to PAM250,.... • does not account for conserved blocks or motifs.Strategy : • PAM40 short alignments, highly similar • PAM120 average similarity • PAM250 longer , weaker local alignments.

• BLOSUM matrices (Henikoff, S., and Henikoff, J., G. (1992))
BlosumX denotes a matrix obtained from alignments of clustered sequence segments with more than X% identity.
Examples : - Blosum62 is obtained from clustered sequences with identity greater than 62%.- Blosum80 is obtained from clustered sequences with identity greater than 80%.
Which substitution matrix to choose?
Blosum80 Blosum62 Blosum45 PAM10 PAM120 PAM250 Less divergent <------ searching ------> More divergent
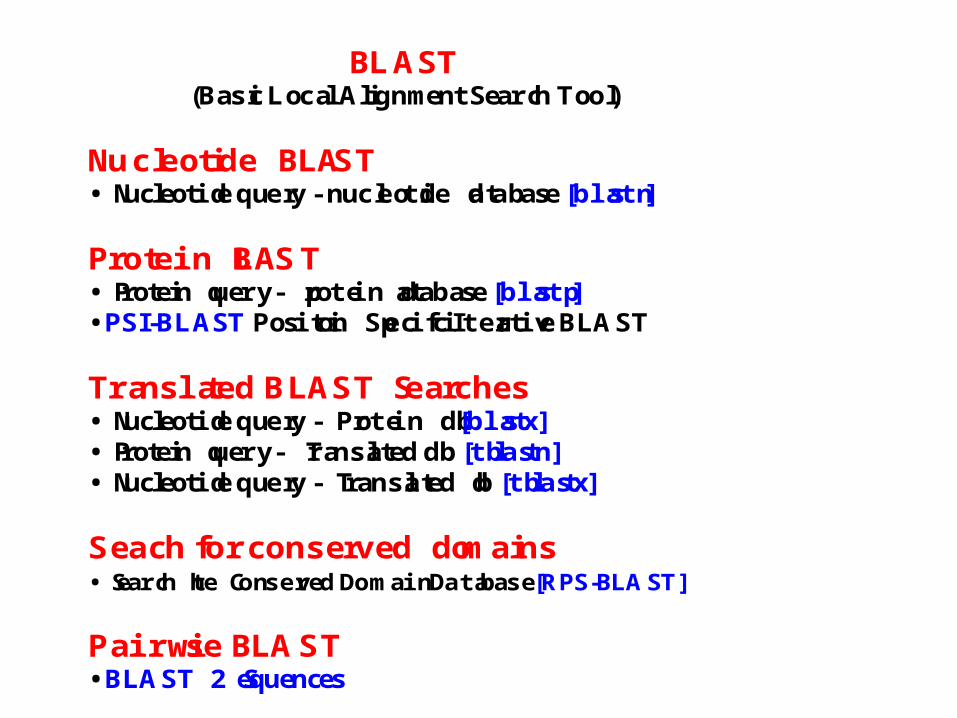
BLAST(Basic Local Alignment Search Tool)
Nucleo tide BLA ST• Nucleotide query - nucleotide database [blastn]
Prote in B LAST• Protein query - protein database [blastp]• PSI-BLAST Position Specific Iterative BLAST
Trans lated BLAST Sea rches• Nucleotide query - Protein db [blastx]• Protein query - Translated db [tblastn]• Nucleotide query - Translated db [tblastx]
Seac h for con se rve d do mains• Search the Conserved Domain Database [RPS-BLAST]
Pairwis e BLAST• BLAST 2 Sequences

• Position Specific Scoring Matrix (PSSM)
- Conserved motifs are identified and amino acid profile matrix for each motif is calculated.
-This matrix (n x 20 aa ) is representative of the relative amino acid probabilities at specific positions and is characteristic of a protein family.
-Such matrices are used by the profile database searching programs (including PSI-BLAST and HMM based programs).
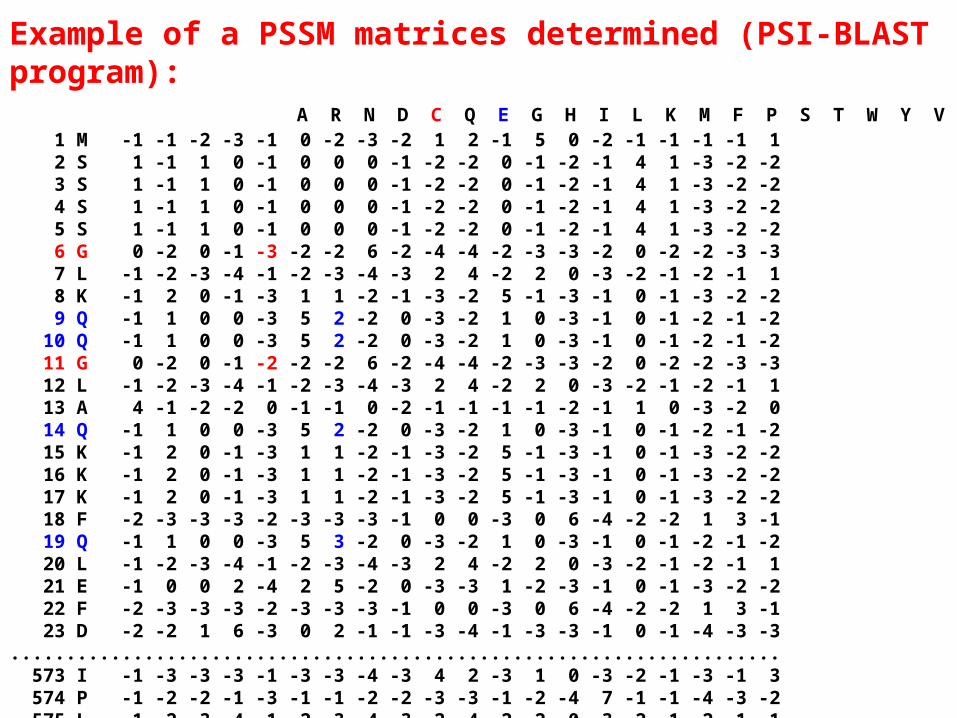
Example of a PSSM matrices determined (PSI-BLAST program): A R N D C Q E G H I L K M F P S T W Y V 1 M -1 -1 -2 -3 -1 0 -2 -3 -2 1 2 -1 5 0 -2 -1 -1 -1 -1 1 2 S 1 -1 1 0 -1 0 0 0 -1 -2 -2 0 -1 -2 -1 4 1 -3 -2 -2 3 S 1 -1 1 0 -1 0 0 0 -1 -2 -2 0 -1 -2 -1 4 1 -3 -2 -2 4 S 1 -1 1 0 -1 0 0 0 -1 -2 -2 0 -1 -2 -1 4 1 -3 -2 -2 5 S 1 -1 1 0 -1 0 0 0 -1 -2 -2 0 -1 -2 -1 4 1 -3 -2 -2 6 G 0 -2 0 -1 -3 -2 -2 6 -2 -4 -4 -2 -3 -3 -2 0 -2 -2 -3 -3 7 L -1 -2 -3 -4 -1 -2 -3 -4 -3 2 4 -2 2 0 -3 -2 -1 -2 -1 1 8 K -1 2 0 -1 -3 1 1 -2 -1 -3 -2 5 -1 -3 -1 0 -1 -3 -2 -2 9 Q -1 1 0 0 -3 5 2 -2 0 -3 -2 1 0 -3 -1 0 -1 -2 -1 -2 10 Q -1 1 0 0 -3 5 2 -2 0 -3 -2 1 0 -3 -1 0 -1 -2 -1 -2 11 G 0 -2 0 -1 -2 -2 -2 6 -2 -4 -4 -2 -3 -3 -2 0 -2 -2 -3 -3 12 L -1 -2 -3 -4 -1 -2 -3 -4 -3 2 4 -2 2 0 -3 -2 -1 -2 -1 1 13 A 4 -1 -2 -2 0 -1 -1 0 -2 -1 -1 -1 -1 -2 -1 1 0 -3 -2 0 14 Q -1 1 0 0 -3 5 2 -2 0 -3 -2 1 0 -3 -1 0 -1 -2 -1 -2 15 K -1 2 0 -1 -3 1 1 -2 -1 -3 -2 5 -1 -3 -1 0 -1 -3 -2 -2 16 K -1 2 0 -1 -3 1 1 -2 -1 -3 -2 5 -1 -3 -1 0 -1 -3 -2 -2 17 K -1 2 0 -1 -3 1 1 -2 -1 -3 -2 5 -1 -3 -1 0 -1 -3 -2 -2 18 F -2 -3 -3 -3 -2 -3 -3 -3 -1 0 0 -3 0 6 -4 -2 -2 1 3 -1 19 Q -1 1 0 0 -3 5 3 -2 0 -3 -2 1 0 -3 -1 0 -1 -2 -1 -2 20 L -1 -2 -3 -4 -1 -2 -3 -4 -3 2 4 -2 2 0 -3 -2 -1 -2 -1 1 21 E -1 0 0 2 -4 2 5 -2 0 -3 -3 1 -2 -3 -1 0 -1 -3 -2 -2 22 F -2 -3 -3 -3 -2 -3 -3 -3 -1 0 0 -3 0 6 -4 -2 -2 1 3 -1 23 D -2 -2 1 6 -3 0 2 -1 -1 -3 -4 -1 -3 -3 -1 0 -1 -4 -3 -3 ..................................................................... 573 I -1 -3 -3 -3 -1 -3 -3 -4 -3 4 2 -3 1 0 -3 -2 -1 -3 -1 3 574 P -1 -2 -2 -1 -3 -1 -1 -2 -2 -3 -3 -1 -2 -4 7 -1 -1 -4 -3 -2 575 L -1 -2 -3 -4 -1 -2 -3 -4 -3 2 4 -2 2 0 -3 -2 -1 -2 -1 1
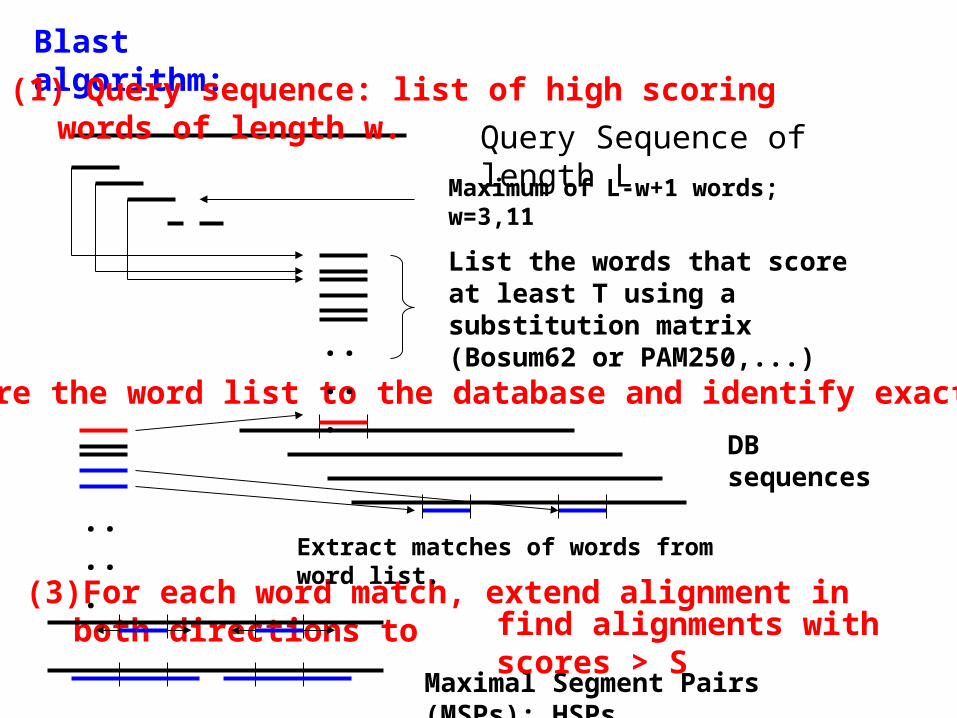
(2) Compare the word list to the database and identify exact matches.
Blast algorithm:
(3)For each word match, extend alignment in both directions to
(1) Query sequence: list of high scoring words of length w.
Query Sequence of length L
Maximum of L-w+1 words; w=3,11
.....
List the words that score at least T using a substitution matrix (Bosum62 or PAM250,...)
.....
DB sequences
Extract matches of words from word list.
Maximal Segment Pairs (MSPs): HSPs
find alignments with scores > S

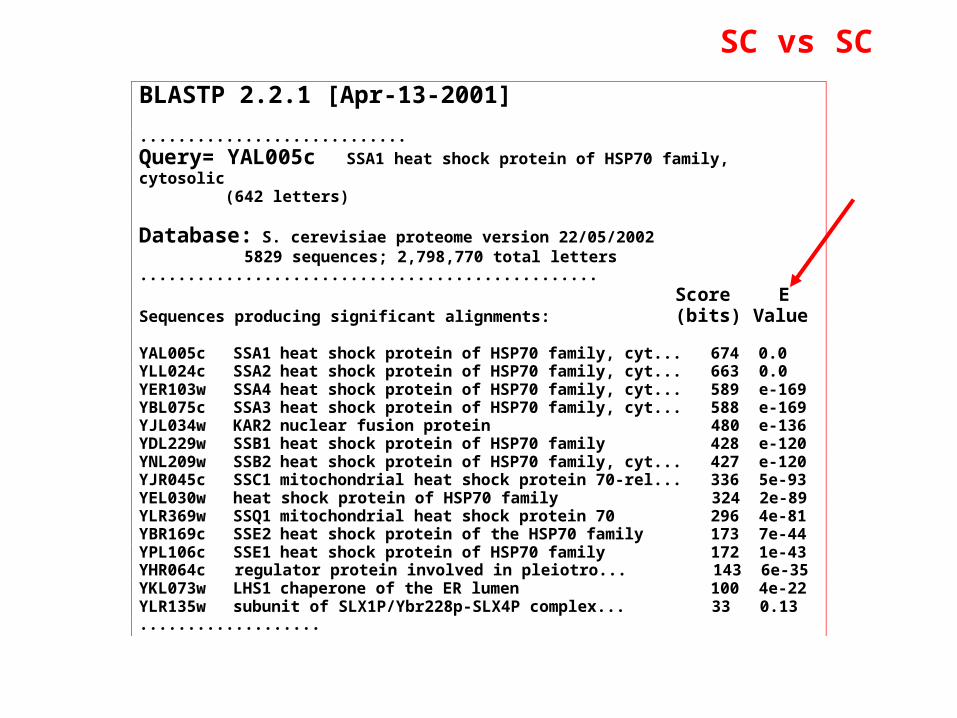
BLASTP 2.2.1 [Apr-13-2001]
............................
Query= YAL005c SSA1 heat shock protein of HSP70 family,cytosolic (642 letters)
Database: S. cerevisiae proteome version 22/05/2002 5829 sequences; 2,798,770 total letters................................................ Score ESequences producing significant alignments: (bits) Value
YAL005c SSA1 heat shock protein of HSP70 family, cyt... 674 0.0YLL024c SSA2 heat shock protein of HSP70 family, cyt... 663 0.0YER103w SSA4 heat shock protein of HSP70 family, cyt... 589 e-169YBL075c SSA3 heat shock protein of HSP70 family, cyt... 588 e-169YJL034w KAR2 nuclear fusion protein 480 e-136YDL229w SSB1 heat shock protein of HSP70 family 428 e-120YNL209w SSB2 heat shock protein of HSP70 family, cyt... 427 e-120YJR045c SSC1 mitochondrial heat shock protein 70-rel... 336 5e-93YEL030w heat shock protein of HSP70 family 324 2e-89YLR369w SSQ1 mitochondrial heat shock protein 70 296 4e-81YBR169c SSE2 heat shock protein of the HSP70 family 173 7e-44YPL106c SSE1 heat shock protein of HSP70 family 172 1e-43YHR064c regulator protein involved in pleiotro... 143 6e-35YKL073w LHS1 chaperone of the ER lumen 100 4e-22YLR135w subunit of SLX1P/Ybr228p-SLX4P complex... 33 0.13...................
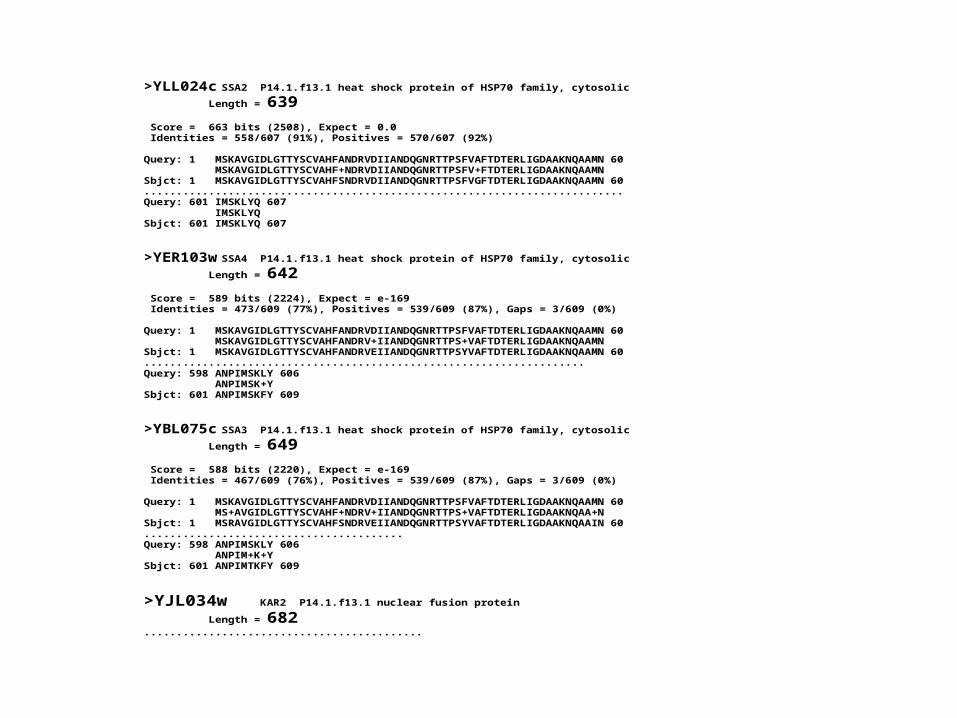
>YLL024c SSA2 P14.1.f13.1 heat shock protein of HSP70 family, cytosolic
Length = 639
Score = 663 bits (2508), Expect = 0.0 Identities = 558/607 (91%), Positives = 570/607 (92%)
Query: 1 MSKAVGIDLGTTYSCVAHFANDRVDIIANDQGNRTTPSFVAFTDTERLIGDAAKNQAAMN 60 MSKAVGIDLGTTYSCVAHF+NDRVDIIANDQGNRTTPSFV+FTDTERLIGDAAKNQAAMNSbjct: 1 MSKAVGIDLGTTYSCVAHFSNDRVDIIANDQGNRTTPSFVGFTDTERLIGDAAKNQAAMN 60..........................................................................Query: 601 IMSKLYQ 607 IMSKLYQSbjct: 601 IMSKLYQ 607
>YER103w SSA4 P14.1.f13.1 heat shock protein of HSP70 family, cytosolic
Length = 642
Score = 589 bits (2224), Expect = e-169 Identities = 473/609 (77%), Positives = 539/609 (87%), Gaps = 3/609 (0%)
Query: 1 MSKAVGIDLGTTYSCVAHFANDRVDIIANDQGNRTTPSFVAFTDTERLIGDAAKNQAAMN 60 MSKAVGIDLGTTYSCVAHFANDRV+IIANDQGNRTTPS+VAFTDTERLIGDAAKNQAAMNSbjct: 1 MSKAVGIDLGTTYSCVAHFANDRVEIIANDQGNRTTPSYVAFTDTERLIGDAAKNQAAMN 60....................................................................Query: 598 ANPIMSKLY 606 ANPIMSK+YSbjct: 601 ANPIMSKFY 609
>YBL075c SSA3 P14.1.f13.1 heat shock protein of HSP70 family, cytosolic
Length = 649
Score = 588 bits (2220), Expect = e-169 Identities = 467/609 (76%), Positives = 539/609 (87%), Gaps = 3/609 (0%)
Query: 1 MSKAVGIDLGTTYSCVAHFANDRVDIIANDQGNRTTPSFVAFTDTERLIGDAAKNQAAMN 60 MS+AVGIDLGTTYSCVAHF+NDRV+IIANDQGNRTTPS+VAFTDTERLIGDAAKNQAA+NSbjct: 1 MSRAVGIDLGTTYSCVAHFSNDRVEIIANDQGNRTTPSYVAFTDTERLIGDAAKNQAAIN 60........................................Query: 598 ANPIMSKLY 606 ANPIM+K+YSbjct: 601 ANPIMTKFY 609
>YJL034w KAR2 P14.1.f13.1 nuclear fusion protein
Length = 682...........................................

Large-scale proteome comparisons

Systematic comparisons Comparenewg2eachg ng list Compareeachg2newg ng list
blastp, blosum62, SEG filter
ro
bestgs1ng allgs1ng
bestgs2ng allgs2ng
bestgsnng allgsnng
NG new proteome
bestnggs1 allnggs1
bestnggs2 allnggs2
bestnggsn allnggsn
GS1 proteome1
GS2 proteome2
GSn proteomen
bestnggsi NG1 size GSij blast p HS/IS/NS
allnggsi NG1 size GSij blast p HS/IS/NS NG2 size GSik blast p HS/IS/NS
- fast determination of significant matches; multiple matches; orthologs determination;
The expected number of HSPs with score at least S is given by: E = Kmne-S. m and n are sequence and database lengths.

Systematic Analysis of Completely Sequenced Organisms
• In silico species specific comparisons;
• Degree of ancestral duplication and of ancestral conservation between pairs of species;
• Families of paralogs (Partition-MCL);
• Families of orthologs (Partition-MCL);
• Determination of the protein dictionary (orthologs);
• Determination of protein conservation profiles;

Homologs - Paralogs - Orthologs
Homologs: A1, B1, A2, B2
Paralogs : A1 vs B1 and A2 vs B2
Orthologs: A1 vs A2 and B1 vs B2
S1 S2
a b
Sequence analysis
Species-1 Species-2
Duplication
Ancestor
Evolution
Speciation
A1 A2
B1 B2
A
B
A
B
A

Time
Duplication
Speciation
A B
Duplication
G
G1 G2
B-G21 B-G22
A-G2A-G1 B-G1
orthologs
outparalogs
inparalogsoutparalogs
Orthologs - inparalogs - outparalogs
• Sequence similarities between out-paralogs should be larger than those between orthologs and in-paralogs;
• Orthology assignments are consistent among several genome pairs;
• Orthologues are present in syntenic order
• Kuzniar A, van Ham RC, Pongor S, Leunissen JA. (2008). The quest for orthologs: finding the corresponding gene across genomes.Trends Genet. 24(11):539-51. Review.

Method Strategy References COG ; KOG BLASTP and manual Tatusov RL, et al. (2000) Inparanoid BLASTP (2 species) Remm, M. et al. (2001) TribeMCL BLASTP, mcl and inflation index Enright AJ, Kunin V, Ouzounis CA. (2003) OrthoMCL BLASTP, mcl and inflation index Li L, Stoeckert CJ Jr, Roos DS. (2003) RIO Phylogeny Zmasek CM, Eddy SR.(2002) RSD BLASP, sequence alignment and
evolutionary distance (using ML) Wall DP, Fraser HB, Hirsh AE. (2003)
OMA Dynamic alignment (instead of BLAST) and evolutionary distance
Dessimoz,C., et al. (2005) ; Schneider A, et al. (2007)
PhIG Phylogeny Dehal PS and Boore JL. (2006) Multiparanoid BLASTP Alexeyenko A, Tamas I, Liu G, Sonnhammer EL. (2006) PhyOP Phylogeny based on ds Goodstadt L, Ponting CP. (2006) • Altenhoff AM, Dessimoz C. (2009). Phylogenetic and functional assessment of orthologs inference projects and methods. PLoS Comput Biol. 5(1):e1000262.
• Kuzniar A, van Ham RC, Pongor S, Leunissen JA. (2008). The quest for orthologs: finding the corresponding gene across genomes.Trends Genet. 24(11):539-51. Review.
• Gabaldon T. (2008). Large-scale assignment of orthology: back to phylogenetics?Genome Biol. 9(10):235.
• Moreno-Hagelsoeb G, Latimer K. (2008). Choosing BLAST options for better detection of orthologs as reciprocal best hits. Bioinformatics. 3 :319-324.
• Chen F, Mackey AJ, Vermunt JK, Roos DS (2007). Assessing performance of orthology detection strategies applied to eukaryotic genomes. PLoS ONE. 2:e383.
• Goodstadt L, Ponting CP (2006). Phylogenetic reconstruction of orthology, paralogy, and conserved synteny for dog and human. PLoS Comput Biol. 2:e133.

Working Examples
Comparing S. cerevisiae (SC) genome with C. elegans (CE) genome
BLASTP 2.2.1 [Apr-13-2001]
............................
Query= YAL005c SSA1 heat shock protein of HSP70 family,cytosolic (642 letters)
Database: S. cerevisiae proteome version 22/05/2002 5829 sequences; 2,798,770 total letters................................................ Score ESequences producing significant alignments: (bits) Value
YAL005c SSA1 heat shock protein of HSP70 family, cyt... 674 0.0YLL024c SSA2 heat shock protein of HSP70 family, cyt... 663 0.0YER103w SSA4 heat shock protein of HSP70 family, cyt... 589 e-169YBL075c SSA3 heat shock protein of HSP70 family, cyt... 588 e-169YJL034w KAR2 nuclear fusion protein 480 e-136YDL229w SSB1 heat shock protein of HSP70 family 428 e-120YNL209w SSB2 heat shock protein of HSP70 family, cyt... 427 e-120YJR045c SSC1 mitochondrial heat shock protein 70-rel... 336 5e-93YEL030w heat shock protein of HSP70 family 324 2e-89YLR369w SSQ1 mitochondrial heat shock protein 70 296 4e-81YBR169c SSE2 heat shock protein of the HSP70 family 173 7e-44YPL106c SSE1 heat shock protein of HSP70 family 172 1e-43YHR064c regulator protein involved in pleiotro... 143 6e-35YKL073w LHS1 chaperone of the ER lumen 100 4e-22YLR135w subunit of SLX1P/Ybr228p-SLX4P complex... 33 0.13...................
SC vs SC
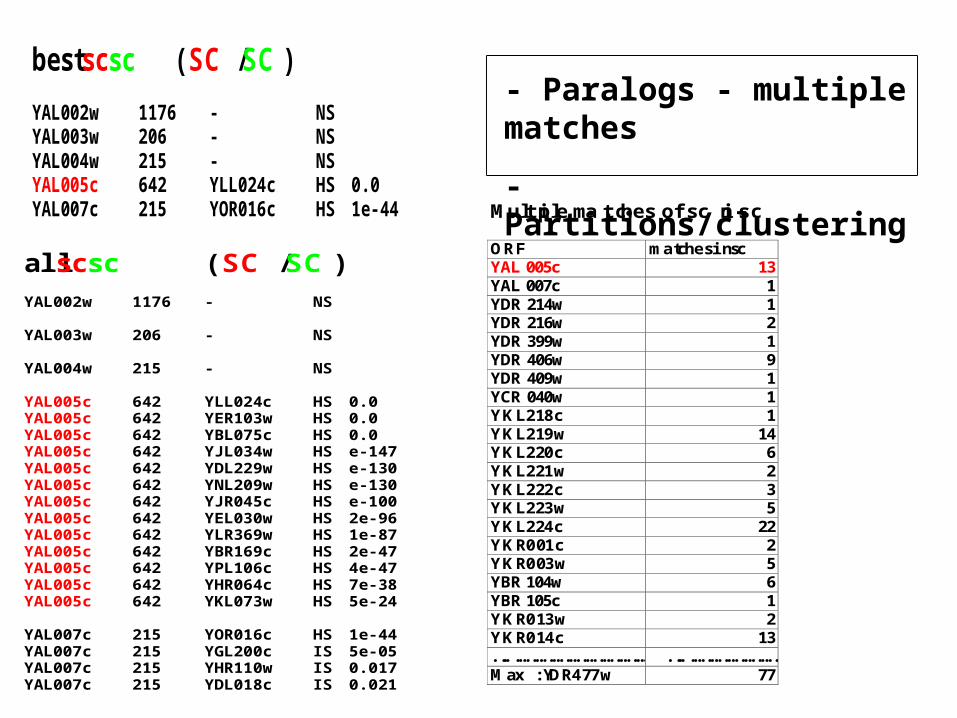
bestscsc ( SC / SC )
YAL002w 1176 - NSYAL003w 206 - NSYAL004w 215 - NSYAL005c 642 YLL024c HS 0.0YAL007c 215 YOR016c HS 1e-44
allscsc ( SC / SC )YAL002w 1176 - NS
YAL003w 206 - NS
YAL004w 215 - NS
YAL005c 642 YLL024c HS 0.0YAL005c 642 YER103w HS 0.0YAL005c 642 YBL075c HS 0.0YAL005c 642 YJL034w HS e-147YAL005c 642 YDL229w HS e-130YAL005c 642 YNL209w HS e-130YAL005c 642 YJR045c HS e-100YAL005c 642 YEL030w HS 2e-96YAL005c 642 YLR369w HS 1e-87YAL005c 642 YBR169c HS 2e-47YAL005c 642 YPL106c HS 4e-47YAL005c 642 YHR064c HS 7e-38YAL005c 642 YKL073w HS 5e-24
YAL007c 215 YOR016c HS 1e-44YAL007c 215 YGL200c IS 5e-05YAL007c 215 YHR110w IS 0.017YAL007c 215 YDL018c IS 0.021
- Paralogs - multiple matches
- Partitions/clustering
Multiple matches of sc in sc
ORF matches in scYAL005c 13YAL007c 1YDR214w 1YDR216w 2YDR399w 1YDR406w 9YDR409w 1YCR040w 1YKL218c 1YKL219w 14YKL220c 6YKL221w 2YKL222c 3YKL223w 5YKL224c 22YKR001c 2YKR003w 5YBR104w 6YBR105c 1YKR013w 2YKR014c 13.................................... ..........................Max : YDR477w 77

bestscce (SC / CE)
YAL002w 1176 C42C1.4 HS 2e-15YAL003w 206 F54H12.6 HS 4e-22YAL004w 215 - NSYAL005c 642 F26D10.3 HS e-172YAL007c 215 F57B10.5 HS 9e-08YAL009w 259 F16D3.7 IS 0.013YAL019w 1131 M03C11.8 HS 7e-92YAL020c 333 F07C3.4 IS 7e-04YAL021c 837 ZC518.3 HS 5e-47
allscce (SC / CE)
YAL002w 1176 C42C1.4 HS 2e-15
YAL003w 206 F54H12.6 HS 4e-22YAL003w 206 Y41E3.10 HS 2e-17
YAL004w 215 - NS
YAL005c 642 F26D10.3 HS e-172YAL005c 642 F44E5.4 HS e-153YAL005c 642 F44E5.5 HS e-153YAL005c 642 C12C8.1 HS e-152YAL005c 642 C15H9.6 HS e-148YAL005c 642 F43E2.8 HS e-144YAL005c 642 C37H5.8 HS e-104YAL005c 642 F11F1.1 HS 1e-77YAL005c 642 F54C9.2 HS 4e-51YAL005c 642 K09C4.3 HS 4e-47YAL005c 642 T28F3.2 HS 2e-45YAL005c 642 C30C11.4 HS 7e-43YAL005c 642 T24H7.2 HS 2e-34YAL005c 642 T14G8.3 HS 8e-33
bestcesc ( CE / SC)
C42C1.4 1259 YAL002w HS 8e-16F54H12.6 213 YAL003w HS 4e-20F26D10.3 640 YER103w HS e-174F26D10.3 640 YER103w HS e-174F57B10.5 203 YAL007c HS 7e-13F16D3.7 516 YHL003c IS 9e-04M03C11.8 1038 YAL019w HS 2e-87AC3.1 356 - NSAC3.2 949 YLR189c IS 0.038AC3.3 425 - NSAC3.4 600 YNL326c HS 1e-12
allcesc (CE / SC )
C42C1.4 1259 YAL002w HS 8e-16
F54H12.6 213 YAL003w HS 4e-20
F26D10.3 640 YER103w HS e-174F26D10.3 640 YBL075c HS e-174F26D10.3 640 YLL024c HS e-172F26D10.3 640 YAL005c HS e-171F26D10.3 640 YJL034w HS e-141F26D10.3 640 YDL229w HS e-129F26D10.3 640 YNL209w HS e-129F26D10.3 640 YJR045c HS e-100F26D10.3 640 YEL030w HS 2e-97F26D10.3 640 YLR369w HS 1e-83F26D10.3 640 YPL106c HS 2e-45F26D10.3 640 YBR169c HS 5e-45F26D10.3 640 YHR064c HS 8e-36F26D10.3 640 YKL073w HS 3e-22
SC/CE CE/SC
Reciprocal Best Hits (RBH)
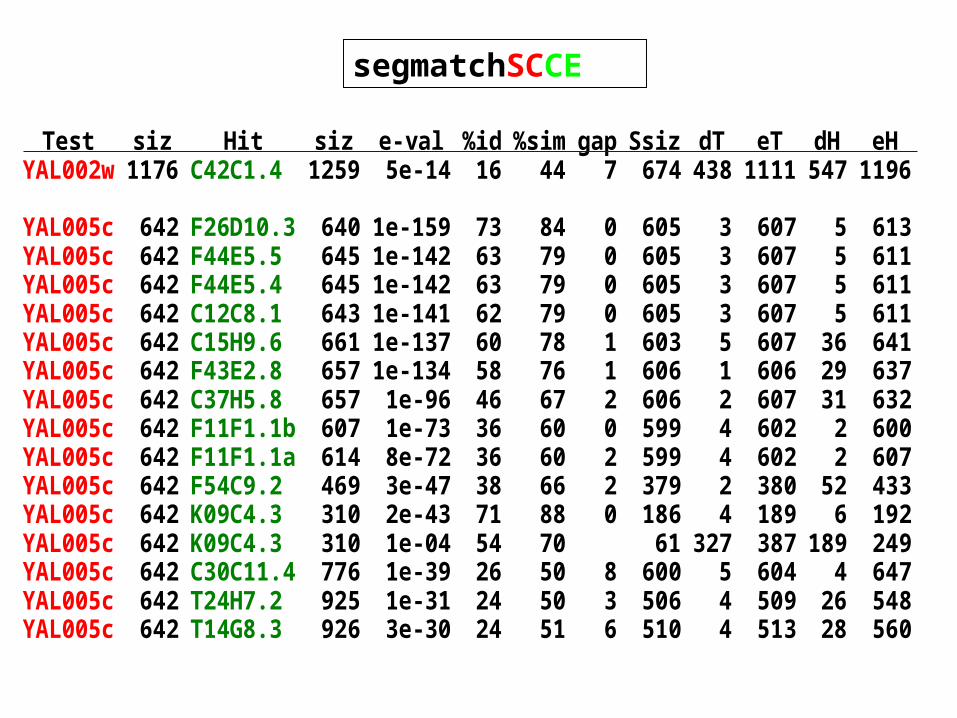
segmatchSCCE
Test siz Hit siz e-val %id %sim gap Ssiz dT eT dH eHYAL002w 1176 C42C1.4 1259 5e-14 16 44 7 674 438 1111 547 1196
YAL005c 642 F26D10.3 640 1e-159 73 84 0 605 3 607 5 613YAL005c 642 F44E5.5 645 1e-142 63 79 0 605 3 607 5 611YAL005c 642 F44E5.4 645 1e-142 63 79 0 605 3 607 5 611YAL005c 642 C12C8.1 643 1e-141 62 79 0 605 3 607 5 611YAL005c 642 C15H9.6 661 1e-137 60 78 1 603 5 607 36 641YAL005c 642 F43E2.8 657 1e-134 58 76 1 606 1 606 29 637YAL005c 642 C37H5.8 657 1e-96 46 67 2 606 2 607 31 632YAL005c 642 F11F1.1b 607 1e-73 36 60 0 599 4 602 2 600YAL005c 642 F11F1.1a 614 8e-72 36 60 2 599 4 602 2 607YAL005c 642 F54C9.2 469 3e-47 38 66 2 379 2 380 52 433YAL005c 642 K09C4.3 310 2e-43 71 88 0 186 4 189 6 192YAL005c 642 K09C4.3 310 1e-04 54 70 61 327 387 189 249YAL005c 642 C30C11.4 776 1e-39 26 50 8 600 5 604 4 647YAL005c 642 T24H7.2 925 1e-31 24 50 3 506 4 509 26 548YAL005c 642 T14G8.3 926 3e-30 24 51 6 510 4 513 28 560

Descriptions
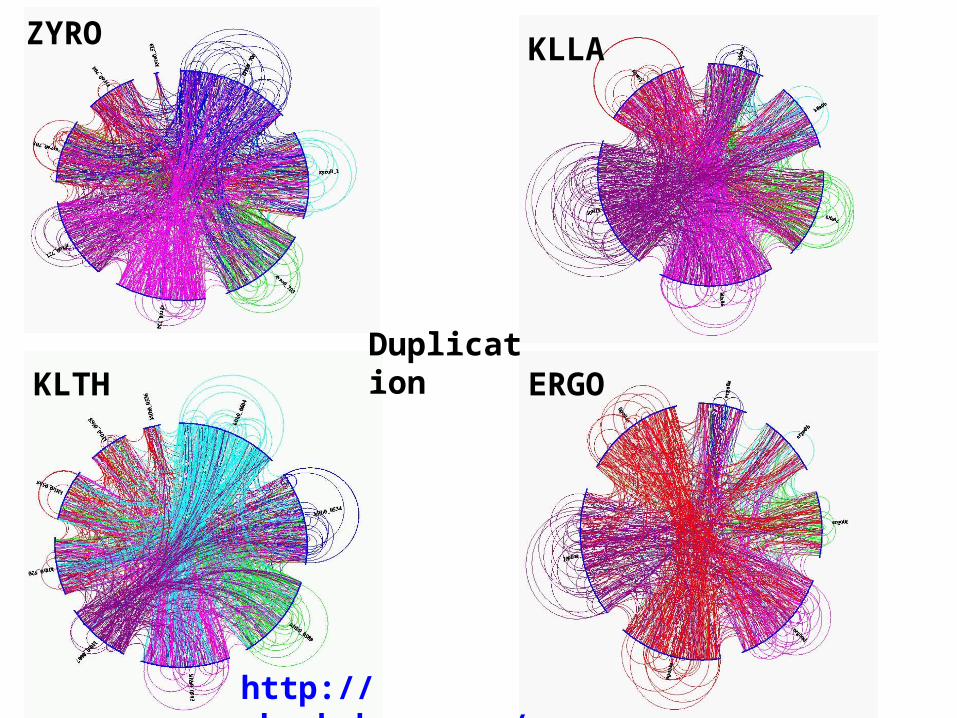
ZYRO KLLA
KLTH ERGODuplication
http://mkweb.bcgsc.ca/circos/

org SC SP CE DM AG CA ATH HS MUS FR PF ECUNSC 40.5 63.9 17.5 27.1 22.3 65.9 23.4 22.9 27.3 18.0 22.5 35.8SP 58.4 37.4 18.8 29.3 26.3 54.3 25.0 25.0 29.6 20.0 24.6 38.4CE 38.1 46.6 65.2 51.9 50.6 35.5 27.5 44.6 54.4 42.4 24.8 34.8DM 40.5 50.2 39.2 65.8 69.9 37.5 29.5 50.3 62.7 47.9 26.5 36.3AG 40.9 50.2 39.8 73.1 59.5 38.0 30.6 50.2 60.3 48.7 26.5 36.0CA 71.8 65.5 18.4 27.7 25.7 35.8 24.3 23.2 27.8 18.5 22.3 35.7ATH 40.3 47.8 21.7 31.5 30.3 37.0 83.6 25.6 29.7 21.9 26.2 33.4HS 43.0 53.3 40.0 61.3 54.5 39.7 32.1 66.7 90.8 68.8 28.2 37.7MUS 41.7 52.5 39.5 62.1 54.7 39.1 31.5 76.8 77.8 67.7 27.6 37.2FR 42.0 52.6 40.0 60.7 59.9 39.5 32.7 68.7 81.8 63.4 27.6 37.4PF 25.9 31.2 13.1 19.3 15.9 22.2 16.3 17.2 21.0 13.2 28.3 28.9ECUN 19.5 23.4 8.9 13.1 10.8 16.2 11.4 12.0 15.2 9.0 13.6 26.1MJ 11.5 13.3 4.9 6.7 6.0 10.2 6.0 4.8 5.6 3.7 8.7 15.4MTH 13.6 16.2 4.6 7.4 7.6 11.2 8.0 5.1 6.1 4.0 8.3 15.2AF 14.4 16.5 5.9 8.2 8.7 11.8 8.7 5.6 6.6 4.5 8.6 15.4PH 16.3 18.7 5.0 7.1 9.2 11.1 9.7 5.2 6.0 4.1 7.9 15.3PA 14.3 15.2 5.4 7.5 7.3 11.9 7.4 5.5 6.4 4.3 8.3 15.9APEM 15.5 20.1 4.8 7.3 10.6 10.3 9.4 5.2 5.9 3.9 7.2 14.9TA 15.2 17.5 5.9 8.3 8.3 12.7 8.2 5.3 6.3 4.2 8.6 14.8TV 15.4 17.8 6.2 8.3 8.7 13.3 8.3 5.6 6.8 4.4 8.7 15.0H 14.8 17.7 5.8 8.3 9.8 12.0 10.2 5.5 6.6 4.5 8.0 13.9SSP2 16.7 19.4 7.1 9.1 9.4 14.2 9.5 6.2 7.4 4.9 9.5 15.9PFU 17.0 22.8 6.5 9.3 11.1 13.3 12.3 7.0 8.0 5.6 9.1 17.1STO 18.6 23.1 6.8 8.6 11.4 13.7 11.1 5.9 7.1 4.5 9.1 15.7PYAE 15.6 19.5 5.3 8.2 9.9 11.8 9.5 5.8 6.9 4.5 8.1 15.0MA 16.0 18.9 7.1 10.8 12.5 14.7 9.7 7.4 8.7 6.4 9.8 17.0MK 13.0 14.6 4.0 6.2 6.1 10.7 6.9 4.6 5.4 3.5 7.3 14.1MMA 14.8 17.4 6.4 9.2 9.5 13.5 8.1 6.6 7.9 5.3 9.7 15.8HI 13.0 14.3 4.8 7.3 8.5 11.1 8.7 4.4 5.4 4.0 8.2 8.7…..tnsp 74.4 79.2 49.7 76.4 81.0 72.6 58.8 78.7 93.7 72.8 42.3 48.1
Ancestral duplication and ancestral conservation
Wij

Example: Duplication – conservation between chlamydiae species
spec CHMU CHTH CHTR CHTL CHTB CHAB CHFE CHCA CHPN CHPC CHPT CHPJ PAUW CHMU 22.6 95.2 96.0 96.6 96.6 88.3 84.6 83.8 74.3 78.5 75.7 79.1 36.1 CHTH 95.1 22.9 99.6 99.4 99.4 89.4 85.6 84.5 75.0 79.3 76.4 80.0 36.2 CHTR 94.5 98.3 21.9 99.4 99.4 89.4 85.1 84.1 75.0 79.4 76.5 80.1 35.9 CHTL 93.6 96.3 97.7 22.1 100. 89.2 84.8 83.5 74.6 78.9 76.0 79.6 35.9 CHTB 93.6 96.3 97.7 100. 22.1 89.2 84.9 83.3 74.6 78.9 76.0 79.6 35.8 CHAB 90.5 91.1 92.5 94.1 94.1 23.4 92.4 92.0 80.8 85.6 82.2 85.9 37.0 CHFE 91.5 93.1 93.6 94.7 94.7 97.7 24.9 94.8 82.2 86.9 83.6 87.4 37.5 CHCA 91.8 92.5 93.0 94.2 94.1 97.6 95.1 23.1 82.0 86.9 83.6 87.2 37.0 CHPN 90.0 90.6 92.2 93.5 93.5 94.4 90.5 89.6 25.2 98.7 94.2 97.9 36.7 CHPC 89.6 90.4 92.1 93.4 93.4 94.3 90.2 89.4 93.1 27.1 94.2 99.0 36.7 CHPT 90.1 90.9 92.4 93.8 93.8 94.6 90.7 89.9 93.5 99.1 26.0 98.8 36.9 CHPJ 90.1 90.9 92.5 93.8 93.8 94.6 90.6 89.8 93.2 99.7 94.5 27.3 36.8 PAUW 72.1 71.7 72.7 74.1 74.1 72.1 67.6 66.7 60.5 64.2 60.7 63.3 35.6
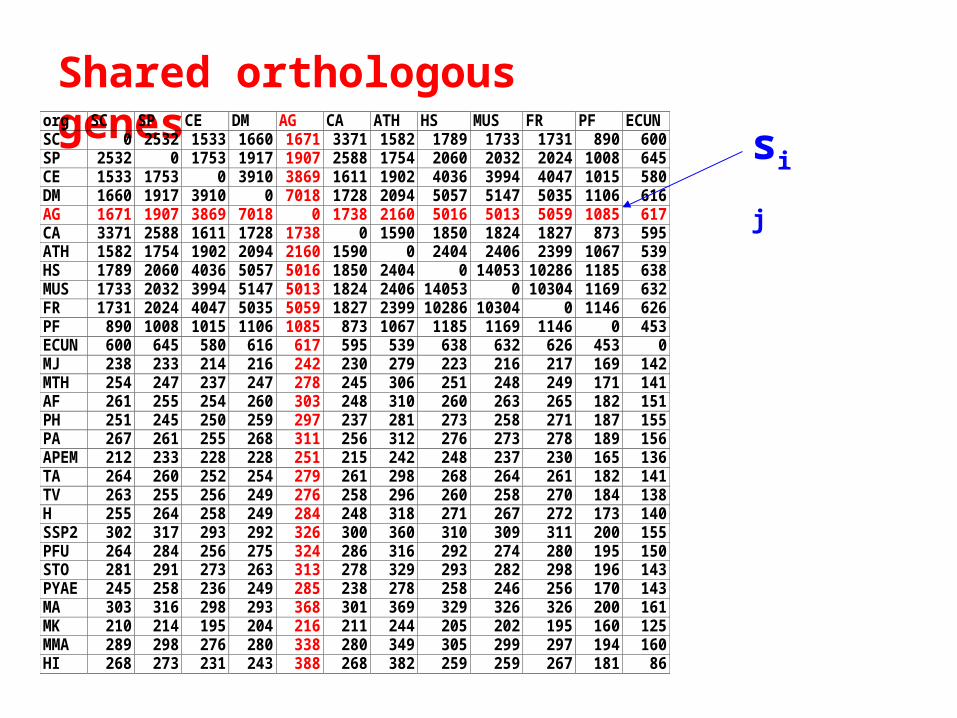
Shared orthologous genesorg SC SP CE DM AG CA ATH HS MUS FR PF ECUNSC 0 2532 1533 1660 1671 3371 1582 1789 1733 1731 890 600SP 2532 0 1753 1917 1907 2588 1754 2060 2032 2024 1008 645CE 1533 1753 0 3910 3869 1611 1902 4036 3994 4047 1015 580DM 1660 1917 3910 0 7018 1728 2094 5057 5147 5035 1106 616AG 1671 1907 3869 7018 0 1738 2160 5016 5013 5059 1085 617CA 3371 2588 1611 1728 1738 0 1590 1850 1824 1827 873 595ATH 1582 1754 1902 2094 2160 1590 0 2404 2406 2399 1067 539HS 1789 2060 4036 5057 5016 1850 2404 0 14053 10286 1185 638MUS 1733 2032 3994 5147 5013 1824 2406 14053 0 10304 1169 632FR 1731 2024 4047 5035 5059 1827 2399 10286 10304 0 1146 626PF 890 1008 1015 1106 1085 873 1067 1185 1169 1146 0 453ECUN 600 645 580 616 617 595 539 638 632 626 453 0MJ 238 233 214 216 242 230 279 223 216 217 169 142MTH 254 247 237 247 278 245 306 251 248 249 171 141AF 261 255 254 260 303 248 310 260 263 265 182 151PH 251 245 250 259 297 237 281 273 258 271 187 155PA 267 261 255 268 311 256 312 276 273 278 189 156APEM 212 233 228 228 251 215 242 248 237 230 165 136TA 264 260 252 254 279 261 298 268 264 261 182 141TV 263 255 256 249 276 258 296 260 258 270 184 138H 255 264 258 249 284 248 318 271 267 272 173 140SSP2 302 317 293 292 326 300 360 310 309 311 200 155PFU 264 284 256 275 324 286 316 292 274 280 195 150STO 281 291 273 263 313 278 329 293 282 298 196 143PYAE 245 258 236 249 285 238 278 258 246 256 170 143MA 303 316 298 293 368 301 369 329 326 326 200 161MK 210 214 195 204 216 211 244 205 202 195 160 125MMA 289 298 276 280 338 280 349 305 299 297 194 160HI 268 273 231 243 388 268 382 259 259 267 181 86
sij
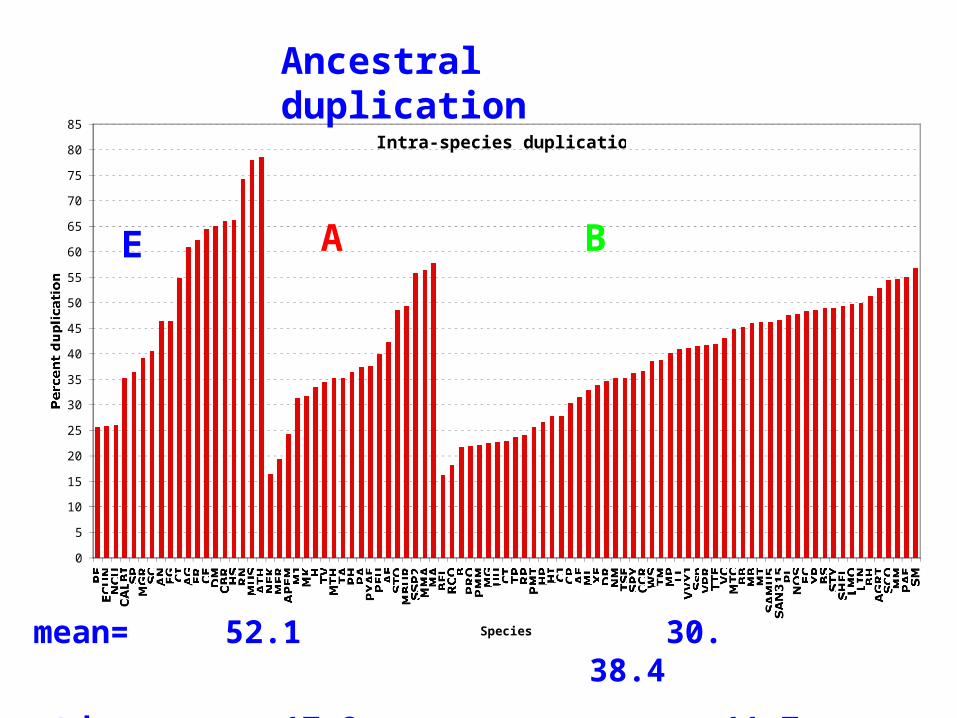
Intra-species duplication
0
5
10
15
20
25
30
35
40
45
50
55
60
65
70
75
80
85
PF
ECUNNCU
CALBI
SPMGR
SCANFGCIAGFRCEDMCBRHSRN
MUSATHNEKMFRAPEM
MJMKH
TVMTH
TAPHPAPYAE
PFUAF
STOMBURSSP2MMA
MABFLRCO
B
PROPMMMGUUCTTPRP
PMTHPHICJCPAEMLXFDRNMTSESPYCCRWSTMMPLL
VVYJSspVPRTTEVC
MTCBBMBMT
SAMU5SAN315
PLNOS
ECYPBSSTY
SHFLLMOLINBHAGRT
SCOMMPAESM
Species
Percent duplication
E A B
Ancestral duplication
mean= 52.1 30. 38.4
std= 17.8 11.7 11.2
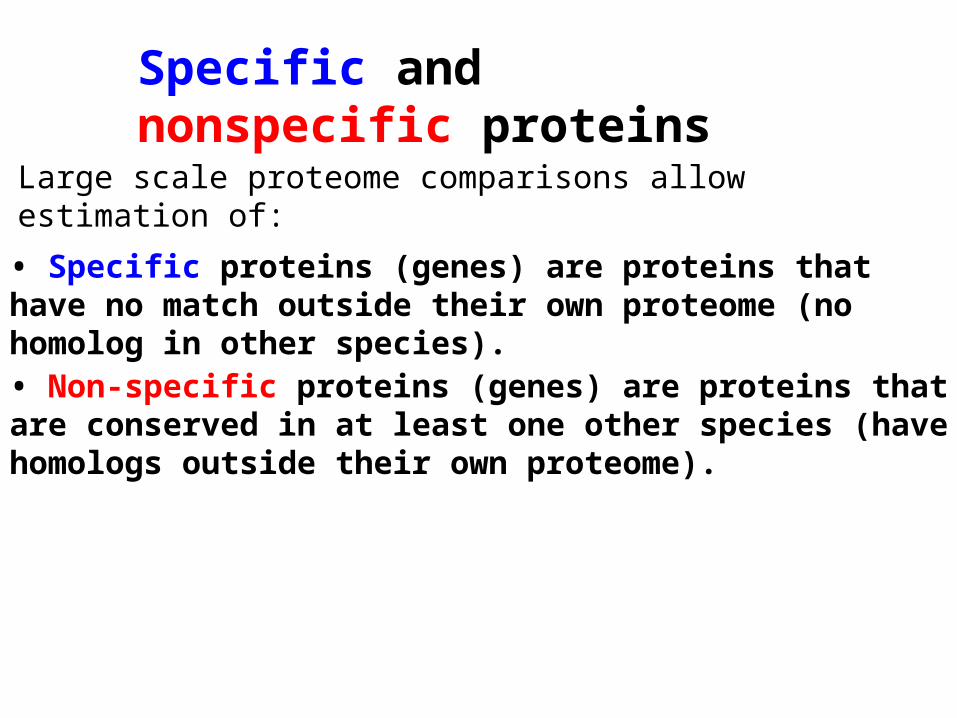
Specific and nonspecific proteins
• Specific proteins (genes) are proteins that have no match outside their own proteome (no homolog in other species).
• Non-specific proteins (genes) are proteins that are conserved in at least one other species (have homologs outside their own proteome).
Large scale proteome comparisons allow estimation of:

Specific and nonspecific proportions
0
10
20
30
40
50
60
70
80
90
100
CBRRN
MUSANSPFGCEHSSCAGDMCA
MGRFRCI
NCUATHECUN
PFPATAMMA
TVSSP2MTH
AFPHPFU
MBURSTO
MJMAMFRNEKMK
H
APEMPYAE
SAN315
BFLMTMGMBB
RP
SAMU50
LMOSHFLECCT
LINHIMPSspAEML
PMMBS
TSEMTCSTYYPWSSMCJTM
AGRT
VCPAEPROVPR
BHHPSPY
PLVVYJ
CPPMTTTE
LLMMUU
CCRNOSTPNMRCO
DRSCO
XFBB
E A B
mean% 76.2 84.3 87.6

genessame phylumdifferent phylum0
100%
con
serv
atio
nSpecies specific genes
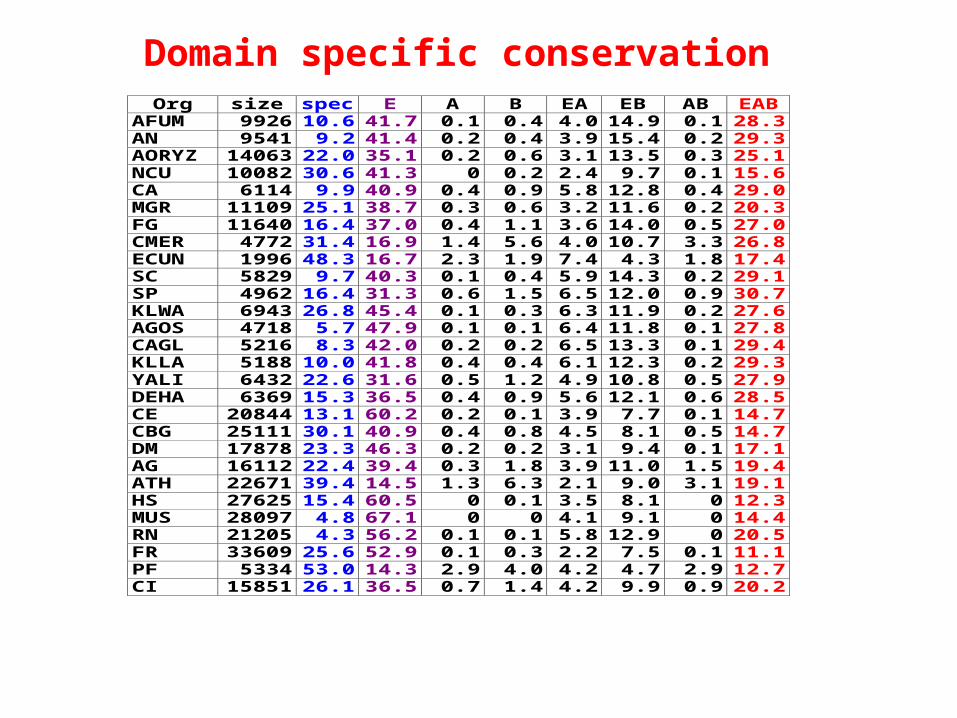
Org size spec E A B EA EB AB EABAFUM 9926 10.6 41.7 0.1 0.4 4.0 14.9 0.1 28.3AN 9541 9.2 41.4 0.2 0.4 3.9 15.4 0.2 29.3AORYZ 14063 22.0 35.1 0.2 0.6 3.1 13.5 0.3 25.1NCU 10082 30.6 41.3 0 0.2 2.4 9.7 0.1 15.6CA 6114 9.9 40.9 0.4 0.9 5.8 12.8 0.4 29.0MGR 11109 25.1 38.7 0.3 0.6 3.2 11.6 0.2 20.3FG 11640 16.4 37.0 0.4 1.1 3.6 14.0 0.5 27.0CMER 4772 31.4 16.9 1.4 5.6 4.0 10.7 3.3 26.8ECUN 1996 48.3 16.7 2.3 1.9 7.4 4.3 1.8 17.4SC 5829 9.7 40.3 0.1 0.4 5.9 14.3 0.2 29.1SP 4962 16.4 31.3 0.6 1.5 6.5 12.0 0.9 30.7KLWA 6943 26.8 45.4 0.1 0.3 6.3 11.9 0.2 27.6AGOS 4718 5.7 47.9 0.1 0.1 6.4 11.8 0.1 27.8CAGL 5216 8.3 42.0 0.2 0.2 6.5 13.3 0.1 29.4KLLA 5188 10.0 41.8 0.4 0.4 6.1 12.3 0.2 29.3YALI 6432 22.6 31.6 0.5 1.2 4.9 10.8 0.5 27.9DEHA 6369 15.3 36.5 0.4 0.9 5.6 12.1 0.6 28.5CE 20844 13.1 60.2 0.2 0.1 3.9 7.7 0.1 14.7CBG 25111 30.1 40.9 0.4 0.8 4.5 8.1 0.5 14.7DM 17878 23.3 46.3 0.2 0.2 3.1 9.4 0.1 17.1AG 16112 22.4 39.4 0.3 1.8 3.9 11.0 1.5 19.4ATH 22671 39.4 14.5 1.3 6.3 2.1 9.0 3.1 19.1HS 27625 15.4 60.5 0 0.1 3.5 8.1 0 12.3MUS 28097 4.8 67.1 0 0 4.1 9.1 0 14.4RN 21205 4.3 56.2 0.1 0.1 5.8 12.9 0 20.5FR 33609 25.6 52.9 0.1 0.3 2.2 7.5 0.1 11.1PF 5334 53.0 14.3 2.9 4.0 4.2 4.7 2.9 12.7CI 15851 26.1 36.5 0.7 1.4 4.2 9.9 0.9 20.2
Domain specific conservation
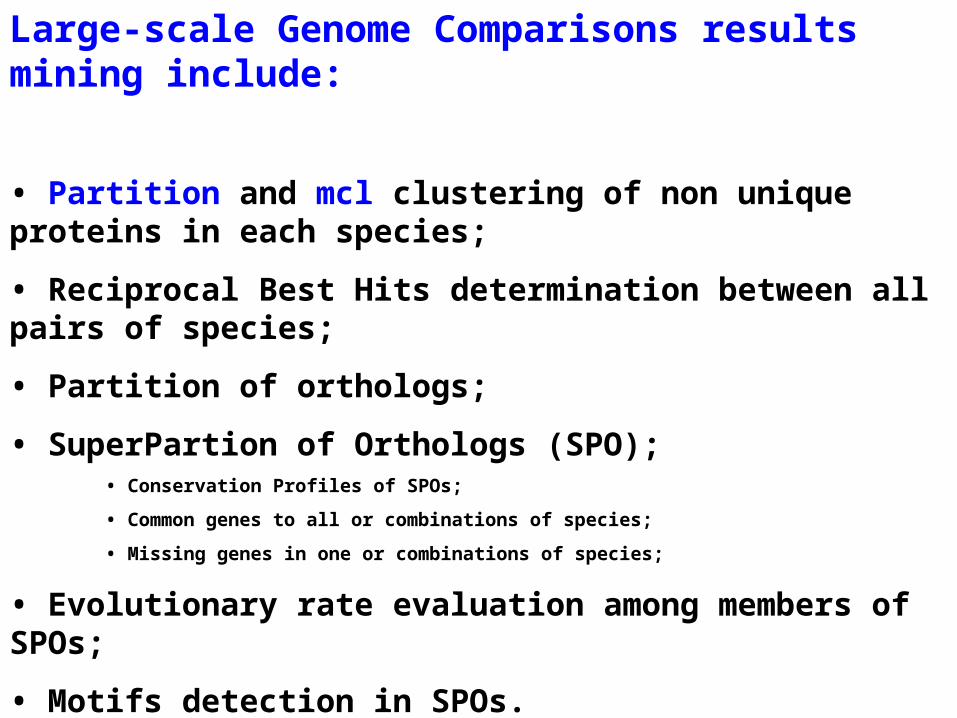
Large-scale Genome Comparisons results mining include:
• Partition and mcl clustering of non unique proteins in each species;
• Reciprocal Best Hits determination between all pairs of species;
• Partition of orthologs;
• SuperPartion of Orthologs (SPO);• Conservation Profiles of SPOs;
• Common genes to all or combinations of species;
• Missing genes in one or combinations of species;
• Evolutionary rate evaluation among members of SPOs;
• Motifs detection in SPOs.

Clusters (families) of paralogues and of orthologues

Paralogs: Partition and clustering of duplicated proteins
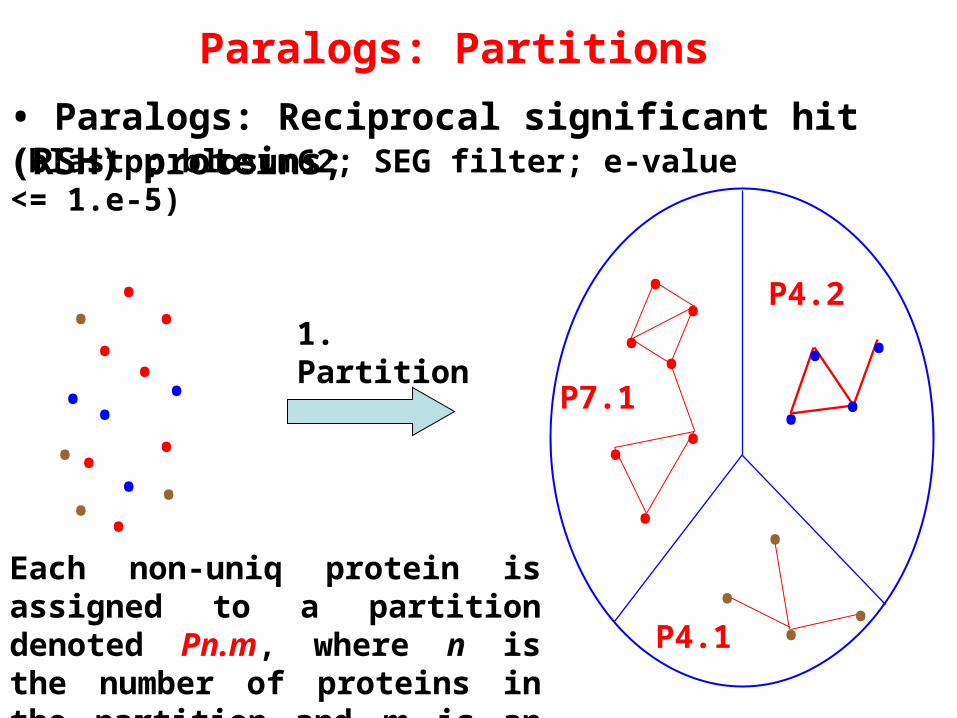
• Each non-uniq protein is assigned a partition denoted Pn.m, where n is the number of proteins in the partition and m is an arbitrary order;
• In parallel, the same set of non-uniq proteins is clustered using the mcl algorithm (Markov Cluster algorithm by Stijn van Dongen);
-The clustering was performed using -log(blastp e-values) and an inflation index I=3.0;
Result: Each protein belongs to both a partition (Pn.m) and an mcl cluster (Cp.q), which are concatenated to form the final ‘family’ assignment Pn.m.Cp.q to the loci;
• The term ‘singleton’ is assigned to locis that do not have significant matches;
• Reciprocal best hit protein are considered putative paralogs;
••
• •
••
•
•
••
•
•••
•
Paralogs: Partitions
• Paralogs: Reciprocal significant hit (RSH) proteins;
P7.1
••
• •
••
• •
•• •P4.1
••••
P4.21. Partition
Each non-uniq protein is assigned to a partition denoted Pn.m, where n is the number of proteins in the partition and m is an arbitrary order;
(blastp; blosum62; SEG filter; e-value <= 1.e-5)

••
• •
••
•
•
••
•
•••
•
Paralogs: mcl Clustering• Paralogs: Reciprocal significant hit (RSH) proteins;
• mcl clustering was performed using: -log(blastp(e_value)) and an
inflation index I=3.0;
2. mcl clustering
••
• •
••
• •
•• •
••••
C4.1
C3.1
C3.2 C1.1
C1.2
C1.3
C2.1
C2.1
(blastp; blosum62; SEG filter; e-value <= 1.e-5)
MCL: Markov Cluster algorithm
Stijn van Dongen: A cluster algorithm for graphs. http://micans.org/mcl/

••
• •
••
• •
•• •
••••
P7.1.C4.1
P7.1.C3.1
P4.2.C3.2
P4.2.C1.1
P4.1.C1.2
P4.1.C1.3
P4.1.C2.1 P4.1.C2.1
••
• •
••
•
•
••
•
•••
•
Paralogs: Partitions/mcl Clustering
Each protein is assigned to a partition and an mcl cluster: Pn.m.Cp.q i.e a class of paralogs.
• Paralogs: Reciprocal significant hit (RSH) proteins;(blastp; blosum62; SEG filter; e-value <= 1.e-5)
3:Part/mcl

YKL212w 623 YIL002c 4e-11YIL002c 946 YOR109w 7e-94YIL002c 946 YNL106c 5e-90YIL002c 946 YOL065c 3e-10YNL106c 1183 YIL002c 1e-89YOR109w 1107 YIL002c 1e-90YKL212w 623 YOR109w 2e-34YKL212w 623 YNL106c 3e-34YKL212w 623 YNL325c 8e-29YNL106c 1183 YKL212w 1e-33YNL325c 879 YKL212w 6e-25YOR109w 1107 YKL212w 2e-30YNL106c 1183 YOR109w 0.0YNL106c 1183 YNL325c 2e-22YNL325c 879 YNL106c 1e-22YOL065c 384 YNL106c 4e-10YOR109w 1107 YNL106c 0.0YNL325c 879 YOR109w 4e-20YOR109w 1107 YNL325c 2e-16
Example of Partition/mcl clustering
P6 19Total number of distinct genes= 6--------------------
YOL065c P6.9.C6.48 6 6YIL002c P6.9.C6.48 6 6YNL325c P6.9.C6.48 6 6YKL212w P6.9.C6.48 6 6YOR109w P6.9.C6.48 6 6YNL106c P6.9.C6.48 6 6
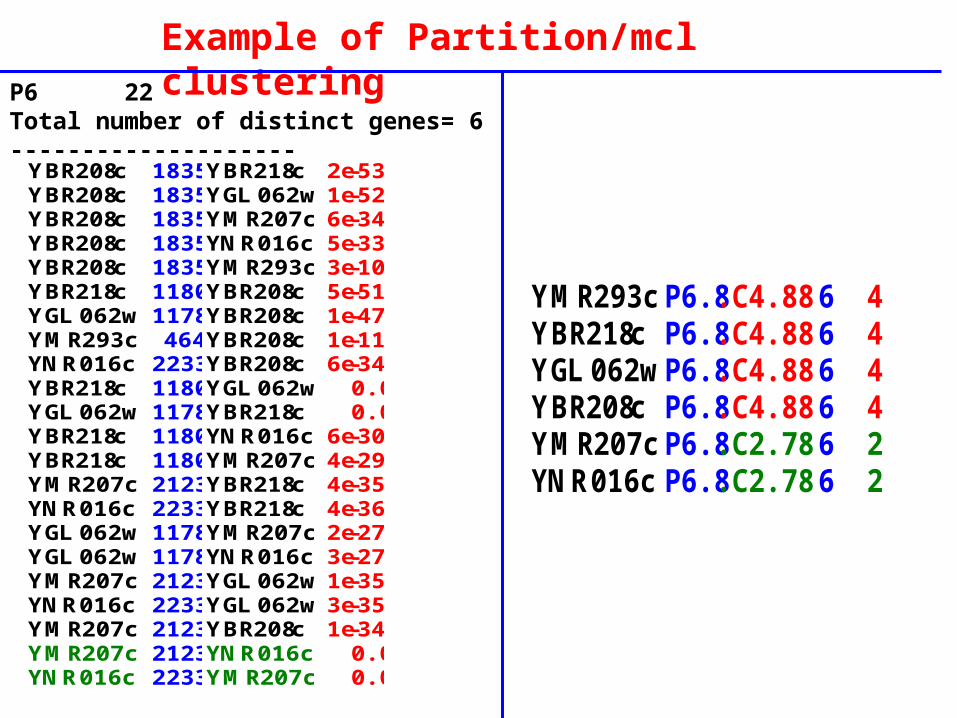
YMR293c P6.8.C4.88 6 4YBR218c P6.8.C4.88 6 4YGL062w P6.8.C4.88 6 4YBR208c P6.8.C4.88 6 4YMR207c P6.8.C2.782 6 2YNR016c P6.8.C2.782 6 2
YBR208c 1835 YBR218c 2e-53YBR208c 1835 YGL062w 1e-52YBR208c 1835 YMR207c 6e-34YBR208c 1835 YNR016c 5e-33YBR208c 1835 YMR293c 3e-10YBR218c 1180 YBR208c 5e-51YGL062w 1178 YBR208c 1e-47YMR293c 464 YBR208c 1e-11YNR016c 2233 YBR208c 6e-34YBR218c 1180 YGL062w 0.0YGL062w 1178 YBR218c 0.0YBR218c 1180 YNR016c 6e-30YBR218c 1180 YMR207c 4e-29YMR207c 2123 YBR218c 4e-35YNR016c 2233 YBR218c 4e-36YGL062w 1178 YMR207c 2e-27YGL062w 1178 YNR016c 3e-27YMR207c 2123 YGL062w 1e-35YNR016c 2233 YGL062w 3e-35YMR207c 2123 YBR208c 1e-34YMR207c 2123 YNR016c 0.0YNR016c 2233 YMR207c 0.0
Example of Partition/mcl clusteringP6 22Total number of distinct genes= 6--------------------
Inter-species families of orthologs
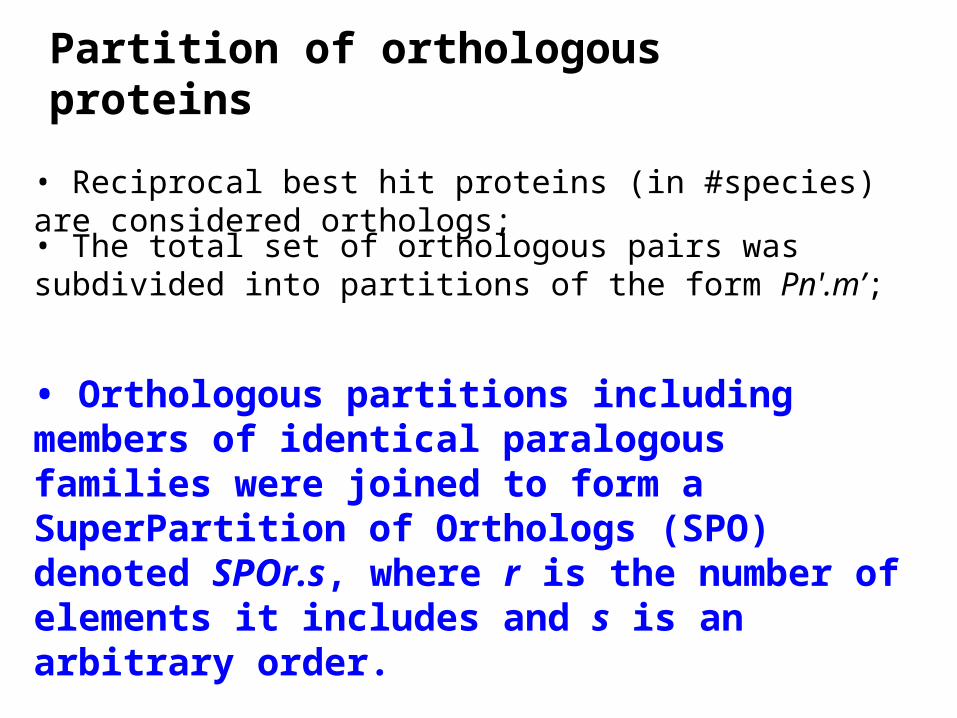
Partition of orthologous proteins
• Reciprocal best hit proteins (in #species) are considered orthologs;
• The total set of orthologous pairs was subdivided into partitions of the form Pn'.m’;
• Orthologous partitions including members of identical paralogous families were joined to form a SuperPartition of Orthologs (SPO) denoted SPOr.s, where r is the number of elements it includes and s is an arbitrary order.

s11
s12
s21
s22
s13
s23
s31
s32
s41
s42
s51
s52
s53
s54
Colours show clusters of paralogs in each genome and arrows show RBH relationships.
s11
s12
s21
s22
s31
s32
s41
s42
s51
s52
SPO10.1
s11 s21 s31 s41 s51
s12 s52 s42
s32s22
PRBH5.1
PRBH3.1
PRBH2.1
SuperPartitions of Orthologs and in-Paralogs

s11
s13
s21
s22
SPO4.1
s11
s12
s13
s14
s21
s22
s23
s11 s21
s13 s22
PRBH2.1
PRBH2.2
s11
s12
s13
s14
s21
s22
s31
s23 s32
s11
s12
s13
s21 s22
s23 s31
s32
SPO8.1
s11 s21
s12 s31
s13 s22
s23 s32
PRBH2.1
PRBH2.2
PRBH2.3
PRBH2.4
s14
s11
s12
s21
s22
s13
s23
s31
s32
s41
s42
s51
s52
s53
s54
s11
s12
s21
s22
s31
s32
s41
s42
s51
s52
SPO10.1
s11 s21 s31 s41 s51
s12 s52 s42
s32s22
PRBH5.1
PRBH3.1
PRBH2.1
Examples

Partition of orthologous proteins• Orthologous partitions including members of identical paralogous families were joined to form a SuperPartition of Orthologs (SPO) denoted SPOr.s, where r is the number of elements it includes and s is an arbitrary order.
Prot_ID P_O #P_O P_fam #P_f SPO #SPO #SpecERGO_IPF12396 P5.2581 5 P2.38.C2.383 2 SPO10.135 10 5KLLA_IPF159 P5.2581 5 P2.194.C2.377 2 SPO10.135 10 5KLTH_IPF242 P5.2581 5 P2.250.C2.463 2 SPO10.135 10 5KLWA_IPF2329 P5.2581 5 P2.197.C2.505 2 SPO10.135 10 5ZYRO_IPF1005 P5.2581 5 P2.280.C2.447 2 SPO10.135 10 5ERGO_IPF11381 P5.456 5 P2.38.C2.383 2 SPO10.135 10 5KLLA_IPF5957 P5.456 5 P2.194.C2.377 2 SPO10.135 10 5KLTH_IPF11118 P5.456 5 P2.250.C2.463 2 SPO10.135 10 5KLWA_IPF10128 P5.456 5 P2.197.C2.505 2 SPO10.135 10 5ZYRO_IPF6094 P5.456 5 P2.280.C2.447 2 SPO10.135 10 5
-Avoid artificial disjoint partitions of orthologs;
(merge broken links between partitions of orthologs)
-Include all potential orthologs in the same set.

SPO: Conservation Profile
Type:1:1
SPO13.95 CHMU-CHTH-CHTR-CHTL-CHTB-CHAB-CHFE-CHCA-CHPN-CHPC-CHPT-CHPJ-PAUWSPO13.95 1 1 1 1 1 1 1 1 1 1 1 1 1
SPO13.95 Conservation profile in Chlamydiae:AMP nucleosidase
Gene_Id P_Orth P_Par SPO # spe SPO Conservation Profile Annotation
CHAB_CAB840 P13.21 singleton SPO13.95 13 13 CHMU-CHTH-CHTR-CHTL-CHTB-CHAB-CHFE-CHCA-CHPN-CHPC-CHPT-CHPJ-PAUW AMP nucleosidase CHCA_CCA00874 P13.21 singleton SPO13.95 13 13 CHMU-CHTH-CHTR-CHTL-CHTB-CHAB-CHFE-CHCA-CHPN-CHPC-CHPT-CHPJ-PAUW AMP nucleosidase CHFE_CF0142 P13.21 singleton SPO13.95 13 13 CHMU-CHTH-CHTR-CHTL-CHTB-CHAB-CHFE-CHCA-CHPN-CHPC-CHPT-CHPJ-PAUW amn AMP nucleosidase CHMU_TC0132 P13.21 singleton SPO13.95 13 13 CHMU-CHTH-CHTR-CHTL-CHTB-CHAB-CHFE-CHCA-CHPN-CHPC-CHPT-CHPJ-PAUW AMP nucleosidase CHPC_CPn0894 P13.21 singleton SPO13.95 13 13 CHMU-CHTH-CHTR-CHTL-CHTB-CHAB-CHFE-CHCA-CHPN-CHPC-CHPT-CHPJ-PAUW amn AMP nucleosidase CHPJ_CPj0894 P13.21 singleton SPO13.95 13 13 CHMU-CHTH-CHTR-CHTL-CHTB-CHAB-CHFE-CHCA-CHPN-CHPC-CHPT-CHPJ-PAUW amn AMP nucleosidase CHPN_CP0972 P13.21 singleton SPO13.95 13 13 CHMU-CHTH-CHTR-CHTL-CHTB-CHAB-CHFE-CHCA-CHPN-CHPC-CHPT-CHPJ-PAUW AMP nucleosidase CHPT_CpB0925 P13.21 singleton SPO13.95 13 13 CHMU-CHTH-CHTR-CHTL-CHTB-CHAB-CHFE-CHCA-CHPN-CHPC-CHPT-CHPJ-PAUW AMP nucleosidase CHTB_CTL0120 P13.21 singleton SPO13.95 13 13 CHMU-CHTH-CHTR-CHTL-CHTB-CHAB-CHFE-CHCA-CHPN-CHPC-CHPT-CHPJ-PAUW amn AMP nucleosidase CHTH_CTA0820 P13.21 singleton SPO13.95 13 13 CHMU-CHTH-CHTR-CHTL-CHTB-CHAB-CHFE-CHCA-CHPN-CHPC-CHPT-CHPJ-PAUW amn AMP nucleosidase CHTL_CTLGV0120 P13.21 singleton SPO13.95 13 13 CHMU-CHTH-CHTR-CHTL-CHTB-CHAB-CHFE-CHCA-CHPN-CHPC-CHPT-CHPJ-PAUW amn AMP nucleosidase CHTR_CT751 P13.21 singleton SPO13.95 13 13 CHMU-CHTH-CHTR-CHTL-CHTB-CHAB-CHFE-CHCA-CHPN-CHPC-CHPT-CHPJ-PAUW amn AMP nucleosidase PAUW_pc1527 P13.21 singleton SPO13.95 13 13 CHMU-CHTH-CHTR-CHTL-CHTB-CHAB-CHFE-CHCA-CHPN-CHPC-CHPT-CHPJ-PAUW amn AMP nucleosidase
Presented in species phylogenetic order

SPO: Conservation Profile
Type:n:m
SPO17.2: dnaB replicative DNA helicase
Gene_Id P_Orth P_Par SPO # spe SPO Conservation Profile Anotation CHAB_CAB123 P13.297 singleton SPO17.2 17 13 CHMU-CHTH-CHTR-CHTL-CHTB-CHAB-CHFE-CHCA-CHPN-CHPC-CHPT-CHPJ-PAUW dnaB replicative DNA helicase CHCA_CCA00124 P13.297 P2.59.C2.1 SPO17.2 17 13 CHMU-CHTH-CHTR-CHTL-CHTB-CHAB-CHFE-CHCA-CHPN-CHPC-CHPT-CHPJ-PAUW dnaB replicative DNA helicase CHFE_CF0882 P13.297 P2.70.C2.5 SPO17.2 17 13 CHMU-CHTH-CHTR-CHTL-CHTB-CHAB-CHFE-CHCA-CHPN-CHPC-CHPT-CHPJ-PAUW dnaB replicative DNA helicase CHMU_TC0784 P13.297 P2.40.C2.6 SPO17.2 17 13 CHMU-CHTH-CHTR-CHTL-CHTB-CHAB-CHFE-CHCA-CHPN-CHPC-CHPT-CHPJ-PAUW dnaB replicative DNA helicase CHPC_CPn0616 P13.297 singleton SPO17.2 17 13 CHMU-CHTH-CHTR-CHTL-CHTB-CHAB-CHFE-CHCA-CHPN-CHPC-CHPT-CHPJ-PAUW dnaB replicative DNA helicase CHPJ_CPj0616 P13.297 singleton SPO17.2 17 13 CHMU-CHTH-CHTR-CHTL-CHTB-CHAB-CHFE-CHCA-CHPN-CHPC-CHPT-CHPJ-PAUW dnaB replicative DNA helicase CHPN_CP0131 P13.297 singleton SPO17.2 17 13 CHMU-CHTH-CHTR-CHTL-CHTB-CHAB-CHFE-CHCA-CHPN-CHPC-CHPT-CHPJ-PAUW replicative DNA helicase CHPT_CpB0641 P13.297 singleton SPO17.2 17 13 CHMU-CHTH-CHTR-CHTL-CHTB-CHAB-CHFE-CHCA-CHPN-CHPC-CHPT-CHPJ-PAUW dnaB replicative DNA helicase CHTB_CTL0759 P13.297 singleton SPO17.2 17 13 CHMU-CHTH-CHTR-CHTL-CHTB-CHAB-CHFE-CHCA-CHPN-CHPC-CHPT-CHPJ-PAUW dnaB replicative DNA helicase CHTH_CTA0545 P13.297 P2.43.C2.4 SPO17.2 17 13 CHMU-CHTH-CHTR-CHTL-CHTB-CHAB-CHFE-CHCA-CHPN-CHPC-CHPT-CHPJ-PAUW dnaB_1 replicative DNA helicase CHTL_CTLGV0754 P13.297 singleton SPO17.2 17 13 CHMU-CHTH-CHTR-CHTL-CHTB-CHAB-CHFE-CHCA-CHPN-CHPC-CHPT-CHPJ-PAUW dnaB replicative DNA helicase CHTR_CT497 P13.297 singleton SPO17.2 17 13 CHMU-CHTH-CHTR-CHTL-CHTB-CHAB-CHFE-CHCA-CHPN-CHPC-CHPT-CHPJ-PAUW dnaB replicative DNA helicase PAUW_pc1810 P13.297 singleton SPO17.2 17 13 CHMU-CHTH-CHTR-CHTL-CHTB-CHAB-CHFE-CHCA-CHPN-CHPC-CHPT-CHPJ-PAUW dnaB replicative DNA helicase CHCA_CCAA00004 P4.95 P2.59.C2.1 SPO17.2 17 13 CHMU-CHTH-CHTR-CHTL-CHTB-CHAB-CHFE-CHCA-CHPN-CHPC-CHPT-CHPJ-PAUW virulence plasmid replicative DNA helicase pGP1-D CHFE_pCF03 P4.95 P2.70.C2.5 SPO17.2 17 13 CHMU-CHTH-CHTR-CHTL-CHTB-CHAB-CHFE-CHCA-CHPN-CHPC-CHPT-CHPJ-PAUW dnaB replicative DNA helicase CHMU_TCA03 P4.95 P2.40.C2.6 SPO17.2 17 13 CHMU-CHTH-CHTR-CHTL-CHTB-CHAB-CHFE-CHCA-CHPN-CHPC-CHPT-CHPJ-PAUW virulence plasmid helicase pGP1-D CHTH_pCTA0007 P4.95 P2.43.C2.4 SPO17.2 17 13 CHMU-CHTH-CHTR-CHTL-CHTB-CHAB-CHFE-CHCA-CHPN-CHPC-CHPT-CHPJ-PAUW dnaB_2 replicative DNA helicase
SPO17.2 CHMU-CHTH-CHTR-CHTL-CHTB-CHAB-CHFE-CHCA-CHPN-CHPC-CHPT-CHPJ-PAUWSPO17.2 2 2 1 1 1 1 2 2 1 1 1 1 1
SPO17.2 Conservation profile in Chlamydiae:

QuickTime™ et undécompresseur TIFF (LZW)
sont requis pour visionner cette image.
QuickTime™ et undécompresseur TIFF (LZW)
sont requis pour visionner cette image.
• All evolutionary combinations;
• 948 SPO;
• 73 distinct CP;
• 87% of type 1:1;
• 13% of type n:m;
• 55% include members of all 13 species.
Distinct SPO Conservation Profiles in 13 Chlamydiae.

Set of species PRBH SPOs Conservation Profiles
1:1 n:m Including all species
13 Chlamydiae 1202 948 73 86.8% 13.2% 55.1% 13 Mycobacteria 7560 3708 414 75.0% 25.0% 23.4% 8 Aspergillus 11887 6122 212 78.1% 21.9% 40.0%
Distribution of SPO conservation Profiles in 3 sets of species

Other mining possibilities:
Determine specific SPOs i.e those that include solely proteins that are exclusively conserved in the considered species.

Search for motifs in SPO (families) of paralogs and of orthologs, using meme/mast programs
Evolution by Motif
http://meme.sdsc.edu/meme4_1_1/intro.html
Evolution by motifs in families of orthologs
-Elementary motifs;
-Shared motifs;
-Architecture of motifs;
-Protein evolution by motifs assembling;
-Combinaisons of motifs?
-Ancestral sequence (protein) ?
-Protein evolution by motifs insertion/deletion ;
-.....

SPO10.135
126 6
11 6 6
5 7
ancestor?
Expansion
Degradation/
Expansion
3, 9, 2, 1 5, 6, 8, 4

Distribution of shared motifs in SPO26.27 (Mycobacteria).
QuickTime™ et undécompresseur TIFF (LZW)
sont requis pour visionner cette image.
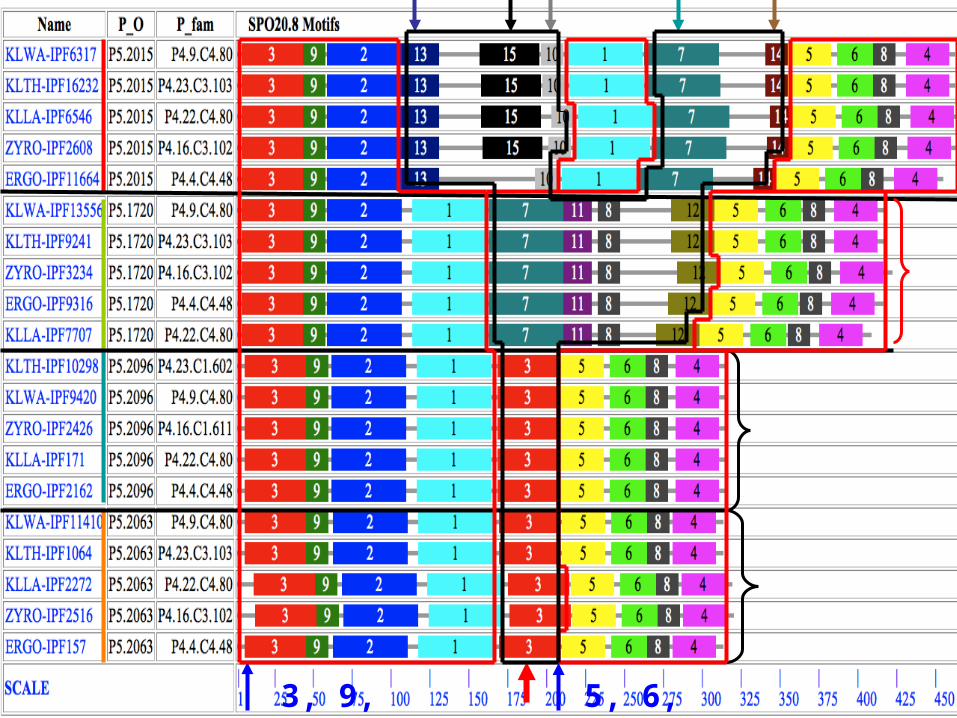
Exp: SPO17.2 dnaB replicative DNA helicase (chlamydiae)
Distribution of motifs in SPOs

Evolutionary rate evaluation among orthologs and in-paralogs in SPOs
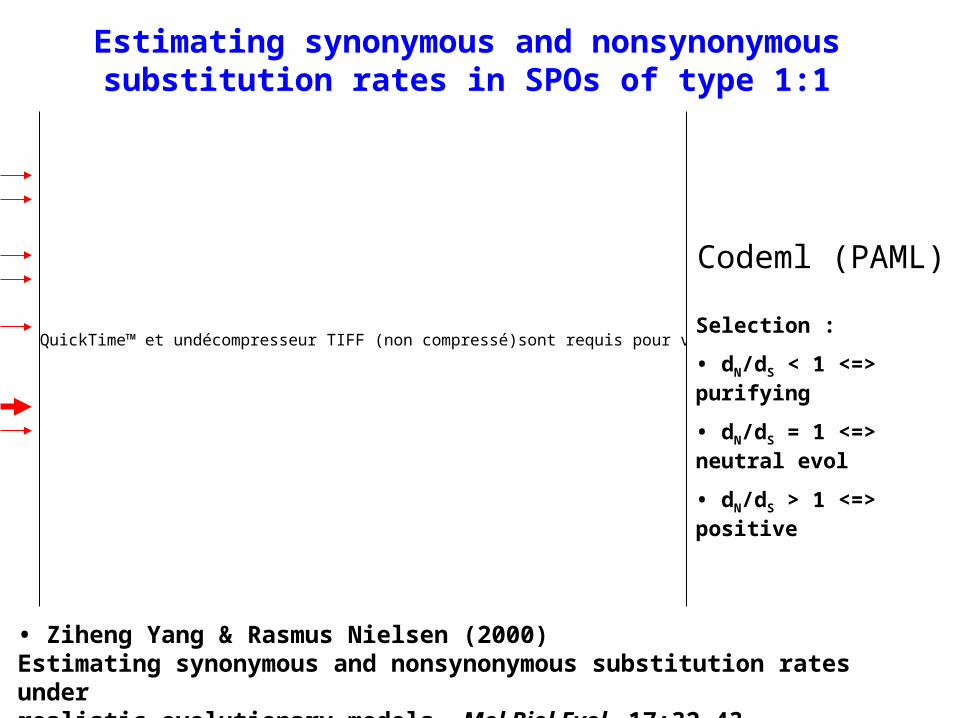
• Codeml (PAML) was applied to each SPO.
• PAML: Phylogenetic Analysis by Maximum Likelihood (PAML) http://abacus.gene.ucl.ac.uk/software/paml.html (Recent doc : July 2007)
• Ziheng Yang & Rasmus Nielsen (2000)Estimating synonymous and nonsynonymous substitution rates under realistic evolutionary models. Mol Biol Evol. 17:32-43.
• Yang Z (2007). PAML 4: phylogenetic analysis by maximum likelihood. Mol Biol Evol. 24:1586-91.
• Ziheng Yang & Rasmus Nielsen (2000)Estimating synonymous and nonsynonymous substitution rates under realistic evolutionary models. Mol Biol Evol. 17:32-43.
Estimating synonymous and nonsynonymous substitution rates in SPOs of type 1:1
QuickTime™ et undécompresseur TIFF (non compressé)sont requis pour visionner cette image.Selection :
• dN/dS < 1 <=> purifying
• dN/dS = 1 <=> neutral evol
• dN/dS > 1 <=> positive
Codeml (PAML)

1. Alignment of an SPO protein sequences using clustalW (default opt)
2. Alignment of corresponding DNA sequences using as template their corresponding amino acid alignment obtained in step 1
3. Convert the DNA alignment in codeml format
4. Perform codeml program on the obtained DNA alignment.
Estimates: dN, dS, dN/dS,….
5. Clean the codeml output to get estimates in a table form
6. Statistical analyses:
Exp: From Codeml estimates extract gene pairs with w = dN/dS >= 2
Procedure
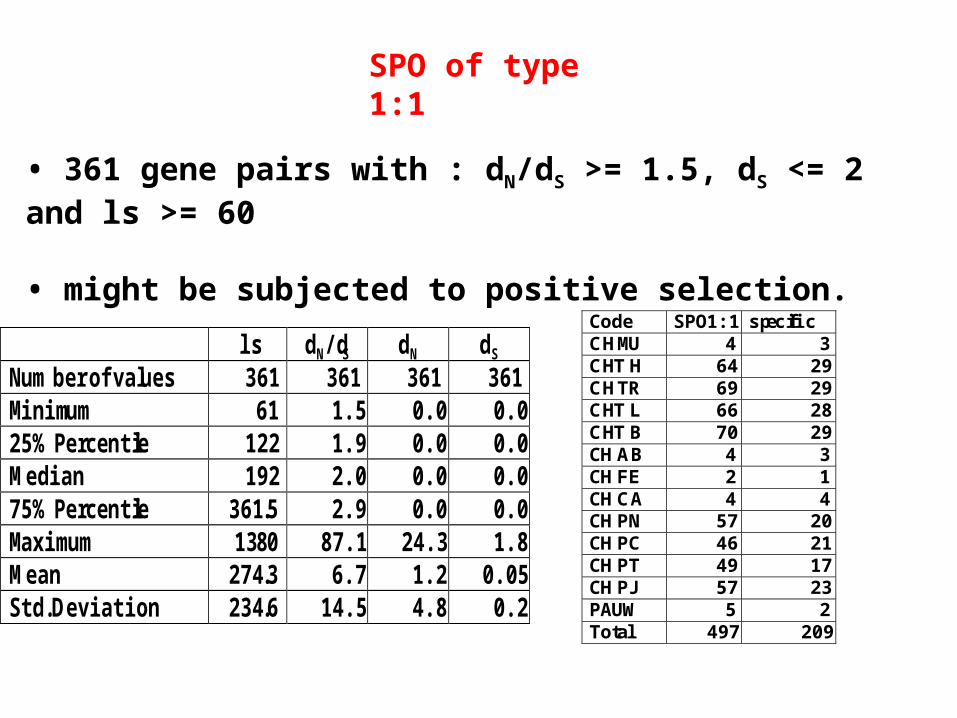
SPO of type 1:1
ls dN/dS dN dS Number of values 361 361 361 361 Minimum 61 1.5 0.0 0.0 25% Percentile 122 1.9 0.0 0.0 Median 192 2.0 0.0 0.0 75% Percentile 361.5 2.9 0.0 0.0 Maximum 1380 87.1 24.3 1.8 Mean 274.3 6.7 1.2 0.05 Std. Deviation 234.6 14.5 4.8 0.2
• 361 gene pairs with : dN/dS >= 1.5, dS <= 2 and ls >= 60
• might be subjected to positive selection.
Code SPO1:1 specific CH MU 4 3 CHT H 64 29 CH TR 69 29 CHT L 66 28 CHT B 70 29 CH AB 4 3 CH FE 2 1 CH CA 4 4 CH PN 57 20 CH PC 46 21 CH PT 49 17 CH PJ 57 23 PAUW 5 2 Total 497 209

Gene P_orth Paralog SPO #sp Comment CH PC_CPn0020 P13.274 singleton SPO13.146 13 putative outer membrane protein CH PT_CpB0024 P13.274 singleton SPO13.146 13 putative outer membrane protein CHT B_CT L0335 P13.557 singleton SPO13.372 13 putative integral membrane protein CHT L_CTL GV 0330 P13.557 singleton SPO13.372 13 putative integral membrane protein CHT H_CTA0498 P12.93 singleton SPO12.120 12 tarp protein CHT B_CT L0716 P12.93 singleton SPO12.120 12 tarp translocated actin-recruiting phosphoprotein CHT L_CTL GV 0712 P12.93 singleton SPO12.120 12 tarp translocated actin-recruiting protein CHTR_CT444 P12.94 singleton SPO12.121 12 omcA 9kDa-Cysteine-Rich Lipoprotein CHT H_CTA0484 P12.94 singleton SPO12.121 12 omcA cysteine-rich outer m embrane protein 3 precursor CHT H_CTA0427 P12.102 singleton SPO12.128 12 yprS hypothetical protein CHTR_CT232 P12.124 singleton SPO12.16 12 incB Inclusion M em brane Protein B CH PJ_CPj0291 P12.124 singleton SPO12.16 12 incB inclusion m em brane protein B CHT L_CTL GV 0480 P12.124 singleton SPO12.16 12 incB inclusion m em brane protein B CH PT_CpB0300 P12.124 singleton SPO12.16 12 inclusion m embrane protein B CHT H_CTA0213 P12.132 singleton SPO12.23 12 hypothetical m embrane spanning protein CHT H_CTA0156 P12.138 singleton SPO12.29 12 hypothetical m embrane spanning protein CHT B_CT L0402 P12.138 singleton SPO12.29 12 putative integral membrane protein CHT L_CTL GV 0398 P12.138 singleton SPO12.29 12 putative integral membrane protein CHTR_CT080 P12.150 singleton SPO12.39 12 ltuB hypothetical protein CHT B_CT L0336 P12.150 singleton SPO12.39 12 ltuB late transcription unit B protein CHT H_CTA0085 P12.150 singleton SPO12.39 12 ltuB late transcription unit B protein CHT L_CTL GV 0331 P12.150 singleton SPO12.39 12 ltuB late transcription unit B protein CH PN_CP0371 P12.153 singleton SPO12.40 12 Hc2 nucleoprotein CH PJ_CPj0384 P12.153 singleton SPO12.40 12 hctB histone-like protein 2 CH PT_CpB0396 P12.153 singleton SPO12.40 12 putative histone-like protein 2 CHT H_CTA0318 P12.114 singleton SPO12.5 12 dcrA divalent cation-dependent regulator A CH PT_CpB0069 P12.164 singleton SPO12.52 12 F25H5.5 CHT H_CTA0392 P12.164 singleton SPO12.52 12 hypothetical cytosolic protein CHT H_CTA0491 P12.167 singleton SPO12.54 12 hypothetical m embrane associated protein CHT H_CTA0822 P12.35 singleton SPO12.68 12 hypothetical cytosolic protein CHT H_CTA0778 P12.45 singleton SPO12.77 12 hypothetical cytosolic protein CHTR_CT442 P11.14 singleton SPO11.10 11 crpA 15kDa Cysteine-Rich Protein CHT B_CT L0701 P11.14 singleton SPO11.10 11 crpA cysteine-rich membrane protein
CHTH_CTA0482 P11.14 singleton SPO11.10 11 crpA sulfur-rich protein CHTH_CTA0141 P8.18 singleton SPO8.10 8 hypothetical membrane associated protein CHAB_CAB264 P7.30 singleton SPO7.16 7 hypothetical serine rich protein CHTB_CTL0373 P5.23 singleton SPO5.11 5 incG inclusion membrane protein G CHTH_CTA0125 P5.23 singleton SPO5.11 5 incG inclusion membrane protein G CHTL_CTLGV0369 P5.23 singleton SPO5.11 5 incG inclusion membrane protein G CHTR_CT116 P5.25 singleton SPO5.13 5 hypothetical protein CHTB_CTL0371 P5.25 singleton SPO5.13 5 incE inclusion membrane protein E CHTH_CTA0123 P5.25 singleton SPO5.13 5 incE inclusion membrane protein E CHTL_CTLGV0367 P5.25 singleton SPO5.13 5 incE inclusion membrane protein E CHTB_CTL0370 P5.26 singleton SPO5.14 5 incD inclusion membrane protein D CHTL_CTLGV0366 P5.26 singleton SPO5.14 5 incD inclusion membrane protein D CHTH_CTA0250 P5.16 singleton SPO5.5 5 hypothetical membrane associated protein
Examples of annotated genes that might be subjected to positive selection
Species evolution

Ancestor
species genome
Evolutionary processes include
Phylogeny*duplication genesis
Expansion*
HGT HGT
Exchange* loss Deletion*selection*
Expansion, Exchange and Deletion are noise. They should be eliminated or at least reduced.
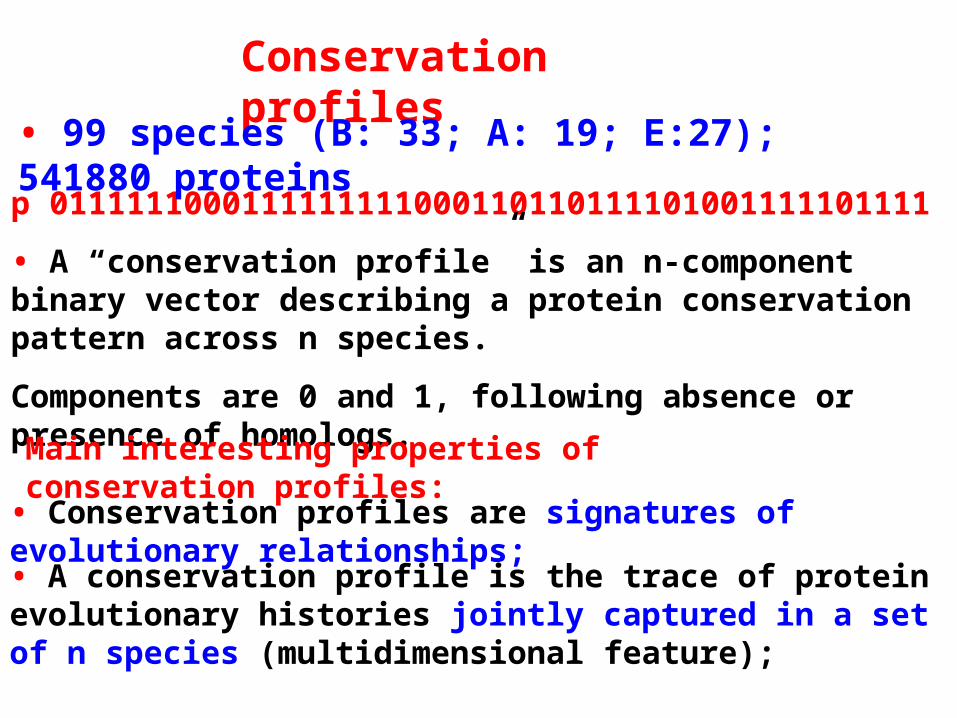
p 0111111000111111111000110110111101001111101111
• A “conservation profile” is an n-component binary vector describing a protein conservation pattern across n species.
Components are 0 and 1, following absence or presence of homologs.
• A conservation profile is the trace of protein evolutionary histories jointly captured in a set of n species (multidimensional feature);
• Conservation profiles are signatures of evolutionary relationships;
Conservation profiles
• 99 species (B: 33; A: 19; E:27); 541880 proteins
Main interesting properties of conservation profiles:

Conservation profiles are useful for annotating new genomes; for genome tree construction,...

E A B S1..............I.............I................Sn
G1,1 100000000000000000000000000000000000000000000000 G2,1 111111111111111111111111111111111111111111111111 G3,1 111111110011111111111111011101110101111111101111 ....................................................... Gn1,1
100001110001000000000000000000000000000000000000
G1,2 010000000000000000010100000000000111000011100011 G2,2 010000000000000000010100000000000111000011100011........................................................ Gn2,2 111111110011111111111111011101110101111111101111........................................................ G1,n 011110100000000000000000001000000000000000000001 G2,n 111111110011111111100011011101110101111111101111 G3,n 111111110011111111100011011101110101111111101111........................................................ Gnp,n 100110000000000000000000000000000000000000000001
Protein conservation profiles
Table : 541880 proteins x 99 species• Different conservation profiles represent different evolutionary histories
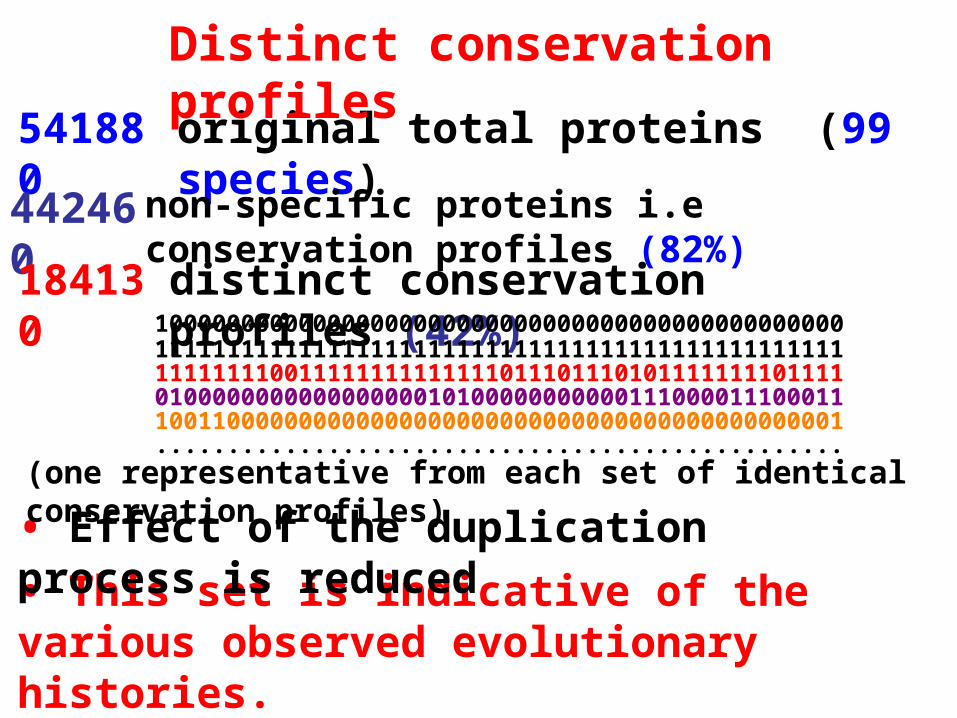
original total proteins (99 species)
non-specific proteins i.e conservation profiles (82%)
distinct conservation profiles (42%)
Distinct conservation profiles
541880
442460
184130
111111110011111111111111011101110101111111101111
100110000000000000000000000000000000000000000001
100000000000000000000000000000000000000000000000111111111111111111111111111111111111111111111111
010000000000000000010100000000000111000011100011
................................................
• This set is indicative of the various observed evolutionary histories.
• Effect of the duplication process is reduced(one representative from each set of identical conservation profiles)

Genome tree construction: data matrices
• Jaccard similarity scores between species
sij = N11/(N11+N01+N10);
N11; N01; N10 are respectively total occurrences of (1,1), (0,1) and (1,0) between i,j.
• 184130 d.c.prof
T = { Tij = sij ; i=1,n; j=1,n; n }
111111110011111111111111011101110101111111101111
100110000000000000000000000000000000000000000001
100000000000000000000000000000000000000000000000111111111111111111111111111111111111111111111111
010000000000000000010100000000000111000011100011
................................................
i jvarious evolutionary histories
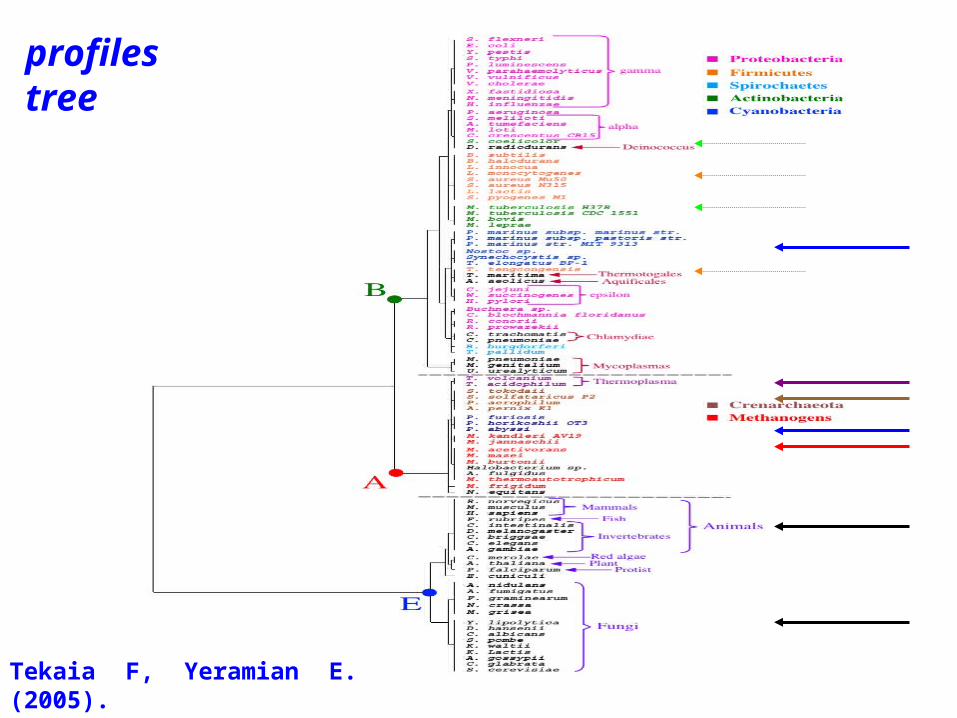
Tekaia F, Yeramian E. (2005). PLoS Comput Biol.1(7):e75
profiles tree

Conclusion
Large-scale analyses of Completely sequenced genomes allow a new systematic vision of genes and genome organization and their macro as well their micro evolutions.

References:• Tekaia, F. and Dujon, B. (1999).
Pervasiveness of gene conservation and persistence of duplicates in cellular genomes. Journal of Molecular Evolution, 49:591-600.
• Tekaia, F., Lazcano, A. and B. Dujon (1999). Genome tree as revealed from whole proteome comparisons. Genome Res. 12:17-25.
• Tekaia, F., Yeramian, E. and Dujon, B. (2002).Amino acid composition of genomes, lifestyles of organisms, and evolutionary trends: a global picture with correspondence analysis. Gene 297: 51-60.
• Tekaia, F. and Yeramian, E. (2005).Genome Trees from Conservation Profiles. PLoS Comput Biol.1(7):e75.
• Tekaia, F. and Yeramian, E. (2006).Evolution of Proteomes: Fundamental signatures and global trends in amino acid composition. (submitted).

-F. Tekaia, G. Blandin, A. Malpertuy, et al. (2000):-Methods and strategies used for sequence analysis and annotation.-FEBS 487,1:17-30.- A. Malpertuy, F. Tekaia, S. Casaregola, et al. (2000): «Yeast specific» genes. FEBS 487,1:113-121.-G. Blandin, P. Durrens, F. Tekaia, et al. (2000).-The genome of Saccharomyces cerevisiae revisited. FEBS 487,1:31-36.
-Tekaia F, Latge JP Aspergillus fumigatus: saprophyte or pathogen? (2005)
Curr Opin in Microb 8 (4): 385-392.
-Dujon et al. (2004) Genome Evolution in Yeasts Nature. 430: p. 35-44.
- Nierman et al. (2005) Genomic sequence of the pathogenic and allergenic filamentous fungus Aspergillus fumigatus.Nature. 438:1151-6.