large-scale solar association
TRANSCRIPT


January 15, 2009 Ms. Shannon Eddy Large-scale Solar Association 2501 Portola Way Sacramento, CA 95818
RE: Large-scale Solar Industry Economic and Fiscal Impact Analysis Dear Ms. Eddy: In accordance with your request, Applied Analysis (“AA”) is pleased to submit this Large-scale Solar Industry Economic and Fiscal Impact Analysis. AA was retained by Large-scale Solar Association (the “Association”) to evaluate the industry’s fiscal and economic impacts on the state of Nevada focusing on the relative benefits of economic incentives provided in Nevada, California, and Arizona. This summary report outlines the salient findings and conclusions of our review and analysis. This executive summary report was designed by AA in response to your request. That said, we make no representations as to the adequacy of these procedures for all purposes. The information provided in this summary, and the conclusions reached herein, are based on the findings of our research and our knowledge of the market and tax environment as of the date of this report. We have no responsibility to update this report for events and circumstances that may occur after this date. Our report contains economic data, taxation rules and regulations, and solar industry-specific estimates and data. This information was collected from the Association and third parties and is presented in this summary report. The data were assembled by AA. The information collected was not subjected to any auditing or review procedures by AA. While we have no reason to doubt the accuracy of the information utilized, we can make no representations or assurances as to its completeness. This executive summary is intended to provide an overview of the analyses conducted and a summary of our salient findings. AA will retain additional working papers relevant to this study. If you reproduce this report, it must be done so in its entirety. Please see a more complete listing of assumptions and limiting conditions throughout this report. Thank you again for the opportunity to assist you with this important project. We welcome the opportunity to discuss this report with you at any time. Should you have any questions, please contact Jeremy Aguero or Brian Gordon at (702) 967-3333. Sincerely, Applied Analysis Attachment

TABLE OF CONTENTS
Findings in Summary .............................................................................................................................. 1!
Solar Industry Overview ......................................................................................................................... 5!
The Economic Benefits of Utility-Scale Solar Projects ......................................................................... 8!Overview ................................................................................................................................................. 8!Employment, Wages and Salaries...................................................................................................... 9!Economic Output ................................................................................................................................ 11!
Comparative Analysis of Tax Burdens: Nevada, California and Arizona ....................................... 12!Overview ............................................................................................................................................... 12!Sales and Use Tax ................................................................................................................................ 14!Property Tax .......................................................................................................................................... 17!Business Taxes ....................................................................................................................................... 19!
Research and Data Collection Process ............................................................................................. 24!
Assumptions .......................................................................................................................................... 25!
Appendix I ............................................................................................................................................ 26!

1
FINDINGS IN SUMMARY
pplied Analysis (“AA”) was retained by the Large-scale Solar Association to review and analyze economic and fiscal impacts associated with the development and operation of utility-scale solar energy facilities. Specifically, this analysis provides an
overview of economic benefits and a comparative analysis of renewable-energy development incentives in three southwestern states: Arizona, California and Nevada. This analysis focuses on utility-scale solar energy facilities, including both solar photovoltaic and solar thermal technologies. Having evolved significantly during the past two decades, solar technologies are a key piece of the nation’s energy puzzle. Renewable alternatives provide abundant, clean and reliable power, significantly reducing the environmental and geopolitical threats posed by the ever-increasing consumption of limited fossil fuels. Beyond these benefits, utility-scale solar power facilities also provide significant economic development benefits for the communities in which they exist. Solar power plants require investments ranging from $250 million to more than $1 billion, creating jobs, generating wage and salary payments and stimulating economic output. One recent report determined that a 100-megawatt solar thermal project would employ about 800 construction workers during its construction and between 30 and 45 workers upon completion.1 Permanent solar energy facility jobs also tend to be relatively high paying, with a scale ranging from $45,000 to $75,000 per year, well above the statewide average wage at both ends.2 Estimates of economic output (or gross state output) throughout construction and the typical 30-year life of a 100-megawatt plant range from $500 million to $800 million, with the potential for related-industry cluster development and indirect impacts rippling through the balance of the state and local economy.3 Considering that Nevada is looking to generate more than 6 million megawatt hours of power (which would require more than 2 gigawatts of capacity) from renewable resources by 2015, theoretically acquiring twenty 100-megawatt facilities, including solar, the industry’s impacts on the local economy would be significant.4 A 2007 statewide study indicates that Nevada spends as much as $3 billion annually on imported energy. While much of that expense is going towards the cost of transportation fuels, in 2005, the state imported approximately $353 million worth of purchased electricity, or 60 percent of the state’s total electricity demand.5 These exported dollars support energy-based jobs and economic activity in other states. More recent information from state energy providers suggests that over the past few years the amount of electricity importation has significantly decreased due to additional in-state production being brought on-line, with the state importing 30 to 40 percent of electricity consumed. This figure is expected to continue its
1 See, R.K. Schwer and M. Riddel, The Potential Economic Impact of Constructing and Operating Solar Power Generation Facilities in Nevada, Center for Business and Economic Research, University of Nevada Las Vegas, Las Vegas, February 2004. 2 See, Schwer and Riddel. Salary estimates also confirmed through conversations with Large-scale Solar Association member companies. According to the Bureau of Labor Statistics, U.S. Department of Labor, the current average annual salary in Nevada is approximately $40,000. 3 See, Clean and Diversified Energy Initiative, Western Governors’ Association Solar Task Force Report, January 2006. 4 Based on statistics provided by NV energy, which serves most of Nevada (see http://www.nvenergy.com/company/doingbusiness/rfps/images/2008_RFP_FAQ.pdf), regarding estimated 2008 power requirements, in order to meet state-mandated renewable energy portfolio standards by 2015, more than 2 gigawatts of renewable energy capacity will be required in Nevada. 5 See, Gecol, Dr. Hatice, Ph.D., Director, Nevada State Office of Energy, Status of Energy in Nevada, Report to Governor Gibbons and Legislature, May 21, 2007.
A
2
downward trend,6 bringing once exported energy-based jobs, investments, and business activity back into Nevada. The southwestern United States clearly has the advantage when it comes to solar technology. Arizona, California and Nevada, in particular, have more days of sunlight, abundant land and a growing need for power resources. Large-scale solar operations are subject to federal, state and local taxes just like any other business. The federal government and many states have increased required renewable energy portfolio standards as well as provided tax incentives for renewable energy development in anticipation of stimulating increased investment. This strategy appears to have been effective, with substantial increased investment in renewable energy alternatives reported nationwide.7 Although utility-scale solar facilities and their employees pay all of the taxes imposed on businesses and individuals generally, their operations are particularly sensitive to: 1) sales and use taxes; 2) ad valorem (property) taxes; and 3) business taxes. Absent abatements or exemptions, sales and use taxes are applied to all of the materials used to construct a solar power plant, which make up roughly 80 percent of those facilities’ construction cost. Similarly, property taxes are generally applied to the land, improvements and personal property of a utility-scale solar facility, which are very significant as a function of revenue. Although most, if not all, solar facilities do not generate a profit for the first several years of operations due to losses associated with large depreciation expenses, they ultimately generate state and local income tax payments. They are also subject to other business levies, such as Nevada’s Modified Business Tax on payroll. Assuming that the development of a utility-scale solar operation would be similar in Arizona, California and Nevada, AA developed a pro forma model to analyze the impacts of major taxes imposed by each state as well as its respective incentives over a 15-year study period. The model was developed with construction, operation, and facility information provided by various solar power companies utilizing a wide range of technologies as well as input from taxation and economic development officials in each of the comparison states. Germane to this analysis is that Nevada’s existing renewable energy facility sales and property tax abatements are scheduled to expire on June 30, 2009.8 Whether the state will simply allow these incentives to expire, renew the legislation to continue as it currently exists or even enhance what is available is unclear at this time.9 As such, this analysis considers three Nevada scenarios: 1) Nevada eliminates its renewable energy abatements; 2) Nevada maintains the status quo with regard to its renewable energy facility tax abatements; and 3) Nevada enhances its renewable energy property and sales and use tax abatements. The table that follows summarizes the estimated tax payments for a hypothetical solar power facility in each jurisdiction and under each possible scenario for Nevada as well as for California, which offers specific incentives to companies locating in an enterprise zone. 10
6 See, NV Energy form 10-K for the year ended December 31, 2008. 7 See, Sherwood, Larry, U.S. Solar Market Trends 2007, Interstate Renewable Energy Council, August 2008. 8 See, NRS 701A.220 and 701A.230. 9 Proposed draft legislation extends and expands the property tax abatement to 25 years and 75 percent, and the sales and use tax abatement to 5 years, holding harmless the 2 percent state rate (as compared to a 10-year, 50-percent property tax abatement and a 2-year sales and use tax abatement holding harmless the 2 percent state rate, respectively, pursuant to NRS 701A.220 and 701A.230.) 10 A renewable energy producer locating in a California enterprise zone, which is a type of targeted development area, may qualify for a sales and use tax abatement on the first $20 million of equipment
3
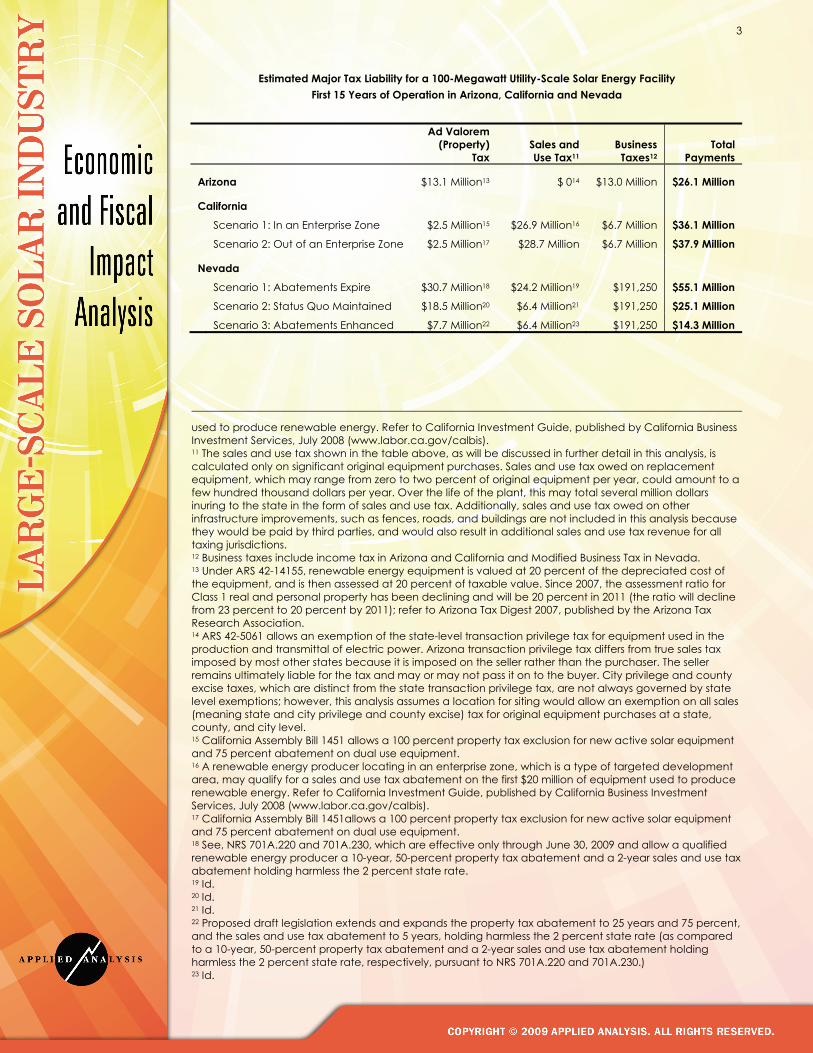
Estimated Major Tax Liability for a 100-Megawatt Utility-Scale Solar Energy Facility First 15 Years of Operation in Arizona, California and Nevada
Ad Valorem
(Property) Tax
Sales and Use Tax11
Business Taxes12
Total Payments
Arizona $13.1 Million13 $ 014 $13.0 Million $26.1 Million
California Scenario 1: In an Enterprise Zone $2.5 Million15 $26.9 Million16 $6.7 Million $36.1 Million
Scenario 2: Out of an Enterprise Zone $2.5 Million17 $28.7 Million $6.7 Million $37.9 Million
Nevada
Scenario 1: Abatements Expire $30.7 Million18 $24.2 Million19 $191,250 $55.1 Million Scenario 2: Status Quo Maintained $18.5 Million20 $6.4 Million21 $191,250 $25.1 Million
Scenario 3: Abatements Enhanced $7.7 Million22 $6.4 Million23 $191,250 $14.3 Million
used to produce renewable energy. Refer to California Investment Guide, published by California Business Investment Services, July 2008 (www.labor.ca.gov/calbis). 11 The sales and use tax shown in the table above, as will be discussed in further detail in this analysis, is calculated only on significant original equipment purchases. Sales and use tax owed on replacement equipment, which may range from zero to two percent of original equipment per year, could amount to a few hundred thousand dollars per year. Over the life of the plant, this may total several million dollars inuring to the state in the form of sales and use tax. Additionally, sales and use tax owed on other infrastructure improvements, such as fences, roads, and buildings are not included in this analysis because they would be paid by third parties, and would also result in additional sales and use tax revenue for all taxing jurisdictions. 12 Business taxes include income tax in Arizona and California and Modified Business Tax in Nevada. 13 Under ARS 42-14155, renewable energy equipment is valued at 20 percent of the depreciated cost of the equipment, and is then assessed at 20 percent of taxable value. Since 2007, the assessment ratio for Class 1 real and personal property has been declining and will be 20 percent in 2011 (the ratio will decline from 23 percent to 20 percent by 2011); refer to Arizona Tax Digest 2007, published by the Arizona Tax Research Association. 14 ARS 42-5061 allows an exemption of the state-level transaction privilege tax for equipment used in the production and transmittal of electric power. Arizona transaction privilege tax differs from true sales tax imposed by most other states because it is imposed on the seller rather than the purchaser. The seller remains ultimately liable for the tax and may or may not pass it on to the buyer. City privilege and county excise taxes, which are distinct from the state transaction privilege tax, are not always governed by state level exemptions; however, this analysis assumes a location for siting would allow an exemption on all sales (meaning state and city privilege and county excise) tax for original equipment purchases at a state, county, and city level. 15 California Assembly Bill 1451 allows a 100 percent property tax exclusion for new active solar equipment and 75 percent abatement on dual use equipment. 16 A renewable energy producer locating in an enterprise zone, which is a type of targeted development area, may qualify for a sales and use tax abatement on the first $20 million of equipment used to produce renewable energy. Refer to California Investment Guide, published by California Business Investment Services, July 2008 (www.labor.ca.gov/calbis). 17 California Assembly Bill 1451allows a 100 percent property tax exclusion for new active solar equipment and 75 percent abatement on dual use equipment. 18 See, NRS 701A.220 and 701A.230, which are effective only through June 30, 2009 and allow a qualified renewable energy producer a 10-year, 50-percent property tax abatement and a 2-year sales and use tax abatement holding harmless the 2 percent state rate. 19 Id. 20 Id. 21 Id. 22 Proposed draft legislation extends and expands the property tax abatement to 25 years and 75 percent, and the sales and use tax abatement to 5 years, holding harmless the 2 percent state rate (as compared to a 10-year, 50-percent property tax abatement and a 2-year sales and use tax abatement holding harmless the 2 percent state rate, respectively, pursuant to NRS 701A.220 and 701A.230.) 23 Id.

4
The conclusions from this analysis are fairly clear. Holding all other variables constant, Nevada, under existing legislation, currently has the most competitive tax environment for utility-scale solar energy facilities. Arizona runs a close second under current legislation; California is a distant third. If current incentives offered in Nevada were to expire, Nevada would fall to the third position by a wide margin. By contrast, if Nevada were to enhance its incentives as currently proposed, the state would have a significant competitive advantage over both Arizona and California. The impacts of the provided alternatives are significant both in terms of tax payments and operational profitability. Although other regulatory, quality-of-life and operating cost considerations would be essential to any company’s decision-making process, the presence or absence of tax abatements can be the determining factor in site selection and investment.
5
SOLAR INDUSTRY OVERVIEW
As a result of the renewed focus on clean, renewable technologies due to rising concern about the effects of greenhouse gas emissions, as well as the relatively recent spike in oil prices, the utility-scale solar energy industry has also been the subject of increased attention. The industry has the potential to play a leading role in decreasing the United States’ dependence on fossil fuels and addressing growing environmental and geopolitical concerns that come with the nation’s dependence on non-renewable energy resources. Modern use of solar technology began after the 1973 and 1979 oil crises, which led to the development of several solar power plants in California in addition to a few other smaller projects. Partly due to low energy prices after 1990, few new commercial facilities were added during the next decade although research in the field continued. Today, the technology is generations beyond where the industry began, and the utility-scale solar industry has become a key piece of the global energy puzzle. The sun radiates an enormous amount of energy through the process of nuclear fusion, which occurs constantly. In fact, scientists estimate that the sun radiates more energy in one second than the world has used since time began; every hour, the sun bathes the earth in as much energy as it consumes in an entire year.24 Generally speaking, the two major categories of large-scale solar technologies (or the means to capture this energy) are solar photovoltaic and solar thermal. Both are considered in this analysis as are the myriad of sub-technologies contained in each major classification.
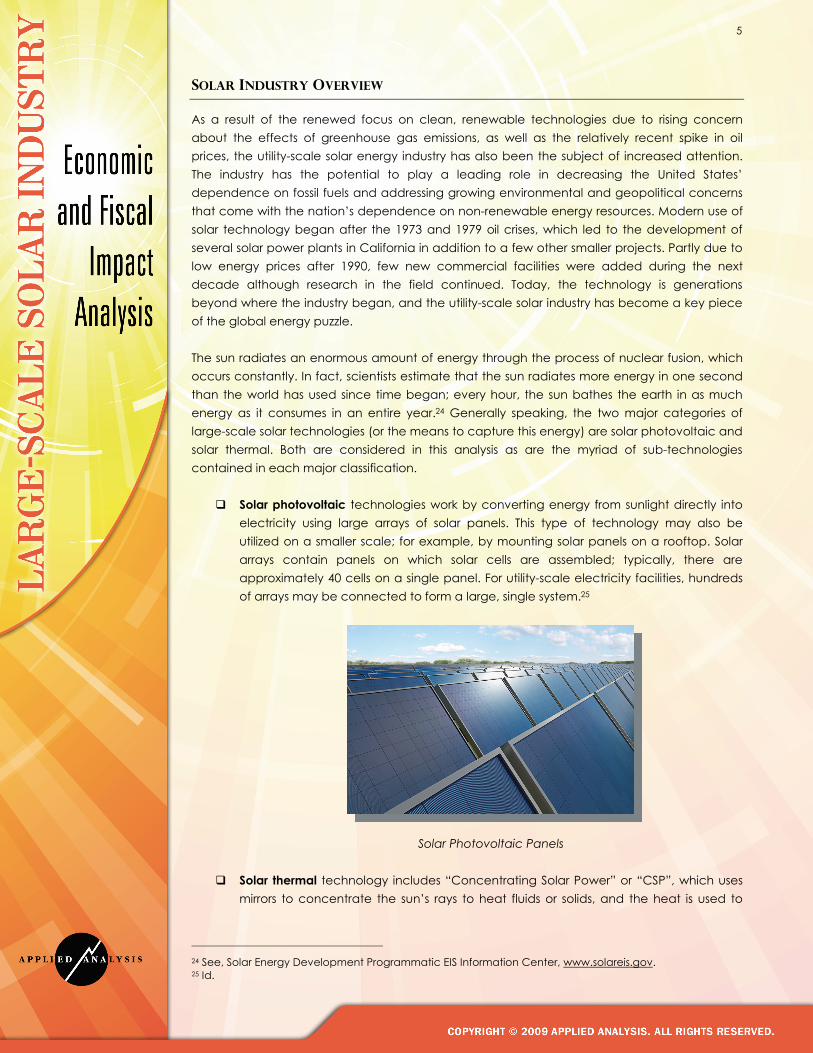
! Solar photovoltaic technologies work by converting energy from sunlight directly into electricity using large arrays of solar panels. This type of technology may also be utilized on a smaller scale; for example, by mounting solar panels on a rooftop. Solar arrays contain panels on which solar cells are assembled; typically, there are approximately 40 cells on a single panel. For utility-scale electricity facilities, hundreds of arrays may be connected to form a large, single system.25
Solar Photovoltaic Panels
! Solar thermal technology includes “Concentrating Solar Power” or “CSP”, which uses mirrors to concentrate the sun’s rays to heat fluids or solids, and the heat is used to
24 See, Solar Energy Development Programmatic EIS Information Center, www.solareis.gov. 25 Id.

6
drive steam turbines or other devices to generate power. CSP technologies include trough systems, power tower systems, linear Fresnel systems, and dish/engine systems.
o A trough system uses large, parabolic (U-shaped) mirrors that have oil-filled pipes
running along their center. The mirrored reflectors are tilted toward the sun, which heats the oil inside to as high as 750 degrees Fahrenheit.26 The hot oil is used to boil water, which creates steam that is used to run conventional steam turbines and generators.
Parabolic Trough System o A power tower system typically uses many large mirrors to track the sun and focus
its rays on the receiver (the power tower). The receiver sits on top of a tall tower in which the concentrated sunlight heats a fluid, such as molten salt, to as high as 1,050 degrees Fahrenheit.27
Power Tower System
26 Id. 27 Id.

7
o Linear Fresnel technology is unique in that its mirrors reflect sunlight onto a single
linear receiver. Water inside the receiver is heated, producing steam, which is used to turn a steam turbine. Steam is returned as water to the receiver once cooled.
Linear Fresnel System
o A dish/engine system works similarly to a power tower system except the tower (receiver) is typically integrated into a high-efficiency combustion engine. The engine has thin tubes containing hydrogen or helium gas that run along the outside of the engine. The heat from the concentrated sunlight causes the hot gas to expand inside the tubes, which causes the gas to expand inside the engine’s cylinders. The expanding gas drives the cylinders, which turn a crankshaft that ultimately drives an electric generator. In this way, the receiver, engine, and generator comprise a single, integrated assembly.
Dish/Engine System
8
THE ECONOMIC BENEFITS OF UTILITY-SCALE SOLAR PROJECTS
OVERVIEW
In addition to contributing long-term environmental benefits as well as positive economic impacts, renewable energy production is now mandated by many states. The state of Nevada, for example, has established a mandatory renewable energy portfolio standard of 20 percent by 2015 (5 percent of that amount must be solar energy). In order to be in compliance with this standard, Nevada must attract renewable energy production facilities sufficient to generate 20 percent of the electricity consumed by the state’s inhabitants. By way of comparison, California has established a requirement that its three major utility companies must produce 20 percent of their power from renewable sources by 2010. A recent executive order calls for California to obtain 33 percent of all electric power from renewable sources by 2020, though the details have yet to be worked out on how the state will implement this requirement.28 Currently, Arizona is requiring 15 percent of its power to be generated from renewable sources by 2025. As the solar industry develops, technologies will be improved and economies of scale may be realized. As a result, the cost of generating energy from solar resources may decrease, and all ratepayers will ultimately benefit. Nevada, California, and Arizona, with their abundant sunlight, are seen by proponents of solar technologies as locations that may realize economies of scale to their maximum potential. That said, the state in which a solar power plant locates stands to benefit from the economic impacts of constructing and operating such large-scale projects. The following section briefly outlines the economic benefits of a solar power project, drawing mainly on studies performed by the Center for Business and Economic Research at University of Nevada, Las Vegas (“UNLV”),29 the Western Governors’ Association Solar Task Force,30 the Bureau of Business and Economic Research at University of New Mexico,31 and recent studies performed by Navigant Consulting regarding the impacts of the solar energy industry.32 In addition, this section references a study specific to Nevada that was completed in early 2009 by The Vote Solar Initiative, a non-profit organization supported by the Tides Center.33 As of the date of this study, reliable public information regarding employment, wages and salaries for photovoltaic power plants is limited and/or currently in process. Information presented on pages 9 through 11 of this study represents only solar thermal power plants.
28 California Executive Order S-14-08, November 17, 2008 (http://www.cpuc.ca.gov/PUC/energy/Renewables/hot/33implementation.htm) 29 See, R.K. Schwer and M. Riddel, The Potential Economic Impact of Constructing and Operating Solar Power Generation Facilities in Nevada, Center for Business and Economic Research, University of Nevada Las Vegas, Las Vegas, February 2004. 30 See, Clean and Diversified Energy Initiative, Western Governors’ Association Solar Task Force Report, January 2006. 31 See, The Economic Impact of Concentrating Solar Power in New Mexico, Bureau of Business and Economic Research, University of New Mexico, New Mexico, November 2004. 32 See, Economic Impacts of Extending Federal Solar Tax Credits, Navigant Consulting, September 2008, http://www.seia.org/galleries/pdf/Navigant%20Consulting%20Report%209.15.08.pdf. 33 See, The Sun Rises on Nevada: Economic and Environmental Impacts of Developing 2,000 MW of Large-Scale Solar Power Plants, The Vote Solar Initiative, March 2009, www.votesolar.org.

9
EMPLOYMENT, WAGES AND SALARIES
Construction employment directly tied to the development of a 100-megawatt solar thermal plant is estimated at around 800 full-time person years of employment34 during the period of construction.35 This estimate is slightly high according to some sources36 and also may vary widely across specific technologies. Although there are some economies of scale and other causes for variations, these impacts can be viewed as linear as a general framework for discussion. A 2-gigawatt renewable portfolio, which would consist of multiple plants and is twenty times the size of a 100-megawatt plant, would support an estimated 16,000 to 18,000 person years of employment over a six-year construction period based on a recent study of a solar thermal project in Nevada.37 In addition, during the construction phase of a 2-gigawatt plant, approximately 17,000 person years of employment would be supported as a result of the indirect and induced impacts of the six-year construction period of the project.38 Permanent jobs created are estimated between 25 and 45 for a 100-megawatt solar facility, with this being a consensus among studies referenced in this section and confirmed through conversations with Large-scale Solar Association member companies. Most forms of solar energy production are relatively self-sufficient, with only 7 administrative positions and 35 technical employees needed to maintain efficient operation of the facility.39 Of course, these figures would increase somewhat as facility size increases. Wages and salaries in the solar energy industry are generally above-average.40 Construction jobs may last for a period of one to three years, with annual salaries averaging from $45,000 to $50,000, or higher depending on specialized skills required.41 Annual salaries for permanent jobs are estimated to range from $45,000 to $75,000.42
34 A person year of employment is one person employed for one year. 35 See, The Economic Impact of Concentrating Solar Power in New Mexico, Bureau of Business and Economic Research, University of New Mexico, New Mexico, November 2004, which concurs with Schwer and Riddel study. 36 According to Black & Veatch/National Renewable Energy Laboratory, in their report entitled Economic, Energy, and Environmental Benefits of Concentrating Solar Power in California, April 2006, construction employment in job-years for one 100-megawatt solar facility are projected at 455, though the report projects indirect employment at 3,500 jobs, as opposed to the 1,500 indirect and induced jobs created during construction (quoted in the table in this analysis), according to the Schwer and Riddel study. 37 See, The Sun Rises on Nevada: Economic and Environmental Impacts of Developing 2,000 MW of Large-Scale Solar Power Plants, The Vote Solar Initiative, March 2009, www.votesolar.org. The lower end job estimate is based on multiplying 800 jobs (projected for a 100-megawatt project) by 20 (as a 2-gigawatt project is 20 times the size of a 100-megawatt project). 38 Id. See also the Navigant Consulting study regarding concentrating solar power plants (http://www.seia.org/galleries/pdf/Navigant%20Consulting%20Report%209.15.08.pdf) which, based on smaller project sizes, appear to support projections of this level for indirect and induced jobs, as did estimates by Schwer and Riddel. 39 Original research employment estimates concur with those included in Schwer and Riddel. 40 Solar industry positions report salaries between $45,000 and $75,000, compared to the current average annual salary in Nevada which is approximately $40,000. 41 U.S. Bureau of Labor Statistics, May 2007 State Occupational Employment and Wage Estimates, Nevada, construction occupational classification mean annual wage was reported at $45,000; slightly higher estimates used based on original research. 42 Original research salary estimates concur with those included in Schwer and Riddel study.

10
Estimated Employment and Wages & Salaries
One-Time and Recurring
Scenarios/Sizes Estimated Impact
Estimates based on 2 GW solar thermal projections43
One-time direct construction employment (person years of employment)
16,000 - 18,000 jobs44
Wages and Salaries
$800 million – 1.97 billion45
Direct recurring/permanent employment
500 jobs - 720 jobs46
Annual Wages and Salaries $31 - $56 million47 Estimates based on study of 100 MW solar thermal project48
One-time direct construction employment (person years of employment)
800 jobs49
Wages and Salaries $39 million50
Indirect and induced employment impacts of construction period
1,500 jobs
Direct recurring/permanent employment 45 jobs
Annual Wages and Salaries
$2.8 million
43 Estimates based on projections for a 2-gigawatt project in The Sun Rises on Nevada: Economic and Environmental Impacts of Developing 2,000 MW of Large-Scale Solar Power Plants, The Vote Solar Initiative, March 2009, www.votesolar.org. 44 Higher end estimate is based on projections for a 2-gigawatt project in The Sun Rises on Nevada: Economic and Environmental Impacts of Developing 2,000 MW of Large-Scale Solar Power Plants, The Vote Solar Initiative, March 2009, www.votesolar.org. The lower end estimate is based on multiplying 800 jobs (projected for a 100-megawatt project) by 20 (as a 2-gigawatt project is 20 times the size of a 100-megawatt project). 45 U.S. Bureau of Labor Statistics, May 2007 State Occupational Employment and Wage Estimates, Nevada, construction occupational classification mean annual wage was reported at $45,000, which translates to approximately $800 million in wages and salaries paid during construction of a 2-gigawatt project. However, The Vote Solar Initiative study projects significantly higher wages and salaries paid, or approximately $1.97 billion, which is about double an estimate based on a mean wage of $45,000. The statistical model used in The Vote Solar Initiative study includes manufacturing jobs, other related industry sector jobs and construction jobs created during the construction phase of the project and earnings are calculated as a percentage of total plant costs as opposed to particular salary estimates. 46 Higher end ranges are based on projections in The Sun Rises on Nevada: Economic and Environmental Impacts of Developing 2,000 MW of Large-Scale Solar Power Plants, The Vote Solar Initiative, March 2009, www.votesolar.org. Lower end ranges are based on Clean and Diversified Energy Initiative, Western Governors’ Association Solar Task Force Report, January 2006, which is an older study based on a 2-gigawatt project in California. We have presented both estimates under the assumption that actual jobs and wages would fall somewhere between the two. 47 Id. 48 Estimates based on projections for a 100 MW project in study by Schwer and Riddel. 49 Estimates range from less than 800 based on original research, to over 900 (which included manufacturing and other industry sector jobs related to the construction) based on The Vote Solar Initiative projections for a 2-gigawatt project. The Schwer and Riddel projection of approximately 800 is shown in the table. 50 U.S. Bureau of Labor Statistics, May 2007 State Occupational Employment and Wage Estimates, Nevada, construction occupational classification mean annual wage was reported at $45,000; slightly higher estimates used based on original research.
11
ECONOMIC OUTPUT
By way of reference, a 2-gigawatt renewable portfolio is the amount of CSP technology the Western Governors’ Association Solar Task Force projects to be built in California by 2015. As mentioned previously, this amount is also close to the renewable energy capacity required in Nevada by the same year according to the state’s renewable energy portfolio standards. Assuming a renewable portfolio size of 2 gigawatts, the increase in overall gross state output throughout both construction and the life of the plant (or more likely, multiple plants of smaller size combining to total 2 gigawatts) is estimated at nearly $11 billion for a project locating in Nevada, with similar results in other southwestern states.51 Recall that the analysis in this document is based on a 100-megawatt plant, which is 20 times smaller than a 2-gigawatt project. Assuming a similar output factor for a smaller project, a 100-megawatt plant would generate an increase in gross state output of approximately $585 million. Again, these numbers would vary depending on the specific solar technology utilized at the facility. A separate study specifically estimated that a 100-megawatt solar thermal plant would generate $160 million per year of gross state output during construction, and an average of over $22 million per year during the remainder of its 30-year life, for a total of $800 million assuming the construction phase lasts for one year.52 While these two gross economic output figures vary, both suggest output resulting from the construction and operation of a utility-scale solar power project has the potential to be significant. Additionally, each new plant built would produce an incremental amount of output, as well as incur decreased expenses (leading to lower rates) as new development capitalizes on potential economies of scale.53
51 See, The Sun Rises on Nevada: Economic and Environmental Impacts of Developing 2,000 MW of Large-Scale Solar Power Plants, The Vote Solar Initiative, March 2009, www.votesolar.org, which concurs with the $11 billion estimate for a 2-gigawatt project locating in California included in Clean and Diversified Energy Initiative, Western Governors’ Association Solar Task Force Report, January 2006. 52 See, Schwer and Riddel. 53 Consensus among studies referenced that costs decrease as facility capacity increases.
12
COMPARATIVE ANALYSIS OF TAX BURDENS: NEVADA, CALIFORNIA AND ARIZONA
OVERVIEW
Applied Analysis gathered information regarding taxes applicable to the solar energy industry for a hypothetical facility locating in California, Arizona, and Nevada. In order to draw comparisons between the three states, broad estimates of start-up and operation costs for a typical utility-scale solar power plant were obtained through interviews with a number of companies in the industry, whose technologies include photovoltaic and solar thermal. Pro forma financial statements were developed based on these broad estimates with projections spanning a study period encompassing the first 15 years of operation. For simplicity, start-up costs are ramped up in the first year of operation. It is noted that certain technologies take more or less time to construct; some estimates reflect a construction period of less than one year, while others may require periods of two to three years. Longer construction periods would have negligible impact on comparable model results as the total investment, and total impact, is simply spread over a longer period of time. Pro forma estimates are based on a hypothetical 100-megawatt solar power plant requiring an initial capital investment of $400 million. Eighty percent of the initial capital investment is equipment purchases; approximately one percent of the investment consists of land purchase costs, and the remainder consists of construction labor costs and other planning expenses. Other assumptions include cost of goods and operating expenses of approximately 25 percent of income. Modified Accelerated Cost Recovery System (“MACRS”) depreciation is used for income tax purposes and a five-year period is used for equipment. Respective depreciation methods for each state are used to calculate depreciation as needed for state property tax estimates. Cost and income estimates utilized clearly vary among technologies, both between solar photovoltaic and solar thermal, as well as within each of these two major categories. This blended analysis provides a general framework for analysis. It is not intended to be specific to any particular operation or technology; rather, the intent of this analysis is to compare tax environments across three southwestern states: Nevada, California, and Arizona, and to determine how such environments would comparatively affect a single solar power plant. Variances in costs, income, and profit margin would affect the nominal figures included in this analysis; however, relative comparisons across the three states included in this analysis would generally hold true regardless of these variances. Although utility-scale solar facilities and their employees pay all of the taxes imposed on businesses and individuals generally, their operations are particularly sensitive to: 1) sales and use taxes; 2) ad valorem (property) taxes; and 3) business taxes. Absent abatements or exemptions, sales and use taxes are applied to all the machinery and equipment used for the production of energy in the solar power plant, which make up roughly 80 percent of its cost. Similarly, property taxes are generally applied to the land, improvements and personal property of a utility-scale solar facility, which are very significant as a function of revenue.54 Although most, if not all, solar facilities do not generate a profit for the first several years of operation due to losses associated with large depreciation expenses, they ultimately generate 54 This analysis focuses only on personal property improvements (i.e. equipment) rather than real property improvements, such as roads and fences, which are typically a very small percentage of overall improvements.
13
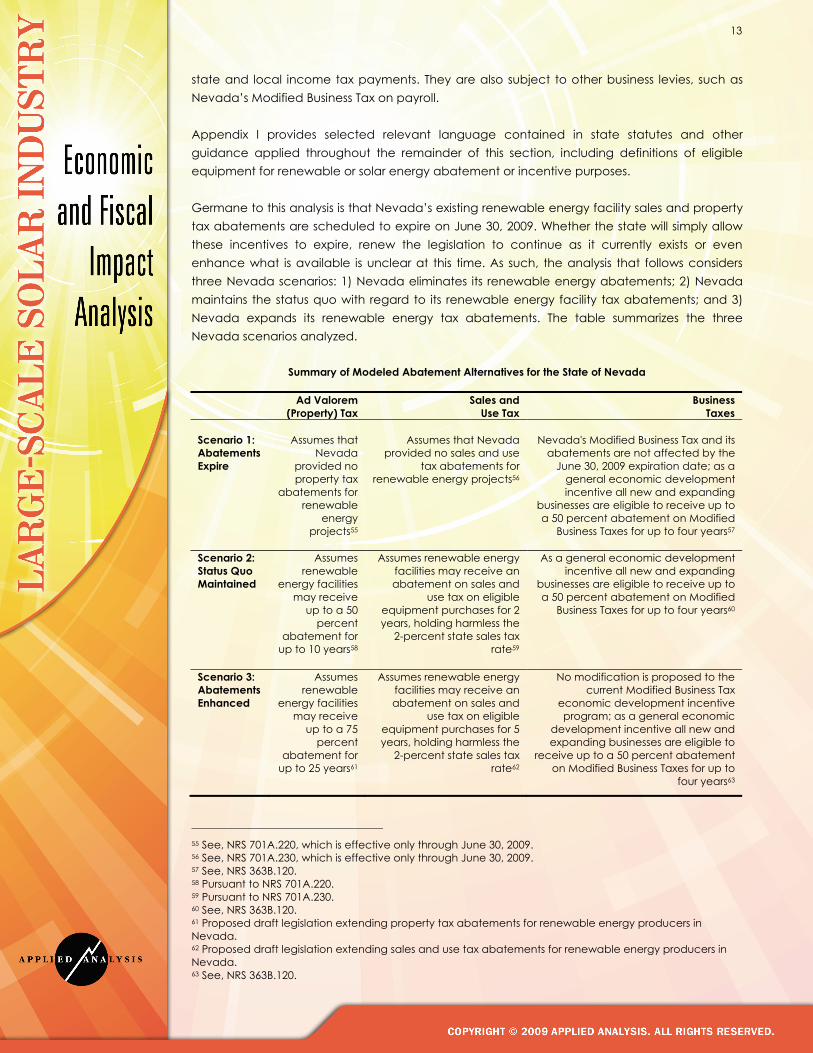
state and local income tax payments. They are also subject to other business levies, such as Nevada’s Modified Business Tax on payroll. Appendix I provides selected relevant language contained in state statutes and other guidance applied throughout the remainder of this section, including definitions of eligible equipment for renewable or solar energy abatement or incentive purposes. Germane to this analysis is that Nevada’s existing renewable energy facility sales and property tax abatements are scheduled to expire on June 30, 2009. Whether the state will simply allow these incentives to expire, renew the legislation to continue as it currently exists or even enhance what is available is unclear at this time. As such, the analysis that follows considers three Nevada scenarios: 1) Nevada eliminates its renewable energy abatements; 2) Nevada maintains the status quo with regard to its renewable energy facility tax abatements; and 3) Nevada expands its renewable energy tax abatements. The table summarizes the three Nevada scenarios analyzed.
Summary of Modeled Abatement Alternatives for the State of Nevada
Ad Valorem (Property) Tax
Sales and Use Tax
Business Taxes
Scenario 1: Abatements Expire
Assumes that
Nevada provided no property tax
abatements for renewable
energy projects55
Assumes that Nevada
provided no sales and use tax abatements for
renewable energy projects56
Nevada's Modified Business Tax and its
abatements are not affected by the June 30, 2009 expiration date; as a
general economic development incentive all new and expanding
businesses are eligible to receive up to a 50 percent abatement on Modified
Business Taxes for up to four years57
Scenario 2: Status Quo Maintained
Assumes renewable
energy facilities may receive
up to a 50 percent
abatement for up to 10 years58
Assumes renewable energy facilities may receive an abatement on sales and
use tax on eligible equipment purchases for 2 years, holding harmless the
2-percent state sales tax rate59
As a general economic development incentive all new and expanding
businesses are eligible to receive up to a 50 percent abatement on Modified
Business Taxes for up to four years60
Scenario 3: Abatements Enhanced
Assumes renewable
energy facilities may receive
up to a 75 percent
abatement for up to 25 years61
Assumes renewable energy facilities may receive an abatement on sales and
use tax on eligible equipment purchases for 5 years, holding harmless the
2-percent state sales tax rate62
No modification is proposed to the current Modified Business Tax
economic development incentive program; as a general economic
development incentive all new and expanding businesses are eligible to
receive up to a 50 percent abatement on Modified Business Taxes for up to
four years63
55 See, NRS 701A.220, which is effective only through June 30, 2009. 56 See, NRS 701A.230, which is effective only through June 30, 2009. 57 See, NRS 363B.120. 58 Pursuant to NRS 701A.220. 59 Pursuant to NRS 701A.230. 60 See, NRS 363B.120. 61 Proposed draft legislation extending property tax abatements for renewable energy producers in Nevada. 62 Proposed draft legislation extending sales and use tax abatements for renewable energy producers in Nevada. 63 See, NRS 363B.120.
14
SALES AND USE TAX
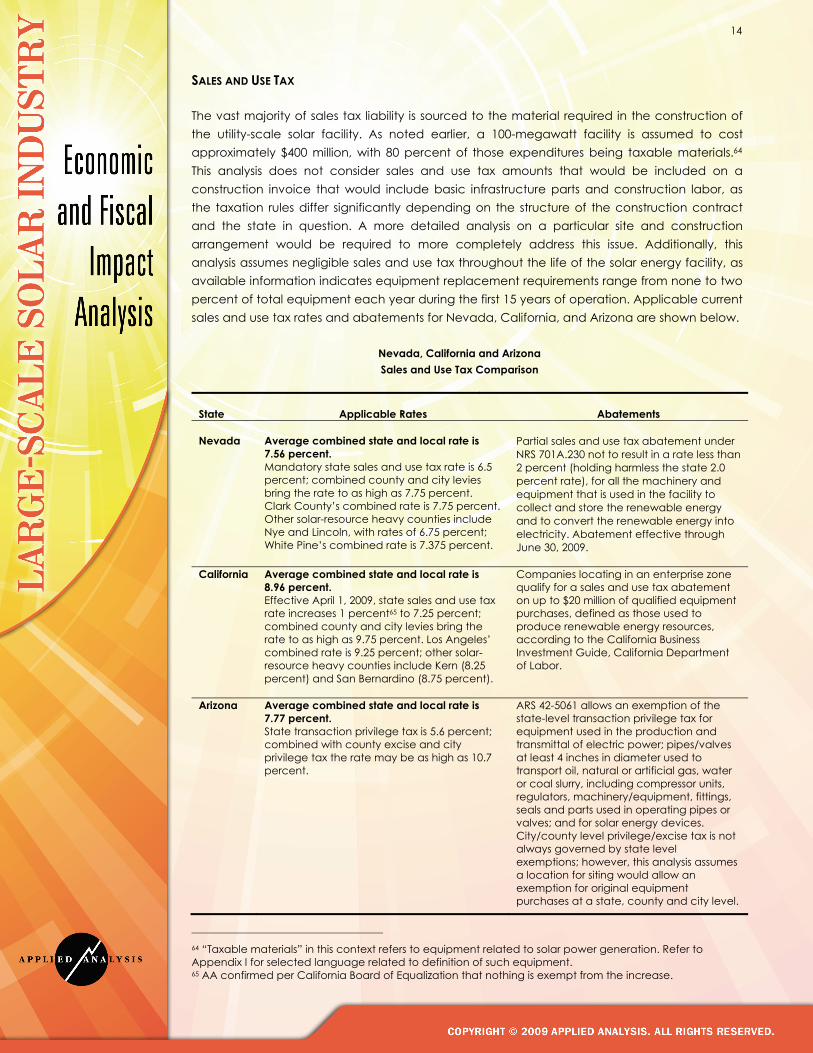
The vast majority of sales tax liability is sourced to the material required in the construction of the utility-scale solar facility. As noted earlier, a 100-megawatt facility is assumed to cost approximately $400 million, with 80 percent of those expenditures being taxable materials.64 This analysis does not consider sales and use tax amounts that would be included on a construction invoice that would include basic infrastructure parts and construction labor, as the taxation rules differ significantly depending on the structure of the construction contract and the state in question. A more detailed analysis on a particular site and construction arrangement would be required to more completely address this issue. Additionally, this analysis assumes negligible sales and use tax throughout the life of the solar energy facility, as available information indicates equipment replacement requirements range from none to two percent of total equipment each year during the first 15 years of operation. Applicable current sales and use tax rates and abatements for Nevada, California, and Arizona are shown below.
Nevada, California and Arizona Sales and Use Tax Comparison
State Applicable Rates Abatements Nevada
Average combined state and local rate is 7.56 percent. Mandatory state sales and use tax rate is 6.5 percent; combined county and city levies bring the rate to as high as 7.75 percent. Clark County’s combined rate is 7.75 percent. Other solar-resource heavy counties include Nye and Lincoln, with rates of 6.75 percent; White Pine’s combined rate is 7.375 percent.
Partial sales and use tax abatement under NRS 701A.230 not to result in a rate less than 2 percent (holding harmless the state 2.0 percent rate), for all the machinery and equipment that is used in the facility to collect and store the renewable energy and to convert the renewable energy into electricity. Abatement effective through June 30, 2009.
California Average combined state and local rate is 8.96 percent. Effective April 1, 2009, state sales and use tax rate increases 1 percent65 to 7.25 percent; combined county and city levies bring the rate to as high as 9.75 percent. Los Angeles’ combined rate is 9.25 percent; other solar-resource heavy counties include Kern (8.25 percent) and San Bernardino (8.75 percent).
Companies locating in an enterprise zone qualify for a sales and use tax abatement on up to $20 million of qualified equipment purchases, defined as those used to produce renewable energy resources, according to the California Business Investment Guide, California Department of Labor.
Arizona Average combined state and local rate is 7.77 percent. State transaction privilege tax is 5.6 percent; combined with county excise and city privilege tax the rate may be as high as 10.7 percent.
ARS 42-5061 allows an exemption of the state-level transaction privilege tax for equipment used in the production and transmittal of electric power; pipes/valves at least 4 inches in diameter used to transport oil, natural or artificial gas, water or coal slurry, including compressor units, regulators, machinery/equipment, fittings, seals and parts used in operating pipes or valves; and for solar energy devices. City/county level privilege/excise tax is not always governed by state level exemptions; however, this analysis assumes a location for siting would allow an exemption for original equipment purchases at a state, county and city level.
64 “Taxable materials” in this context refers to equipment related to solar power generation. Refer to Appendix I for selected language related to definition of such equipment. 65 AA confirmed per California Board of Equalization that nothing is exempt from the increase.
15
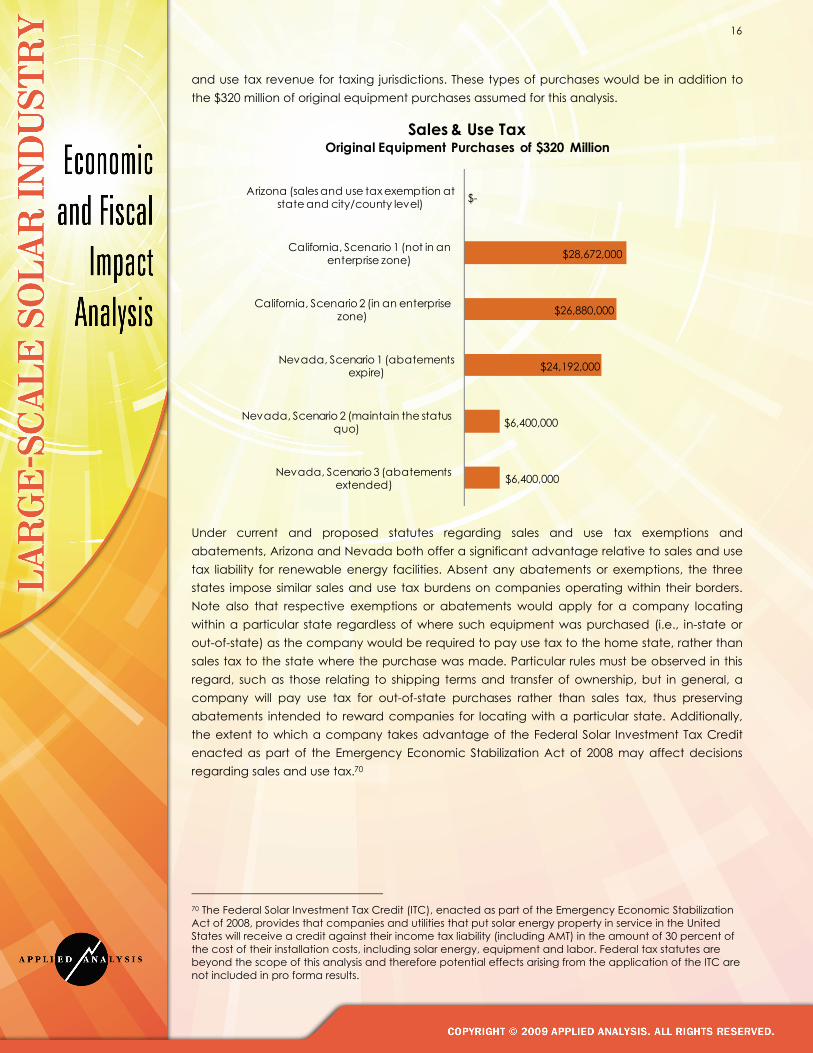
Generally, businesses purchasing equipment from out-of-state suppliers are subject not to sales tax, but to an accompanying use tax payable to the state in which that business is located and the goods purchased will be consumed. It is assumed, for purposes of this analysis that sales tax exemptions, such as those provided for in Nevada Revised Statute (NRS) 701A.230, apply regardless of whether purchases of eligible equipment are made in-state or out-of-state. Nevada imposes a maximum sales and use tax rate of 7.75 percent on all tangible personal property. Under NRS 701A.230, a utility-scale solar energy producer may qualify for a partial abatement of sales and use tax owed on eligible machinery and equipment (partial, meaning the state’s 2.0 percent sales and use tax continues to be collected). The statute states that if the business that qualifies for the abatement is a facility for the generation of electricity from renewable energy, all the machinery and equipment that is used in the facility to collect and store the renewable energy and to convert the renewable energy into electricity is considered eligible.66 Specifically excluded from eligibility are buildings or the structural components of buildings, equipment used by a public utility, equipment used for medical treatment, machinery or equipment used in mining or gaming, or aircraft.67 This language is comparable to statutes in Arizona related to equipment used in the production and transmittal of electric power, as well as to the definition of qualified equipment in California in regards to the enterprise zone tax credit for renewable energy resources. Refer to Appendix I for selected language regarding equipment definitions in relevant state statutes. The California enterprise zone is one of four types of “economic development areas” created by the state; these include local agency military base recovery areas, manufacturing enhancement areas, targeted tax areas, and enterprise zones. Businesses locating within the boundaries of an enterprise zone, which are located throughout the state, are eligible for certain tax credits, including the sales and use tax credit on qualified machinery or parts, including those used to produce renewable energy resources.68 Enterprise zone tax credit guidelines include a requirement that equipment must be purchased in California unless equipment of comparable price and quality cannot be found in-state.69 The chart on the following page depicts sales and use tax payable on estimated original equipment purchases for a new solar energy production facility, assuming initial cash outlay for equipment of $320 million (or 80 percent of a $400 million plant). As previously discussed, equipment replacement over the life of a solar power facility is typically minimal. As such, sales and use tax on the original equipment purchased would likely comprise more than 90 percent of sales and use tax paid over the life of the renewable energy power plant. Sales and use tax generated by the purchase of replacement equipment, which may range from zero to two percent of original equipment per year, could amount to a few hundred thousand dollars per year. Over the life of the plant, this may total several million dollars inuring to the state in the form of sales and use tax payments, depending on the specific technology and the host state. Additionally, as previously discussed, sales and use tax paid as part of a construction invoice for infrastructure improvements such as fences, roads, and outbuildings are not included in this analysis because they would be paid by third parties and would also result in additional sales
66 NRS 701A.230, Section 3 67 Id. 68 See, California Investment Guide, published by California Business Investment Services, July 2008 (www.labor.ca.gov/calbis). 69 Id.
16
and use tax revenue for taxing jurisdictions. These types of purchases would be in addition to the $320 million of original equipment purchases assumed for this analysis.
$6,400,000
$6,400,000
$24,192,000
$26,880,000
$28,672,000
$-
Nevada, Scenario 3 (abatements extended)
Nevada, Scenario 2 (maintain the status quo)
Nevada, Scenario 1 (abatements expire)
California, Scenario 2 (in an enterprise zone)
California, Scenario 1 (not in an enterprise zone)
Arizona (sales and use tax exemption at state and city/county level)
Sales & Use Tax Original Equipment Purchases of $320 Million
Under current and proposed statutes regarding sales and use tax exemptions and abatements, Arizona and Nevada both offer a significant advantage relative to sales and use tax liability for renewable energy facilities. Absent any abatements or exemptions, the three states impose similar sales and use tax burdens on companies operating within their borders. Note also that respective exemptions or abatements would apply for a company locating within a particular state regardless of where such equipment was purchased (i.e., in-state or out-of-state) as the company would be required to pay use tax to the home state, rather than sales tax to the state where the purchase was made. Particular rules must be observed in this regard, such as those relating to shipping terms and transfer of ownership, but in general, a company will pay use tax for out-of-state purchases rather than sales tax, thus preserving abatements intended to reward companies for locating with a particular state. Additionally, the extent to which a company takes advantage of the Federal Solar Investment Tax Credit enacted as part of the Emergency Economic Stabilization Act of 2008 may affect decisions regarding sales and use tax.70
70 The Federal Solar Investment Tax Credit (ITC), enacted as part of the Emergency Economic Stabilization Act of 2008, provides that companies and utilities that put solar energy property in service in the United States will receive a credit against their income tax liability (including AMT) in the amount of 30 percent of the cost of their installation costs, including solar energy, equipment and labor. Federal tax statutes are beyond the scope of this analysis and therefore potential effects arising from the application of the ITC are not included in pro forma results.

17
PROPERTY TAX
Ad valorem (property) taxes are generally imposed on the assessed value of land, improvements and personal property as an annual tax assessment. Property tax was estimated assuming that equipment purchases (or improvements, falling mainly under the category of personal property) are approximately 80 percent of the initial $400 million capital investment required for a new 100-megawatt solar facility. This assumption is consistent with the assumptions utilized in the previous sales and use tax analysis. Additionally, land was assumed not to appreciate in value, and equipment replacement cost was assumed to remain constant over the 15-year study period. As economies of scale and technologies improve, it is likely equipment replacement cost may actually decrease. The analysis takes a conservative approach in not assuming a decrease in this regard. As the land used for site locations is likely to be remote and/or Bureau of Land Management (BLM) land for lease, the analysis determined constant land value to be a likely scenario, though the demand for and value of such land could certainly increase over time.
Property Tax Comparison Nevada, California and Arizona
State Applicable Rates Abatements Nevada
Average of $3.147 per $100 of assessed value (taxable value multiplied by the level of assessment, currently 35 percent). Under NRS 361.227, taxable value of vacant land is determined by full cash value. Generally, taxable value of improvements is determined by subtracting from the cost of replacement of the improvements all applicable depreciation and obsolescence. Depreciation of improvements is calculated at 1.5 percent of the cost of replacement for each year; for personal property, a 20-year life is assumed under Nevada Personal Property Handbook guidelines and category 7 depreciation applied.
Under NRS 701A.220, 50 percent of property tax may be abated for renewable energy producers for a period of 10 years. NRS 701A.220 expires June 30, 2009.
California
Under Proposition 13, general property tax is limited to 1 percent of full cash value. Twenty-year straight-line depreciation of equipment under NAIC Code 2211.
Assembly Bill 1451 allows 100 percent property tax exclusion for new active solar energy systems and 75 percent abatement on dual use equipment. AB 1451 expires in 2015-16, though exempt property remains exempt after expiration until the property changes hands.
Arizona
Average primary taxes of $6.24 per $100 of assessed value. Average secondary taxes of $2.99 of assessed value. Under ARS 42-14155 and 42-14154, renewable energy equipment is valued at 20 percent of the depreciated cost of the equipment, and is then assessed at 20 percent of taxable value. Since 2007, the assessment ratio for Class 1 real and personal property has been declining and will be 20 percent in 2011 (the ratio will decline from 23 percent to 20 percent by 2011). Depreciation is calculated using straight-line depreciation over the useful life of the item. Taxable value of land generally would be based on full cash value, assessed at 23 percent.
Under ARS 42-14155, renewable energy equipment is valued at 20 percent of depreciated cost.
18
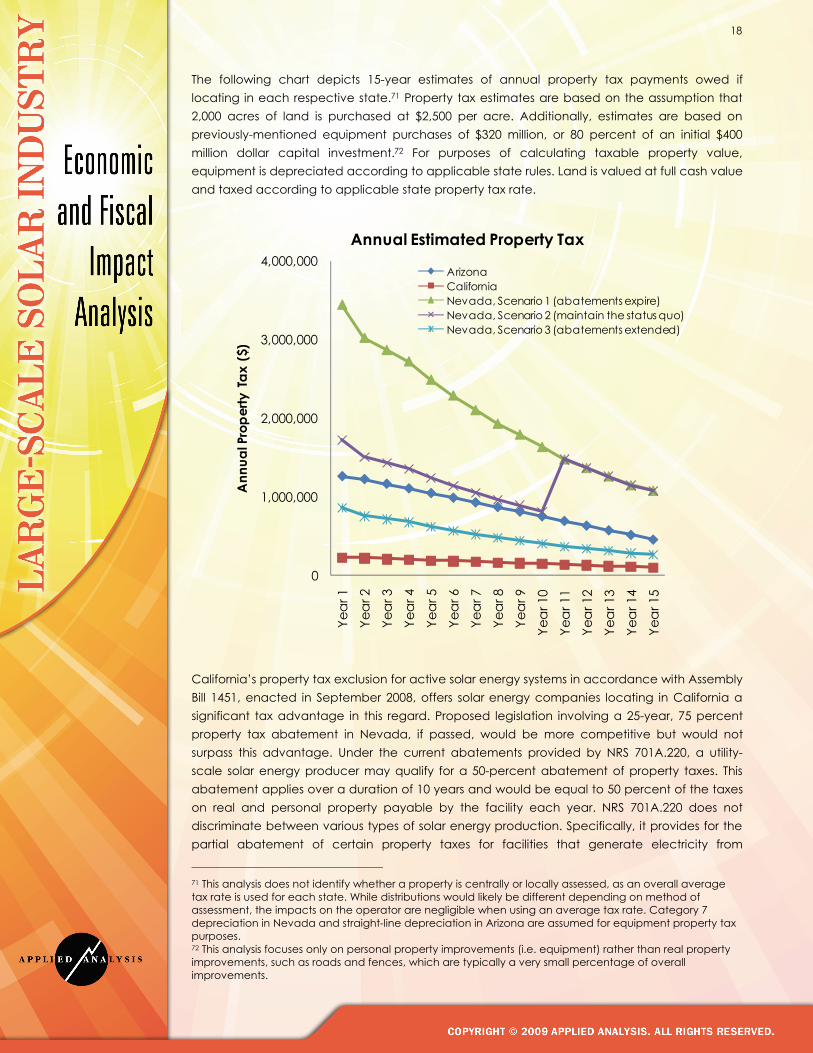
The following chart depicts 15-year estimates of annual property tax payments owed if locating in each respective state.71 Property tax estimates are based on the assumption that 2,000 acres of land is purchased at $2,500 per acre. Additionally, estimates are based on previously-mentioned equipment purchases of $320 million, or 80 percent of an initial $400 million dollar capital investment.72 For purposes of calculating taxable property value, equipment is depreciated according to applicable state rules. Land is valued at full cash value and taxed according to applicable state property tax rate.
0
1,000,000
2,000,000
3,000,000
4,000,000
Yea
r 1
Yea
r 2
Yea
r 3
Yea
r 4
Yea
r 5
Yea
r 6
Yea
r 7
Yea
r 8
Yea
r 9
Yea
r 10
Yea
r 11
Yea
r 12
Yea
r 13
Yea
r 14
Yea
r 15
Ann
ual P
rope
rty T
ax (
$)Annual Estimated Property Tax
ArizonaCaliforniaNevada, Scenario 1 (abatements expire)Nevada, Scenario 2 (maintain the status quo)Nevada, Scenario 3 (abatements extended)
California’s property tax exclusion for active solar energy systems in accordance with Assembly Bill 1451, enacted in September 2008, offers solar energy companies locating in California a significant tax advantage in this regard. Proposed legislation involving a 25-year, 75 percent property tax abatement in Nevada, if passed, would be more competitive but would not surpass this advantage. Under the current abatements provided by NRS 701A.220, a utility-scale solar energy producer may qualify for a 50-percent abatement of property taxes. This abatement applies over a duration of 10 years and would be equal to 50 percent of the taxes on real and personal property payable by the facility each year. NRS 701A.220 does not discriminate between various types of solar energy production. Specifically, it provides for the partial abatement of certain property taxes for facilities that generate electricity from
71 This analysis does not identify whether a property is centrally or locally assessed, as an overall average tax rate is used for each state. While distributions would likely be different depending on method of assessment, the impacts on the operator are negligible when using an average tax rate. Category 7 depreciation in Nevada and straight-line depreciation in Arizona are assumed for equipment property tax purposes. 72 This analysis focuses only on personal property improvements (i.e. equipment) rather than real property improvements, such as roads and fences, which are typically a very small percentage of overall improvements.

19
renewable energy or produce energy storage devices. Renewable energy is defined in this statute as biomass, solar energy, or wind. By contrast, the term “renewable energy” does not include coal, natural gas, oil, propane or any other fossil fuel, or nuclear energy. Notably, this statute is scheduled to expire on June 30, 2009.
BUSINESS TAXES
Barring abatement, large-scale solar energy facilities pay all of the taxes imposed on businesses generally. Business taxes have the potential to be a significant factor in a decision to locate a solar energy plant in one state or another. The business tax equation, however, is somewhat more complicated than the previously discussed sales and property taxes. Due to heavy up-front investment and associated accelerated depreciation under MACRS,73 many solar energy plants tend to experience heavy losses in the first several years of operation. This depreciation often offsets any operating gains, making state and local income tax assessments essentially zero. Because of this tendency, utility-scale solar energy facilities are often built in partnership so that these operating losses can offset gains of other (usually related) ventures. The implications of federal tax strategies are well beyond the scope of this analysis. That said, it is worth noting that these considerations are material and that profits (and any taxes based on profits) are generally little if any during the early operating period. In California, for example, net operating losses may be carried forward for 10 years, subject to certain restrictions. In Arizona, net operating losses may be carried forward for five years, also subject to certain restrictions. Nevada does not impose a corporate income tax, but rather its general businesses tax is a 0.63 percent levy imposed on adjusted payroll (the Modified Business Tax). Nevada’s Modified Business Tax is levied and due without respect to profitability. Additionally, certain credits may be taken against corporate income tax if specific requirements are met. In California, research and development (“R&D”) spending is required to exceed a “base level” that has been determined in prior years in order to qualify for an R&D credit. In Arizona, a similar credit is available that requires increased R&D activity in order for an entity to qualify.
73 Modified Accelerated Cost Recovery System (“MACRS”) depreciation is used for income tax purposes and a five-year period is used for equipment.

20
Corporate Income Tax Comparison Nevada, California and Arizona
State Applicable Rates Credits Nevada
No corporate income tax. Modified Business Tax paid on 0.63 percent of total gross wages less a qualified deduction for employee health benefits paid by the employer.
Qualifying employers may apply for an abatement of 50 percent of the tax otherwise due during the first four years of its operations (NRS 363B.120)
California Corporate income tax rate is 8.84 percent. Alternative minimum tax is 6.65 percent (no alternative minimum tax for an S Corporation).
Research and development (R&D) credits are available if R&D exceeds a “base level” that is determined in prior years.
Arizona Corporate income tax rate is 6.968 percent. No alternative minimum tax.
Research and development (R&D) credits are available if R&D increases over time.
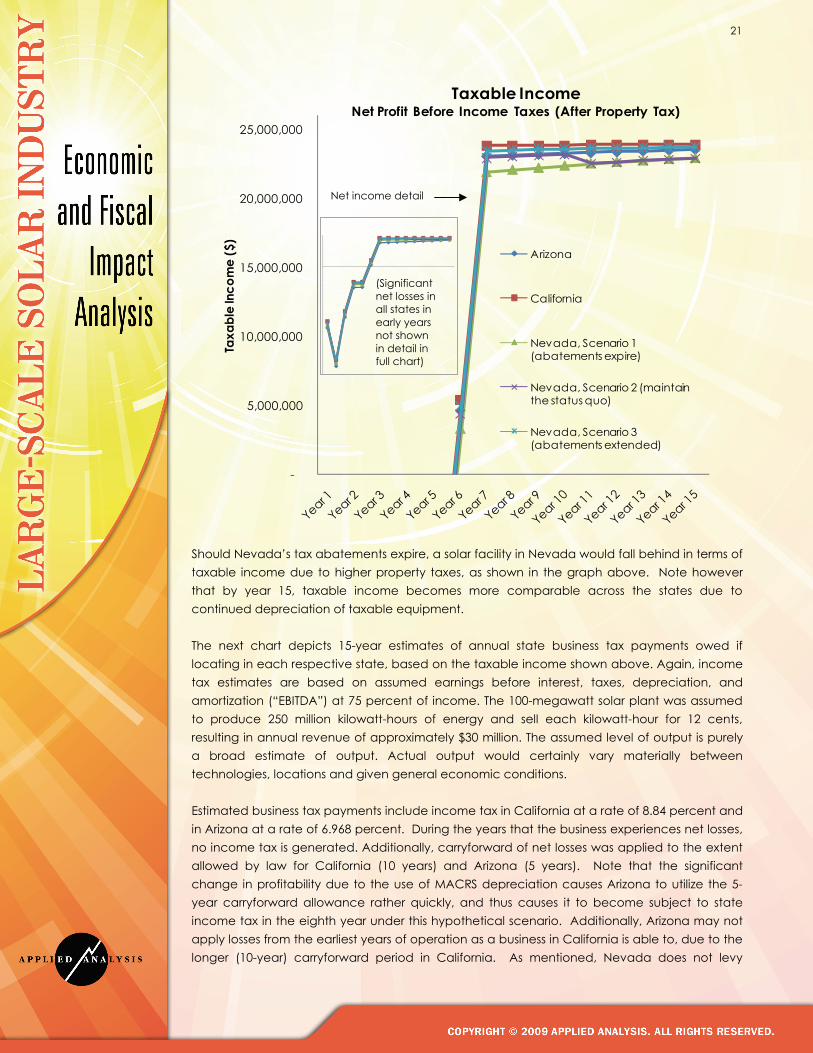
At this point, it is helpful to take a look at total income that may be subject to tax in each of the three states. The following chart depicts 15-year estimates of annual taxable income. Annual taxable income assumes earnings before interest, taxes, depreciation, and amortization (“EBITDA”) at 75 percent of gross income. The 100-megawatt solar plant was assumed to produce 250 million kilowatt hours of energy and sell each kilowatt hour for 12 cents,74 resulting in annual revenue of approximately $30 million to $32 million. The assumed level of output is purely a broad estimate of output. Actual output would vary materially between technologies.
74 General estimate of 12 cents utilized based on range of price points obtained through discussions with Large-scale Solar member companies as well as general research. Actual price obtained may vary.
21
-
5,000,000
10,000,000
15,000,000
20,000,000
25,000,000
Taxa
ble
Inco
me
($)
Taxable IncomeNet Profit Before Income Taxes (After Property Tax)
Arizona
California
Nevada, Scenario 1 (abatements expire)
Nevada, Scenario 2 (maintain the status quo)
Nevada, Scenario 3 (abatements extended)
Should Nevada’s tax abatements expire, a solar facility in Nevada would fall behind in terms of taxable income due to higher property taxes, as shown in the graph above. Note however that by year 15, taxable income becomes more comparable across the states due to continued depreciation of taxable equipment. The next chart depicts 15-year estimates of annual state business tax payments owed if locating in each respective state, based on the taxable income shown above. Again, income tax estimates are based on assumed earnings before interest, taxes, depreciation, and amortization (“EBITDA”) at 75 percent of income. The 100-megawatt solar plant was assumed to produce 250 million kilowatt-hours of energy and sell each kilowatt-hour for 12 cents, resulting in annual revenue of approximately $30 million. The assumed level of output is purely a broad estimate of output. Actual output would certainly vary materially between technologies, locations and given general economic conditions. Estimated business tax payments include income tax in California at a rate of 8.84 percent and in Arizona at a rate of 6.968 percent. During the years that the business experiences net losses, no income tax is generated. Additionally, carryforward of net losses was applied to the extent allowed by law for California (10 years) and Arizona (5 years). Note that the significant change in profitability due to the use of MACRS depreciation causes Arizona to utilize the 5-year carryforward allowance rather quickly, and thus causes it to become subject to state income tax in the eighth year under this hypothetical scenario. Additionally, Arizona may not apply losses from the earliest years of operation as a business in California is able to, due to the longer (10-year) carryforward period in California. As mentioned, Nevada does not levy
(Significant net losses in all states in early years not shown in detail in full chart)
Net income detail

22
income tax, but rather a modified business tax based on payroll. Thus, in Nevada, a business is subject to a form of business tax even when the business is experiencing net losses.
-
400,000
800,000
1,200,000
1,600,000
2,000,000
Tax
Paym
ents
($)
Estimated Business Tax PaymentsIncome and Modified Business Taxes
Arizona California Nevada (Modified Business Tax)
Finally, cumulative profits after tax over the 15-year period (also under a scenario including all previously discussed assumptions) are as follows. Note cumulative profit after tax does not include sales and use tax paid on original equipment purchases (or on replacement equipment purchases), as this one-time tax associated with facility construction was not included for pro forma purposes. Cumulative profit after tax also does not include federal tax, which, if included, would likely slightly increase California and Arizona’s cumulative profit relative to Nevada’s cumulative profit, due to the fact that state income tax paid may be deducted against federal income tax.
$26,139,244
$15,297,341
$3,130,724
$24,806,745
$7,921,587
Nevada, Scenario 3 (abatements extended)
Nevada, Scenario 2 (maintain the status quo)
Nevada, Scenario 1 (abatements expire)
California
Arizona
Cumulative Profit After Tax15-Year Period Utilizing All Previous Assumptions
In Nevada, modified business tax paid is approximately $7,500 annually during the first 4 years of operation and $15,000 through year 15.
23
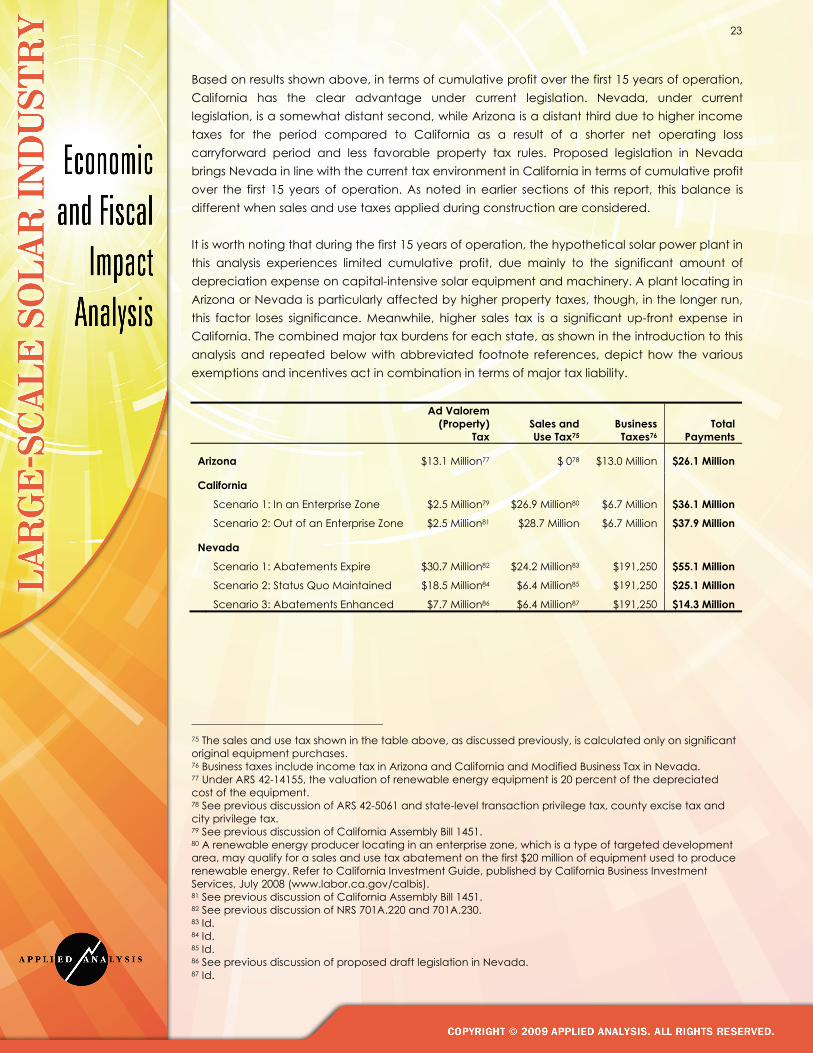
Based on results shown above, in terms of cumulative profit over the first 15 years of operation, California has the clear advantage under current legislation. Nevada, under current legislation, is a somewhat distant second, while Arizona is a distant third due to higher income taxes for the period compared to California as a result of a shorter net operating loss carryforward period and less favorable property tax rules. Proposed legislation in Nevada brings Nevada in line with the current tax environment in California in terms of cumulative profit over the first 15 years of operation. As noted in earlier sections of this report, this balance is different when sales and use taxes applied during construction are considered. It is worth noting that during the first 15 years of operation, the hypothetical solar power plant in this analysis experiences limited cumulative profit, due mainly to the significant amount of depreciation expense on capital-intensive solar equipment and machinery. A plant locating in Arizona or Nevada is particularly affected by higher property taxes, though, in the longer run, this factor loses significance. Meanwhile, higher sales tax is a significant up-front expense in California. The combined major tax burdens for each state, as shown in the introduction to this analysis and repeated below with abbreviated footnote references, depict how the various exemptions and incentives act in combination in terms of major tax liability.
Ad Valorem (Property)
Tax Sales and Use Tax75
Business Taxes76
Total Payments
Arizona $13.1 Million77 $ 078 $13.0 Million $26.1 Million
California
Scenario 1: In an Enterprise Zone $2.5 Million79 $26.9 Million80 $6.7 Million $36.1 Million Scenario 2: Out of an Enterprise Zone $2.5 Million81 $28.7 Million $6.7 Million $37.9 Million
Nevada
Scenario 1: Abatements Expire $30.7 Million82 $24.2 Million83 $191,250 $55.1 Million Scenario 2: Status Quo Maintained $18.5 Million84 $6.4 Million85 $191,250 $25.1 Million
Scenario 3: Abatements Enhanced $7.7 Million86 $6.4 Million87 $191,250 $14.3 Million
75 The sales and use tax shown in the table above, as discussed previously, is calculated only on significant original equipment purchases. 76 Business taxes include income tax in Arizona and California and Modified Business Tax in Nevada. 77 Under ARS 42-14155, the valuation of renewable energy equipment is 20 percent of the depreciated cost of the equipment. 78 See previous discussion of ARS 42-5061 and state-level transaction privilege tax, county excise tax and city privilege tax. 79 See previous discussion of California Assembly Bill 1451. 80 A renewable energy producer locating in an enterprise zone, which is a type of targeted development area, may qualify for a sales and use tax abatement on the first $20 million of equipment used to produce renewable energy. Refer to California Investment Guide, published by California Business Investment Services, July 2008 (www.labor.ca.gov/calbis). 81 See previous discussion of California Assembly Bill 1451. 82 See previous discussion of NRS 701A.220 and 701A.230. 83 Id. 84 Id. 85 Id. 86 See previous discussion of proposed draft legislation in Nevada. 87 Id.

24
RESEARCH AND DATA COLLECTION PROCESS
This analysis was developed after reviewing applicable state statutes and business development publications from each state’s respective business development office or similar department. Resources reviewed included Nevada Revised Statutes,88 publications of the Nevada Commission on Economic Development,89 Arizona Revised Statutes,90 publications of the Arizona Department of Commerce,91 the California Revenue and Taxation Code,92 California Bill Information,93 and the California Investment Guide: An Overview of Advantages, Assistance, Taxes and Permits.94 Incentives, or the lack thereof, were confirmed with representatives from the Nevada Office of Business Development, the Arizona Department of Commerce, Energy Division, and California Business Investment Services (also known as CalBIS), which is part of the California Labor and Workforce Development Agency. Various taxation officials and professionals were consulted in each state included in the study. Data for the economic impact section of this analysis was obtained from studies performed by the Center for Business and Economic Research at University of Nevada, Las Vegas (“UNLV”),95 the Western Governors’ Association Solar Task Force,96 the Bureau of Business and Economic Research at University of New Mexico,97 and recent studies by Navigant Consulting regarding the impacts of the solar energy industry.98 Additionally, other materials related specifically to the solar industry were reviewed. Resources included publications of the Solar Energy Industries Association,99 the Database of State Incentives for Renewables & Efficiency (DSIRE),100 the U.S. Bureau of Land Management,101 the Solar Energy Development Programmatic Environmental Impact Statement,102 and the Interstate Renewable Energy Council.103 Finally, review of publicly available materials pertaining to member companies of the Large-scale Solar Association, furthered by interviews with representatives of such companies, provided insight for the development of a pro forma financial model to which state-specific tax rules, incentives, and abatements could be applied.
88 See, Nevada Revised Statutes (http://www.leg.state.nv.us/law1.cfm). 89 See, Nevada Commission on Economic Development (http://www.expand2nevada.com/). 90 See, Arizona Revised Statutes (http://www.azleg.state.az.us/ArizonaRevisedStatutes.asp). 91 See, Arizona Department of Commerce (http://www.azcommerce.com). 92 See, California Revenue and Taxation Code (http://www.leginfo.ca.gov/cgi-bin/calawquery?codesection=rtc&codebody=&hits=20). 93 See, California Bill Information (http://www.leginfo.ca.gov/bilinfo.html). 94 See, California Investment Guide, published by California Business Investment Services, July 2008 (www.labor.ca.gov/calbis). 95 See, R.K. Schwer and M. Riddel, The Potential Economic Impact of Constructing and Operating Solar Power Generation Facilities in Nevada, Center for Business and Economic Research, University of Nevada Las Vegas, Las Vegas, February 2004. 96 See, Clean and Diversified Energy Initiative, Western Governors’ Association Solar Task Force Report, January 2006. 97 See, The Economic Impact of Concentrating Solar Power in New Mexico, Bureau of Business and Economic Research, University of New Mexico, New Mexico, November 2004. 98 See, Economic Impacts of Extending Federal Solar Tax Credits, Navigant Consulting, September 2008, http://www.seia.org/galleries/pdf/Navigant%20Consulting%20Report%209.15.08.pdf. 99 See, Solar Energy Industries Association (www.SEIA.org). 100 See, Database of State Incentives for Renewables & Efficiency, North Carolina State University, Solar Center (www.dsireusa.org). 101 See, U.S. Bureau of Land Management (http://www.blm.gov/wo/st/en/prog/energy.1.html). 102 See, Solar Energy Development Programmatic Environmental Impact Statement (http://solareis.anl.gov). 103 See, Sherwood, Larry, U.S. Solar Market Trends 2007, Interstate Renewable Energy Council, August 2008.
25
ASSUMPTIONS
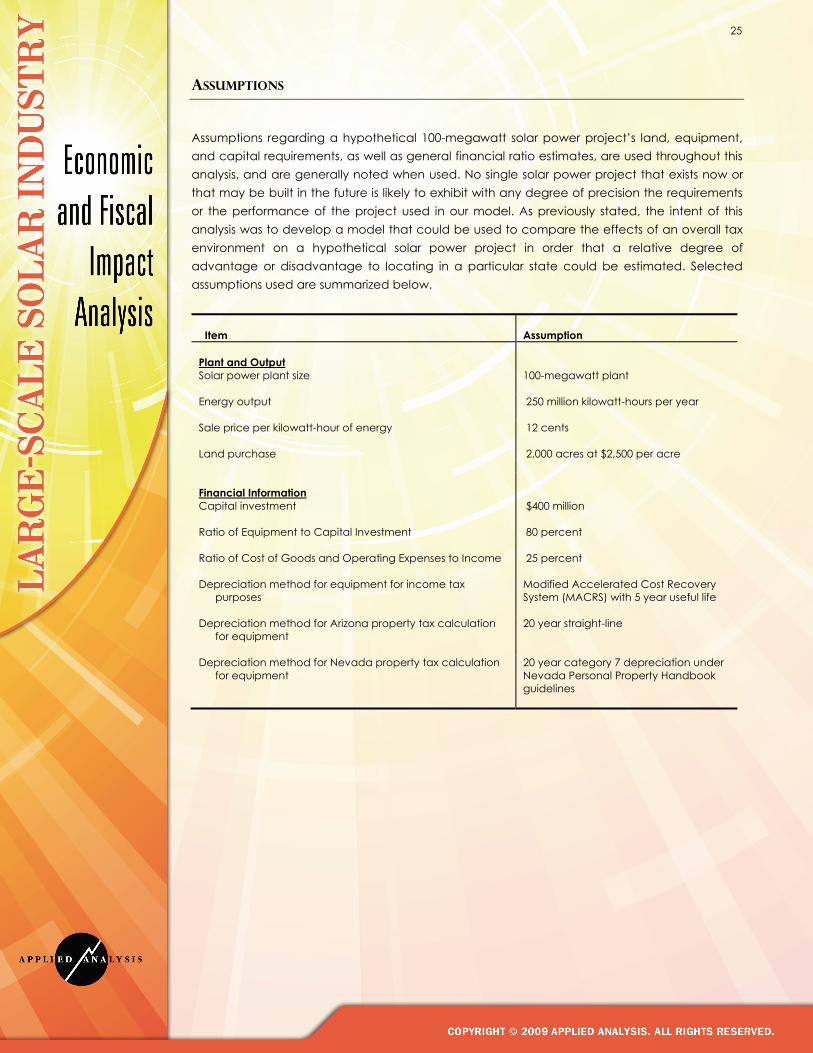
Assumptions regarding a hypothetical 100-megawatt solar power project’s land, equipment, and capital requirements, as well as general financial ratio estimates, are used throughout this analysis, and are generally noted when used. No single solar power project that exists now or that may be built in the future is likely to exhibit with any degree of precision the requirements or the performance of the project used in our model. As previously stated, the intent of this analysis was to develop a model that could be used to compare the effects of an overall tax environment on a hypothetical solar power project in order that a relative degree of advantage or disadvantage to locating in a particular state could be estimated. Selected assumptions used are summarized below.
Item
Assumption
Plant and Output Solar power plant size
100-megawatt plant
Energy output
250 million kilowatt-hours per year
Sale price per kilowatt-hour of energy
12 cents
Land purchase 2,000 acres at $2,500 per acre
Financial Information
Capital investment
$400 million
Ratio of Equipment to Capital Investment
80 percent
Ratio of Cost of Goods and Operating Expenses to Income
25 percent
Depreciation method for equipment for income tax purposes
Modified Accelerated Cost Recovery System (MACRS) with 5 year useful life
Depreciation method for Arizona property tax calculation for equipment
20 year straight-line
Depreciation method for Nevada property tax calculation for equipment
20 year category 7 depreciation under Nevada Personal Property Handbook guidelines
26
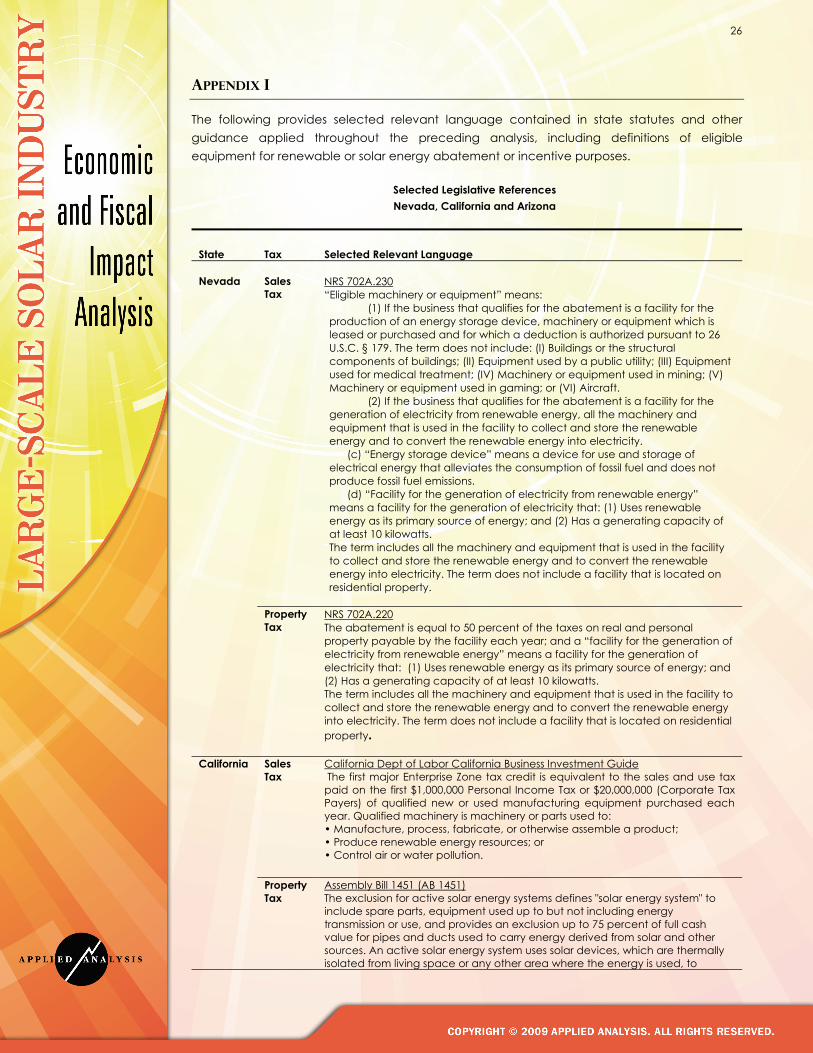
APPENDIX I
The following provides selected relevant language contained in state statutes and other guidance applied throughout the preceding analysis, including definitions of eligible equipment for renewable or solar energy abatement or incentive purposes.
Selected Legislative References Nevada, California and Arizona
State Tax Selected Relevant Language Nevada
Sales Tax
NRS 702A.230 “Eligible machinery or equipment” means: (1) If the business that qualifies for the abatement is a facility for the production of an energy storage device, machinery or equipment which is leased or purchased and for which a deduction is authorized pursuant to 26 U.S.C. § 179. The term does not include: (I) Buildings or the structural components of buildings; (II) Equipment used by a public utility; (III) Equipment used for medical treatment; (IV) Machinery or equipment used in mining; (V) Machinery or equipment used in gaming; or (VI) Aircraft. (2) If the business that qualifies for the abatement is a facility for the generation of electricity from renewable energy, all the machinery and equipment that is used in the facility to collect and store the renewable energy and to convert the renewable energy into electricity. (c) “Energy storage device” means a device for use and storage of electrical energy that alleviates the consumption of fossil fuel and does not produce fossil fuel emissions. (d) “Facility for the generation of electricity from renewable energy” means a facility for the generation of electricity that: (1) Uses renewable energy as its primary source of energy; and (2) Has a generating capacity of at least 10 kilowatts. The term includes all the machinery and equipment that is used in the facility to collect and store the renewable energy and to convert the renewable energy into electricity. The term does not include a facility that is located on residential property.
Property Tax
NRS 702A.220 The abatement is equal to 50 percent of the taxes on real and personal property payable by the facility each year; and a “facility for the generation of electricity from renewable energy” means a facility for the generation of electricity that: (1) Uses renewable energy as its primary source of energy; and (2) Has a generating capacity of at least 10 kilowatts. The term includes all the machinery and equipment that is used in the facility to collect and store the renewable energy and to convert the renewable energy into electricity. The term does not include a facility that is located on residential property.
California Sales Tax
California Dept of Labor California Business Investment Guide The first major Enterprise Zone tax credit is equivalent to the sales and use tax paid on the first $1,000,000 Personal Income Tax or $20,000,000 (Corporate Tax Payers) of qualified new or used manufacturing equipment purchased each year. Qualified machinery is machinery or parts used to: • Manufacture, process, fabricate, or otherwise assemble a product; • Produce renewable energy resources; or • Control air or water pollution.
Property Tax
Assembly Bill 1451 (AB 1451) The exclusion for active solar energy systems defines "solar energy system" to include spare parts, equipment used up to but not including energy transmission or use, and provides an exclusion up to 75 percent of full cash value for pipes and ducts used to carry energy derived from solar and other sources. An active solar energy system uses solar devices, which are thermally isolated from living space or any other area where the energy is used, to
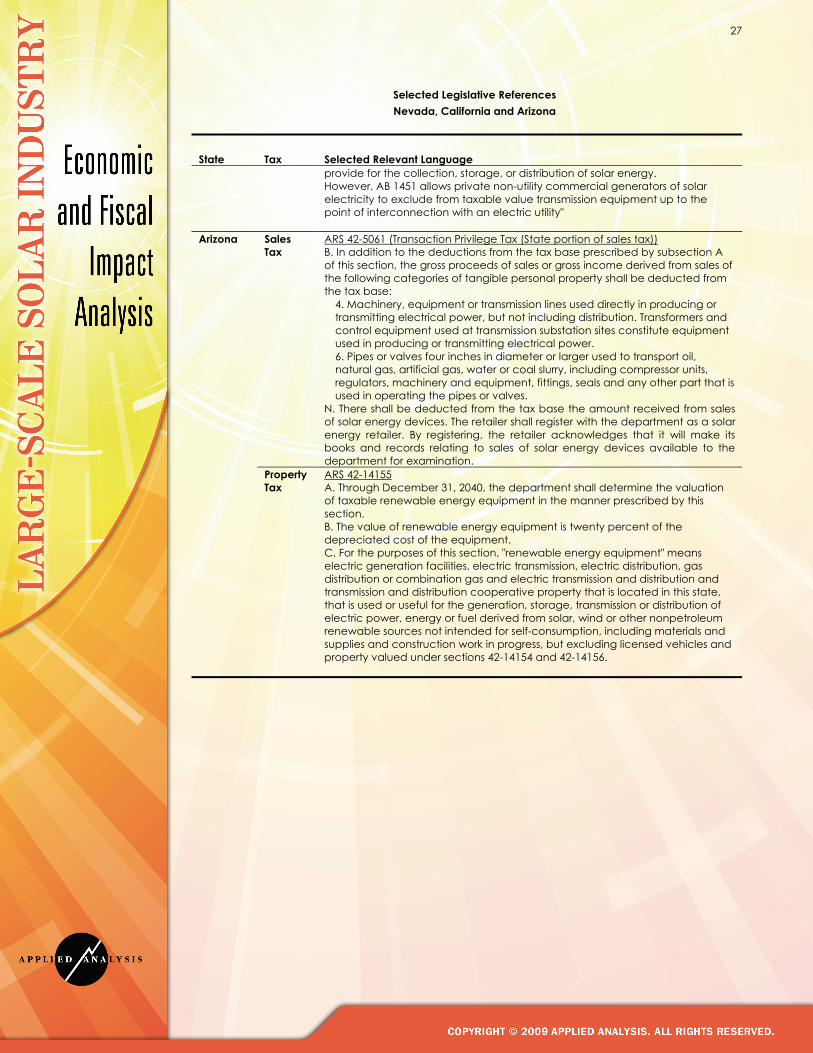
27
Selected Legislative References Nevada, California and Arizona
State Tax Selected Relevant Language
provide for the collection, storage, or distribution of solar energy. However, AB 1451 allows private non-utility commercial generators of solar electricity to exclude from taxable value transmission equipment up to the point of interconnection with an electric utility"
Arizona Sales Tax
ARS 42-5061 (Transaction Privilege Tax (State portion of sales tax)) B. In addition to the deductions from the tax base prescribed by subsection A of this section, the gross proceeds of sales or gross income derived from sales of the following categories of tangible personal property shall be deducted from the tax base:
4. Machinery, equipment or transmission lines used directly in producing or transmitting electrical power, but not including distribution. Transformers and control equipment used at transmission substation sites constitute equipment used in producing or transmitting electrical power. 6. Pipes or valves four inches in diameter or larger used to transport oil, natural gas, artificial gas, water or coal slurry, including compressor units, regulators, machinery and equipment, fittings, seals and any other part that is used in operating the pipes or valves.
N. There shall be deducted from the tax base the amount received from sales of solar energy devices. The retailer shall register with the department as a solar energy retailer. By registering, the retailer acknowledges that it will make its books and records relating to sales of solar energy devices available to the department for examination.
Property Tax
ARS 42-14155 A. Through December 31, 2040, the department shall determine the valuation of taxable renewable energy equipment in the manner prescribed by this section. B. The value of renewable energy equipment is twenty percent of the depreciated cost of the equipment. C. For the purposes of this section, "renewable energy equipment" means electric generation facilities, electric transmission, electric distribution, gas distribution or combination gas and electric transmission and distribution and transmission and distribution cooperative property that is located in this state, that is used or useful for the generation, storage, transmission or distribution of electric power, energy or fuel derived from solar, wind or other nonpetroleum renewable sources not intended for self-consumption, including materials and supplies and construction work in progress, but excluding licensed vehicles and property valued under sections 42-14154 and 42-14156.