large-scalestructure of the universe · pdf filelarge-scalestructure of the universe ......
TRANSCRIPT
lence (- 8 km S-l). It is entirely comparable to anormal H IIregion. Gentle stellar winds appear as the most likely explanation.
Full correlations between the various physical quantitiesextracted so far will still need a few months, but the trend isal ready clear: Filamentary structures, large turbulence and/orlarge expansion velocities, and high intensity sulfur lines areusually connected, a result that can be seen as blithelyencouraging or sorrowly banal, depending on one's mood.
Some abnormal cases yet could happen: N 12Q----a 20 pebubble-shows no expansion, a medium [S II]/Ha ratio andturbulence (- 20 km S-1 r.m.s.) and is clearly a youngsupernova remnant from radio data. N 48 E has the largest[S II]/Ha ratios in our sampie (> 1) and is absent fromcatalogues of non-thermal radio sourees.
Conclusion
Through the detailed two-dimensional data-both kinematical and physical-obtained in the course of our study, as weilas from the work of other groups, a better picture of the
processes at work is slowly emerging. There are some difficultpoints which, however, cast a gloom over the picture: Theorigin of the bubbles (SN explosions (Hodge 1967, P.A.S.P. 79,29), supersonic stellar winds (Gardis and Meaburn 1978,Astron. Astrophys. 68, 189), or even collision with anextragalactic H I cloud (Tenorio Tagle 1979, ESO preprintNo. 74)) is quite difficult to assess in each case. Moreover, therange of sizes goes from 20 pe diameter (N 100) to 110 pe(N 70), physical properties and diameters being not related.Some of the largest bubbles after analysis appear justheterogeneous projected structures. Especially lacking is acomprehensive survey with high angular resolution in radiowavelengths to reveal the thermal or non-thermal nature of theobjects.
The edge of the bubbles, where, because of its expansion,fresh interstellar matter is being presently compressed,appears as a likely site for generation of new stars andcould-according to the so-called "contagion hypothesis"-explain the large-scale chaotic appearance of spiral arms ingalaxies. Star formation however appears too erratic in theMagellanic Clouds, and we must turn to more distant, but moreregular spirals.
Large-Scale Structure of the UniverseGuido Chincarini, University of Oklahoma
One of the major tasks of astronomy is to find how matter isarranged and distributed in our Universe. On the largest scale ithas usually been assumed by cosmologists and by the majorityof astronomers that matter is spread uniformly throughout theUniverse. This picture is changing and astronomers are recognizing, by focussing more and more on the study of thedistribution of visible matter, that the distribution of galaxies isvery clumpy on a small scale (pairs and groups) as weil as on amuch larger scale (superclusters or filamentary structures). It isnot clear, in fact, whether any isolated structure exists.
We can preserve homogeneity, but only on a much largerscale than was previously recognized. An observer located in adifferent part of the Universe could not distinguish one locationfrom the other over scales larger than 50-100 Mpc. The maincharacteristics would remain the same. For an excellent reviewand discussion on this malter see Chapter 1 of "The LargeScale Structure of the Universe" , by Peebles (1980).
Evidence that the surface distribution of malter is clumpy hasbeen collected, even if somewhat disregarded until recently,since long ago. I refer to the catalogue by Messier of 1784, tothe surveys by the Herschels in the 18th and 19th centuries, tothe work by Shapley and Ames (1932, Harvard Obs. Ann. 88,No. 2) and to the later work by Shapley on the distribution ofgalaxies. Four more recent surveys are of particular importance: The survey of clusters of galaxies by Abell (1958,Astrophys. J. Suppl. 3, 211), the catalogue of galaxies andclusters of galaxies by Zwicky and coll. (1967), the counts ofgalaxies by Shane and Wirtanen (1967, Pub. Lick Obs. 22,part 1) and the counts in the Jagellonian field by Rudnicki et al.(1973, Acta Cosmologica 1, 7). The distribution of galaxies isclumpy also in depth. The first evidence came during theobservations of a non-cluster field near the Seyfert sextetlocated north of the Hereules cluster A 2151 (Chincarini andMartins, 1975, Astrophys. J.196, 335). However, thisevidencewas based on a sampie of ten galaxies only. The firstconfirma-
14
tion of this result was obtained by Tifft and Gregory (1976,Astrophys. J. 205, 696) from the study of a larger sampie.
During the seventies two lines of studies developed independently. On the one hand, various astronomers intensifiedstudies on the detailed three-dimensional distribution of galaxies in large regions of the sky; on the other hand, thanksespecially to Peebles (1974, Astrophys. J. Letters 189, L51), asophisticated autocorrelation analysis was developed andextensively applied to the interpretation of counts of galaxies1.
Previously Totsuji and Kihara (1969, Publ. Astron. Soc. Japan21,221) had derived, using an autocorrelation analysis and thecatalogue by Shane and Wirtanen, the same coefficients forthe autocorrelation function: g(r) = (rdr) 1.8 with a characteristiclength ro = 4.7 Mpc. Their work went unnoticed for some time.
Ideally we should have a catalogue, or a random subsampieof it, complete to a reasonably faint magnitude giving redshifts(possibly accurate to belter than 50 km/sec), magnitudes,morphological types and positions. Such a work has beenundertaken by Davis from the Center for Astrophysics inCambridge, Mass.
11 appears, today, that galaxies are not distributed at randomand that clusters of galaxies are not isolated systems. Thedistribution of pairs of various separation is described by theautocorrelation function. The function is a measure of thedeviation from a random distribution. It also measures thecharacteristic size of clumpiness and allows confrontation oftheories on the c1ustering of galaxies with observations.Studies on selected regions of the sky show the existence ofvery asymmetrie, often filamentary-like structures, separatedby regions which are void of galaxies.
Oort, Arp and de Ruiter (1981, Astron. Astrophys. 95, 7) giveevidence that quasars are part of superclusters and Burns and
1 Peebles' understanding of lhe cosmological significance of the analysis ofthe data became a guide to theoretical and observalional work and to its physicalinterpretation,

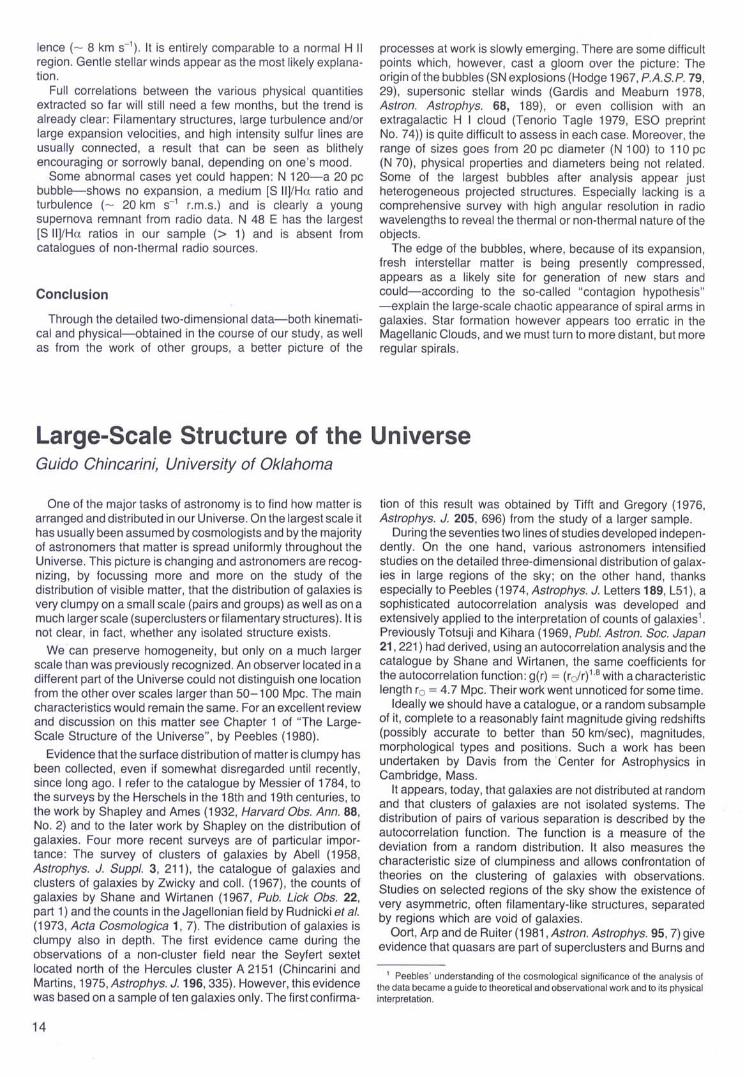
Owen (1979, Astron. J. 84, 1478) show that such largestructures can also be recognized from the distribution of radiosourees. (In Figure 1 is a reproduction of the largest onerecognized so far and connecting the Hereules complex to thegroup of clusters A2197 -A2199.)
Our Galaxy is part of such a structure: the Local Supercluster. The Local Supercluster was recognized by the work ofShapley and Ames (1932), extensively studied by de Vaucouleurs (1956, Vistas in Astronomy 2, 1584) and mostrecently by Yahil, Sandage and Tammann (1980, Astrophys. J.242, 448), after completion of the observations of the galaxiesof the Shapley-Ames catalogue. This structure may be tenuously connected to others, it is dominated by the Virgo clusterof galaxies towards which we may be falling (Aaranson et al.1979, Astrophys. J. 239, 12).
Following the lAU symposium in Tallin (1978), theoreticaland observational works are flourishing and our understandingdeepening and progressing very fast. It is exciting because itmakes us sense the satisfaction of mapping an as yet unknownworld, but what are the goals? Knowledge on how the distribution of visible matter is structured at the present cosmologicaltime will essentially ask for theories which are able to explainhow and when such structures and voids (density fluctuations)were formed in an expanding Universe. Observations havetherefore to define c1early the basic parameters of the distribution of visible matter. The irregular distribution of matter,furthermore, causes gravitational pulls at large distances sothat by studying the statistical distribution of gravitational forcesand masses we may be able to detect and understand peculiarmotions of galaxies and measure the mean mass density of theUniverse. We already have estimates of this parameter, theproblem is that in this case, and at this phase of the game, wehave too many determinations so that almost any valuebetween 0.01 and 1 has been derived. Certainly the understanding of the large-scale structure will also give insights in theprocesses of galaxy and cluster formation.
In 1977, after we read the work of Shapley, "A catalogue of7,889 external galaxies in Horologium and surrounding regions", M. Tarenghi and myself became interested in the studyof this region of the southern sky. Together with P. Crane, J.Materne and Helene Sol we are now working on it.
The Horologium region appears to be extremely complex. Aspointed out by Peebles, some of the irregularities in thedistribution are certainly introduced by vignetting at the edge ofthe photographie field, the majority of the structures are,however, real. Groups and clusters are packed together andembedded, probably, in a supercluster dispersed componentexpanding with the Hubble flow. Cluster-cluster interaction andcluster accretion may be at work so that it may become aserious problem to disentangle, and correctly interpret, theredshifts. On the other hand such complicated regions are richin information and need also to be accounted for from theoretical models.
We selected from Shapley's catalogue a random sampie ofabout 300 galaxies for wh ich we obtained redshifts using theobserving facilities of La Silla (ESO) and Cerro Tololo (I.A.O).In addition we observed all the galaxies brighter than m = 15.0and Manousoyannaki and H. Sol obtained at La Silla (ESO) Sand V photoelectric magnitudes for more than 100 galaxies.The majority of redshifts are in the range between 7,000 km/sec and 22,000 km/sec with groupings at about 8,000 km/sec,11,000 km/sec and 17,000 km/sec. The cluster CA 0340-538,part of one of the observed superclusters, is at a distance of17,400 km/sec; it is also an extended source of X-ray emission.
From the observations of simpler structures, Perseus-Piscesand Coma-A1367 (these seem to look like filaments almostperpendicular to the line of sight) it is possible to estimate that
8 (0)300
20_0 _-.---_400
7
oFig. 1: Redshift VS. declination for a subsampie ofgalaxies between thetwo clusters A 2197/99 and A 2151. The two groups of Abell clustersare represented by large oval outlines (From Aslrophys. J. Leiters.)
these superclusters are about 500 km/sec in depth,50-100 Mpc in the other dimension (since these structuresmay be interconnected such estimates may be of limitedsignificance), have a cotumn density of about 10-4 gr/cm2 and amass (for the part of the supercluster wh ich has beenobserved) of about 1016 solar masses. The dispersed component is not very massive and its mass is of the order ofmagnitude of the mass of a cluster of galaxies (Chincarini 1981,preprint). Sy interpreting the Lya absorption in quasars asoriginating in a supercluster gaseous component left overduring the process of galaxy formation, Oort (1981, Astron.Astrophys. 94, 359) estimates agas column density of about6.8 10-4 gr/cm2.
Further information will be added from the 21-cm survey thatGiovanelli, Haynes and the author have been carrying out atthe Arecibo Observatory since 1977.
These data will make possible the determination of thehydrogen and total masses of the supercluster galaxies. It ispossible, therefore, not only to measure the hydrogen deficiency as a function of the location of galaxies in a supercluster(Giovanelli, Chincarini, Haynes, 1981, Astrophys. J. in press),but to determine the distribution of galaxy masses in thesupercluster and whether the masses of the single galaxies arecorrelated with the density of the supercluster. We are progressing very fast towards the understanding of the distributionof visible matter in the Universe; even faster progressing arethe theory and the understanding of the evolution of thesestructures thanks to the work of Peebles, Gott, Zeldovich,Doroskhevic, Novikov and many others. All these new developments, data and interests are bound to generate in the comingyears a deeper enlightening understanding.
15