larmor frequency - aapm: the american association of ... · the return of the frequency sweep:...
TRANSCRIPT

1
MagneticResonanceSpectroscopy of Breast andProstrate Cancer
MichaelA. Jacobs1,2, Peter B. Barker1, Katarzyna J. Macura1
1The RussellH. Morgan Department of Radiology and Radiological Science
and 2SidneyKimmel OncologyDepartment,
The Johns Hopkins University School of Medicine, Baltimore, MD
Objectives
� Brief outline of Magnetic ResonanceImaging(MRI)
� DifferencebetweenMRI and Magnetic ResonanceSpectroscopy
� Magnetic ResonanceSpectroscopy (MRS) Sequences
� MRSin Breast
� MRSin Prostrate
� FutureDirections
Background MRI
� Recall that the magnetization vector M isdescribed by the Bloch equation:
bazyx M
ffM
T
kMM
T
MiMBM
dt
dM
λγ −+
−−
+−×=
1
0
2
)(
M b = longitudinal magnetization per gram of brain tissue;M a = longitudinal magnetization per ml of arterial blood
T1app= relaxation of brain magnetization; f = brain blood flow (ml/g/sec);λλλλ = brain blood partiti on coeffi cient (0.9 ml/g)
Larmor Frequency
� The Larmor frequency is defined as:
Whereω= Larmorfrequency, γ=gyromagnetic constant (42.6Mhz/T),andB is theMagnetic Field
πγω 2/00 B=

2
Background MRI
� Localiza tion of MR signal
» Fields
–Bo Main Magnetic Field
–B1 Radiof requency Field
» Gradients
–x,y,z
� Gradient Vector Definiti on :
Background MRI
→→→→
∂∂=
∂∂+
∂∂= Z
z
BY
y
BX
x
BG zzz
→→→→++= zGyGxGG zyx≡
�Gx, Gy, and Gz are generated by three different coils.
�Gradients are measured in Tesla per meter (T/m) or Gaussper cm (G/cm), where 0.01mT/m=1G/cm
�Typical values range from 20 up to 80mT/m
� Themagneticfield is linearly dependenton thelocationwithinthemagnet
Background MRI
→→→⊗+= ii rGBB 0
•WhereBi = magnetic field at ri and G is thetotal gradientvector
→→→⊗+= xx rGBB 0
�For example, in thex-direction
Larmor Frequency
� The Larmor frequency is defined as:
Whereω= Larmor frequency, γ=gyromagneticconstant(42.6Mhz/T), andG is thetotal gradient vector
→→⊗+= xx rGγωω 0
�For example,in the x-direction
ii rG⊗+=→
γωω 0
πγω 2/00 B=�The variation in Larmor frequency is defined as:

3
0 10 20 30 40 50 601
0
1Wave a, FID
Time (seconds)
Aa
Aa−
Wai
51.10 ti
0 1 2 3 4 50
1
2
3Frequency Spectrumof Wavea
Frequency(Hz)4.980 frequencyj
*
)cos( 200
T
t
evvSS
−
−=
Energy
B0
00 2BhhE )(
πγν ==∆
Spin 1/2
Spin -1/2
0
z
x y
z
x y
z
x y
z
x y
z
x y
90° 180°
SS
PhaseEncode
FreqEncode
RF Pulse
RF Signal
1stcycle
Last cycle
90180
Spin Echo
TE (Echo Time)TR (Repetition Time)
Image PixelTissue Voxel•Proton Density•Longitudinal Relaxation (T1)•Transverse Relaxation (T2)
Brightness
•RF Pulse•RF Signal
� Chemical Shift» Nuclei are“shielded” from themagneticfield theelectrons.This
shielding is called chemical shift anddefinedas
Proton Spectroscopy
)1(0 ii BB σ−=→
•Where Bi = magnetic field, σi = shielding (dependson thechemical environment)
)1(2 0 σπγω −= B
�Thus,resonancecondition is
� Chemical shift measurements» Parts per Million (ppm)
» Independent of magnetic field strength» (Increases when measured in Hz)
Proton Spectroscopy
refrefii ωωωδ /)( −=
Proton Spectroscopy� Example:
» Water is 4.7ppm and Lipids (Fat) is 1.3ppm» At 1.5T, what is the chemical shift?» (4.7-1.3) =3.4
refrefii ωωωδ /)( −=)()8.63(4.3*4.3 refiref Mhzppmppm ωωω −==
hzhzrefi 220217)( ≈=− ωω
» At 3T, ~440 hz» Implies greater spectral resolution

4
� J constant» Measured in Hz» Independent of magnetic field strength
Proton Spectroscopy� Spin-Spin Coupling (J or scalar coupling )
» Molecular interaction between adjacent protons» Causes additional splitting of the spectra» Need high magnetic field
Citrat e15.5Hz
15.5Hz
In Vivo Ex-VivoMulkernRV, et al, Citratesignal enhancementwith a homonuclearJ-refocusingmodification to double-echoPRESSsequences.MagnResonMed. 1996
Overview
SpectrumTissue Voxel•Metabolites•Longitudinal Relaxation (T1/TR)•Transverse Relaxation (T2-TE)
SpectralResolution
•RF Pulse•FID
Signal
Gx
Gz
Gy
PPM 5.0 4.0 3.0 2.0 1.0
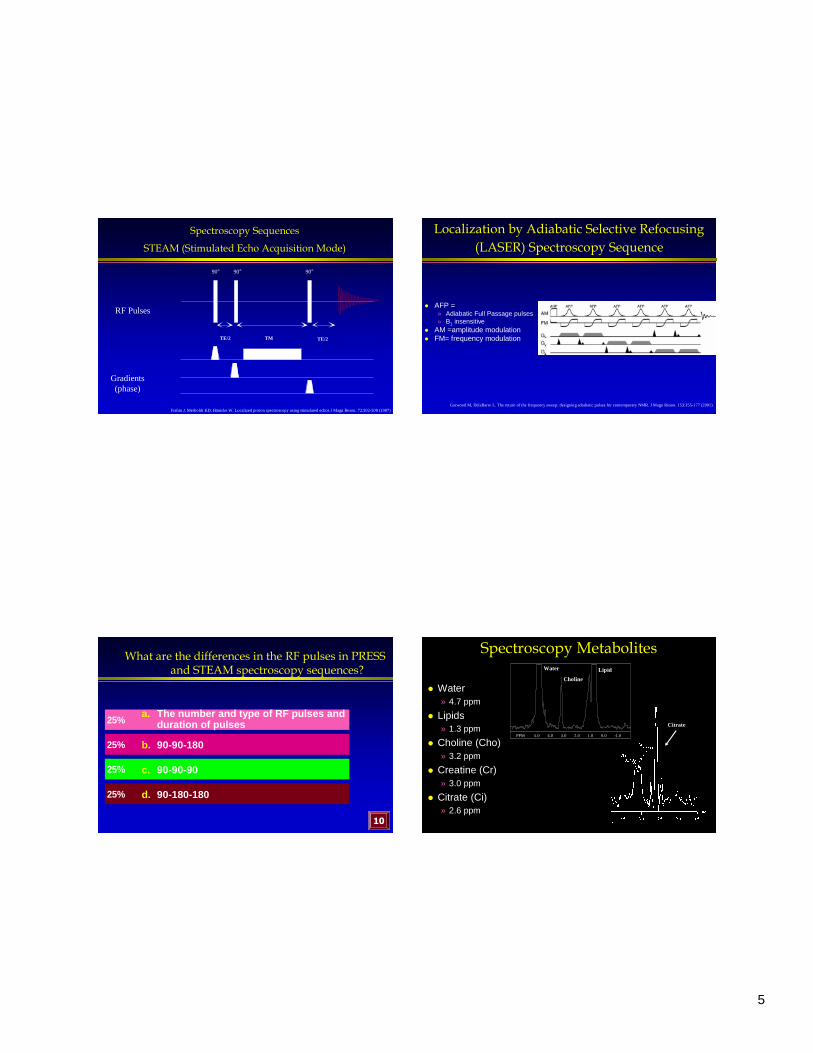
Spectroscopy Sequences
� PRESS» Bottomley PA. Spatial localization in NMR spectroscopy in vivo Ann N Y Acad Sci. 508:333-348 (1987)
� STEAM» Frahm J, Merboldt KD, Hänicke W. Localized proton spectroscopy using stimulated echos J Magn Reson. 72:502-508 (1987)
� ISIS» Ordidge RJ, Connelly A, Lohman JA. Image-selected in0vivo spectroscopy (ISIS) A new technique for spatially selective NMR
spectroscopy. Spin echo imaging of multiple chemical shifts. J Magn Reson. 66:283-294 (1986)
� LASER» Garwood M, DelaBarre L. The return of the frequency sweep: designing adiabatic pulses for contemporary NMR. J Magn Reson.
153:155-177 (2001)
» Slotboom J, Mehlkopf AF, Bovée WM. A single shot localization pulse sequene sutied for coils with inhomogeneous RF fieldsusing adiabatic pulses. J Magn Reson. 95:396-404 (1991)
Spectroscopy SequencePRESS (Point Resolved Spectroscopy)
180°°°° 180 °°°°
TE/4 TE/2 TE/4
90°°°°
RF Pulses
Gradients(phase)
TE
GX
Gy
Gz
Bottomley PA. Spatiallocalization in NMR spectroscopyin vivo Ann N Y AcadSci. 508:333-348(1987)
5
Spectroscopy Sequences
STEAM (Stimulated Echo Acquisition Mode)
FrahmJ, MerboldtKD, Hänicke W. Localizedprotonspectroscopyusingstimulated echosJ Magn Reson. 72:502-508(1987)
TE/2 TM TE/2
RF Pulses
Gradients(phase)
90° 90° 90°
Localization by Adiabatic Selective Refocusing (LASER) Spectroscopy Sequence
� AFP =» Adiabatic Full Passage pulses» B1 insensitive
� AM =amplitude modulation� FM= frequency modulation
GarwoodM, DelaBarreL. Thereturn of thefrequencysweep:designingadiabaticpulses for contemporary NMR. J Magn Reson. 153:155-177 (2001)
What are the differences in the RF pulses in PRESS and STEAM spectroscopy sequences?
25%
25%
25%
25%
10
a. The number and type of RF puls es anddurat ion of pulses
b. 90-90-180
c. 90-90-90
d. 90-180-180
Spectroscopy Metabolites
� Water» 4.7 ppm
� Lipids» 1.3 ppm
� Choline (Cho)» 3.2 ppm
� Creatine (Cr)» 3.0 ppm
� Citrate (Ci)» 2.6 ppm
PPM 5.0 4.0 3.0 2.0 1.0 0.0 -1.0
Water
Choline
Lipid
Citr ate

6
Spectroscopy Metabolites� Choline (Cho)
» 3.2 ppm» Membrane turn over and breakdown» Increased in cancer» Decreased in Stroke
� Creatine (Cr and PCr)» 3.0 ppm» 3.94 ppm (if >3T and good water suppression)» Energy buffer
� Citrate (Ci)» 2.6 ppm» Intermediate compound of the citrate acid cycle» It produced by a unique testosterone-induced pathway
Gillies RJandMorseD Annu. Rev.Biomed.Eng.2005.7:287–326
Background-Breast Cancer
• Breastcanceris themostfrequently diagnosedcancerin women» Breastcancer is thesecondleadingcauseof death
• Currentdetectionmethods include:» Clinical breast exam» Mammography» Ultrasound
• MagneticResonanceImaging (MRI) providesadditionalinformationin patients with occultbreastcanceror equivocalfindingsonthe other commondetectionmethods.
Lehman CD, et al, ACRIN Trial 6667InvestigatorsGroup MRI evaluationof thecontralateral breastin womenwith recently diagnosed breast
cancerN Engl J Med. 2007Mar 29;356(13):1295-303.
• By usingMRS asanadjunct, thechemicalandmolecularenvironmentof a breasttumor canbeexamined.
Data Acquisition: MRS
� T1 FSPGR (TR/TE = 250/4.2)
� Fat Suppres sed T2 FSE (TR/TE =5700/102)
� 3D FSPGR, pre/pos t 0.1mM/kg Gd
» 3.5 min , (TR/TE =20/4) (2 x 0.4 x 1.1mm3)
� Spectro scopy
» PRESS CSI; sin gle sl ice 10mm, TR/TE =2000/272 ms
» Manual Shimming on lesio n
» Lipid Suppres sion usin g STIR pulses (TI = 171 ms)
Single Voxel Applications
180 180
TE/4 TE/2 TE/4
90
RF
Gradients
PRESS
� Spectroscop y (1.5T)
» PRESS, TR/TE =2000/272 ms, 256-512 points ,
» Auto or Manual Shimm ing on lesion
» Lip id Suppression using STIR pulses (TI = 171 ms)
» After lesion localiza tion

7
Courtesy of M. Garwood and P. Bolan, University of Minnesota
PPM 5.0 4.0 3.0 2.0 1.0 0.0 -1.0
Water
Li pid
PPM 5.0 4.0 3.0 2.0 1.0 0.0 -1.0
Water
Choline
LipidA
AA
B
B
B
Slice 2 - Lipid Slice 2 -Choline
T1WI T2WIPre Post
DCE
LipidWater Choline
PPM 5.0 4.0 3.0 2.0 1.0
Water Choli ne LipidPost Contrast
A.
C.
Lesion
x50
PPM 5.0 4.0 3.0 2.0 1.0 PPM 5.0 4.0 3.0 2.0 1.0
B.
D.

8
PPM 5.0 4.0 3.0 2.0 1.0 0.0
Lipi dWater
A. D.
B.
C.
Water Choli ne Lipid
E.
Lesion
Normal
HaddadinIS, McIntoshA, Meisamy S, CorumC, SnyderAL, PowellNJ, Nelson MT, YeeD, GarwoodM, Bolan PJ. Metabolite quantification and high-field MRSin breast cancer.NMR Biomed.2007Oct 24.
Malignant
What are the major metabolites and parts per million (ppm) in cancerous breast tissue at 1.5T or 3T and
long echo times
10
33%
33%
33% a. Taurine (3.4ppm)b. Water (4.7ppm), lipid (1.2ppm) and choline
(3.2ppm)c. Water (4.7ppm), lipid (1.2ppm) and myo-
inositol 3.6ppm
What are the possible lesions/conditions that might lead to increased metabolites (ie, choline, etc) in
benign conditions.
25%
25%
25%
25%
10
a. Fibr ocystic changesb. Lact ating women, fibroadenoma , BPH, and
high membrane turnov er
c. Invasive ductal carcinoma
d. d. BPH

9
Why Prostrate MRS
• Currentdetectionmethodsinclude:» Digital Rectal Examand/or clinical symptoms» Prostate-specific antigen(PSA),» Transrectalultrasonography(TRUS)with biopsy» MRI/MRSI
• MagneticResonance Imaging(MRI) andSpectroscopy(MRSI) isbeingusedmorefrequentlyfor diagnosingandmonitoring prostatecancerin men
• ProstateMRSI providesadditionalinformationin patientswith occultprostatecancer or equivocal findingson theothercommondetectionmethods.
Kurhanewicz J, Vigneron DB, Hricak H, Carroll P,NarayanP, NelsonS. Three-dimensionalH-1 MR spectroscopicimaging of thein situ humanprostate with high resolution (0.24-0.7-cm3)
spatial resolution. Radiology 1996;198:795-805.
Background: MRI/MRS Data Acquisition
� Pelvic Coil:
» Axial T1-weighted images (TR/TE = 600-700/-12 ms)
» Axial T2-weighted (TR/TE = 4000-6000/90-120 ms)
» Diffusion weighted EPI (TR/TE = 10,000/99 msec, b=0,500,1000)
» T1-weighted fast low angle contrast-enhanced GRE (TR/TE = 50/4.4 ms).
� Endorectal coil
» T2 FSE; Axial and Coronal (TR/TE = 4000-6000/90-120 ms)
» 3D MRSI (TR/TE = 1000 ms; 144 ms; phase encoding steps = 16 x 8 x 8;FOV = 110 x 55 x 55 mm3)
TT22WI Criteria for Prostrate CancerWI Criteria for Prostrate Cancer
On T2-weighted image a discrete, focal nodule-like dark signal.
MRSI CriteriaMRSI CriteriaNormal Spectrum: Ch+Cr/Ci = 0.57
Cancer Spectrum:Ch+Cr/Ci = 1.13↑↑↑↑↑↑↑↑ choline (Ch) and choline (Ch) and ↓↓↓↓↓↓↓↓ citrate (citrate (CiCi))

10
Localizers MRSI localizers and protocol
• Full coverage with 3DCSI ( VOI : 45 mm x 45 mm x 45 mm)• TR = 750 ms• TE = 145 ms• 8 averages• 8 saturation slabs•Spectral water and fat suppression within VOI• Spatial resolution 5 mm x 5 mm x 5 mm•TA = 12 minutes
1.5T 1.5T

11
Cho
Cr Citrate
Contralateral Ipsilateral
1.5T
Spectral MapsSlice 6
Slice 7
3T
Spectral Map : Slice 9
Ci
Crcho
Ci
Crcho
Ci
Crcho
3T 3T

12
3T
What are the major metabolites in cancerous prostrate tissue at 1.5T or 3T and long
echo times
33%
33%
33%
10
a. Taurineb. Water (4.7ppm), lipid (1.2ppm) , choli ne (3.2ppm)
and NAA (2.2ppm)c. Water (4.7ppm), lipid (1.2ppm) , choli ne (3.2ppm)
creatine (3.0ppm ) , and ci trate (2.6ppm)
Why is spectroscopy used in breast or prostrate imaging?
25%
25%
25%
25%
10
a. Diagno sis of the lesi on
b. Classification of the lesionc. Ad junct for diagno sis and research for
detecting abnormal metabolitesd. Detectio n of hypertrophy
Future Directions
• 3D MRS
• SENSEMRS
• High Field (7T)• Brain• Breast

13
3D Spectroscopy
� 3D Spectroscop y
» 3D PRESS CSI; 8 sli ces, 10mm, TR/TE =1010/280 ms
» 1500 Hz bandwidth, 1024 data poin ts, acquisition
window 682 msec (echo position 20%),
» CHESS water and lipid suppre ssion (3 pu lses, flip
angles 161º, 83º, 89º),
» one signal average(NEX 1), scan time = 12 min 6 secs .
H20 Cho
LipA
B
PPM 4.0 3.0 2.0 1.0
H20
ChoLip
A
B
3D MRSI of BreastPhantom
H20 Cho
Lip
PPM4.0 3.0 2.0 1.0
A
B•A
•B
T1 weightedimages
3D MRSI
a) T1WI b) Water
d) Choli nec) Lipid s

14
PPM 5.0 4.0 3.0 2.0 1.0
PPM 5.0 4.0 3.0 2.0 1.0
Water Cho Lipidsa) b) SENSE MRSI
Raw MRSI Data,N Channels
Spatial Filter,2D FFT (X,Y)
B1 Sensitivity ProfilesDegrade to MRSI Resolution
(i.e. 32x24 or 32x16)
Body Coil +Phased Array Images
Phase and Sensitivity data best obtained by B1 field mapping using MRI
s(t,x, y) =exp(−i arg(an(x, y)))×bn(t, x, y)
n=1
N∑
an(x, y)n=1
N∑
SENSE MRSIMRSI signal coil 1
b1 = a11x1 + a12x2MRSI signal coil 2
b2 = a21x1 + a22x2
[anm - sensitivity of nth coil at point m]
b = A.x
x = A-1.bFull FOV
1/2 FOVCoil 1 Coil 2
x1 x2
SENSE MRSI
B1 MapsRF coil sensitivity

15
SENSE-MRSI 3.0TT1 MRI Cho
NAACr
PPM 4.0 3.0 2.0 1.0
Cho
NAA
Cr
Deep
Superficial
Lipid
SNR 49:1 (49% improvement)
SNR 59:1 (79% improvement)
Scan Time 10 minutes: SNR improvements compared to volume coil @ 1.5T PB Barker PPM4 3 2 1
ChoCr
NAA
LacCr
mI GlumI
Glu
7T “Braino” PhantomCho
Cr
Glx
Lac
mI
NAAPB Barker
PPM 4 3 2 1
Cho Cr
NAA
*Cr
NAAG
GlxmI Glx
2. Thalamus/CSF
4. Splenium Corpus Callosum
12
34
1. Internal Capsule/Striatum
3. Periventricular White Matter
PPM 4 3 2 1
7T MRSI Human Brain - Selected Spectra
PB Barker
1
2
3
Cho Cr Glx mI NAA
7T MRSI: Metabolic Images
PB Barker

16
7T Breast Normal subjects
0246ppm
tCho
[tCho] = 0.30 ± 0.14 mmol/kg1.65 mL voxelTE Ave 40-193ms, 128 incr.water LW ~20Hz
High-res fat-sat 3D FLASH0.5 x 0.5 x 2.2 mm resolution Overall
• 6 voxels measured in 5 normal subjects• tCho in 5/6 normal voxels; taurine in 2/6• mean [tCho] = 0.29 mmol/kg
Courtesy of P. Bolan and M. Garwood, University of Minnesota
Conclusions
� MRS of breast and prostate has tremendous potential
� Imaging at high spatial resolution and high magneticfield strength ex-vivo improves detail of morphologyand MRS results
� These MRS methods will be useful for therapeuticmonitoring
� Future trends will lead to faster imaging time andimproved spectral resolution
Acknowledgments
Peter BarkerZaver Bhujwal laDavid BluemkePaul Bottomle y
Ihab KamelJonathan S. Lewin
Kasia Macur aRonald Ouwer kerk
Donald PeckVered StearnsRichard WahlAntonio WolffNouha SalibiPatrick Bolan
Michael GarwoodNathan Yanasak
NCI Grant support:1R01CA100184 ,P50 CA103175, ARRS Scholarship