las vegas real estate market reports | october 2014
DESCRIPTION
ÂTRANSCRIPT

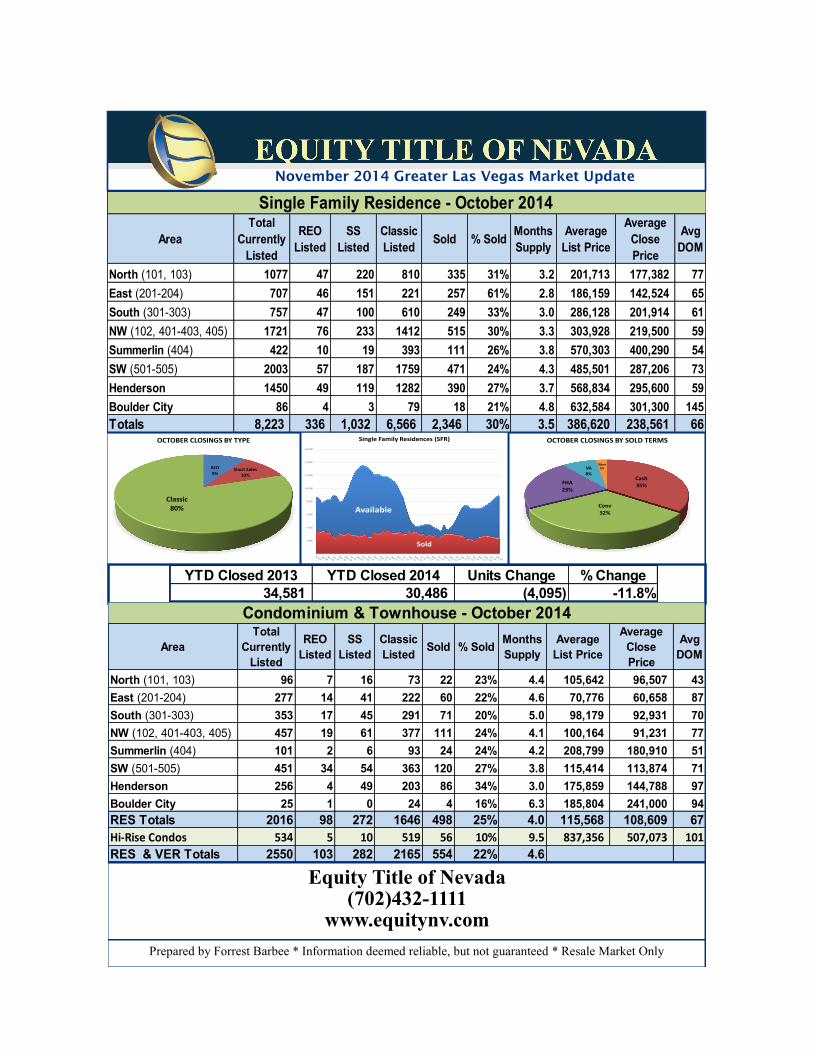
Prepared by Forrest Barbee * Information deemed reliable, but not guaranteed * Resale Market Only
Las Vegas Market Update - November 2014
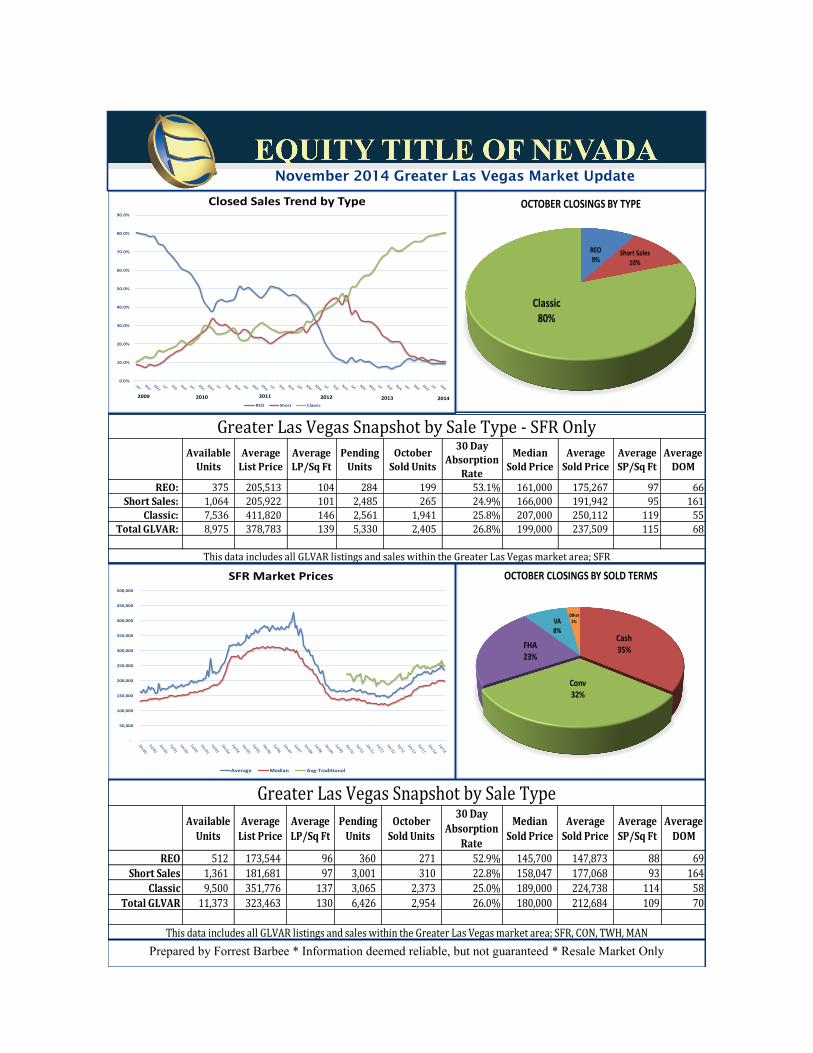
REO9%
Short Sales10%
Classic80%
OCTOBER CLOSINGS BY TYPE

Prepared by Forrest Barbee * Information deemed reliable, but not guaranteed * Resale Market Only
Las Vegas Market Update - November 2014
Cash35%
Conv32%
FHA23%
VA8%
Other3%
OCTOBER CLOSINGS BY SOLD TERMS

Prepared by Forrest Barbee * Information deemed reliable, but not guaranteed * Resale Market Only
Las Vegas Market Update - November 2014
0.0%
10.0%
20.0%
30.0%
40.0%
50.0%
60.0%
70.0%
80.0%
90.0%
Closed Sales Trend by Type
REO Short Classic
2009 20112010 2012 2013 2014
Prepared by Forrest Barbee * Information deemed reliable, but not guaranteed * Resale Market Only
Las Vegas Market Update - November 2014
-
50,000
100,000
150,000
200,000
250,000
300,000
350,000
400,000
450,000
500,000
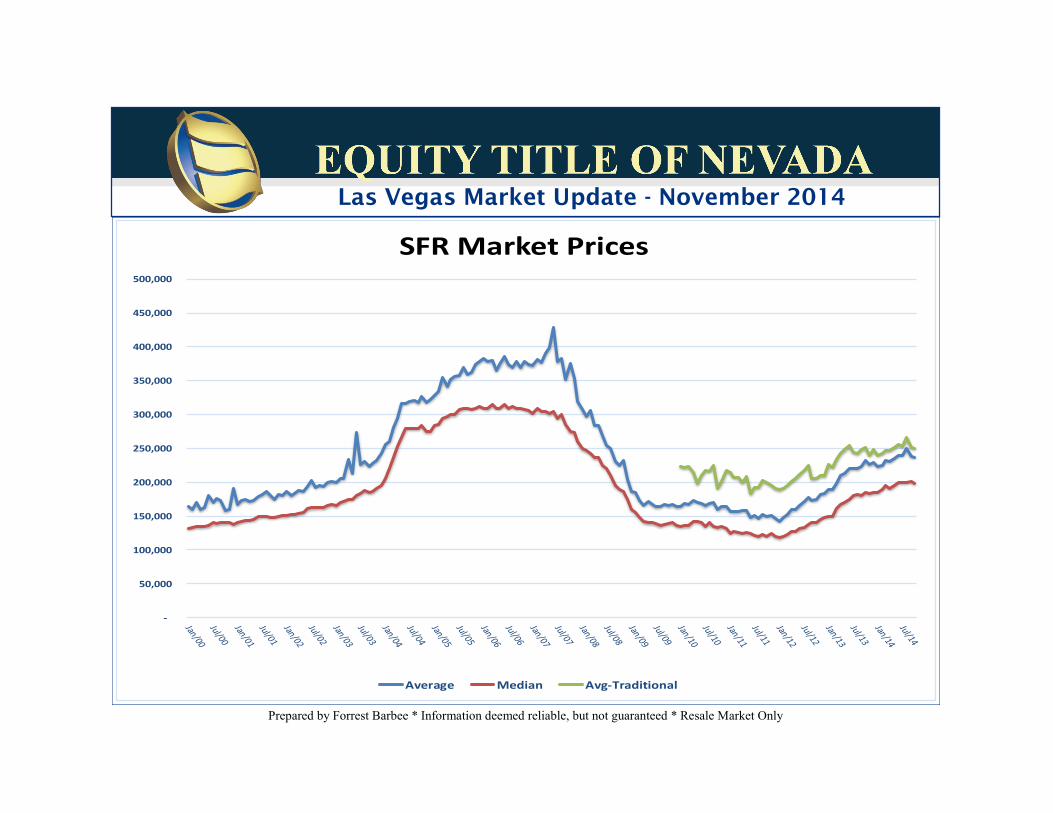
SFR Market Prices
Average Median Avg-Traditional
Prepared by Forrest Barbee * Information deemed reliable, but not guaranteed * Resale Market Only
Las Vegas Market Update - November 2014
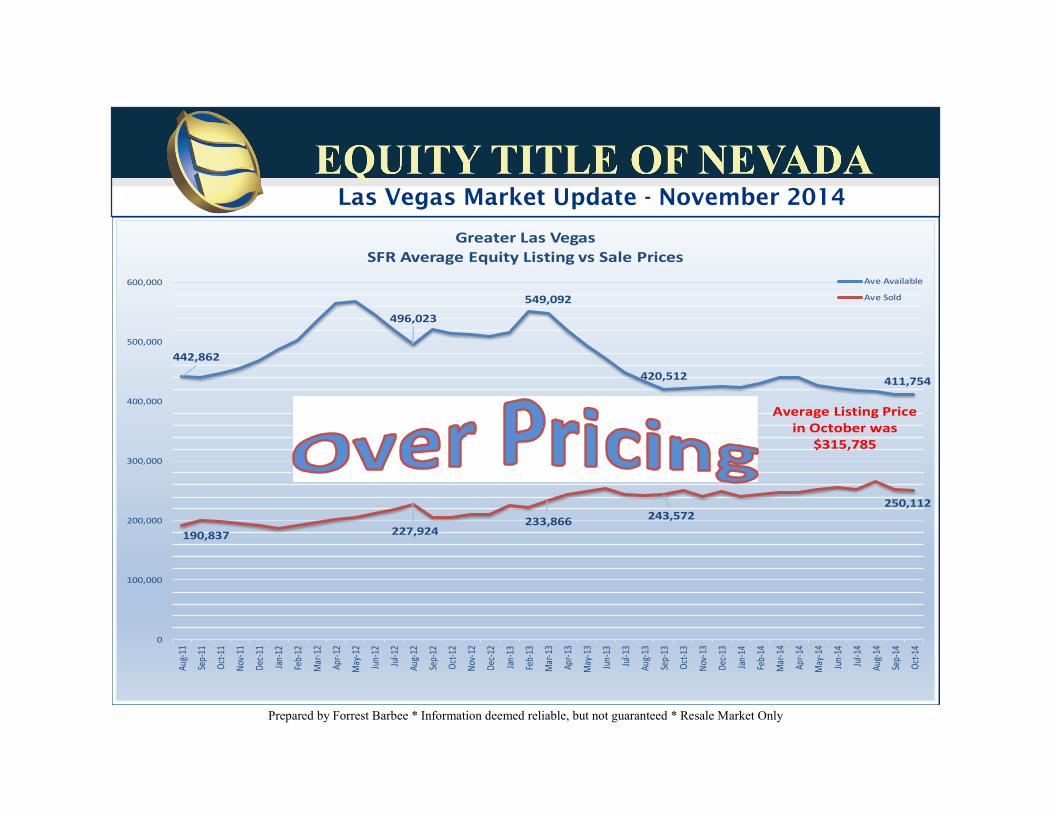
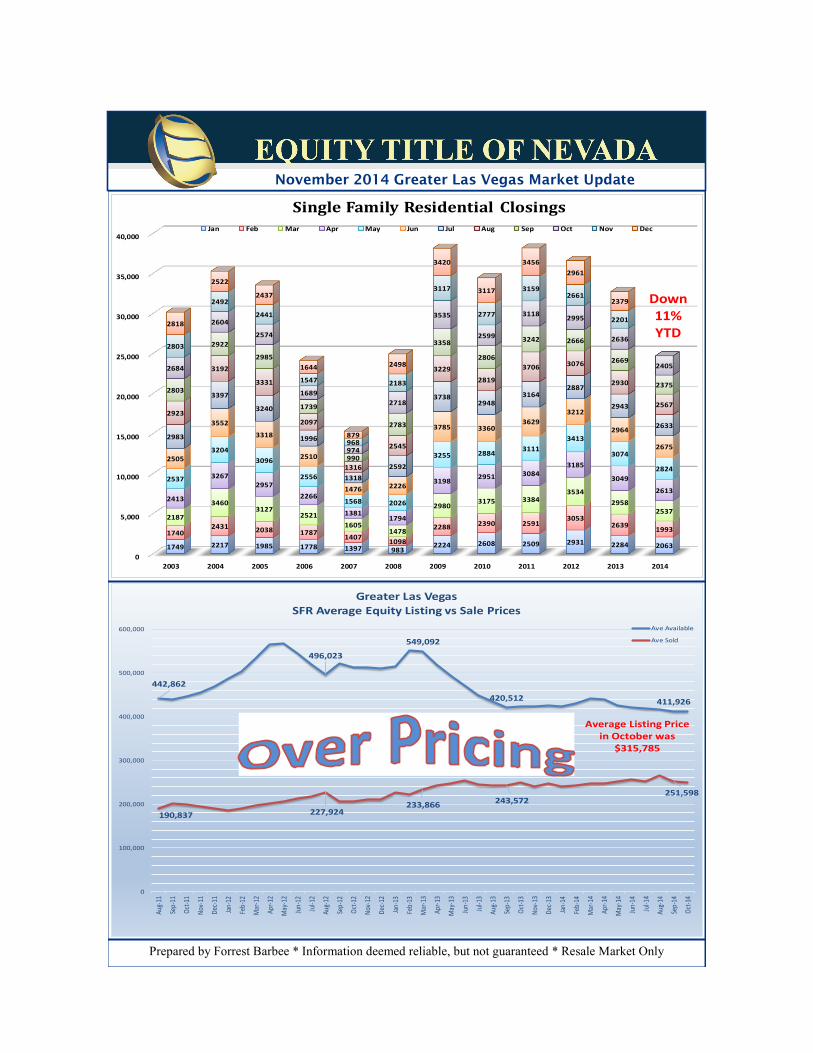
442,862
496,023
549,092
420,512 411,754
190,837 227,924 233,866 243,572
250,112
0
100,000
200,000
300,000
400,000
500,000
600,000
Aug-1
1
Sep-
11
Oct-1
1
Nov-1
1
Dec-1
1
Jan-12
Feb-
12
Mar
-12
Apr-1
2
May
-12
Jun-
12
Jul-1
2
Aug-1
2
Sep-
12
Oct-1
2
Nov-1
2
Dec-1
2
Jan-13
Feb-
13
Mar
-13
Apr-1
3
May
-13
Jun-
13
Jul-1
3
Aug-1
3
Sep-
13
Oct-1
3
Nov-1
3
Dec-1
3
Jan-14
Feb-
14
Mar
-14
Apr-1
4
May
-14
Jun-
14
Jul-1
4
Aug-1
4
Sep-
14
Oct-1
4
Greater Las VegasSFR Average Equity Listing vs Sale Prices
Ave Available
Ave Sold
Average Listing Pricein October was
$315,785
Prepared by Forrest Barbee * Information deemed reliable, but not guaranteed * Resale Market Only
Las Vegas Market Update - November 2014
0
5,000
10,000
15,000
20,000
25,000
30,000
35,000
40,000
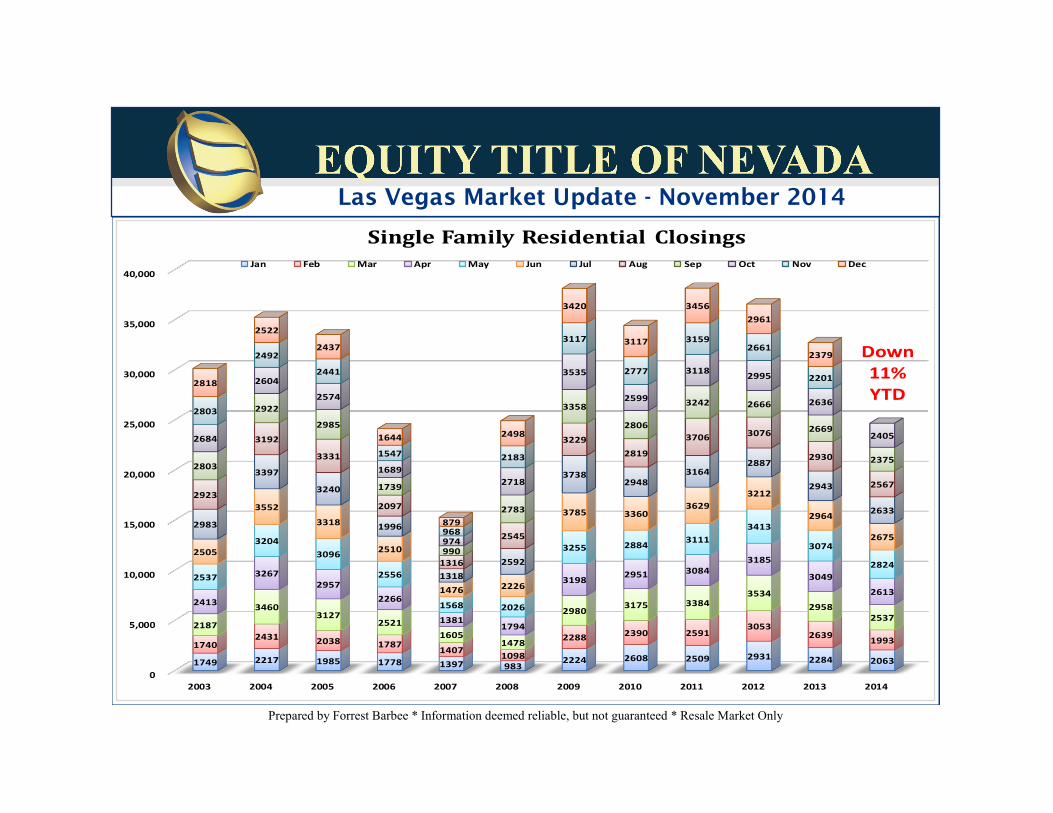
2003 2004 2005 2006 2007 2008 2009 2010 2011 2012 2013 2014
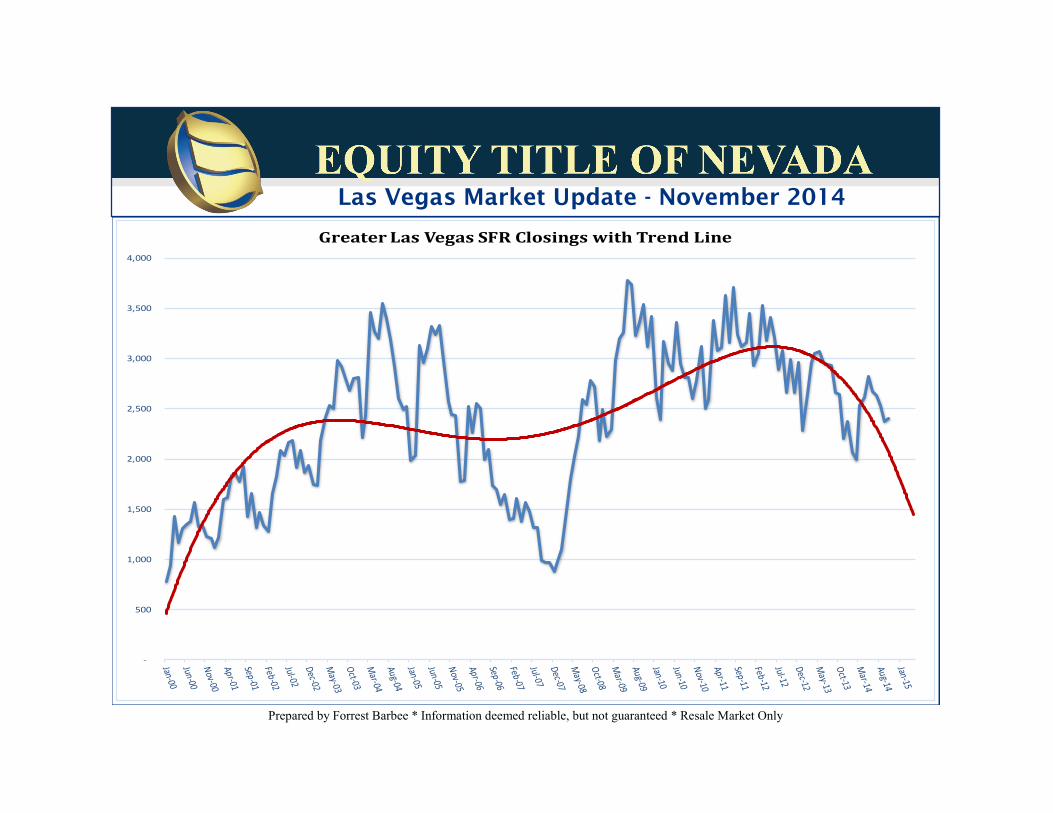
1749 2217 1985 1778 1397 983 2224 2608 2509 2931 2284 2063
1740 2431 2038 1787 1407 1098
2288 2390 2591 3053
2639 1993
2187
3460 3127
2521 1605
1478
2980 3175 3384 3534
2958 2537
2413
3267 2957
2266
1381 1794
3198 2951 3084 3185
3049
2613 2537
3204 3096
2556
1568 2026
3255 2884 3111 3413
3074
2824 2505
3552
3318
2510
1476 2226
3785 3360 3629
3212
2964
2675 2983
3397
3240
1996
1318 2592
3738 2948
3164 2887
2943
2633
2923
3192
3331
2097
1316
2545
3229 2819
3706 3076
2930
2567
2803
2922
2985
1739
990
2783
3358
2806
3242 2666
2669
2375
2684
2604
2574
1689
974
2718
3535
2599
3118 2995
2636
2405
2803
2492
2441
1547
968
2183
3117
2777
3159 2661
2201 2818
2522
2437
1644
879
2498
3420
3117
3456 2961
2379
Single Family Residential ClosingsJan Feb Mar Apr May Jun Jul Aug Sep Oct Nov Dec
Down11%YTD
Prepared by Forrest Barbee * Information deemed reliable, but not guaranteed * Resale Market Only
Las Vegas Market Update - November 2014
-
500
1,000
1,500
2,000
2,500
3,000
3,500
4,000
Greater Las Vegas SFR Closings with Trend Line
Prepared by Forrest Barbee * Information deemed reliable, but not guaranteed * Resale Market Only
Las Vegas Market Update - November 2014
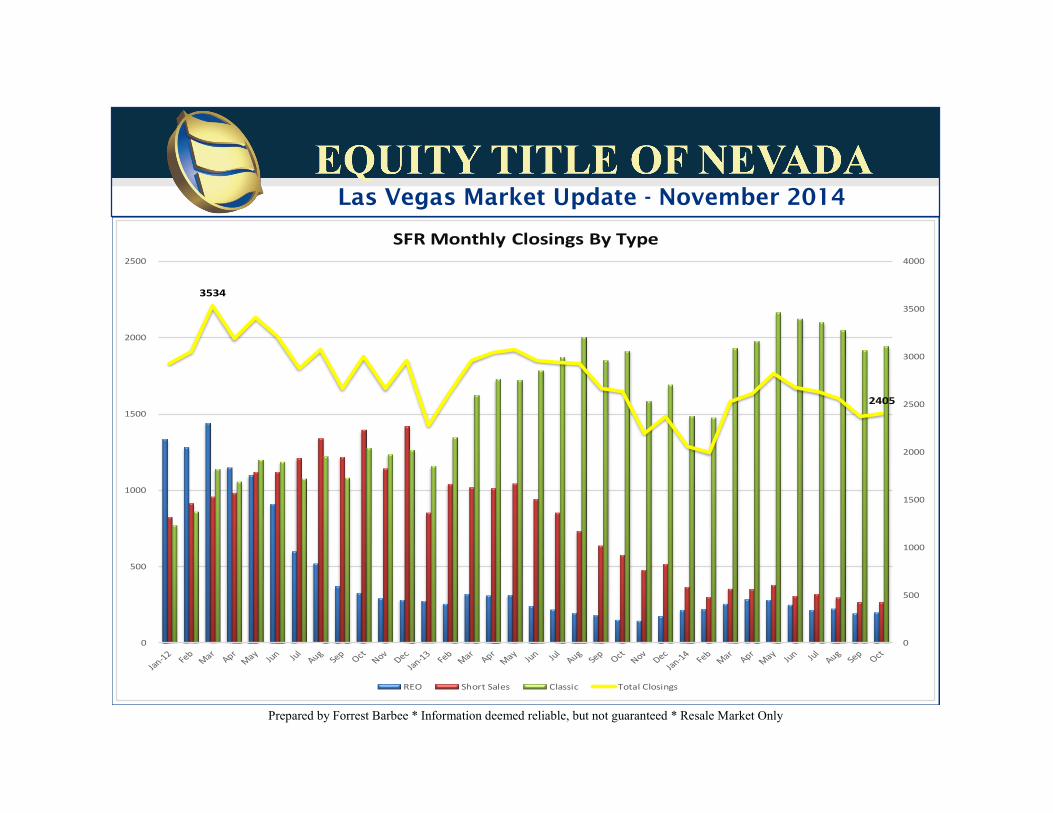
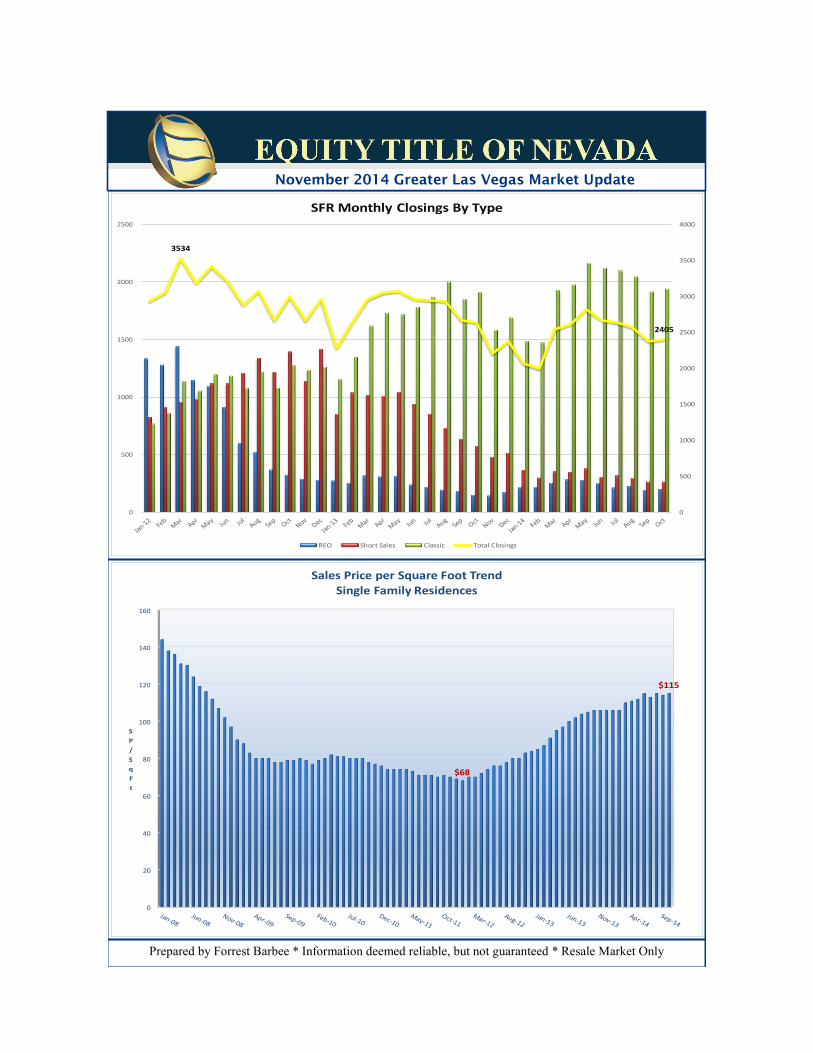
3534
2405
0
500
1000
1500
2000
2500
3000
3500
4000
0
500
1000
1500
2000
2500
SFR Monthly Closings By Type
REO Short Sales Classic Total Closings
Prepared by Forrest Barbee * Information deemed reliable, but not guaranteed * Resale Market Only
Las Vegas Market Update - November 2014
0
20
40
60
80
100
120
140
160
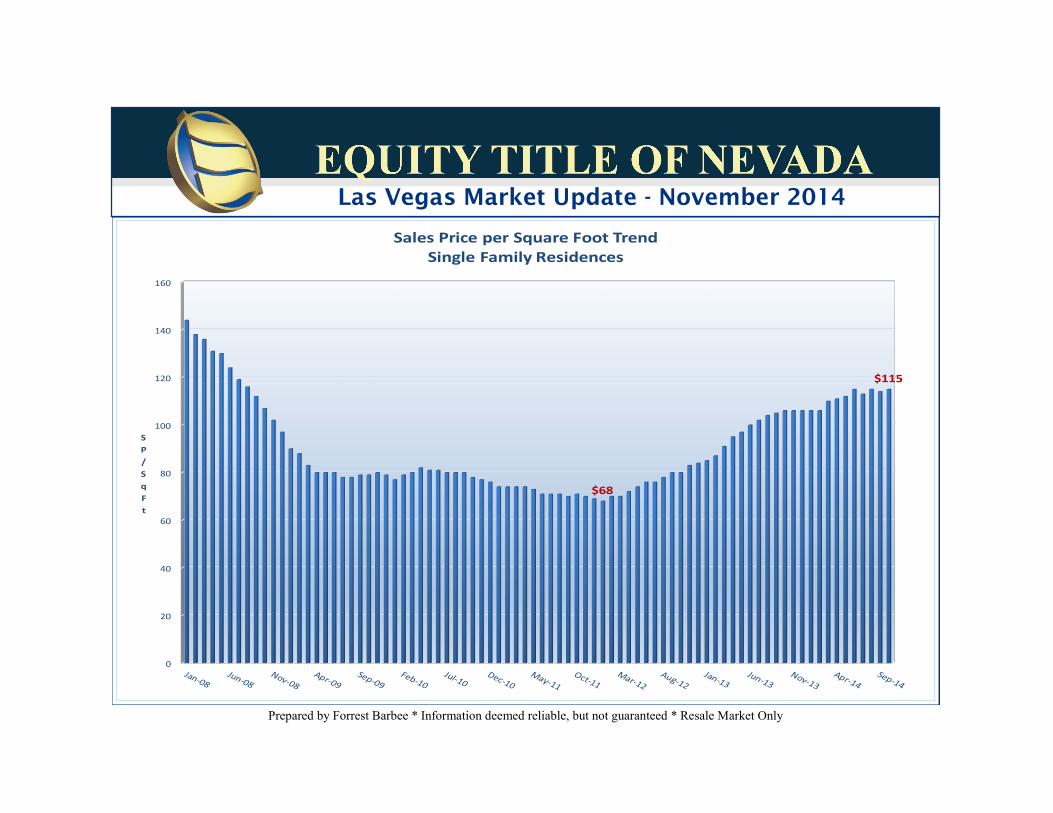
$68
$115
SP/SqFt
Sales Price per Square Foot TrendSingle Family Residences

Prepared by Forrest Barbee * Information deemed reliable, but not guaranteed * Resale Market Only
Las Vegas Market Update - November 2014
2009 2010 2011 2012 2013 2014
440 594 621 600 479 461
442 623 691 680
529 461
604
728 846 775
609 506
727
710 742
674
649 544
737
690 789
657
810
565
917
824
843
656
678
549
864 725
799
613 691
613
810 742
919
612 595
544
859 703
800
570 586
546
850 708
704
603 565
497
726 674
674
543 493
776 805
718
586
521
CONDO / TOWNHOME CLOSINGS
Dec
Nov
Oct
Sep
Aug
Jul
Jun
May
Apr
Mar
Feb
Jan
Prepared by Forrest Barbee * Information deemed reliable, but not guaranteed * Resale Market Only
Las Vegas Market Update - November 2014
2011 2012 2013 2014
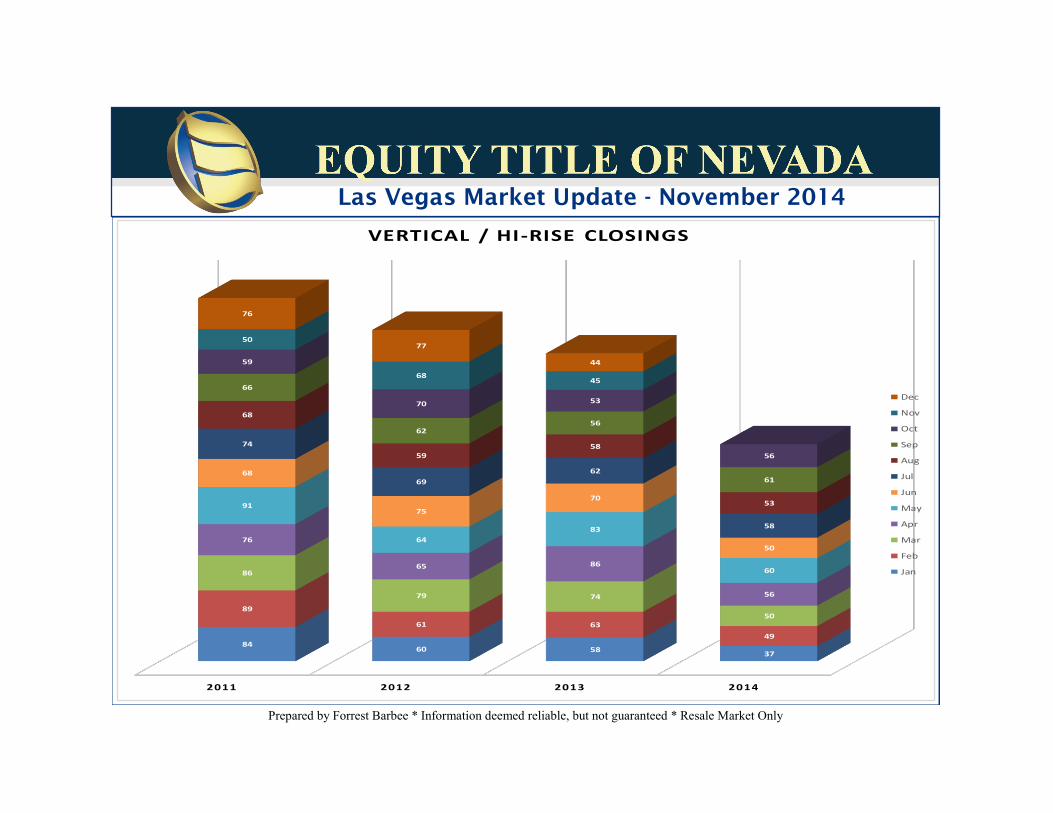
84 60 58 37
89
61 63 49
86
79 74
50
76
65 86
56
91
64 83
60
68
75
70
50
74
69 62
58
68
59 58
53
66
62 56
61
59
70 53
56
50
68 45
76
77
44
VERTICAL / HI-RISE CLOSINGS
Dec
Nov
Oct
Sep
Aug
Jul
Jun
May
Apr
Mar
Feb
Jan
Prepared by Forrest Barbee * Information deemed reliable, but not guaranteed * Resale Market Only
Las Vegas Market Update - November 2014
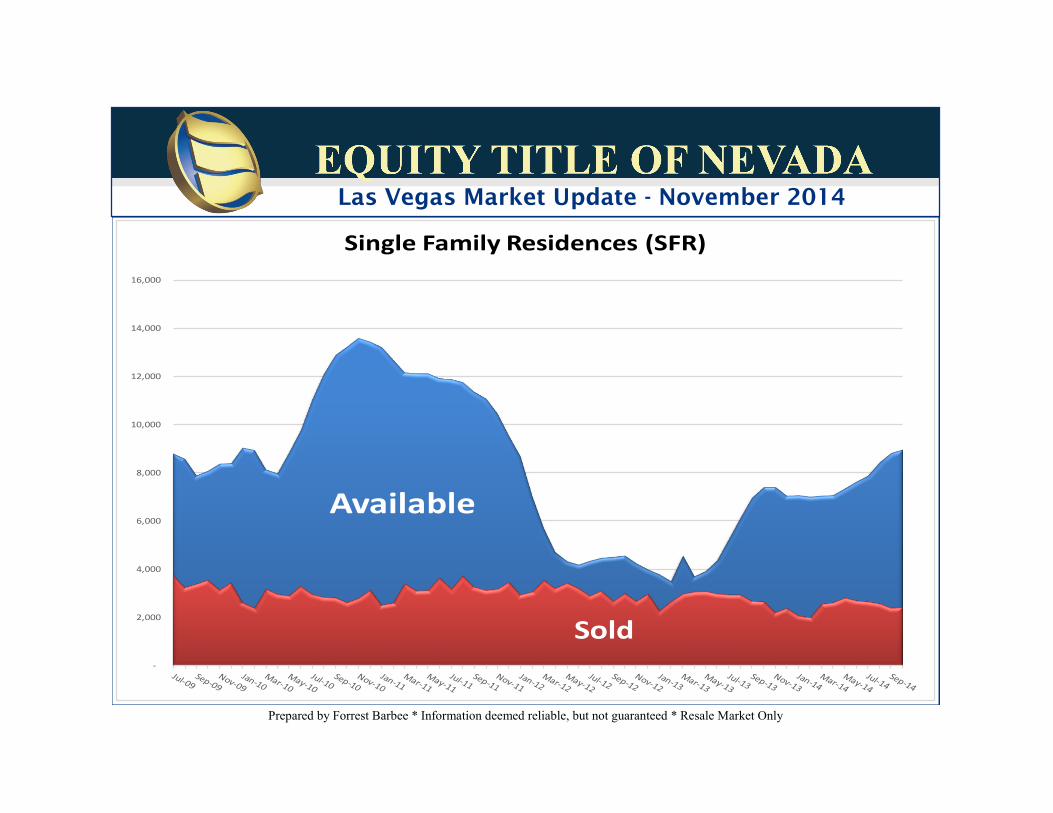
Available
Sold -
2,000
4,000
6,000
8,000
10,000
12,000
14,000
16,000
Single Family Residences (SFR)
Prepared by Forrest Barbee * Information deemed reliable, but not guaranteed * Resale Market Only
Las Vegas Market Update - November 2014
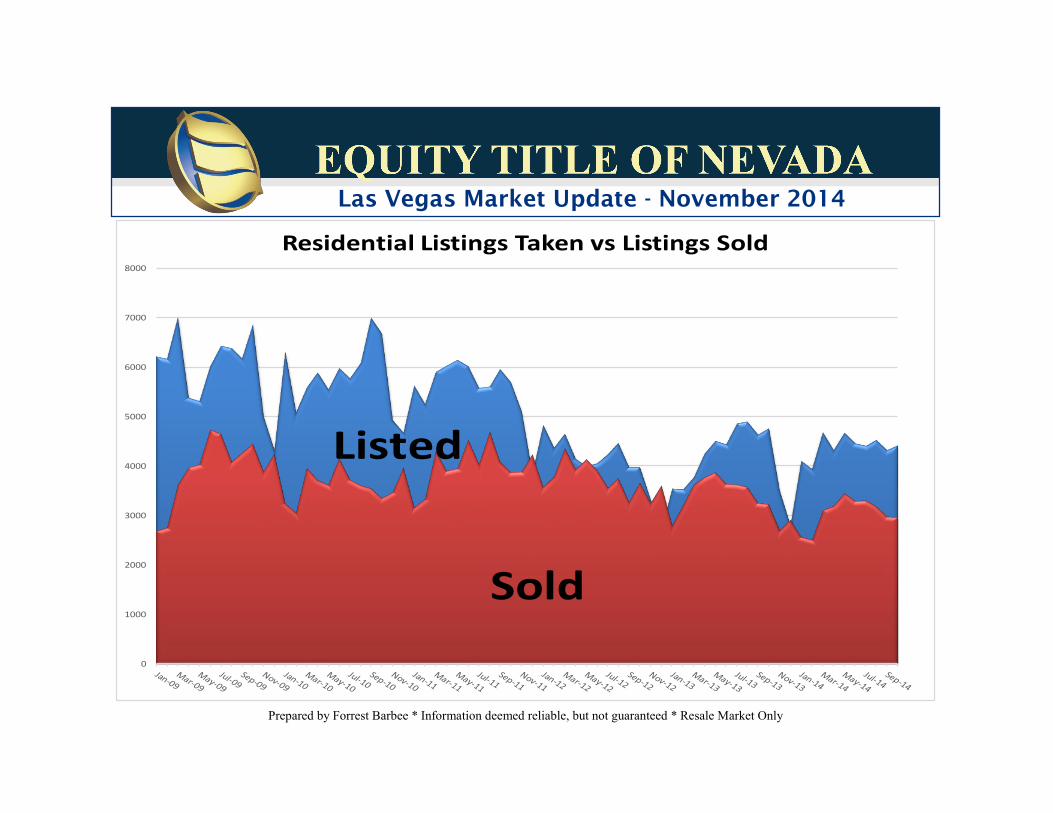
0
1000
2000
3000
4000
5000
6000
7000
8000
Residential Listings Taken vs Listings Sold
Sold
Listed
Prepared by Forrest Barbee * Information deemed reliable, but not guaranteed * Resale Market Only
Las Vegas Market Update - November 2014
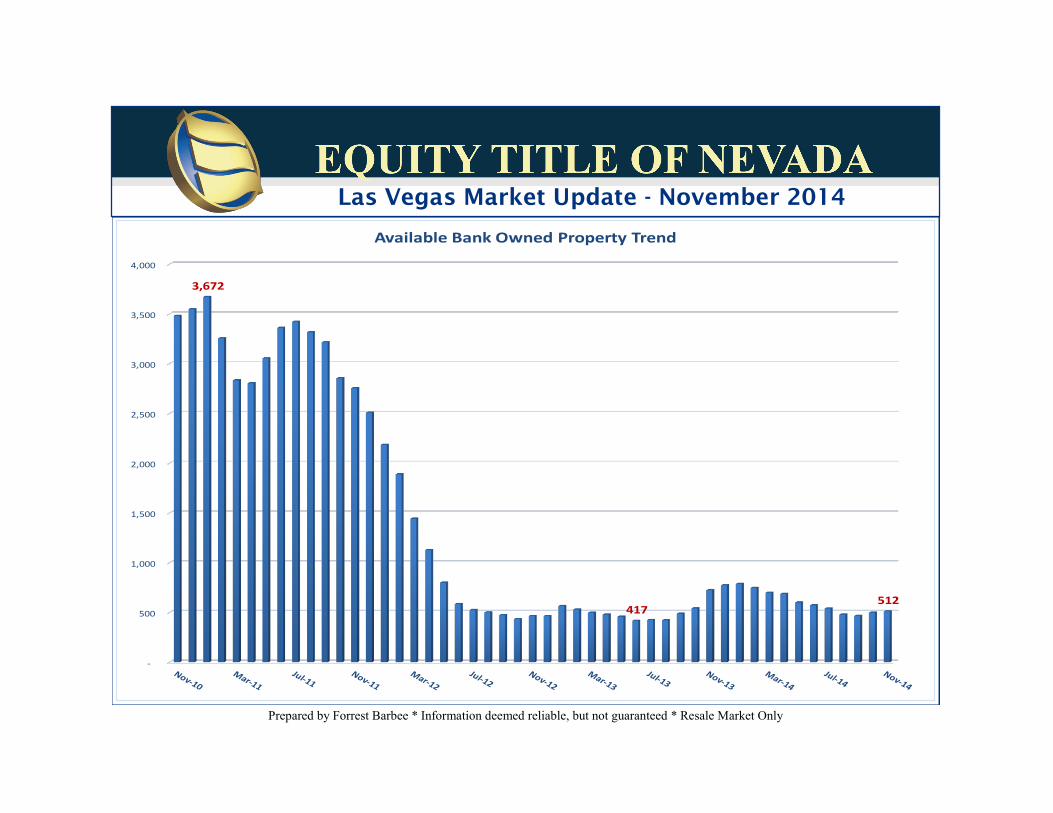
-
500
1,000
1,500
2,000
2,500
3,000
3,500
4,000
3,672
417 512
Available Bank Owned Property Trend
Prepared by Forrest Barbee * Information deemed reliable, but not guaranteed * Resale Market Only
Las Vegas Market Update - November 2014
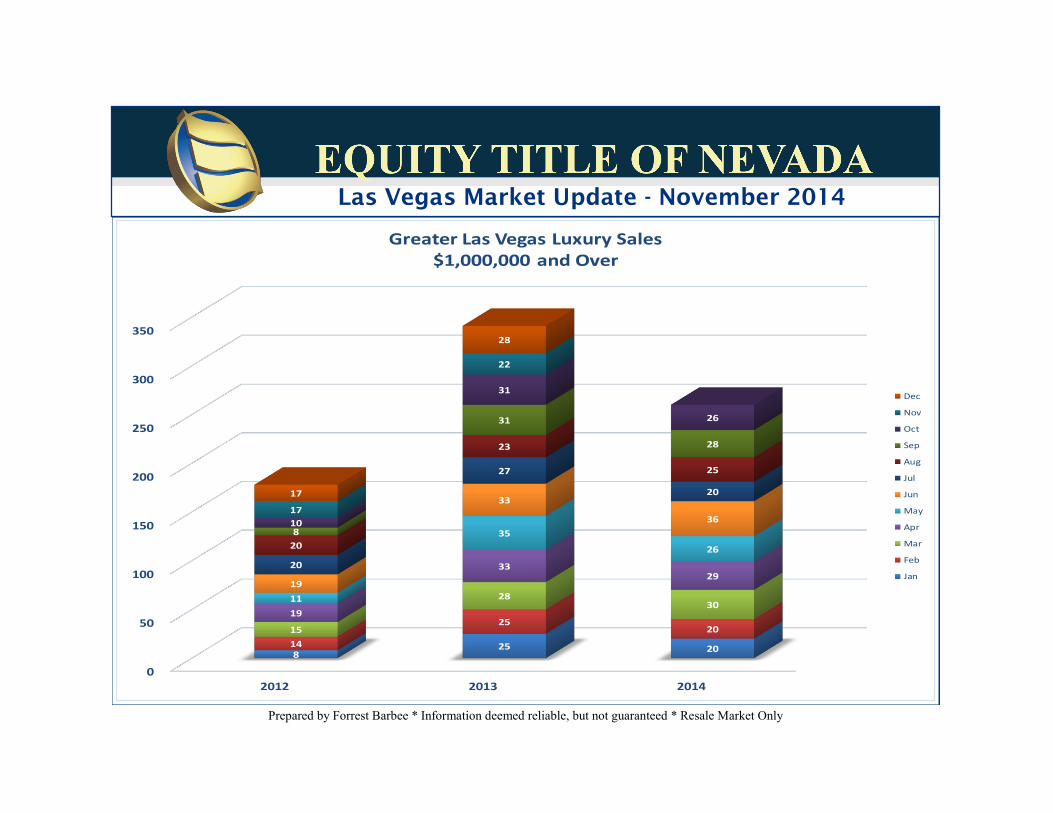
0
50
100
150
200
250
300
350
2012 2013 2014
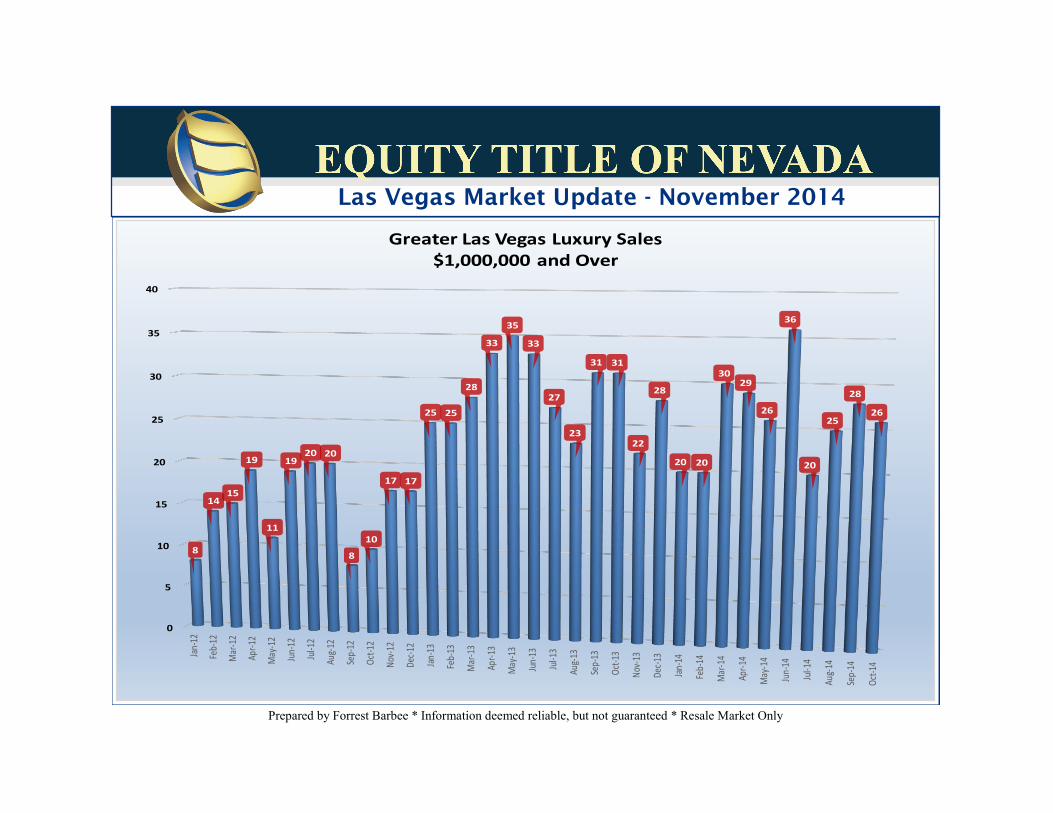
8 25 20 14
25 20 15
28 30
19
33 29
11
35
26
19
33
36
20
27
20
20
23
25
8
31
28
10
31
26
17
22
17
28
Greater Las Vegas Luxury Sales$1,000,000 and Over
Dec
Nov
Oct
Sep
Aug
Jul
Jun
May
Apr
Mar
Feb
Jan
Prepared by Forrest Barbee * Information deemed reliable, but not guaranteed * Resale Market Only
Las Vegas Market Update - November 2014
0
5
10
15
20
25
30
35
40
Jan-12
Feb-
12
Mar
-12
Apr-1
2
May
-12
Jun-
12
Jul-1
2
Aug-1
2
Sep-
12
Oct-1
2
Nov-1
2
Dec-1
2
Jan-13
Feb-
13
Mar
-13
Apr-1
3
May
-13
Jun-
13
Jul-1
3
Aug-1
3
Sep-
13
Oct-1
3
Nov-1
3
Dec-1
3
Jan-14
Feb-
14
Mar
-14
Apr-1
4
May
-14
Jun-
14
Jul-1
4
Aug-1
4
Sep-
14
Oct-1
4
8
1415
19
11
1920 20
8
10
17 17
25 25
28
33
35
33
27
23
31 31
22
28
20 20
3029
26
36
20
25
28
26
Greater Las Vegas Luxury Sales$1,000,000 and Over
Prepared by Forrest Barbee * Information deemed reliable, but not guaranteed * Resale Market Only
November 2014 Greater Las Vegas Market Update
REO9%
Short Sales10%
Classic80%
OCTOBER CLOSINGS BY TYPE
Cash35%
Conv32%
FHA23%
VA8%
Other3%
OCTOBER CLOSINGS BY SOLD TERMS
0.0%
10.0%
20.0%
30.0%
40.0%
50.0%
60.0%
70.0%
80.0%
90.0%
Closed Sales Trend by Type
REO Short Classic
2009 20112010 2012 2013 2014
-
50,000
100,000
150,000
200,000
250,000
300,000
350,000
400,000
450,000
500,000
SFR Market Prices
Average Median Avg-Traditional
Available
Units
Average
List Price
Average
LP/Sq Ft
Pending
Units
October
Sold Units
30 Day
Absorption
Rate
Median
Sold Price
Average
Sold Price
Average
SP/Sq Ft
Average
DOM
REO: 375 205,513 104 284 199 53.1% 161,000 175,267 97 66Short Sales: 1,064 205,922 101 2,485 265 24.9% 166,000 191,942 95 161
Classic: 7,536 411,820 146 2,561 1,941 25.8% 207,000 250,112 119 55Total GLVAR: 8,975 378,783 139 5,330 2,405 26.8% 199,000 237,509 115 68
Greater Las Vegas Snapshot by Sale Type - SFR Only
This data includes all GLVAR listings and sales within the Greater Las Vegas market area; SFR
Available
Units
Average
List Price
Average
LP/Sq Ft
Pending
Units
October
Sold Units
30 Day
Absorption
Rate
Median
Sold Price
Average
Sold Price
Average
SP/Sq Ft
Average
DOM
REO 512 173,544 96 360 271 52.9% 145,700 147,873 88 69Short Sales 1,361 181,681 97 3,001 310 22.8% 158,047 177,068 93 164
Classic 9,500 351,776 137 3,065 2,373 25.0% 189,000 224,738 114 58Total GLVAR 11,373 323,463 130 6,426 2,954 26.0% 180,000 212,684 109 70
Greater Las Vegas Snapshot by Sale Type
This data includes all GLVAR listings and sales within the Greater Las Vegas market area; SFR, CON, TWH, MAN
Prepared by Forrest Barbee * Information deemed reliable, but not guaranteed * Resale Market Only
November 2014 Greater Las Vegas Market Update
0
5,000
10,000
15,000
20,000
25,000
30,000
35,000
40,000
2003 2004 2005 2006 2007 2008 2009 2010 2011 2012 2013 2014
1749 2217 1985 1778 1397 983 2224 2608 2509 2931 2284 2063
1740 2431 2038 1787 1407 1098
2288 2390 2591 3053
2639 1993
2187
3460 3127
2521 1605
1478
2980 3175 3384 3534
2958 2537
2413
3267 2957
2266
1381 1794
3198 2951 3084 3185
3049
2613 2537
3204 3096
2556
1568 2026
3255 2884 3111 3413
3074
2824 2505
3552
3318
2510
1476 2226
3785 3360 3629
3212
2964
2675 2983
3397
3240
1996
1318 2592
3738 2948
3164 2887
2943
2633
2923
3192
3331
2097
1316
2545
3229 2819
3706 3076
2930
2567
2803
2922
2985
1739
990
2783
3358
2806
3242 2666
2669
2375
2684
2604
2574
1689
974
2718
3535
2599
3118 2995
2636
2405
2803
2492
2441
1547
968
2183
3117
2777
3159 2661
2201 2818
2522
2437
1644
879
2498
3420
3117
3456 2961
2379
Single Family Residential Closings
Jan Feb Mar Apr May Jun Jul Aug Sep Oct Nov Dec
Down11%YTD
442,862
496,023
549,092
420,512 411,926
190,837 227,924 233,866 243,572
251,598
0
100,000
200,000
300,000
400,000
500,000
600,000
Aug-1
1
Sep-
11
Oct-1
1
Nov-1
1
Dec-1
1
Jan-12
Feb-
12
Mar
-12
Apr-1
2
May
-12
Jun-
12
Jul-1
2
Aug-1
2
Sep-
12
Oct-1
2
Nov-1
2
Dec-1
2
Jan-13
Feb-
13
Mar
-13
Apr-1
3
May
-13
Jun-
13
Jul-1
3
Aug-1
3
Sep-
13
Oct-1
3
Nov-1
3
Dec-1
3
Jan-14
Feb-
14
Mar
-14
Apr-1
4
May
-14
Jun-
14
Jul-1
4
Aug-1
4
Sep-
14
Oct-1
4
Greater Las VegasSFR Average Equity Listing vs Sale Prices
Ave Available
Ave Sold
Average Listing Pricein October was
$315,785
Prepared by Forrest Barbee * Information deemed reliable, but not guaranteed * Resale Market Only
November 2014 Greater Las Vegas Market Update
3534
2405
0
500
1000
1500
2000
2500
3000
3500
4000
0
500
1000
1500
2000
2500
SFR Monthly Closings By Type
REO Short Sales Classic Total Closings
0
20
40
60
80
100
120
140
160
$68
$115
SP/SqFt
Sales Price per Square Foot TrendSingle Family Residences
Prepared by Forrest Barbee * Information deemed reliable, but not guaranteed * Resale Market Only
Cash53%Conv
24%
FHA17%
VA4%
Other2%
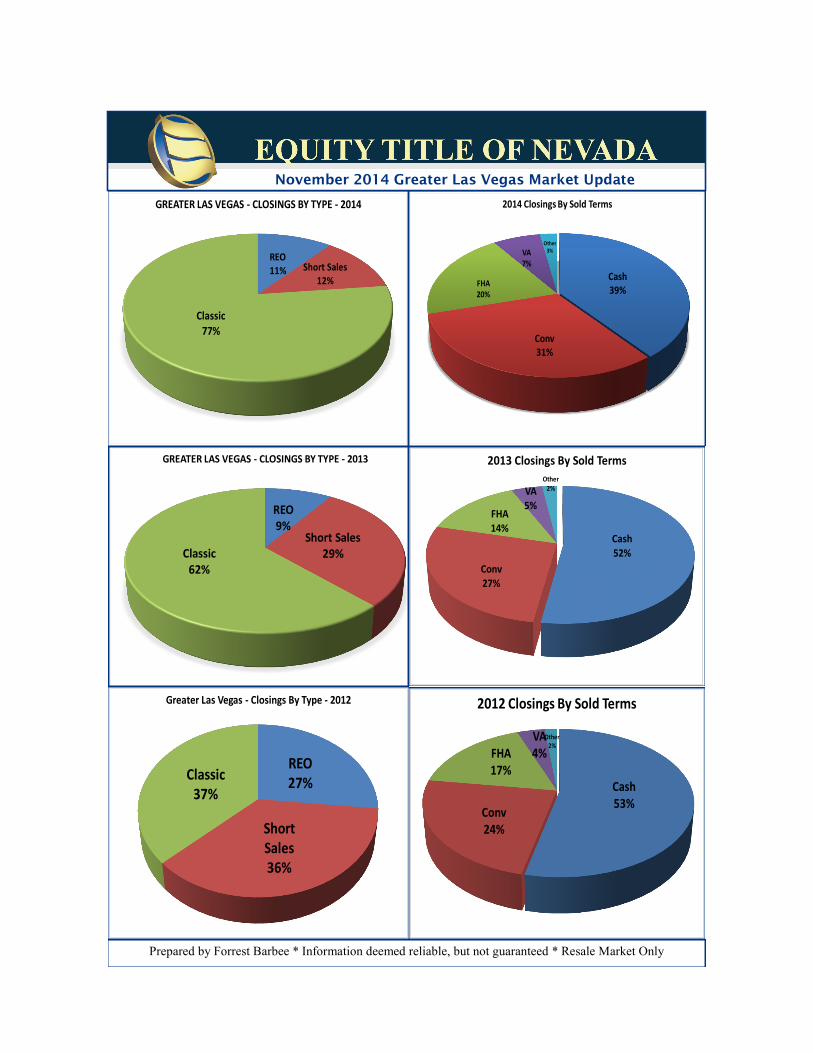
2012 Closings By Sold Terms
REO27%
Short Sales36%
Classic37%
Greater Las Vegas - Closings By Type - 2012
REO9%
Short Sales29%Classic
62%
GREATER LAS VEGAS - CLOSINGS BY TYPE - 2013
Cash52%
Conv27%
FHA14%
VA5%
Other2%
2013 Closings By Sold Terms
November 2014 Greater Las Vegas Market Update
Cash39%
Conv31%
FHA20%
VA7%
Other3%
2014 Closings By Sold Terms
REO11% Short Sales
12%
Classic77%
GREATER LAS VEGAS - CLOSINGS BY TYPE - 2014
Prepared by Forrest Barbee * Information deemed reliable, but not guaranteed * Resale Market Only
November 2014 Greater Las Vegas Market Update
SFRConTwn
Hi-Rise Total % Tot SFRConTwn
Hi-Rise Total % Tot
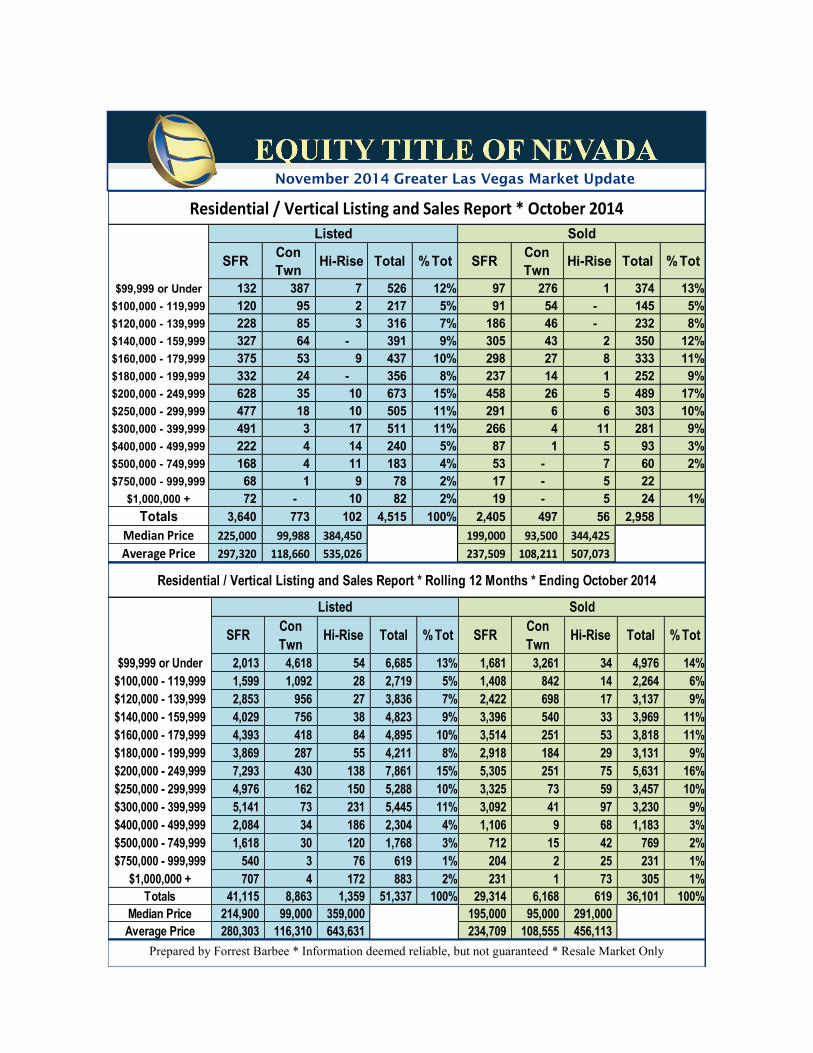
$99,999 or Under 132 387 7 526 12% 97 276 1 374 13%$100,000 - 119,999 120 95 2 217 5% 91 54 - 145 5%$120,000 - 139,999 228 85 3 316 7% 186 46 - 232 8%$140,000 - 159,999 327 64 - 391 9% 305 43 2 350 12%$160,000 - 179,999 375 53 9 437 10% 298 27 8 333 11%$180,000 - 199,999 332 24 - 356 8% 237 14 1 252 9%$200,000 - 249,999 628 35 10 673 15% 458 26 5 489 17%$250,000 - 299,999 477 18 10 505 11% 291 6 6 303 10%$300,000 - 399,999 491 3 17 511 11% 266 4 11 281 9%$400,000 - 499,999 222 4 14 240 5% 87 1 5 93 3%$500,000 - 749,999 168 4 11 183 4% 53 - 7 60 2%$750,000 - 999,999 68 1 9 78 2% 17 - 5 22
$1,000,000 + 72 - 10 82 2% 19 - 5 24 1%Totals 3,640 773 102 4,515 100% 2,405 497 56 2,958
Median Price 225,000 99,988 384,450 199,000 93,500 344,425 Average Price 297,320 118,660 535,026 237,509 108,211 507,073
Residential / Vertical Listing and Sales Report * October 2014Listed Sold
SFRConTwn
Hi-Rise Total % Tot SFRConTwn
Hi-Rise Total % Tot
$99,999 or Under 2,013 4,618 54 6,685 13% 1,681 3,261 34 4,976 14%$100,000 - 119,999 1,599 1,092 28 2,719 5% 1,408 842 14 2,264 6%$120,000 - 139,999 2,853 956 27 3,836 7% 2,422 698 17 3,137 9%$140,000 - 159,999 4,029 756 38 4,823 9% 3,396 540 33 3,969 11%$160,000 - 179,999 4,393 418 84 4,895 10% 3,514 251 53 3,818 11%$180,000 - 199,999 3,869 287 55 4,211 8% 2,918 184 29 3,131 9%$200,000 - 249,999 7,293 430 138 7,861 15% 5,305 251 75 5,631 16%$250,000 - 299,999 4,976 162 150 5,288 10% 3,325 73 59 3,457 10%$300,000 - 399,999 5,141 73 231 5,445 11% 3,092 41 97 3,230 9%$400,000 - 499,999 2,084 34 186 2,304 4% 1,106 9 68 1,183 3%$500,000 - 749,999 1,618 30 120 1,768 3% 712 15 42 769 2%$750,000 - 999,999 540 3 76 619 1% 204 2 25 231 1%
$1,000,000 + 707 4 172 883 2% 231 1 73 305 1%Totals 41,115 8,863 1,359 51,337 100% 29,314 6,168 619 36,101 100%
Median Price 214,900 99,000 359,000 195,000 95,000 291,000 Average Price 280,303 116,310 643,631 234,709 108,555 456,113
Listed
Residential / Vertical Listing and Sales Report * Rolling 12 Months * Ending October 2014
Sold

Prepared by Forrest Barbee * Information deemed reliable, but not guaranteed * Resale Market Only
November 2014 Greater Las Vegas Market Update
Available
Sold -
2,000
4,000
6,000
8,000
10,000
12,000
14,000
16,000
Single Family Residences (SFR)
0
1000
2000
3000
4000
5000
6000
7000
8000
Residential Listings Taken vs Listings Sold
Sold
Listed
Prepared by Forrest Barbee * Information deemed reliable, but not guaranteed * Resale Market Only
November 2014 Greater Las Vegas Market Update
Available
Units
Average List
Price
Pending
Units
October
Sold Units
30 Day
Absorption
Rate
YTD
Sold
Units
YTD
Average
Sold Price
YTD
Average
SP/Sq Ft
YTD
Average
DOM
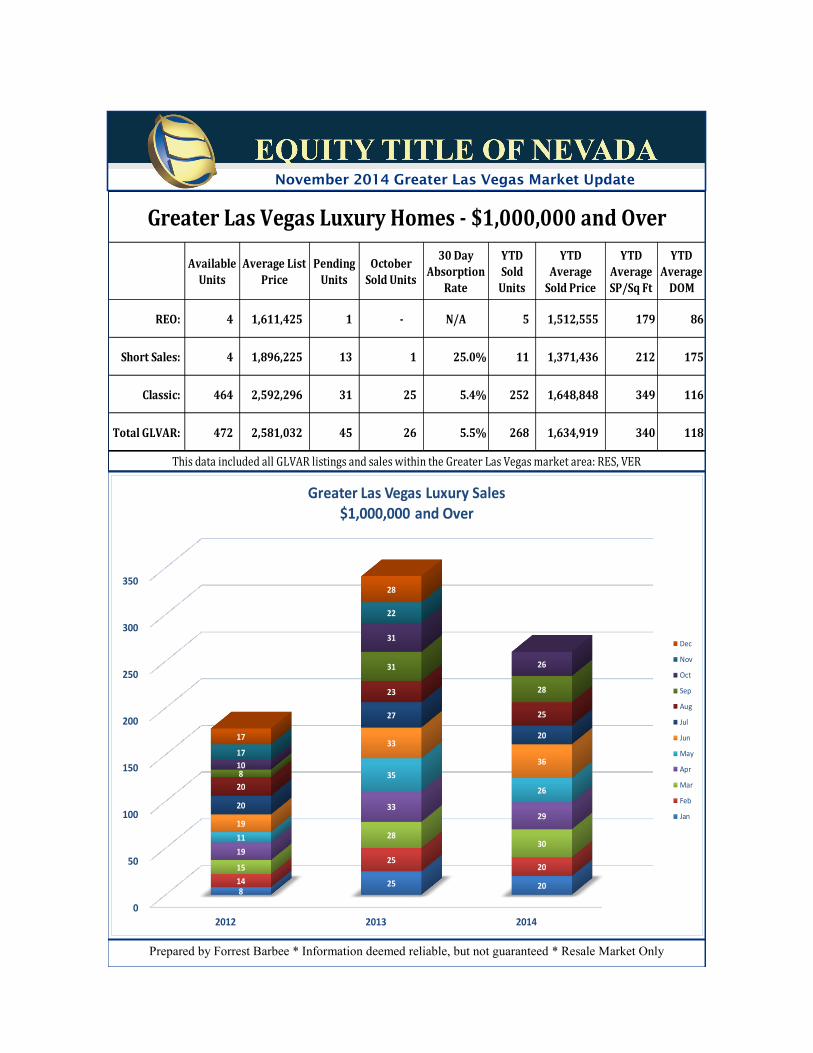
REO: 4 1,611,425 1 - N/A 5 1,512,555 179 86
Short Sales: 4 1,896,225 13 1 25.0% 11 1,371,436 212 175
Classic: 464 2,592,296 31 25 5.4% 252 1,648,848 349 116
Total GLVAR: 472 2,581,032 45 26 5.5% 268 1,634,919 340 118
Greater Las Vegas Luxury Homes - $1,000,000 and Over
This data included all GLVAR listings and sales within the Greater Las Vegas market area: RES, VER
0
50
100
150
200
250
300
350
2012 2013 2014
8 25 20 14
25 20 15
28 30
19
33 29
11
35
26
19
33
36
20
27
20
20
23
25
8
31
28
10
31
26
17
22
17
28
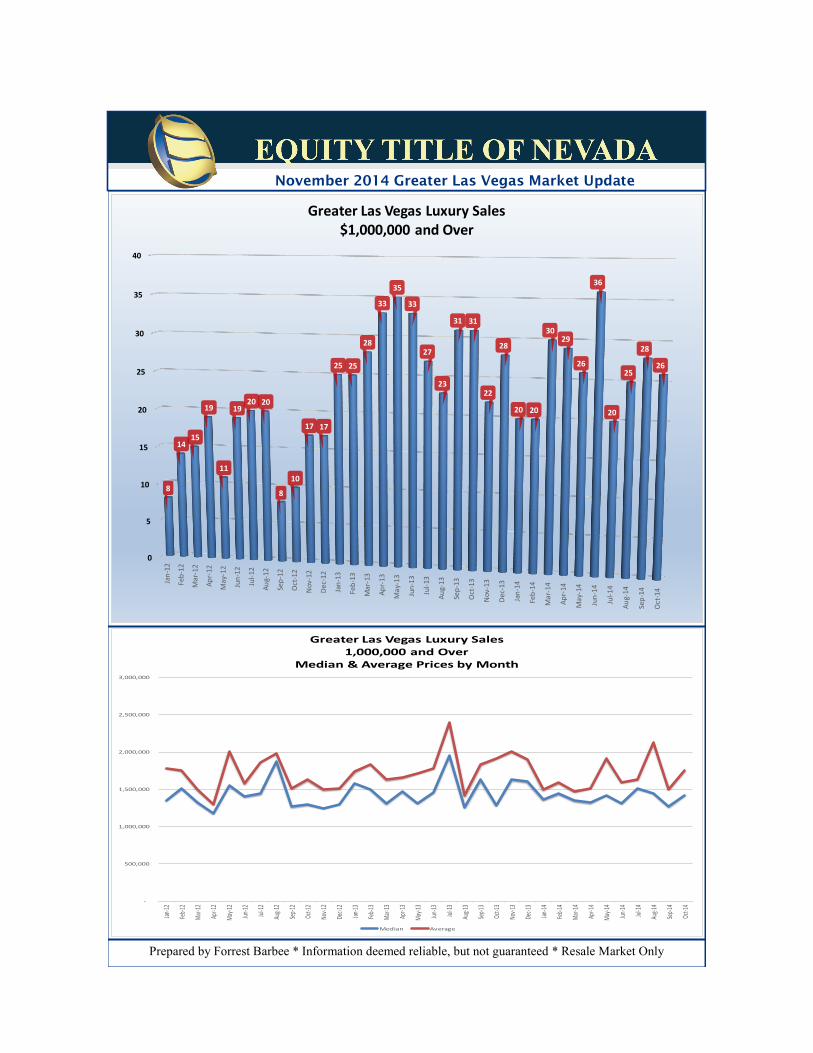
Greater Las Vegas Luxury Sales$1,000,000 and Over
Dec
Nov
Oct
Sep
Aug
Jul
Jun
May
Apr
Mar
Feb
Jan
Prepared by Forrest Barbee * Information deemed reliable, but not guaranteed * Resale Market Only
November 2014 Greater Las Vegas Market Update
0
5
10
15
20
25
30
35
40
Jan-
12
Feb-
12
Mar
-12
Apr-1
2
May
-12
Jun-
12
Jul-1
2
Aug-
12
Sep-
12
Oct
-12
Nov-
12
Dec-
12
Jan-
13
Feb-
13
Mar
-13
Apr-1
3
May
-13
Jun-
13
Jul-1
3
Aug-
13
Sep-
13
Oct-1
3
Nov-
13
Dec-
13
Jan-
14
Feb-
14
Mar
-14
Apr-1
4
May
-14
Jun-
14
Jul-1
4
Aug-
14
Sep-
14
Oct-1
4
8
1415
19
11
1920 20
8
10
17 17
25 25
28
33
35
33
27
23
31 31
22
28
20 20
3029
26
36
20
25
28
26
Greater Las Vegas Luxury Sales$1,000,000 and Over
-
500,000
1,000,000
1,500,000
2,000,000
2,500,000
3,000,000
Jan-12
Feb-12
Mar-1
2
Apr-1
2
May-1
2
Jun-12
Jul-12
Aug-1
2
Sep-12
Oct-1
2
Nov-1
2
Dec-1
2
Jan-13
Feb-13
Mar-1
3
Apr-1
3
May-1
3
Jun-13
Jul-13
Aug-1
3
Sep-13
Oct-1
3
Nov-1
3
Dec-1
3
Jan-14
Feb-14
Mar-1
4
Apr-1
4
May-1
4
Jun-14
Jul-14
Aug-1
4
Sep-14
Oct-1
4
Greater Las Vegas Luxury Sales1,000,000 and Over
Median & Average Prices by Month
Median Average
Prepared by Forrest Barbee * Information deemed reliable, but not guaranteed * Resale Market Only
Equity Title of Nevada (702)432-1111
www.equitynv.com
November 2014 Greater Las Vegas Market Update
AreaTotal
Currently Listed
REO Listed
SS Listed
Classic Listed
Sold % SoldMonths Supply
Average List Price
Average Close Price
AvgDOM
North (101, 103) 1077 47 220 810 335 31% 3.2 201,713 177,382 77East (201-204) 707 46 151 221 257 61% 2.8 186,159 142,524 65South (301-303) 757 47 100 610 249 33% 3.0 286,128 201,914 61NW (102, 401-403, 405) 1721 76 233 1412 515 30% 3.3 303,928 219,500 59Summerlin (404) 422 10 19 393 111 26% 3.8 570,303 400,290 54SW (501-505) 2003 57 187 1759 471 24% 4.3 485,501 287,206 73Henderson 1450 49 119 1282 390 27% 3.7 568,834 295,600 59Boulder City 86 4 3 79 18 21% 4.8 632,584 301,300 145Totals 8,223 336 1,032 6,566 2,346 30% 3.5 386,620 238,561 66
Single Family Residence - October 2014
AreaTotal
Currently Listed
REO Listed
SS Listed
Classic Listed
Sold % SoldMonths Supply
Average List Price
Average Close Price
Avg DOM
North (101, 103) 96 7 16 73 22 23% 4.4 105,642 96,507 43East (201-204) 277 14 41 222 60 22% 4.6 70,776 60,658 87South (301-303) 353 17 45 291 71 20% 5.0 98,179 92,931 70NW (102, 401-403, 405) 457 19 61 377 111 24% 4.1 100,164 91,231 77Summerlin (404) 101 2 6 93 24 24% 4.2 208,799 180,910 51SW (501-505) 451 34 54 363 120 27% 3.8 115,414 113,874 71Henderson 256 4 49 203 86 34% 3.0 175,859 144,788 97Boulder City 25 1 0 24 4 16% 6.3 185,804 241,000 94RES Totals 2016 98 272 1646 498 25% 4.0 115,568 108,609 67Hi-Rise Condos 534 5 10 519 56 10% 9.5 837,356 507,073 101RES & VER Totals 2550 103 282 2165 554 22% 4.6
Condominium & Townhouse - October 2014
YTD Closed 2013 YTD Closed 2014 Units Change % Change34,581 30,486 (4,095) -11.8%
REO9%
Short Sales10%
Classic80%
OCTOBER CLOSINGS BY TYPE
Cash35%
Conv32%
FHA23%
VA8%
Other3%
OCTOBER CLOSINGS BY SOLD TERMS
Available
Sold -
2,000
4,000
6,000
8,000
10,000
12,000
14,000
16,000
Single Family Residences (SFR)
18%
16%
6%
-3%
12%
10%
6%
22%
3%7%
24%
17%
2%
9%
-2%7%
5%
6% 14% 13%
14%
15%15% 23%
36%
3%
0% 3%
0%
0%
4%
22%
11%5%
5%-1%
13%4%12%
17%
4%9%
16%
13%
13%
6%
15%-2%
9%
28%11%
20% 18%
10%
0%
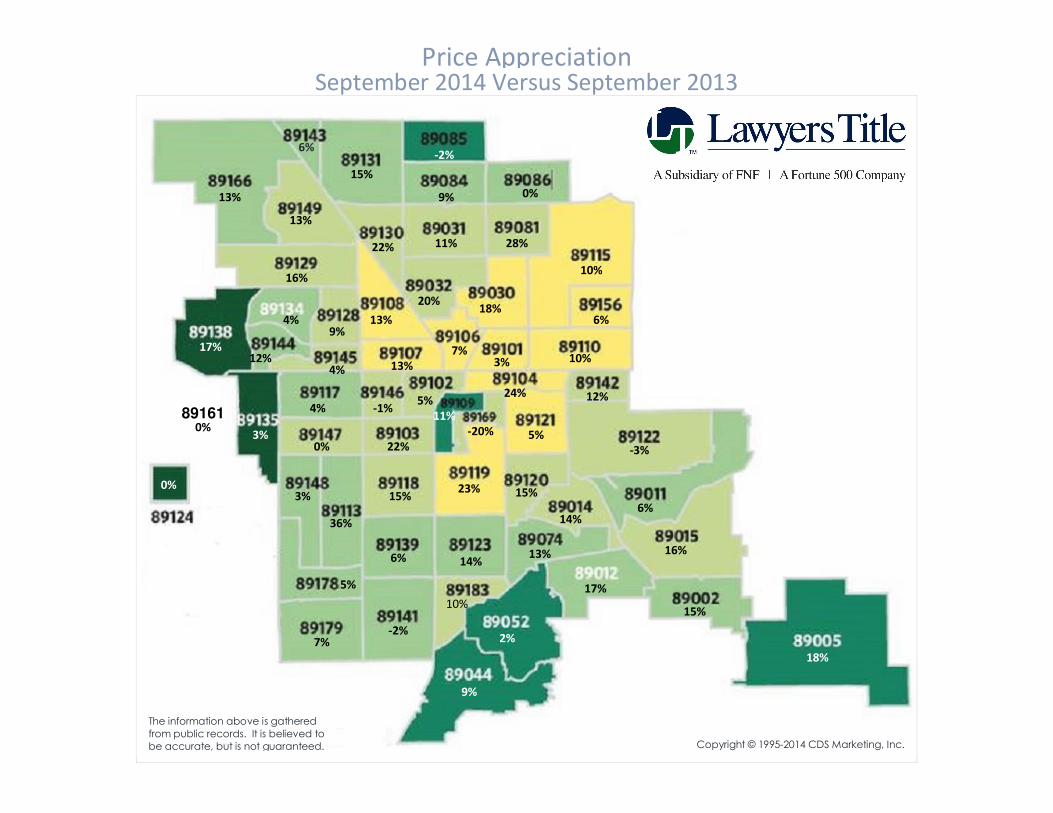
September 2014 Versus September 2013Price Appreciation
15%10%
-20%89161
The information above is gathered from public records. It is believed to be accurate, but is not guaranteed. Copyright © 1995-2014 CDS Marketing, Inc.
13%
OLEBound56: Clark CountyCondo Activity
September 2014Zip
CodeFull
SalesAvgPrice
AvgSqft
Avg$Sqft
REOSales
REOAvg Price
13/14Diff
After REO
After REOAvg Price
ZipCode
FullSales
AvgPrice
AvgSqft
Avg$Sqft
REOSales
REOAvg Price
13/14Diff
AfterREO
After REOAvg Price
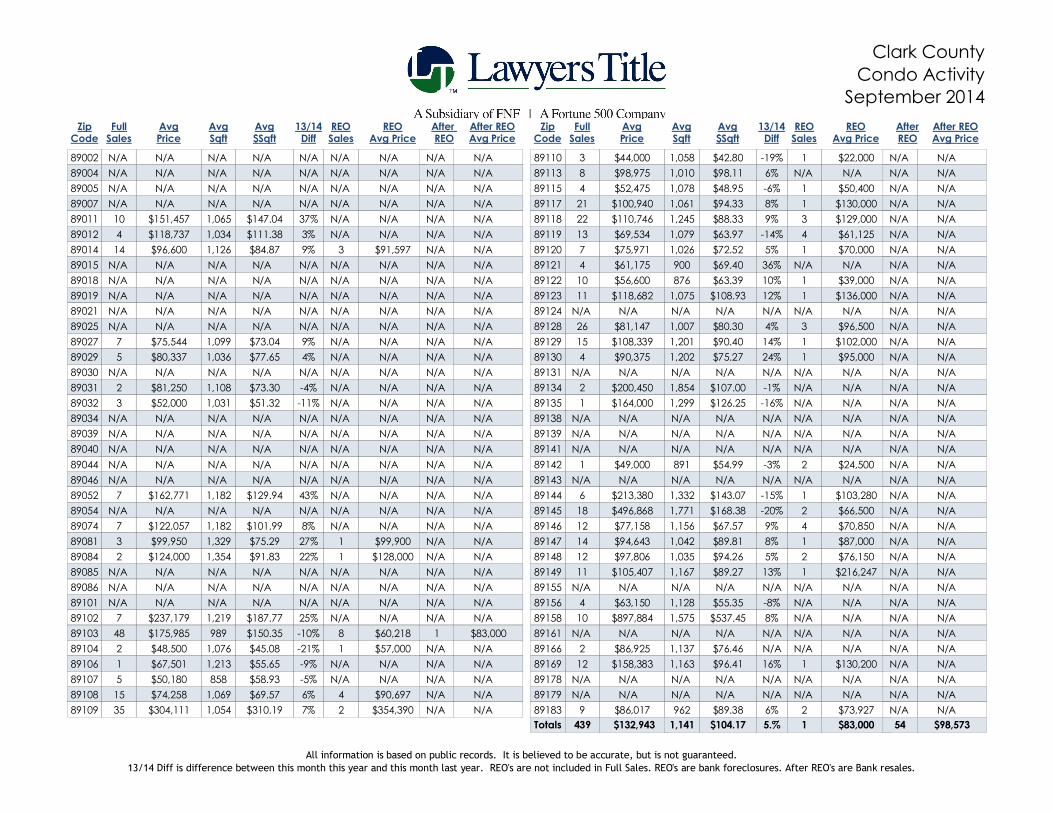
N/A 89002 N/A N/A N/A N/A N/A N/A N/A N/A N/A 89004 N/A N/A N/A N/A N/A N/A N/A N/A N/A 89005 N/A N/A N/A N/A N/A N/A N/A N/A N/A 89007 N/A N/A N/A N/A N/A N/A N/A N/A N/A 89011 10 $151,457 $147.04 N/A N/A 1,065 37% N/A N/A 89012 4 $118,737 $111.38 N/A N/A 1,034 3% N/A N/A 89014 14 $96,600 $84.87 3 $91,5971,126 9% N/A N/A 89015 N/A N/A N/A N/A N/A N/A N/A N/A N/A 89018 N/A N/A N/A N/A N/A N/A N/A N/A N/A 89019 N/A N/A N/A N/A N/A N/A N/A N/A N/A 89021 N/A N/A N/A N/A N/A N/A N/A N/A N/A 89025 N/A N/A N/A N/A N/A N/A N/A N/A N/A 89027 7 $75,544 $73.04 N/A N/A 1,099 9% N/A N/A 89029 5 $80,337 $77.65 N/A N/A 1,036 4% N/A N/A 89030 N/A N/A N/A N/A N/A N/A N/A N/A N/A 89031 2 $81,250 $73.30 N/A N/A 1,108 -4% N/A N/A 89032 3 $52,000 $51.32 N/A N/A 1,031 -11% N/A N/A 89034 N/A N/A N/A N/A N/A N/A N/A N/A N/A 89039 N/A N/A N/A N/A N/A N/A N/A N/A N/A 89040 N/A N/A N/A N/A N/A N/A N/A N/A N/A 89044 N/A N/A N/A N/A N/A N/A N/A N/A N/A 89046 N/A N/A N/A N/A N/A N/A N/A N/A N/A 89052 7 $162,771 $129.94 N/A N/A 1,182 43% N/A N/A 89054 N/A N/A N/A N/A N/A N/A N/A N/A N/A 89074 7 $122,057 $101.99 N/A N/A 1,182 8% N/A N/A 89081 3 $99,950 $75.29 1 $99,9001,329 27% N/A N/A 89084 2 $124,000 $91.83 1 $128,0001,354 22% N/A N/A 89085 N/A N/A N/A N/A N/A N/A N/A N/A N/A 89086 N/A N/A N/A N/A N/A N/A N/A N/A N/A 89101 N/A N/A N/A N/A N/A N/A N/A N/A N/A 89102 7 $237,179 $187.77 N/A N/A 1,219 25% N/A
$83,00089103 48 $175,985 $150.35 8 $60,218989 -10% 1N/A 89104 2 $48,500 $45.08 1 $57,0001,076 -21% N/A N/A 89106 1 $67,501 $55.65 N/A N/A 1,213 -9% N/A N/A 89107 5 $50,180 $58.93 N/A N/A 858 -5% N/A N/A 89108 15 $74,258 $69.57 4 $90,6971,069 6% N/A N/A 89109 35 $304,111 $310.19 2 $354,3901,054 7% N/A
N/A 89110 3 $44,000 $42.80 1 $22,0001,058 -19% N/A N/A 89113 8 $98,975 $98.11 N/A N/A 1,010 6% N/A N/A 89115 4 $52,475 $48.95 1 $50,4001,078 -6% N/A N/A 89117 21 $100,940 $94.33 1 $130,0001,061 8% N/A N/A 89118 22 $110,746 $88.33 3 $129,0001,245 9% N/A N/A 89119 13 $69,534 $63.97 4 $61,1251,079 -14% N/A N/A 89120 7 $75,971 $72.52 1 $70,0001,026 5% N/A N/A 89121 4 $61,175 $69.40 N/A N/A 900 36% N/A N/A 89122 10 $56,600 $63.39 1 $39,000876 10% N/A N/A 89123 11 $118,682 $108.93 1 $136,0001,075 12% N/A N/A 89124 N/A N/A N/A N/A N/A N/A N/A N/A N/A 89128 26 $81,147 $80.30 3 $96,5001,007 4% N/A N/A 89129 15 $108,339 $90.40 1 $102,0001,201 14% N/A N/A 89130 4 $90,375 $75.27 1 $95,0001,202 24% N/A N/A 89131 N/A N/A N/A N/A N/A N/A N/A N/A N/A 89134 2 $200,450 $107.00 N/A N/A 1,854 -1% N/A N/A 89135 1 $164,000 $126.25 N/A N/A 1,299 -16% N/A N/A 89138 N/A N/A N/A N/A N/A N/A N/A N/A N/A 89139 N/A N/A N/A N/A N/A N/A N/A N/A N/A 89141 N/A N/A N/A N/A N/A N/A N/A N/A N/A 89142 1 $49,000 $54.99 2 $24,500891 -3% N/A N/A 89143 N/A N/A N/A N/A N/A N/A N/A N/A N/A 89144 6 $213,380 $143.07 1 $103,2801,332 -15% N/A N/A 89145 18 $496,868 $168.38 2 $66,5001,771 -20% N/A N/A 89146 12 $77,158 $67.57 4 $70,8501,156 9% N/A N/A 89147 14 $94,643 $89.81 1 $87,0001,042 8% N/A N/A 89148 12 $97,806 $94.26 2 $76,1501,035 5% N/A N/A 89149 11 $105,407 $89.27 1 $216,2471,167 13% N/A N/A 89155 N/A N/A N/A N/A N/A N/A N/A N/A N/A 89156 4 $63,150 $55.35 N/A N/A 1,128 -8% N/A N/A 89158 10 $897,884 $537.45 N/A N/A 1,575 8% N/A N/A 89161 N/A N/A N/A N/A N/A N/A N/A N/A N/A 89166 2 $86,925 $76.46 N/A N/A 1,137 N/A N/A N/A 89169 12 $158,383 $96.41 1 $130,2001,163 16% N/A N/A 89178 N/A N/A N/A N/A N/A N/A N/A N/A N/A 89179 N/A N/A N/A N/A N/A N/A N/A N/A N/A 89183 9 $86,017 $89.38 2 $73,927962 6% N/A
$83,000Totals 439 $132,943 $104.17 54 $98,5731,141 5.% 1
All information is based on public records. It is believed to be accurate, but is not guaranteed.13/14 Diff is difference between this month this year and this month last year. REO's are not included in Full Sales. REO's are bank foreclosures. After REO's are Bank resales.
Zip
Code
Median
Price
Home
Purchase
Investment
Purchase
%
Investors
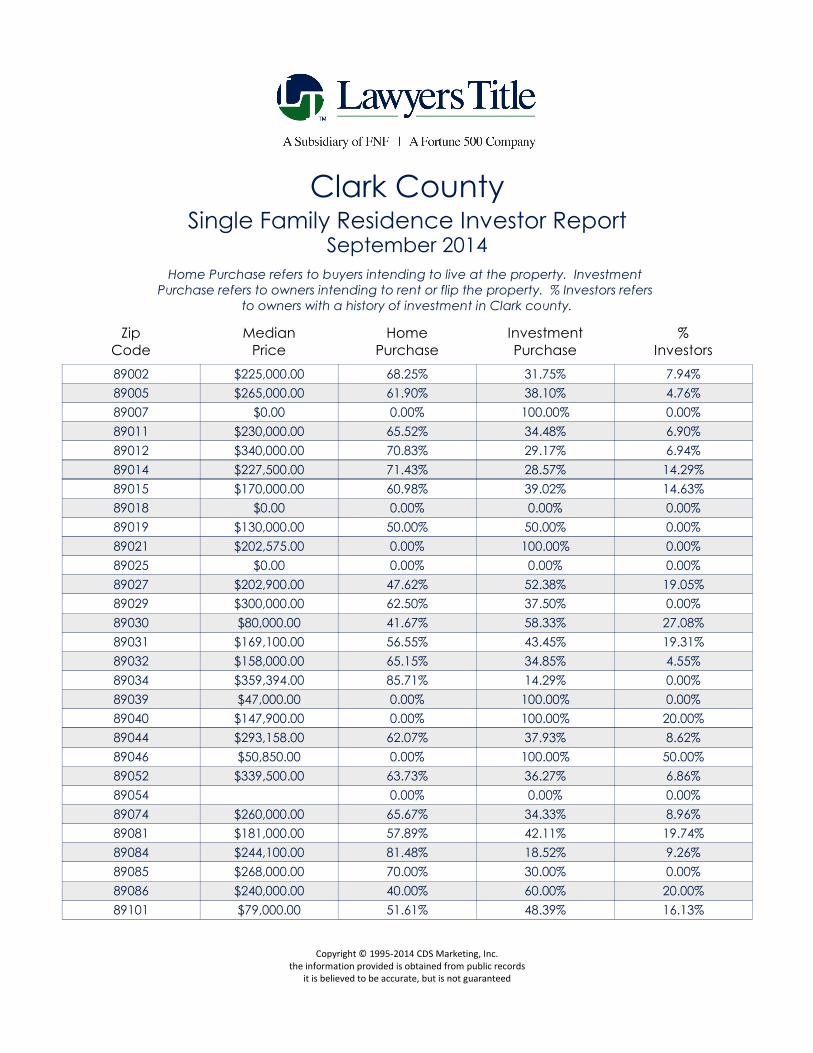
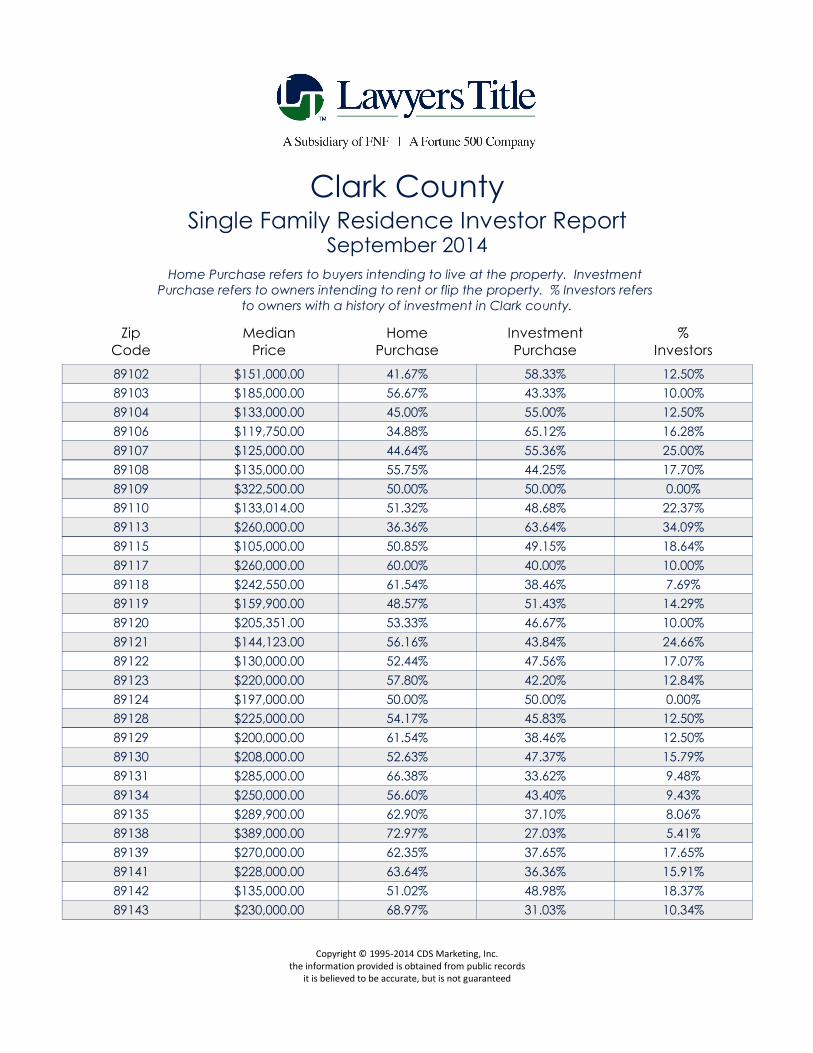
Clark CountySingle Family Residence Investor Report
Home Purchase refers to buyers intending to live at the property. Investment Purchase refers to owners intending to rent or flip the property. % Investors refers
to owners with a history of investment in Clark county.
September 2014
89002 $225,000.00 68.25% 31.75% 7.94%
89005 $265,000.00 61.90% 38.10% 4.76%
89007 $0.00 0.00% 100.00% 0.00%
89011 $230,000.00 65.52% 34.48% 6.90%
89012 $340,000.00 70.83% 29.17% 6.94%
89014 $227,500.00 71.43% 28.57% 14.29%
89015 $170,000.00 60.98% 39.02% 14.63%
89018 $0.00 0.00% 0.00% 0.00%
89019 $130,000.00 50.00% 50.00% 0.00%
89021 $202,575.00 0.00% 100.00% 0.00%
89025 $0.00 0.00% 0.00% 0.00%
89027 $202,900.00 47.62% 52.38% 19.05%
89029 $300,000.00 62.50% 37.50% 0.00%
89030 $80,000.00 41.67% 58.33% 27.08%
89031 $169,100.00 56.55% 43.45% 19.31%
89032 $158,000.00 65.15% 34.85% 4.55%
89034 $359,394.00 85.71% 14.29% 0.00%
89039 $47,000.00 0.00% 100.00% 0.00%
89040 $147,900.00 0.00% 100.00% 20.00%
89044 $293,158.00 62.07% 37.93% 8.62%
89046 $50,850.00 0.00% 100.00% 50.00%
89052 $339,500.00 63.73% 36.27% 6.86%
89054 0.00% 0.00% 0.00%
89074 $260,000.00 65.67% 34.33% 8.96%
89081 $181,000.00 57.89% 42.11% 19.74%
89084 $244,100.00 81.48% 18.52% 9.26%
89085 $268,000.00 70.00% 30.00% 0.00%
89086 $240,000.00 40.00% 60.00% 20.00%
89101 $79,000.00 51.61% 48.39% 16.13%
Copyright © 1995-2014 CDS Marketing, Inc.the information provided is obtained from public records
it is believed to be accurate, but is not guaranteed
Zip
Code
Median
Price
Home
Purchase
Investment
Purchase
%
Investors
Clark CountySingle Family Residence Investor Report
Home Purchase refers to buyers intending to live at the property. Investment Purchase refers to owners intending to rent or flip the property. % Investors refers
to owners with a history of investment in Clark county.
September 2014
89102 $151,000.00 41.67% 58.33% 12.50%
89103 $185,000.00 56.67% 43.33% 10.00%
89104 $133,000.00 45.00% 55.00% 12.50%
89106 $119,750.00 34.88% 65.12% 16.28%
89107 $125,000.00 44.64% 55.36% 25.00%
89108 $135,000.00 55.75% 44.25% 17.70%
89109 $322,500.00 50.00% 50.00% 0.00%
89110 $133,014.00 51.32% 48.68% 22.37%
89113 $260,000.00 36.36% 63.64% 34.09%
89115 $105,000.00 50.85% 49.15% 18.64%
89117 $260,000.00 60.00% 40.00% 10.00%
89118 $242,550.00 61.54% 38.46% 7.69%
89119 $159,900.00 48.57% 51.43% 14.29%
89120 $205,351.00 53.33% 46.67% 10.00%
89121 $144,123.00 56.16% 43.84% 24.66%
89122 $130,000.00 52.44% 47.56% 17.07%
89123 $220,000.00 57.80% 42.20% 12.84%
89124 $197,000.00 50.00% 50.00% 0.00%
89128 $225,000.00 54.17% 45.83% 12.50%
89129 $200,000.00 61.54% 38.46% 12.50%
89130 $208,000.00 52.63% 47.37% 15.79%
89131 $285,000.00 66.38% 33.62% 9.48%
89134 $250,000.00 56.60% 43.40% 9.43%
89135 $289,900.00 62.90% 37.10% 8.06%
89138 $389,000.00 72.97% 27.03% 5.41%
89139 $270,000.00 62.35% 37.65% 17.65%
89141 $228,000.00 63.64% 36.36% 15.91%
89142 $135,000.00 51.02% 48.98% 18.37%
89143 $230,000.00 68.97% 31.03% 10.34%
Copyright © 1995-2014 CDS Marketing, Inc.the information provided is obtained from public records
it is believed to be accurate, but is not guaranteed
Zip
Code
Median
Price
Home
Purchase
Investment
Purchase
%
Investors
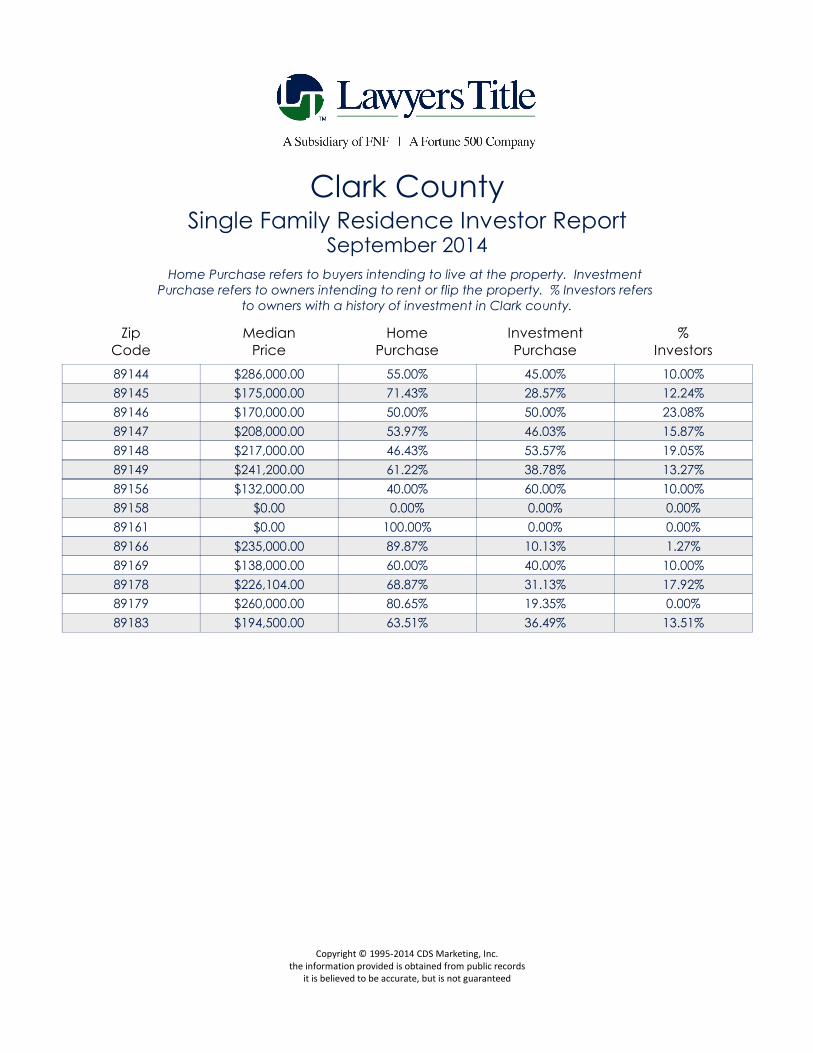
Clark CountySingle Family Residence Investor Report
Home Purchase refers to buyers intending to live at the property. Investment Purchase refers to owners intending to rent or flip the property. % Investors refers
to owners with a history of investment in Clark county.
September 2014
89144 $286,000.00 55.00% 45.00% 10.00%
89145 $175,000.00 71.43% 28.57% 12.24%
89146 $170,000.00 50.00% 50.00% 23.08%
89147 $208,000.00 53.97% 46.03% 15.87%
89148 $217,000.00 46.43% 53.57% 19.05%
89149 $241,200.00 61.22% 38.78% 13.27%
89156 $132,000.00 40.00% 60.00% 10.00%
89158 $0.00 0.00% 0.00% 0.00%
89161 $0.00 100.00% 0.00% 0.00%
89166 $235,000.00 89.87% 10.13% 1.27%
89169 $138,000.00 60.00% 40.00% 10.00%
89178 $226,104.00 68.87% 31.13% 17.92%
89179 $260,000.00 80.65% 19.35% 0.00%
89183 $194,500.00 63.51% 36.49% 13.51%
Copyright © 1995-2014 CDS Marketing, Inc.the information provided is obtained from public records
it is believed to be accurate, but is not guaranteed
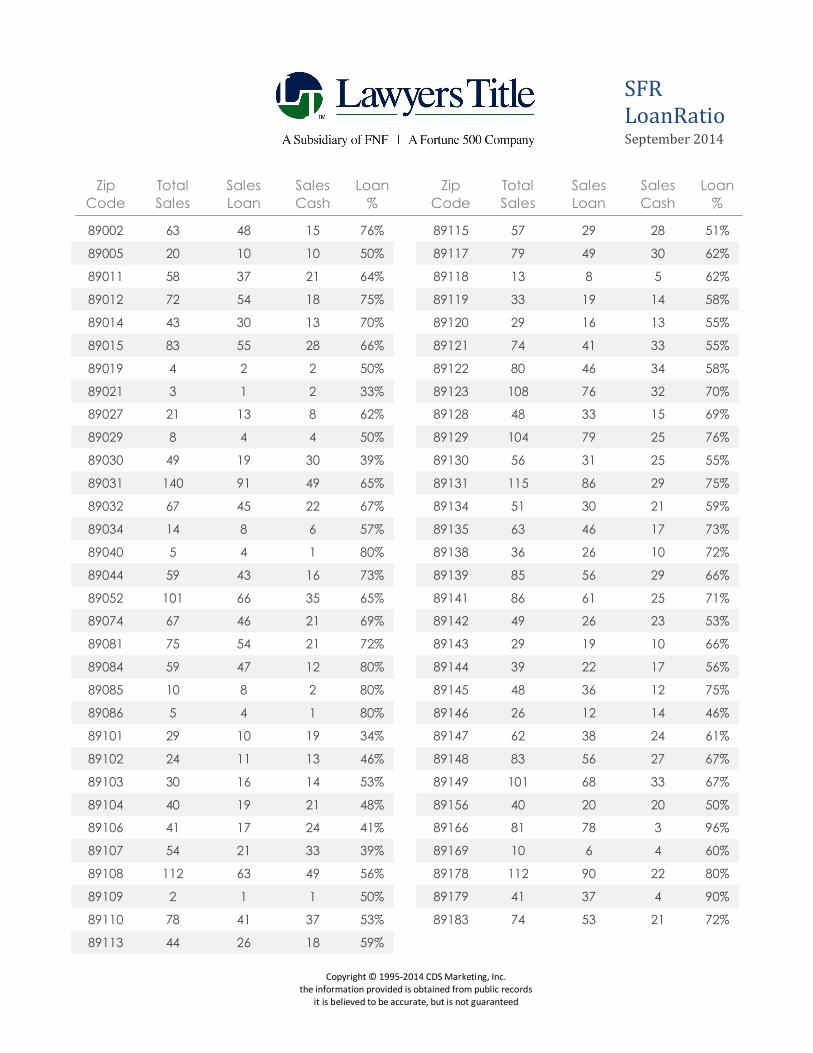
SFRLoanRatioSeptember 2014
ZipCode
TotalSales
SalesLoan
SalesCash
Loan%
ZipCode
TotalSales
SalesLoan
SalesCash
Loan%
89002 63 48 15 76%
89005 20 10 10 50%
89011 58 37 21 64%
89012 72 54 18 75%
89014 43 30 13 70%
89015 83 55 28 66%
89019 4 2 2 50%
89021 3 1 2 33%
89027 21 13 8 62%
89029 8 4 4 50%
89030 49 19 30 39%
89031 140 91 49 65%
89032 67 45 22 67%
89034 14 8 6 57%
89040 5 4 1 80%
89044 59 43 16 73%
89052 101 66 35 65%
89074 67 46 21 69%
89081 75 54 21 72%
89084 59 47 12 80%
89085 10 8 2 80%
89086 5 4 1 80%
89101 29 10 19 34%
89102 24 11 13 46%
89103 30 16 14 53%
89104 40 19 21 48%
89106 41 17 24 41%
89107 54 21 33 39%
89108 112 63 49 56%
89109 2 1 1 50%
89110 78 41 37 53%
89113 44 26 18 59%
89115 57 29 28 51%
89117 79 49 30 62%
89118 13 8 5 62%
89119 33 19 14 58%
89120 29 16 13 55%
89121 74 41 33 55%
89122 80 46 34 58%
89123 108 76 32 70%
89128 48 33 15 69%
89129 104 79 25 76%
89130 56 31 25 55%
89131 115 86 29 75%
89134 51 30 21 59%
89135 63 46 17 73%
89138 36 26 10 72%
89139 85 56 29 66%
89141 86 61 25 71%
89142 49 26 23 53%
89143 29 19 10 66%
89144 39 22 17 56%
89145 48 36 12 75%
89146 26 12 14 46%
89147 62 38 24 61%
89148 83 56 27 67%
89149 101 68 33 67%
89156 40 20 20 50%
89166 81 78 3 96%
89169 10 6 4 60%
89178 112 90 22 80%
89179 41 37 4 90%
89183 74 53 21 72%
Copyright © 1995-2014 CDS Marketing, Inc.the information provided is obtained from public records
it is believed to be accurate, but is not guaranteed
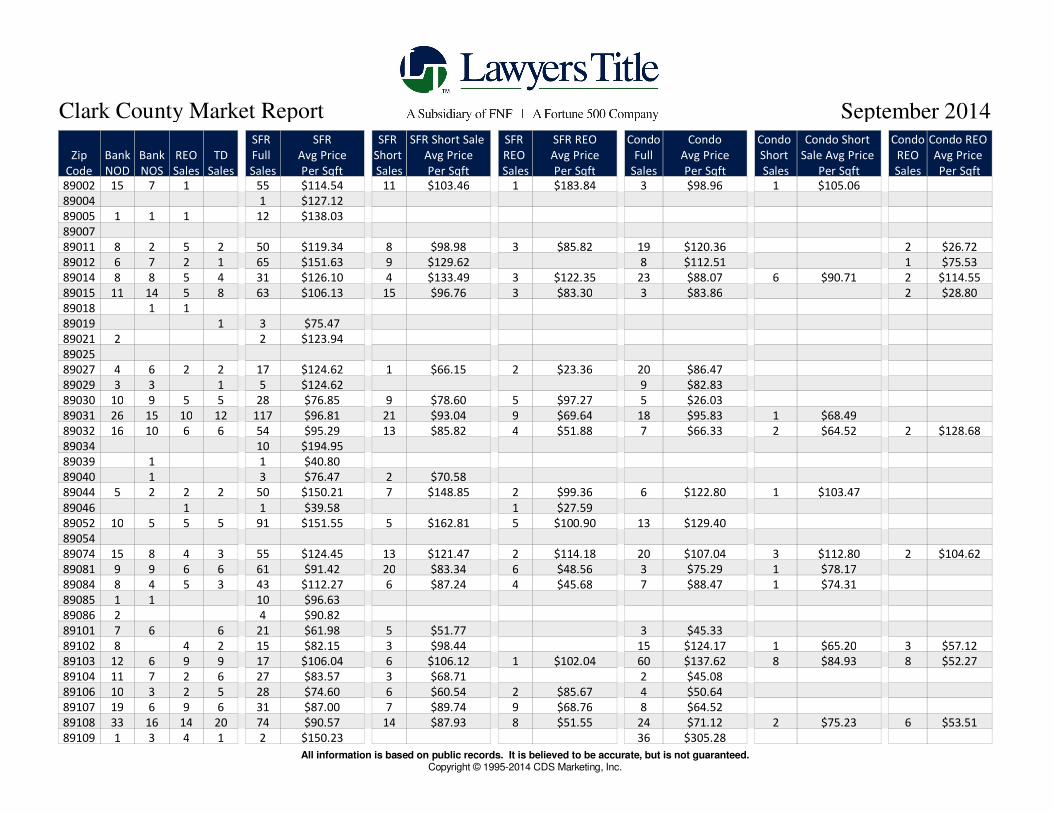
ZipCode
BankNOD
BankNOS
REOSales
TDSales
SFR Full Sales
SFRAvg PricePer Sqft
SFR Short Sales
SFR Short Sale Avg PricePer Sqft
SFR REO Sales
SFR REOAvg PricePer Sqft
Condo Full Sales
CondoAvg PricePer Sqft
Condo Short Sales
Condo Short Sale Avg Price
Per Sqft
Condo REO Sales
Condo REO Avg Price Per Sqft
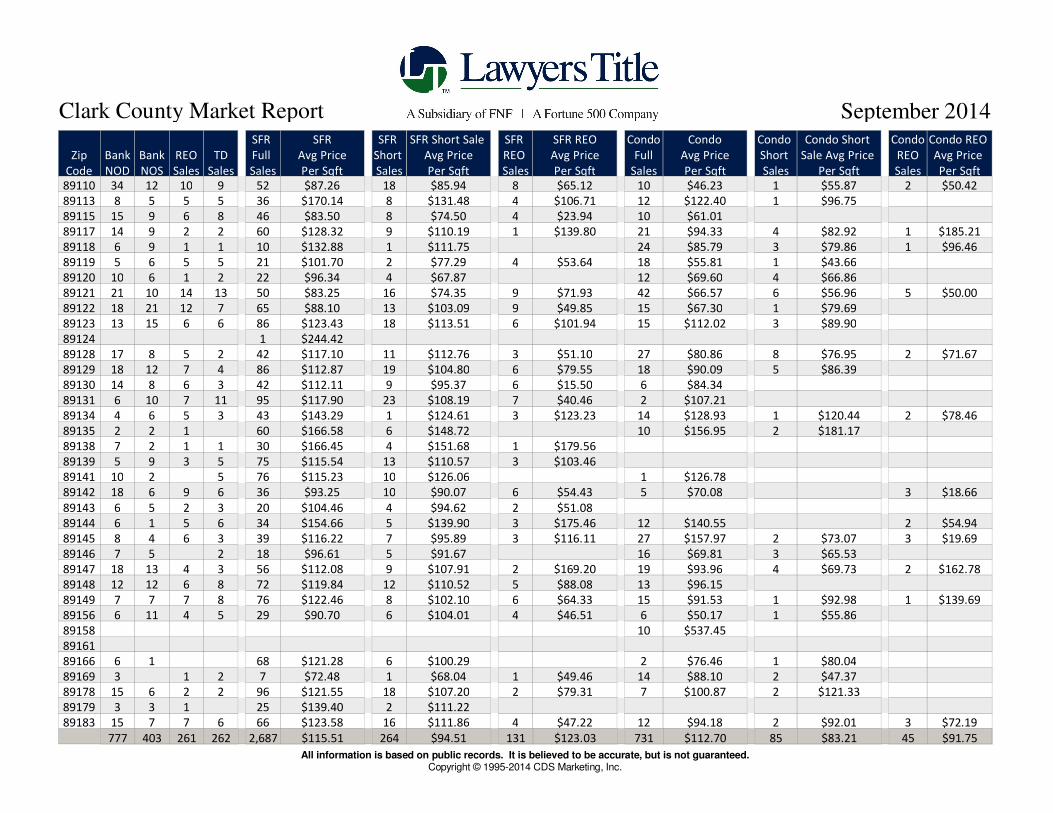
September 2014Clark County Market Report
89002 15 7 1 55 $114.54 11 $103.46 1 $183.84 3 $98.96 1 $105.0689004 1 $127.1289005 1 1 1 12 $138.038900789011 8 2 5 2 50 $119.34 8 $98.98 3 $85.82 19 $120.36 2 $26.7289012 6 7 2 1 65 $151.63 9 $129.62 8 $112.51 1 $75.5389014 8 8 5 4 31 $126.10 4 $133.49 3 $122.35 23 $88.07 6 $90.71 2 $114.5589015 11 14 5 8 63 $106.13 15 $96.76 3 $83.30 3 $83.86 2 $28.8089018 1 189019 1 3 $75.4789021 2 2 $123.948902589027 4 6 2 2 17 $124.62 1 $66.15 2 $23.36 20 $86.4789029 3 3 1 5 $124.62 9 $82.8389030 10 9 5 5 28 $76.85 9 $78.60 5 $97.27 5 $26.0389031 26 15 10 12 117 $96.81 21 $93.04 9 $69.64 18 $95.83 1 $68.4989032 16 10 6 6 54 $95.29 13 $85.82 4 $51.88 7 $66.33 2 $64.52 2 $128.6889034 10 $194.9589039 1 1 $40.8089040 1 3 $76.47 2 $70.5889044 5 2 2 2 50 $150.21 7 $148.85 2 $99.36 6 $122.80 1 $103.4789046 1 1 $39.58 1 $27.5989052 10 5 5 5 91 $151.55 5 $162.81 5 $100.90 13 $129.408905489074 15 8 4 3 55 $124.45 13 $121.47 2 $114.18 20 $107.04 3 $112.80 2 $104.6289081 9 9 6 6 61 $91.42 20 $83.34 6 $48.56 3 $75.29 1 $78.1789084 8 4 5 3 43 $112.27 6 $87.24 4 $45.68 7 $88.47 1 $74.3189085 1 1 10 $96.6389086 2 4 $90.8289101 7 6 6 21 $61.98 5 $51.77 3 $45.3389102 8 4 2 15 $82.15 3 $98.44 15 $124.17 1 $65.20 3 $57.1289103 12 6 9 9 17 $106.04 6 $106.12 1 $102.04 60 $137.62 8 $84.93 8 $52.2789104 11 7 2 6 27 $83.57 3 $68.71 2 $45.0889106 10 3 2 5 28 $74.60 6 $60.54 2 $85.67 4 $50.6489107 19 6 9 6 31 $87.00 7 $89.74 9 $68.76 8 $64.5289108 33 16 14 20 74 $90.57 14 $87.93 8 $51.55 24 $71.12 2 $75.23 6 $53.5189109 1 3 4 1 2 $150.23 36 $305.28
All information is based on public records. It is believed to be accurate, but is not guaranteed.Copyright © 1995-2014 CDS Marketing, Inc.
ZipCode
BankNOD
BankNOS
REOSales
TDSales
SFR Full Sales
SFRAvg PricePer Sqft
SFR Short Sales
SFR Short Sale Avg PricePer Sqft
SFR REO Sales
SFR REOAvg PricePer Sqft
Condo Full Sales
CondoAvg PricePer Sqft
Condo Short Sales
Condo Short Sale Avg Price
Per Sqft
Condo REO Sales
Condo REO Avg Price Per Sqft
September 2014Clark County Market Report
89110 34 12 10 9 52 $87.26 18 $85.94 8 $65.12 10 $46.23 1 $55.87 2 $50.4289113 8 5 5 5 36 $170.14 8 $131.48 4 $106.71 12 $122.40 1 $96.7589115 15 9 6 8 46 $83.50 8 $74.50 4 $23.94 10 $61.0189117 14 9 2 2 60 $128.32 9 $110.19 1 $139.80 21 $94.33 4 $82.92 1 $185.2189118 6 9 1 1 10 $132.88 1 $111.75 24 $85.79 3 $79.86 1 $96.4689119 5 6 5 5 21 $101.70 2 $77.29 4 $53.64 18 $55.81 1 $43.6689120 10 6 1 2 22 $96.34 4 $67.87 12 $69.60 4 $66.8689121 21 10 14 13 50 $83.25 16 $74.35 9 $71.93 42 $66.57 6 $56.96 5 $50.0089122 18 21 12 7 65 $88.10 13 $103.09 9 $49.85 15 $67.30 1 $79.6989123 13 15 6 6 86 $123.43 18 $113.51 6 $101.94 15 $112.02 3 $89.9089124 1 $244.4289128 17 8 5 2 42 $117.10 11 $112.76 3 $51.10 27 $80.86 8 $76.95 2 $71.6789129 18 12 7 4 86 $112.87 19 $104.80 6 $79.55 18 $90.09 5 $86.3989130 14 8 6 3 42 $112.11 9 $95.37 6 $15.50 6 $84.3489131 6 10 7 11 95 $117.90 23 $108.19 7 $40.46 2 $107.2189134 4 6 5 3 43 $143.29 1 $124.61 3 $123.23 14 $128.93 1 $120.44 2 $78.4689135 2 2 1 60 $166.58 6 $148.72 10 $156.95 2 $181.1789138 7 2 1 1 30 $166.45 4 $151.68 1 $179.5689139 5 9 3 5 75 $115.54 13 $110.57 3 $103.4689141 10 2 5 76 $115.23 10 $126.06 1 $126.7889142 18 6 9 6 36 $93.25 10 $90.07 6 $54.43 5 $70.08 3 $18.6689143 6 5 2 3 20 $104.46 4 $94.62 2 $51.0889144 6 1 5 6 34 $154.66 5 $139.90 3 $175.46 12 $140.55 2 $54.9489145 8 4 6 3 39 $116.22 7 $95.89 3 $116.11 27 $157.97 2 $73.07 3 $19.6989146 7 5 2 18 $96.61 5 $91.67 16 $69.81 3 $65.5389147 18 13 4 3 56 $112.08 9 $107.91 2 $169.20 19 $93.96 4 $69.73 2 $162.7889148 12 12 6 8 72 $119.84 12 $110.52 5 $88.08 13 $96.1589149 7 7 7 8 76 $122.46 8 $102.10 6 $64.33 15 $91.53 1 $92.98 1 $139.6989156 6 11 4 5 29 $90.70 6 $104.01 4 $46.51 6 $50.17 1 $55.8689158 10 $537.458916189166 6 1 68 $121.28 6 $100.29 2 $76.46 1 $80.0489169 3 1 2 7 $72.48 1 $68.04 1 $49.46 14 $88.10 2 $47.3789178 15 6 2 2 96 $121.55 18 $107.20 2 $79.31 7 $100.87 2 $121.3389179 3 3 1 25 $139.40 2 $111.2289183 15 7 7 6 66 $123.58 16 $111.86 4 $47.22 12 $94.18 2 $92.01 3 $72.19
777 403 261 262 2,687 $115.51 264 $94.51 131 $123.03 731 $112.70 85 $83.21 45 $91.75All information is based on public records. It is believed to be accurate, but is not guaranteed.
Copyright © 1995-2014 CDS Marketing, Inc.
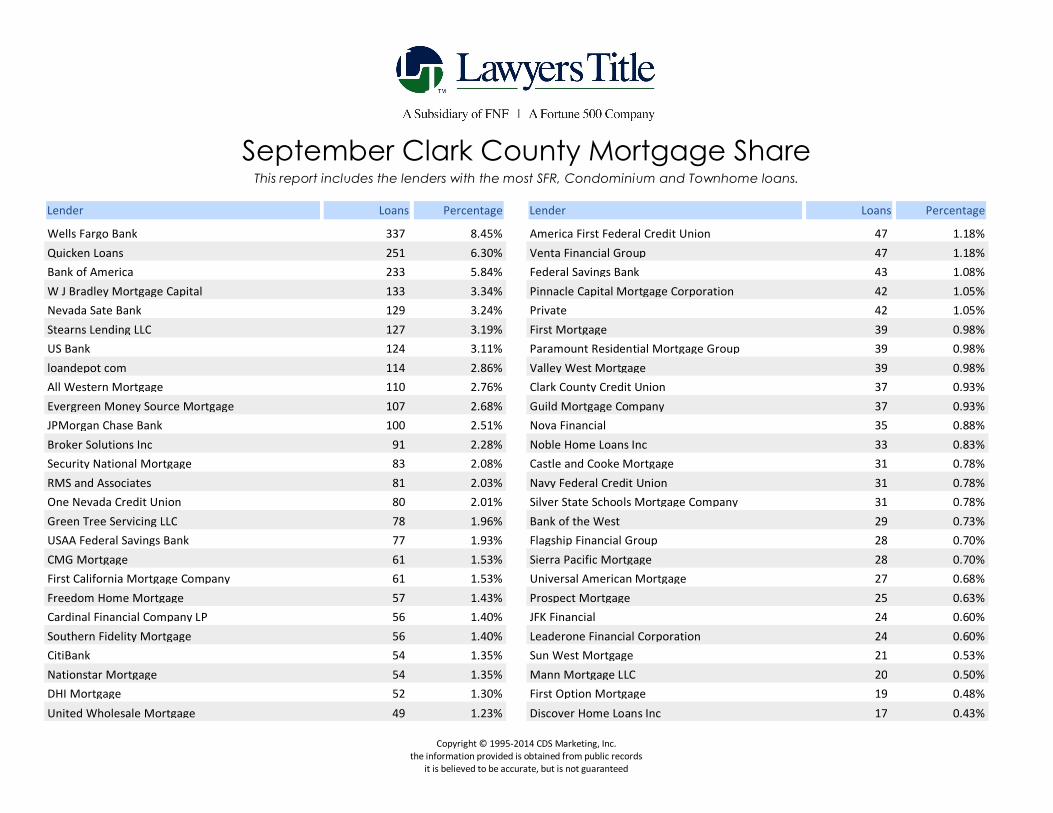
This report includes the lenders with the most SFR, Condominium and Townhome loans.
September Clark County Mortgage Share
Lender Loans Percentage
Wells Fargo Bank 337 8.45%Quicken Loans 251 6.30%Bank of America 233 5.84%W J Bradley Mortgage Capital 133 3.34%Nevada Sate Bank 129 3.24%Stearns Lending LLC 127 3.19%US Bank 124 3.11%loandepot com 114 2.86%All Western Mortgage 110 2.76%Evergreen Money Source Mortgage 107 2.68%JPMorgan Chase Bank 100 2.51%Broker Solutions Inc 91 2.28%Security National Mortgage 83 2.08%RMS and Associates 81 2.03%One Nevada Credit Union 80 2.01%Green Tree Servicing LLC 78 1.96%USAA Federal Savings Bank 77 1.93%CMG Mortgage 61 1.53%First California Mortgage Company 61 1.53%Freedom Home Mortgage 57 1.43%Cardinal Financial Company LP 56 1.40%Southern Fidelity Mortgage 56 1.40%CitiBank 54 1.35%Nationstar Mortgage 54 1.35%DHI Mortgage 52 1.30%United Wholesale Mortgage 49 1.23%
Lender Loans Percentage
America First Federal Credit Union 47 1.18%Venta Financial Group 47 1.18%Federal Savings Bank 43 1.08%Pinnacle Capital Mortgage Corporation 42 1.05%Private 42 1.05%First Mortgage 39 0.98%Paramount Residential Mortgage Group 39 0.98%Valley West Mortgage 39 0.98%Clark County Credit Union 37 0.93%Guild Mortgage Company 37 0.93%Nova Financial 35 0.88%Noble Home Loans Inc 33 0.83%Castle and Cooke Mortgage 31 0.78%Navy Federal Credit Union 31 0.78%Silver State Schools Mortgage Company 31 0.78%Bank of the West 29 0.73%Flagship Financial Group 28 0.70%Sierra Pacific Mortgage 28 0.70%Universal American Mortgage 27 0.68%Prospect Mortgage 25 0.63%JFK Financial 24 0.60%Leaderone Financial Corporation 24 0.60%Sun West Mortgage 21 0.53%Mann Mortgage LLC 20 0.50%First Option Mortgage 19 0.48%Discover Home Loans Inc 17 0.43%
Copyright © 1995-2014 CDS Marketing, Inc.the information provided is obtained from public records
it is believed to be accurate, but is not guaranteed

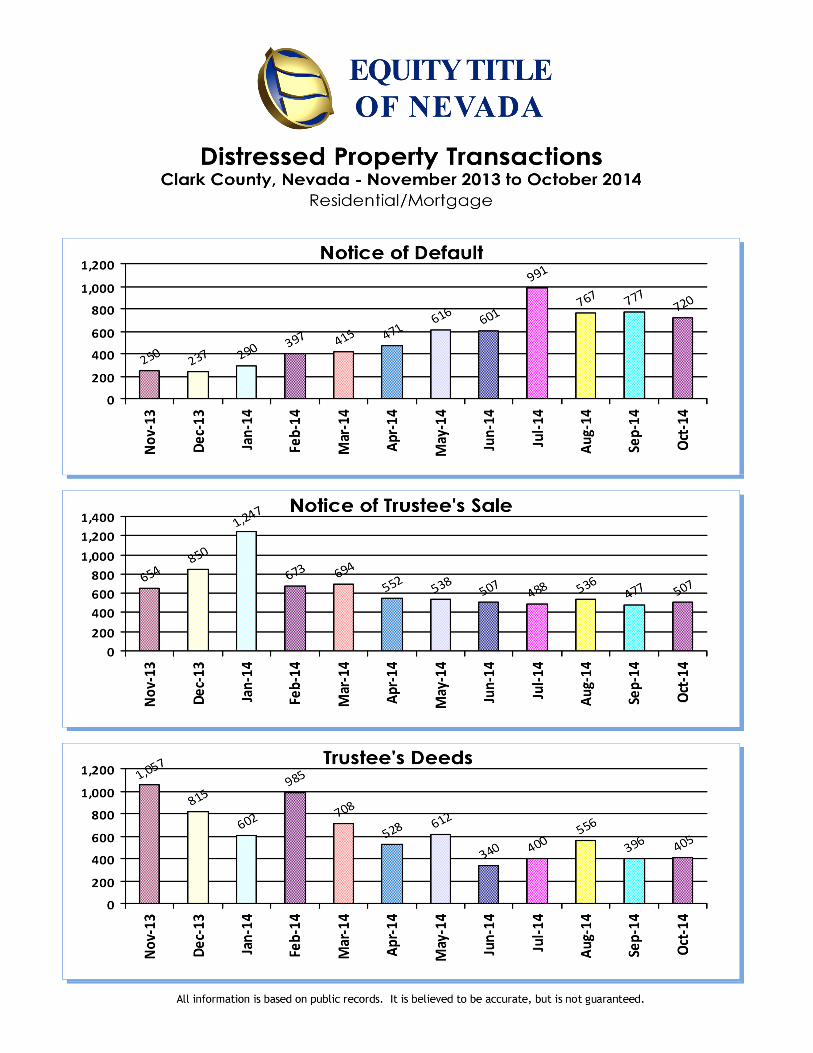
476654
850
1,247
673 694552 538 507 488 536 477
0200400600800
1,0001,2001,400
Oct-1
3
Nov-13
Dec-13
Jan-14
Feb-14
Mar-14
Apr-1
4
May-14
Jun-14
Jul-1
4
Aug-14
Sep-14
Distressed Property TransactionsClark County, Nevada - November 2013 to October 2014
175 250 237 290 397 415 471 616 601991 767 777
0500
1,0001,5002,0002,5003,0003,5004,000
Oct-13
Nov-13
Dec-13
Jan-14
Feb-14
Mar-14
Apr-1
4
May-14
Jun-14
Jul-1
4
Aug-14
Sep-14
Notice of Trustee's Sale
Notice of Default
721
1,057
815
602
985
708
528612
340 400556
396
0
200
400
600
800
1,000
1,200
Oct-1
3
Nov-13
Dec-13
Jan-14
Feb-14
Mar-14
Apr-1
4
May-14
Jun-14
Jul-1
4
Aug-14
Sep-14
Trustee's Deeds
Residential/Mortgage
All information is based on public records. It is believed to be accurate, but is not guaranteed.Copyright © 1995-2014 CDS Marketing, Inc.
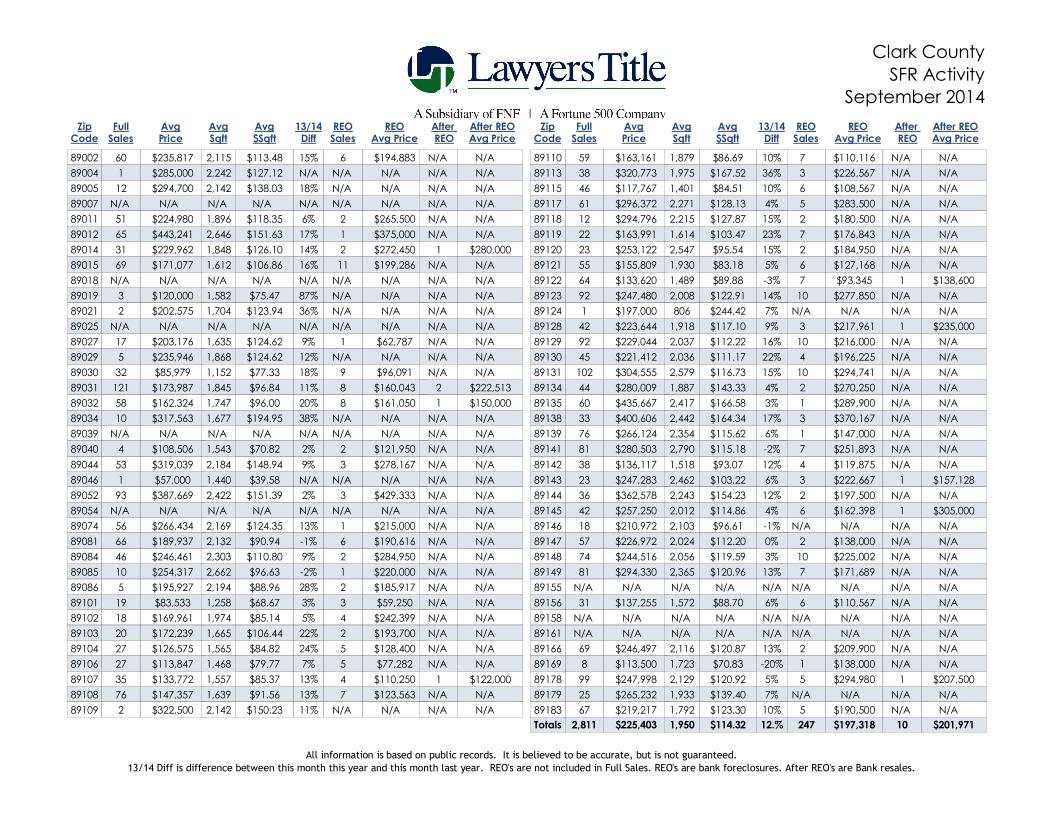
OLEBound56: Clark CountySFR Activity
September 2014Zip
CodeFull
SalesAvgPrice
AvgSqft
Avg$Sqft
REOSales
REOAvg Price
13/14Diff
ZipCode
FullSales
AvgPrice
AvgSqft
Avg$Sqft
REOSales
REOAvg Price
13/14Diff
After REO
After REOAvg Price
After REO
After REOAvg Price
N/A 89002 60 $235,817 $113.48 6 $194,8832,115 15% N/A N/A 89004 1 $285,000 $127.12 N/A N/A 2,242 N/A N/A N/A 89005 12 $294,700 $138.03 N/A N/A 2,142 18% N/A N/A 89007 N/A N/A N/A N/A N/A N/A N/A N/A N/A 89011 51 $224,980 $118.35 2 $265,5001,896 6% N/A N/A 89012 65 $443,241 $151.63 1 $375,0002,646 17% N/A
$280,00089014 31 $229,962 $126.10 2 $272,4501,848 14% 1N/A 89015 69 $171,077 $106.86 11 $199,2861,612 16% N/A N/A 89018 N/A N/A N/A N/A N/A N/A N/A N/A N/A 89019 3 $120,000 $75.47 N/A N/A 1,582 87% N/A N/A 89021 2 $202,575 $123.94 N/A N/A 1,704 36% N/A N/A 89025 N/A N/A N/A N/A N/A N/A N/A N/A N/A 89027 17 $203,176 $124.62 1 $62,7871,635 9% N/A N/A 89029 5 $235,946 $124.62 N/A N/A 1,868 12% N/A N/A 89030 32 $85,979 $77.33 9 $96,0911,152 18% N/A
$222,51389031 121 $173,987 $96.84 8 $160,0431,845 11% 2$150,00089032 58 $162,324 $96.00 8 $161,0501,747 20% 1
N/A 89034 10 $317,563 $194.95 N/A N/A 1,677 38% N/A N/A 89039 N/A N/A N/A N/A N/A N/A N/A N/A N/A 89040 4 $108,506 $70.82 2 $121,9501,543 2% N/A N/A 89044 53 $319,039 $148.94 3 $278,1672,184 9% N/A N/A 89046 1 $57,000 $39.58 N/A N/A 1,440 N/A N/A N/A 89052 93 $387,669 $151.39 3 $429,3332,422 2% N/A N/A 89054 N/A N/A N/A N/A N/A N/A N/A N/A N/A 89074 56 $266,434 $124.35 1 $215,0002,169 13% N/A N/A 89081 66 $189,937 $90.94 6 $190,6162,132 -1% N/A N/A 89084 46 $246,461 $110.80 2 $284,9502,303 9% N/A N/A 89085 10 $254,317 $96.63 1 $220,0002,662 -2% N/A N/A 89086 5 $195,927 $88.96 2 $185,9172,194 28% N/A N/A 89101 19 $83,533 $68.67 3 $59,2501,258 3% N/A N/A 89102 18 $169,961 $85.14 4 $242,3991,974 5% N/A N/A 89103 20 $172,239 $106.44 2 $193,7001,665 22% N/A N/A 89104 27 $126,575 $84.82 5 $128,4001,565 24% N/A N/A 89106 27 $113,847 $79.77 5 $77,2821,468 7% N/A
$122,00089107 35 $133,772 $85.37 4 $110,2501,557 13% 1N/A 89108 76 $147,357 $91.56 7 $123,5631,639 13% N/A N/A 89109 2 $322,500 $150.23 N/A N/A 2,142 11% N/A
N/A 89110 59 $163,161 $86.69 7 $110,1161,879 10% N/A N/A 89113 38 $320,773 $167.52 3 $226,5671,975 36% N/A N/A 89115 46 $117,767 $84.51 6 $108,5671,401 10% N/A N/A 89117 61 $296,372 $128.13 5 $283,5002,271 4% N/A N/A 89118 12 $294,796 $127.87 2 $180,5002,215 15% N/A N/A 89119 22 $163,991 $103.47 7 $176,8431,614 23% N/A N/A 89120 23 $253,122 $95.54 2 $184,9502,547 15% N/A N/A 89121 55 $155,809 $83.18 6 $127,1681,930 5% N/A
$138,60089122 64 $133,620 $89.88 7 $93,3451,489 -3% 1N/A 89123 92 $247,480 $122.91 10 $277,8502,008 14% N/A N/A 89124 1 $197,000 $244.42 N/A N/A 806 7% N/A
$235,00089128 42 $223,644 $117.10 3 $217,9611,918 9% 1N/A 89129 92 $229,044 $112.22 10 $216,0002,037 16% N/A N/A 89130 45 $221,412 $111.17 4 $196,2252,036 22% N/A N/A 89131 102 $304,555 $116.73 10 $294,7412,579 15% N/A N/A 89134 44 $280,009 $143.33 2 $270,2501,887 4% N/A N/A 89135 60 $435,667 $166.58 1 $289,9002,417 3% N/A N/A 89138 33 $400,606 $164.34 3 $370,1672,442 17% N/A N/A 89139 76 $266,124 $115.62 1 $147,0002,354 6% N/A N/A 89141 81 $280,503 $115.18 7 $251,8932,790 -2% N/A N/A 89142 38 $136,117 $93.07 4 $119,8751,518 12% N/A
$157,12889143 23 $247,283 $103.22 3 $222,6672,462 6% 1N/A 89144 36 $362,578 $154.23 2 $197,5002,243 12% N/A
$305,00089145 42 $257,250 $114.86 6 $162,3982,012 4% 1N/A 89146 18 $210,972 $96.61 N/A N/A 2,103 -1% N/A N/A 89147 57 $226,972 $112.20 2 $138,0002,024 0% N/A N/A 89148 74 $244,516 $119.59 10 $225,0022,056 3% N/A N/A 89149 81 $294,330 $120.96 7 $171,6892,365 13% N/A N/A 89155 N/A N/A N/A N/A N/A N/A N/A N/A N/A 89156 31 $137,255 $88.70 6 $110,5671,572 6% N/A N/A 89158 N/A N/A N/A N/A N/A N/A N/A N/A N/A 89161 N/A N/A N/A N/A N/A N/A N/A N/A N/A 89166 69 $246,497 $120.87 2 $209,9002,116 13% N/A N/A 89169 8 $113,500 $70.83 1 $138,0001,723 -20% N/A
$207,50089178 99 $247,998 $120.92 5 $294,9802,129 5% 1N/A 89179 25 $265,232 $139.40 N/A N/A 1,933 7% N/A N/A 89183 67 $219,217 $123.30 5 $190,5001,792 10% N/A
$201,971Totals 2,811 $225,403 $114.32 247 $197,3181,950 12.% 10
All information is based on public records. It is believed to be accurate, but is not guaranteed.13/14 Diff is difference between this month this year and this month last year. REO's are not included in Full Sales. REO's are bank foreclosures. After REO's are Bank resales.
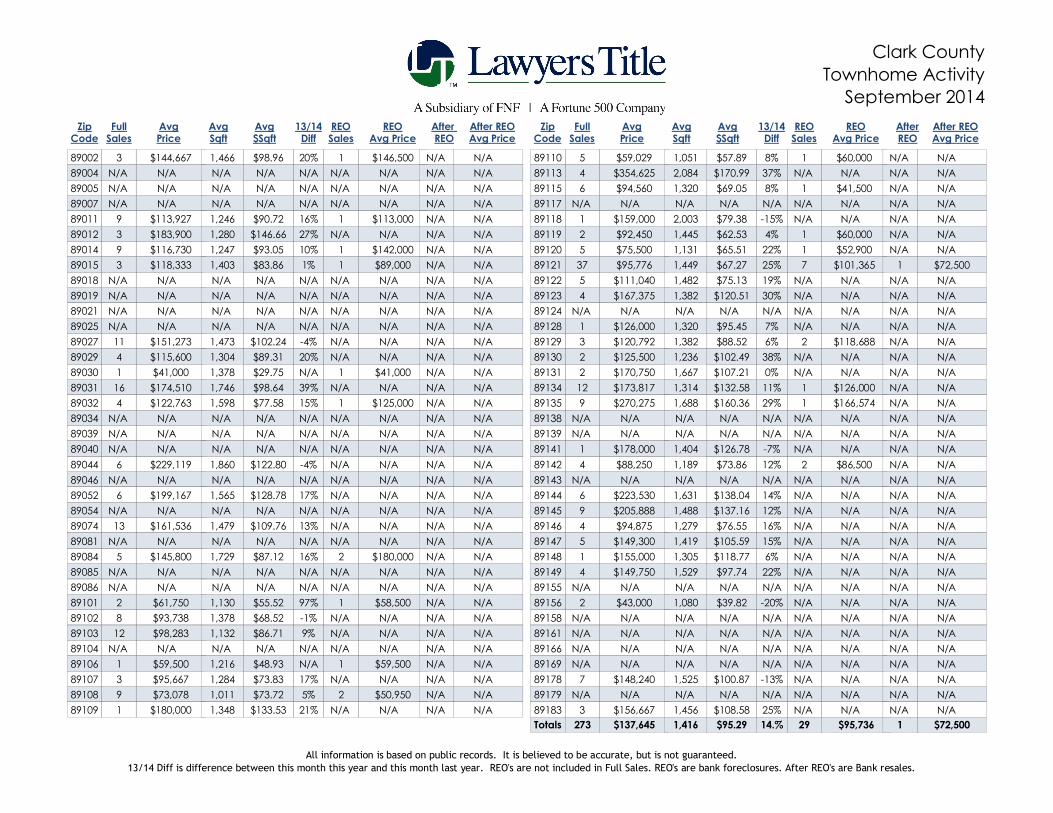
OLEBound56: Clark County
Townhome Activity
September 2014
ZipCode
FullSales
AvgPrice
AvgSqft
Avg$Sqft
REOSales
REOAvg Price
13/14Diff
ZipCode
FullSales
AvgPrice
AvgSqft
Avg$Sqft
REOSales
REOAvg Price
13/14Diff
After REO
After REOAvg Price
AfterREO
After REOAvg Price
N/A 89002 3 $144,667 $98.96 1 $146,5001,466 20% N/A
N/A 89004 N/A N/A N/A N/A N/A N/A N/A N/A
N/A 89005 N/A N/A N/A N/A N/A N/A N/A N/A
N/A 89007 N/A N/A N/A N/A N/A N/A N/A N/A
N/A 89011 9 $113,927 $90.72 1 $113,0001,246 16% N/A
N/A 89012 3 $183,900 $146.66 N/A N/A 1,280 27% N/A
N/A 89014 9 $116,730 $93.05 1 $142,0001,247 10% N/A
N/A 89015 3 $118,333 $83.86 1 $89,0001,403 1% N/A
N/A 89018 N/A N/A N/A N/A N/A N/A N/A N/A
N/A 89019 N/A N/A N/A N/A N/A N/A N/A N/A
N/A 89021 N/A N/A N/A N/A N/A N/A N/A N/A
N/A 89025 N/A N/A N/A N/A N/A N/A N/A N/A
N/A 89027 11 $151,273 $102.24 N/A N/A 1,473 -4% N/A
N/A 89029 4 $115,600 $89.31 N/A N/A 1,304 20% N/A
N/A 89030 1 $41,000 $29.75 1 $41,0001,378 N/A N/A
N/A 89031 16 $174,510 $98.64 N/A N/A 1,746 39% N/A
N/A 89032 4 $122,763 $77.58 1 $125,0001,598 15% N/A
N/A 89034 N/A N/A N/A N/A N/A N/A N/A N/A
N/A 89039 N/A N/A N/A N/A N/A N/A N/A N/A
N/A 89040 N/A N/A N/A N/A N/A N/A N/A N/A
N/A 89044 6 $229,119 $122.80 N/A N/A 1,860 -4% N/A
N/A 89046 N/A N/A N/A N/A N/A N/A N/A N/A
N/A 89052 6 $199,167 $128.78 N/A N/A 1,565 17% N/A
N/A 89054 N/A N/A N/A N/A N/A N/A N/A N/A
N/A 89074 13 $161,536 $109.76 N/A N/A 1,479 13% N/A
N/A 89081 N/A N/A N/A N/A N/A N/A N/A N/A
N/A 89084 5 $145,800 $87.12 2 $180,0001,729 16% N/A
N/A 89085 N/A N/A N/A N/A N/A N/A N/A N/A
N/A 89086 N/A N/A N/A N/A N/A N/A N/A N/A
N/A 89101 2 $61,750 $55.52 1 $58,5001,130 97% N/A
N/A 89102 8 $93,738 $68.52 N/A N/A 1,378 -1% N/A
N/A 89103 12 $98,283 $86.71 N/A N/A 1,132 9% N/A
N/A 89104 N/A N/A N/A N/A N/A N/A N/A N/A
N/A 89106 1 $59,500 $48.93 1 $59,5001,216 N/A N/A
N/A 89107 3 $95,667 $73.83 N/A N/A 1,284 17% N/A
N/A 89108 9 $73,078 $73.72 2 $50,9501,011 5% N/A
N/A 89109 1 $180,000 $133.53 N/A N/A 1,348 21% N/A
N/A 89110 5 $59,029 $57.89 1 $60,0001,051 8% N/A
N/A 89113 4 $354,625 $170.99 N/A N/A 2,084 37% N/A
N/A 89115 6 $94,560 $69.05 1 $41,5001,320 8% N/A
N/A 89117 N/A N/A N/A N/A N/A N/A N/A N/A
N/A 89118 1 $159,000 $79.38 N/A N/A 2,003 -15% N/A
N/A 89119 2 $92,450 $62.53 1 $60,0001,445 4% N/A
N/A 89120 5 $75,500 $65.51 1 $52,9001,131 22% N/A
$72,50089121 37 $95,776 $67.27 7 $101,3651,449 25% 1
N/A 89122 5 $111,040 $75.13 N/A N/A 1,482 19% N/A
N/A 89123 4 $167,375 $120.51 N/A N/A 1,382 30% N/A
N/A 89124 N/A N/A N/A N/A N/A N/A N/A N/A
N/A 89128 1 $126,000 $95.45 N/A N/A 1,320 7% N/A
N/A 89129 3 $120,792 $88.52 2 $118,6881,382 6% N/A
N/A 89130 2 $125,500 $102.49 N/A N/A 1,236 38% N/A
N/A 89131 2 $170,750 $107.21 N/A N/A 1,667 0% N/A
N/A 89134 12 $173,817 $132.58 1 $126,0001,314 11% N/A
N/A 89135 9 $270,275 $160.36 1 $166,5741,688 29% N/A
N/A 89138 N/A N/A N/A N/A N/A N/A N/A N/A
N/A 89139 N/A N/A N/A N/A N/A N/A N/A N/A
N/A 89141 1 $178,000 $126.78 N/A N/A 1,404 -7% N/A
N/A 89142 4 $88,250 $73.86 2 $86,5001,189 12% N/A
N/A 89143 N/A N/A N/A N/A N/A N/A N/A N/A
N/A 89144 6 $223,530 $138.04 N/A N/A 1,631 14% N/A
N/A 89145 9 $205,888 $137.16 N/A N/A 1,488 12% N/A
N/A 89146 4 $94,875 $76.55 N/A N/A 1,279 16% N/A
N/A 89147 5 $149,300 $105.59 N/A N/A 1,419 15% N/A
N/A 89148 1 $155,000 $118.77 N/A N/A 1,305 6% N/A
N/A 89149 4 $149,750 $97.74 N/A N/A 1,529 22% N/A
N/A 89155 N/A N/A N/A N/A N/A N/A N/A N/A
N/A 89156 2 $43,000 $39.82 N/A N/A 1,080 -20% N/A
N/A 89158 N/A N/A N/A N/A N/A N/A N/A N/A
N/A 89161 N/A N/A N/A N/A N/A N/A N/A N/A
N/A 89166 N/A N/A N/A N/A N/A N/A N/A N/A
N/A 89169 N/A N/A N/A N/A N/A N/A N/A N/A
N/A 89178 7 $148,240 $100.87 N/A N/A 1,525 -13% N/A
N/A 89179 N/A N/A N/A N/A N/A N/A N/A N/A
N/A 89183 3 $156,667 $108.58 N/A N/A 1,456 25% N/A
$72,500Totals 273 $137,645 $95.29 29 $95,7361,416 14.% 1
All information is based on public records. It is believed to be accurate, but is not guaranteed.13/14 Diff is difference between this month this year and this month last year. REO's are not included in Full Sales. REO's are bank foreclosures. After REO's are Bank resales.