las vegas sands corp. -...
TRANSCRIPT
Las Vegas Sands Corp.Citi Global EMT ConferenceJanuary 7, 2009
Venetian Las VegasVenetian Las Vegas
Sands MacaoSands Macao
Palazzo Las Vegas Palazzo Las Vegas
Venetian MacaoVenetian Macao
Sands BethlehemSands Bethlehem
Marina Bay SandsMarina Bay Sands

11
$2.1 billion capital raise fully funds the Company’s revised business plan
Revised business plan includes right-sizing of global development project pipeline
Company will pursue opportunities for non-core asset monetization and de-leveraging
− ~2 million sq ft of premium retail space in Macao and Singapore for monetization
Revised Business Plan

22
What Has Changed:− Scaled back development pipeline given turmoil in credit markets and challenging
economic conditions
− Belts and suspenders on current and future developments
− Contingency plans in place
Revised Business Plan
− World’s leading developer of integrated resorts
− Monetization of non-core assets remains a key driver of de-leveragingstrategy
− Focus on maximizing returns on net invested capital
What Remains the Same:
− Highest quality assets in the marketplace
− Basic Strategy has not changed:

33
Maximizing cash flow from current operations
De-leveraging
Prudent development
Our Top Priorities
− Delivering Singapore and Bethlehem on timeand on budget

44
Source: LVS Management estimates.Source: LVS Management estimates.1.1. As of September 30, 2008. Excludes construction period interestAs of September 30, 2008. Excludes construction period interest..2.2. Consists of completion costs, accrued payables and friction costConsists of completion costs, accrued payables and friction costs associated with revised development plans.s associated with revised development plans.3.3. Represents estimated equity contribution; project financing sourRepresents estimated equity contribution; project financing sources also include SGD5.44 billion (US$3.80 billion at September 3ces also include SGD5.44 billion (US$3.80 billion at September 30,2008 exchange rate) of 0,2008 exchange rate) of
Singapore bank debt raised in 2007.Singapore bank debt raised in 2007.
Revised Development Plan$2.1 Billion Capital Raise Fully Funds Revised Plan
Build Build Suspend (Temp.) Suspend (Indef.)Marina Bay Sands Sands Bethlehem Sites 5&6 St. Regis LV Condos
Updated Development Plan
Project scope as originally planned
Project targeted to open certain features in December 2009
Continue building casino portion
Broad range of dining, entertainment, and non-gaming amenities to be completed post-opening
Revised plan is to resume build of other components once economic and capital markets conditions improve
Sequence project to focus on Phase I (casino, Shangri-La / Traders tower and first Sheraton tower)
Temporarily suspend completion of Phase I while pursuing project-level financing
9 months of construction to complete Phase I
Suspend Phase II until economic and capital markets conditions improve
Indefinitely suspend construction until economic and capital markets conditions improve
Potential for net sales proceeds of $1.2 billion
18 months of construction to complete
Expected Opening Date 4Q 2009 June 2009 TBD TBD
Amount Spent to Date1 $1,870 $316 $1,160 $86Est. Funding Needs2 $5113 $427 $881 $95
(US$ in millions)(US$ in millions)

Potential Risks to the Plan
− EBITDA cure provides cushionWeak overall US performance
− $100+ million cost cutting initiativesignificantly reduces revenue risk inplan
− Flexible business model and 7,100 roomproduct allow us to drive occupancy andslot revenues and to manage total yield
Underperformance in Las Vegas
− Intention to monetize current cash flowfrom existing retail assets in Macao
Proceeds from Macao Four Seasons Private Apartments are less than expected
− Scaled down project on track -- June 2009Sands Bethlehem opens late
MitigationsRisks
5

Cash Balances and Sources of LiquidityAs of September 30, 2008
Source: LVS Public FilingsSource: LVS Public Filings1. Excludes potential Four Seasons Private Apartments sales, oth1. Excludes potential Four Seasons Private Apartments sales, other asset sales, and cash flows from current and future operationer asset sales, and cash flows from current and future operations. s. 2. Reflects amount available net of outstanding letters of credi2. Reflects amount available net of outstanding letters of credit.t.3. Available on a 75% / 25% ratio of credit facility to equity c3. Available on a 75% / 25% ratio of credit facility to equity contributions into the project basis.ontributions into the project basis.
6
(US$ in millions)(US$ in millions)
$ 6,201TOTAL
$ 201400
2,000
US Revolver Availability2
US Delayed Draw IISGD 5.44 billion Singapore Credit Facility3
$ 3,600Pro Forma Cash, Cash Equivalents & Restricted Cash
2,085Net Proceeds from Offerings
239Restricted Cash (principally for construction in Singapore & Macao)
$ 1,276Cash and Cash Equivalents
Additional Sources of Liquidity1
Real Estate Monetization (Four Seasons Co-op, malls) $ 1,000 – $ 3,000

$ 5,396$ 95$ 881$ 4633$ 427$ 3,5304Estimated Remaining Cost1
$ 9,465$ 181$ 2,041$ 1,1003$ 743$ 5,4002Estimated Total Cost1
$ 4,069$ 86$ 1,160$ 637$ 316$ 1,870Amount AlreadySpent at 9/30/08
$ 4,006
$ 1,390
$ 95$ 881$ 390$ 340$ 2,300Estimated Remaining
Amount to be SpentThrough Opening Date/Final Suspension
--$ 73$ 87$ 1,230Estimated Amount to beFunded Post Opening
Project Funding UpdateAs of September 30, 2008
Marina Bay Sands
Four Seasons Macao & Private
ApartmentsSites5 & 6
Sands Bethlehem
St. Regis LV Condos Total
1. Includes projected cost to build, Pre1. Includes projected cost to build, Pre--opening and FF&E costs.opening and FF&E costs.2. Would be $5,279 million at January 6, 2009 SGD / USD exchange2. Would be $5,279 million at January 6, 2009 SGD / USD exchange rate of 1.4791. rate of 1.4791. 3. Excludes land premium payments. 3. Excludes land premium payments. 4. Would be $3,466 million at January 6, 2009 SGD / USD exchange4. Would be $3,466 million at January 6, 2009 SGD / USD exchange rate of 1.4791.rate of 1.4791.
Suspend (Temp.) Suspended
7
(US$ in millions)(US$ in millions)

Balance Interest Rate Maturity DateUS Facility
Term B $2,963 LIBOR + 1.75% or Base + 0.75% May 2014Delayed Draw I 599 LIBOR + 1.75% or Base + 0.75% May 2014Revolver 776 LIBOR + 1.50% or Base + 0.50% May 2012Senior Notes 249 6.375% Feb 2015FF&E 150 LIBOR + 2.00% or Base + 1.00% Jun 2011Airplane 87 LIBOR + 1.50% & LIBOR + 1.25% Mar 2017Other 6 WSJ Prime + 0.75% Oct 2011
Macao Facility
Term B $1,800 LIBOR + 2.25% or Base + 1.25% May 2013Term B Delayed 700 LIBOR + 2.25% or Base + 1.25% May 2012Revolver 694 LIBOR + 2.25% or Base + 1.25% May 2011Local Term 100 HIBOR + 2.25% or Base + 1.25% May 2011Ferry 177 HIBOR + 2.00% or LIBOR + 2.00% Jan 2018Other 11 HIBOR + 2.25% Dec 2011
Singapore Facility
Term A & B $1,565 Singapore SOR + 2.25% Mar 2015
LVS Debt StructureAs of September 30, 20081
(US$ in millions)(US$ in millions)
81. Pro forma to reflect conversion of $475 million of convertibl1. Pro forma to reflect conversion of $475 million of convertible senior notes which occurred on November 14, 2008.e senior notes which occurred on November 14, 2008.
Total Debt $9,877
Weighted average interest rate for 9 months ended September 30: ~5.05%

Credit Facilities Summary
Very favorable terms
Flexibility
Long dated -- no significant maturities until:
9
− May 2011 -- Macao
− May 2012 -- Domestic
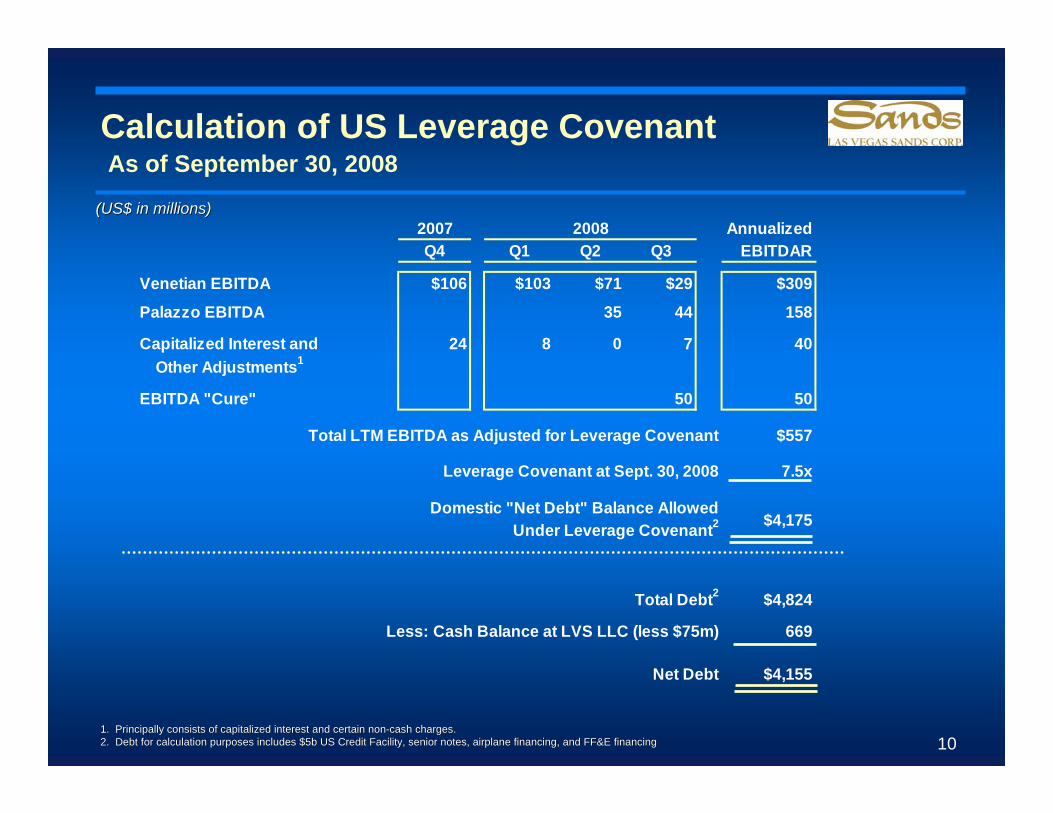
Calculation of US Leverage CovenantAs of September 30, 2008
1. Principally consists of capitalized interest and certain non1. Principally consists of capitalized interest and certain non--cash charges.cash charges.2. Debt for calculation purposes includes $5b US Credit Facilit2. Debt for calculation purposes includes $5b US Credit Facility, senior notes, airplane financing, and FF&E financingy, senior notes, airplane financing, and FF&E financing 10
(US$ in millions)(US$ in millions)2007 AnnualizedQ4 Q1 Q2 Q3 EBITDAR
Venetian EBITDA $106 $103 $71 $29 $309
Palazzo EBITDA 35 44 158
Capitalized Interest and 24 8 0 7 40 Other Adjustments1
EBITDA "Cure" 50 50
Total LTM EBITDA as Adjusted for Leverage Covenant $557
Leverage Covenant at Sept. 30, 2008 7.5x
Domestic "Net Debt" Balance AllowedUnder Leverage Covenant2
Total Debt2 $4,824
Less: Cash Balance at LVS LLC (less $75m) 669
Net Debt $4,155
2008
$4,175

1111
U.S. UpdateU.S. Update

12
The Venetian Resort-Hotel-CasinoLas Vegas
An established, premium property with strong operating and financial history
− LTM Q3 2008 Adj. EBITDAR of $314 million1
− 92.2% occupancy and $248 ADR for LTM ended September 30, 2008
4,027 all-suite hotel rooms
Casino with 130 tables, 1,550 slots, a poker room and sportsbook
2.3 million sq ft of convention and meeting space in Sands Expo Center (SECC) and Congress Center
Grand Canal Shoppes, a world class Venice-themed shopping mall totaling 400,000 sq. ft. (sold to GGP)
Restaurants housing celebrity chefs like Keller, Batali, Emeril, Puck and food court operations
Numerous premium attractions including Canyon Ranch Spa Club, Wayne Brady, Blue Man Group and Phantom of the Opera
1.1. Includes SECC.Includes SECC.

1313
The Palazzo Resort-Hotel-CasinoLas Vegas
World-class luxury destination casino-resort
− Fully integrated with the Venetian and SECC
− Opened 12/30/07
− 9-months Adj. EBITDAR through Q3 2008 of $96 million
− 94.5% occupancy and $231 ADR for 3 months ended September 30, 2008
3,066-suite, 50-floor hotel tower
Casino with 130 tables and 1,375 slots
1,600-seat theater that hosts Jersey Boys, a major Broadway show
− Other amenities include Canyon Ranch Spa Club and destination restaurants such as Mario Batali’s Carnevino, Wolfgang Puck’s Cut, Sushi Samba, and Lavo (Tao)
400,000 sq ft Shoppes at The Palazzo anchored by Barney’s New York (sold to GGP)
Las Vegas OperationsLas Vegas Operations¹¹Rolling LTM Adj. EBITDAR and Margin Rolling LTM Adj. EBITDAR and Margin ($mm)($mm)
Source: Public filings. Source: Public filings. 1.1. Includes Venetian, Palazzo and SECC. EBITDAR and margin figures Includes Venetian, Palazzo and SECC. EBITDAR and margin figures represent LTM data ending in quarter shown; ADR and occupancy rerepresent LTM data ending in quarter shown; ADR and occupancy represent end of quarter data.present end of quarter data.
$390
$359$370
$395$408
38.0% 36.0% 35.0% 34.0% 32.0%
3Q07 4Q07 1Q08 2Q08 3Q08
ADR: $234 $258 $264 $244 $218
Occupancy: 99.6% 94.8% 86.4% 91.6% 93.1%

Las Vegas Strategy UpdateCost Savings Program at Venetian and Palazzo
Annualized targeted savings > $100 million$68 million run-rate savings implemented through 9/30/08Fully integrated into 2009 operating plan
Summary
Breakdown Expense savings: ~60%Labor savings: ~40%
Top Initiatives
Headcount Labor efficiencyBenefitsPromotional expensesProcurement/Vendor pricing
14

1515
124-acre development on former site of historic Bethlehem Steel Works
− ~85 miles from midtown Manhattan
Revised plan is to complete casino portion of Sands Bethlehem
− Casino with 5,000 slot machines¹
− Includes parking and restaurants
− Expected to open in 2Q 2009
Updated budget of $743 million for casino portion
− $115 million of savings
Broad range of dining, entertainment, and non-gaming amenities to be completed post-opening
− Revised plan is to resume build of other components once economic and capital markets conditions improve
− Attractive incremental ROI
1.1. In accordance with Pennsylvania gaming regulations, for the firsIn accordance with Pennsylvania gaming regulations, for the first six months of operations, only 3,000 slot machines may be opert six months of operations, only 3,000 slot machines may be operated, with another 2,000 to ated, with another 2,000 to be installed six months subsequent to opening.be installed six months subsequent to opening.
Sands Casino-Resort BethlehemBethlehem, Pennsylvania

Bethlehem StrategyRelative Strength of Pennsylvania Gaming Market
Healthy state gaming revenue growth despite declines in Atlantic City
Market growth is driven by supply growth: PA is a new and developing gaming market
− Year over Year slot revenue growth of 59% (Jan – Nov 2008 vs. Jan – Nov 2007)
− November 2008 slot revenue growth of 23% compared to November 2007
16
− Same store slot revenue growth of 13% (Jan – Nov 2008 vs. Jan – Nov 2007)
Prime location positioned to serve the wealthy I-78 Corridor
Source: Pennsylvania Gaming Control BoardSource: Pennsylvania Gaming Control Board

17
Philadelphia ParkPhiladelphia Park $337$337 2,8362,836
HarrahHarrah’’s Chester s Chester $323$323 2,8262,826
Mohegan SunMohegan Sun $284$284 1,7901,790
Win per UnitWin per UnitPer DayPer Day # of Slots# of Slots
Bethlehem StrategyYTD 2008 Market Results1
Source: Pennsylvania Gaming Control BoardSource: Pennsylvania Gaming Control Board1. Represents January through November, 20081. Represents January through November, 2008

Bethlehem Strategy8 of America’s 100 Wealthiest Counties
Source: Google EarthSource: Google Earth18

1919
Macao UpdateMacao Update

2020
First modern Las Vegas-style facility in Macao when it opened in May 2004
Superior return on investment
− All cash flow generated since opening has been re-invested into Macao
− LTM Q3 2008 Adj. EBITDAR of $239 million
− 98.8% occupancy and $258 ADR for 3 months ended September 30, 2008
Broad range of dining, entertainment and gaming amenities
Casino with 505 tables and 1,250 slots
298 luxury suites (near 100% occupancy since new tower opened in 3Q 2007)
Convenient location near existing Macao ferry terminal
Sands Macao
Rolling LTM Adj. EBITDAR and MarginRolling LTM Adj. EBITDAR and Margin¹¹ ($mm)($mm)
$457$407
$374$337
$274$239
32.0%30.0%
28.0% 27.0%24.0%
22.0%
2Q07 3Q07 4Q07 1Q08 2Q08 3Q08
ADR: $389 $316 $254 $278 $264 $258
Occupancy: 97.0% 94.1% 97.8% 97.5% 98.8% 98.8%Source: Public filings.Source: Public filings.1.1. EBITDAR and margin figures represent LTM data ending in quarter EBITDAR and margin figures represent LTM data ending in quarter shown; ADR and occupancy represent end of quarter data.shown; ADR and occupancy represent end of quarter data.

Sands Macao Gaming Volume
3,514
5,646
6,8577,263
6,2875,918
5,608
6,181
7,256
1,041 1,035 1,037 901 812 775 658 652724
0
1,000
2,000
3,000
4,000
5,000
6,000
7,000
8,000
3Q06 4Q06 1Q07 2Q07 3Q07 4Q07 1Q08 2Q08 3Q08-20%
-10%
0%
10%
20%
30%
40%
50%
60%
70%
Rolling Volume Non-Rolling DropSequential Rolling Volume growth Sequential Non-Rolling Drop growth
(US$ mm)
21

22
Adj. EBITDAR and MarginAdj. EBITDAR and Margin¹¹ ($mm)($mm)
$27
$118 $110
$140 $136
18.0%
24.0% 24.0%28.0%
26.0%
3Q07 4Q07 1Q08 2Q08 3Q08
The Venetian Macao-Resort-Hotel
Opened in August 2007− Largest building and first true integrated
resort in Asia− ~60,000 visits per day since opening; more
than 71,000 in 3Q08LTM Q3 2008 Adj. EBITDAR of $504 million92.1% occupancy and $211 ADR for 3 months ended September 30, 2008 Diversified, integrated product offering− 2,900 all-suite rooms− Casino with 700 tables and 2,200 slots− 1.2 million sq ft of state-of-the-art
convention and meeting space− Premium shopping in Venice-themed
Grand Canal Shoppes (300 shops open)− Destination dining totaling more than 20
restaurants − 15,000-seat stadium and 1,800-seat arena
featuring Cirque du Soleil’s “ZAIA”
ADR: $208 $224 $232 $225 $211
Occupancy: 77.5% 88.1% 78.6% 80.2% 92.1%Source: Public filings. Source: Public filings. 1.1. EBITDAR, margin, ADR and occupancy represent end of quarter dataEBITDAR, margin, ADR and occupancy represent end of quarter data..

23
“Mass” Market Stats
Visitation Per Day (000s) 61,954 58,435 55,809 71,681
Ferry Occupancy NA 31.4% 27.6% 60.2%
Non-Rolling Drop ($mm) $859 $880 $852 $931
Slot Handle ($mm) $367 $373 $447 $550
Hotel Stats
ADR $224 $232 $225 $211
Occupancy 88% 79% 80% 92%
Avg. Length of Stay (Days)
Venetian Macao 1.5 1.6 1.6 1.6
Overall Macao Market1 1.5 1.4 1.4 1.4
Cotai StripTM Strategy UpdateVenetian Macao Performance
Denotes property recordDenotes property record
1.1. Data per Macau DSEC.Data per Macau DSEC.
4Q 07 1Q 08 2Q 08 3Q 08
24
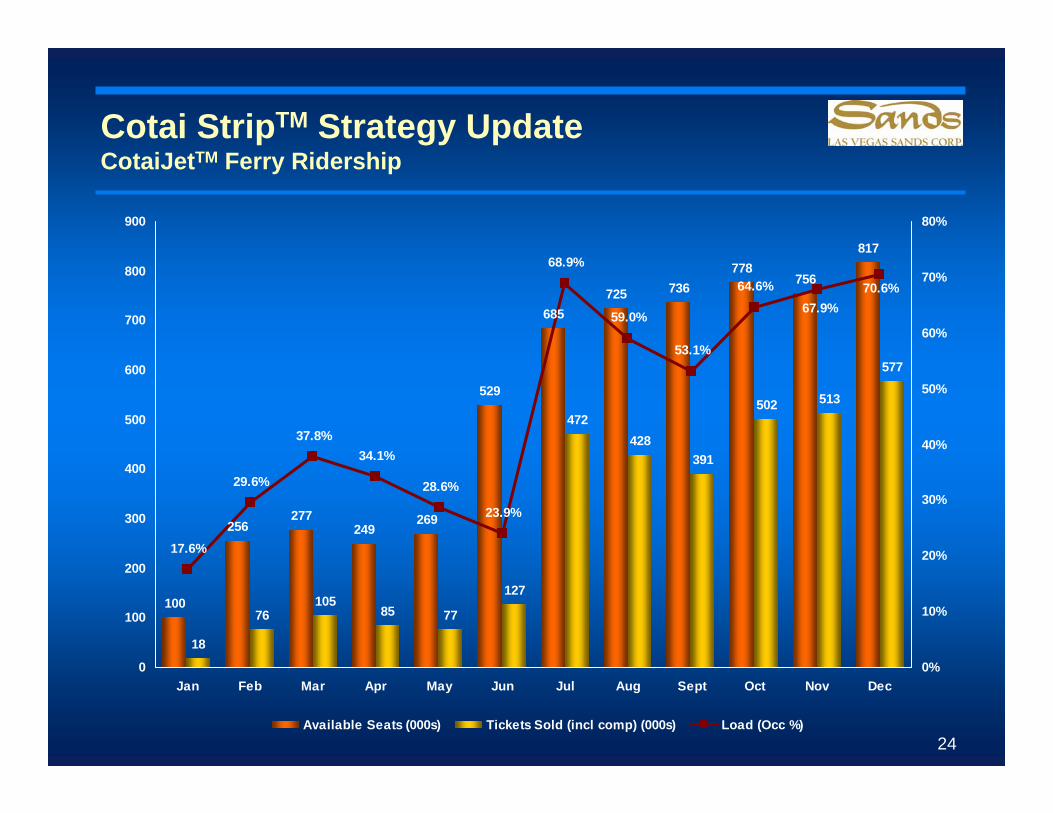
Cotai StripTM Strategy UpdateCotaiJetTM Ferry Ridership
100
256277
249269
529
685725 736
778756
817
18
76105
85 77
127
472428
391
502 513
577
17.6%
29.6%
37.8%34.1%
28.6%
23.9%
68.9%
59.0%
53.1%
64.6% 70.6%67.9%
0
100
200
300
400
500
600
700
800
900
Jan Feb Mar Apr May Jun Jul Aug Sept Oct Nov Dec0%
10%
20%
30%
40%
50%
60%
70%
80%
Available Seats (000s) Tickets Sold (incl comp) (000s) Load (Occ %)

2525
Four Seasons Macao-Hotel-Cotai StripTM
Phased opening began in August 2008Boutique luxury integrated resort− 360 rooms, including 19 Paiza Mansions− Full gaming, leisure and entertainment
amenities including three world-class restaurants, 100 tables (capacity to go to 150) and 200 slots
− Luxury retail mall (connected to Venetian) featuring Gucci, Louis Vuitton, Chanel and Cartier stores (210k net leasable sq ft)
− Luxury apart-hotel units branded Four Seasons (780k net saleable SF)
− 25,000 sq ft of MICE facilities capable of hosting small and medium-sized events and corporate meetings (11 meeting rooms)
Estimated further opening dates− Paiza Mansions (1Q 2009)− Apart-hotel units (3Q 2009)

Macao Strategy UpdateCost Savings Program at Venetian Macao, Sands Macao and Four Seasons Macao
Annualized targeted savings > $100 million$46 million run-rate savings implemented through 9/30/08Fully integrated into 2009 operating plan
Summary
Breakdown Labor savings: ~60%Expense savings: ~40%
Top Initiatives
HeadcountLabor efficiencyBenefitsTransportationUtilities
26

2727
Cotai StripTM Strategy UpdateScale Leading to Critical Mass
CotaiCotai Strip MapStrip MapThe Cotai Strip is rapidly transforming Macao into a world-class resort destination
The Venetian Macao is the first part of LVS’s strategy of building sufficient critical mass:
− Anchor property of the Cotai Strip
− Strong visitation and market share trends
− ADR and occupancy far exceeding market average
− Increased average length of stay
Sequenced strategy of building critical mass
− Four Seasons Macao
− Sites 5&6: when financing becomes available on acceptable terms
− Sites 3, 7&8LVS Operating Asset
LVS Project Temporarily Suspended
LVS Potential Future Development
Future Third Party Development
VenetianVenetianMacaoMacao
Site (Site 1)Site (Site 1)
FourFourSeasons Seasons (Site 2)(Site 2)
InterconIntercon //Holiday InnHoliday Inn
(Site 3)(Site 3)
Macau Macau StudioStudio
CityCityMacaoMacaoDomeDomeFairmontFairmont
RafflesRaffles
HiltonHiltonConradConrad
St. RegisSt. Regis
ShangriShangri--La La
TradersTraders
SheratonSheraton
City ofCity ofDreamsDreams
FutureFuturePassengerPassengerTerminalTerminal
Lake andLake andNatureNature
PreservePreserve
Ferry Ferry TerminalTerminal
MacauMacauIntInt’’ll
AirportAirport
ChinaChinaBorderBorder
Customs/Customs/ImmigrationImmigration
Site 5 Site 5 & 6& 6
Site 7 Site 7 & 8& 8
Galaxy Galaxy Mega Mega ResortResort

2828
Singapore UpdateSingapore Update

2929
The Marina Bay SandsTM
Singapore
Integrated resort being developed pursuant to one of only two casino concessions awarded by the Singapore government
− Targeted to open 4Q09
~2,600 rooms in three towers, connected by a glass atrium at ground level and a rooftop SkyParkcontaining pools and other recreation facilities
15,000 sq meters of casino space (161,459 sq ft)
1.32 million sq ft of convention and meeting space
700,000 sq ft of retail space, including the Marina Bay Sands Shoppes™ retail mall
Multiple dining options including celebrity-chef restaurants
Outdoor recreation areas and numerous other amenities
30
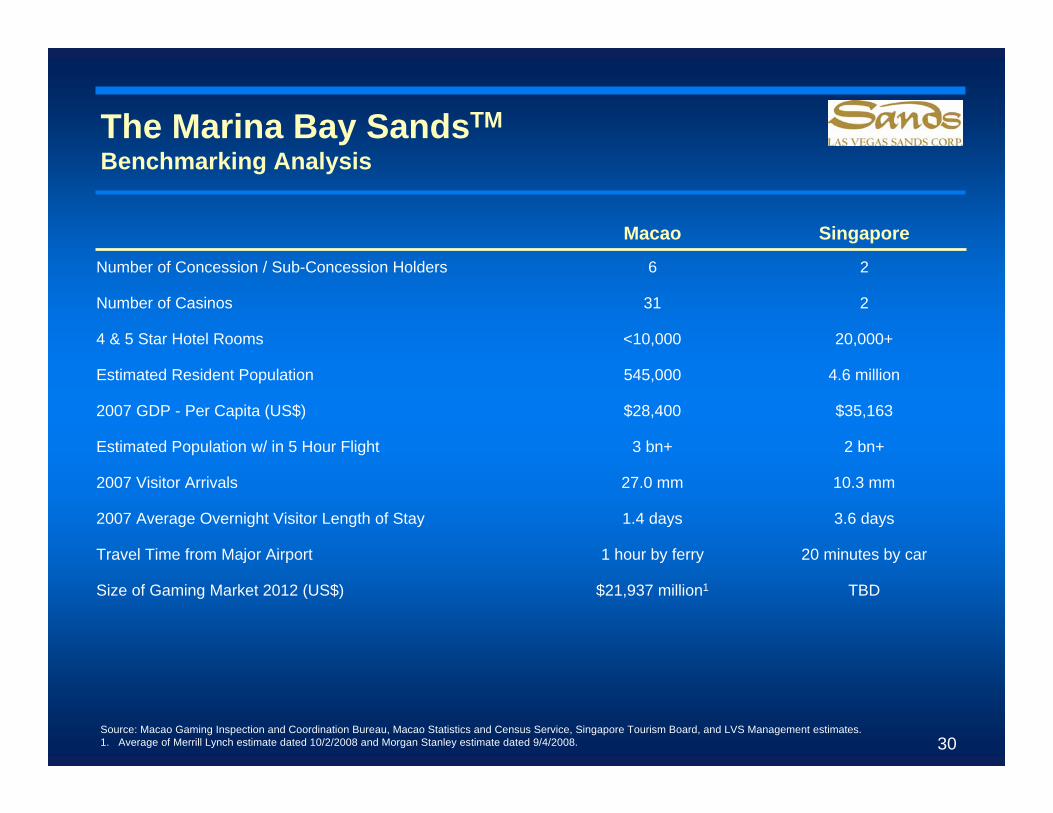
The Marina Bay SandsTM
Benchmarking Analysis
Macao Singapore
Number of Concession / Sub-Concession Holders 6 2
Number of Casinos 31 2
4 & 5 Star Hotel Rooms <10,000 20,000+
Estimated Resident Population 545,000 4.6 million
2007 GDP - Per Capita (US$) $28,400 $35,163
Estimated Population w/ in 5 Hour Flight 3 bn+ 2 bn+
2007 Visitor Arrivals 27.0 mm 10.3 mm
2007 Average Overnight Visitor Length of Stay 1.4 days 3.6 days
Travel Time from Major Airport 1 hour by ferry 20 minutes by car
Size of Gaming Market 2012 (US$) $21,937 million1 TBD
Source: Macao Gaming Inspection and Coordination Bureau, Macao Statistics and Census Service, Singapore Tourism Board, and LVS Management estimates.1. Average of Merrill Lynch estimate dated 10/2/2008 and Morgan Stanley estimate dated 9/4/2008.

Singapore Gaming Market
31
($ in millions)2007B 2008B 2007 2008
LotteryC 4,741$ 5,123$ 3,152$ 3,405$ Fruit (slot) Machines 2,582 2,995 1,716 1,991 Horse Racing 2,090 2,312 1,389 1,537 Football (Soccer) 1,119 997 744 663
Total 10,532$ 11,427$ 7,001$ 7,596$
A. Converted at December 9, 2008 SGD / USD exchange rate of 1.5045B. Represents fiscal year ending March 31C. Includes 4 Digit Numbers, Toto, and Singapore Sweep
SGD USDA
Established betting market in Singapore
54% of Singaporean adults say they have gambled in the last 12 months1
One million Singaporeans visited Genting Highlands in 2007
Over 7,000 VIP bettors registered at the Singapore Turf Club with the propensity to bet more than US$65,000 (S$100,000) per raceday2
Estimated Gross Betting amounts in Singapore3:
1. Singapore Ministry of Community Development, Youth and Sports1. Singapore Ministry of Community Development, Youth and Sports2. Singapore Turf Club2. Singapore Turf Club3. Inland Revenue Authority of Singapore and company estimates3. Inland Revenue Authority of Singapore and company estimates

Estimated Size of Regional Gaming Markets
− Estimated US$7.3 billion (Rs360 billion) in annual gross illegal betting5
− International Cricket Council estimates up to US$1.0 billion may change hands during cricket matches between India and Pakistan6
− Estimated US$6.1 billion (Rp73 trillion) in annual gross illegal betting7
− Estimated US$2.3 billion (Rm8.5 billion) of lottery revenue in 20071
− Casino revenue of approximately US$1.35 billion in 20072
− Estimated US$9.0 billion (Bt320 billion) in annual gross illegal betting3
− Over 70% of Thais gamble4
Malaysia
Thailand
1. CIMB research note dated January 28, 20081. CIMB research note dated January 28, 20082. UBS research note dated May 6, 20082. UBS research note dated May 6, 20083. The Economist dated December 6, 20033. The Economist dated December 6, 20034. 4. ChulalongkornChulalongkorn University (Thailand)University (Thailand)5. Economist 5. Economist NirodNirod JumarJumar PalaiPalai of of UtkalUtkal University (India)University (India)6. International Cricket Council6. International Cricket Council7. Association of Indonesian Entertainment Centers 7. Association of Indonesian Entertainment Centers
32
India
Indonesia

Regional Gaming Market Data
1. Resorts World public filings1. Resorts World public filings2. Macau Statistics and Census Service 2. Macau Statistics and Census Service 3. 3. ChangiChangi AirportAirport
33
− 118% growth in visitation to Macao over last two years (2007 vs.2005)2
− 17 daily incoming flights into Singapore from India’s four largest airports (New Delhi, Bangalore, Mumbai, Chennai)3
− Approximately 20 million total visitors Genting Highlands in 20071
− >300% growth in visitation to Macao over last two years (2007 vs. 2005)2
− 31 daily incoming flights into Singapore from Kuala Lumpur3
− 143% growth in visitation to Macao over last two years (2007 vs. 2005)2
− 23 daily incoming flights into Singapore from Bangkok3
− Nearly 200% growth in visitation to Macao over last two years (2007 vs. 2005)2
− 27 daily incoming flights into Singapore from Jakarta3
Malaysia
Thailand
India
Indonesia

Marina Bay SandsTM
Prime Central Business District Location
Source: Singapore Urban Redevelopment AuthoritySource: Singapore Urban Redevelopment Authority 34

Singapore StrategyHistorical Five Star Hotel Figures
$134 $137 $143
$179
$207
$280
$91
$109$117
$147
$173
$21668%
80% 82% 82% 84%
77%
0
50
100
150
200
250
300
2003 2004 2005 2006 2007 Jan - Nov 20080%
10%
20%
30%
40%
50%
60%
70%
80%
90%
ADR RevPAR Occ %
(US$)
Source: Singapore Tourism BoardSource: Singapore Tourism BoardAll figures converted to USD at the constant January 6, 2008 SGAll figures converted to USD at the constant January 6, 2008 SGD / USD rate of 1.4791.D / USD rate of 1.4791.
35
$

$230 millionRevenue from Hotel
EBITDAR from Hotel $161 million
70%EBITDAR Margin
$242RevPAR90%Occupancy$269Average Daily Rate2,600Hotel suites
Hotel
$210 millionRevenue from Retail
EBITDAR from Retail $179 million
85%EBITDAR Margin
$300Rent/sq. ft
700,000Sq. Feet of Mall
Retail
Marina Bay SandsTM
Non-Gaming Drivers
(US$)(US$)
Total Hotel & Retail EBITDAR $340 million
36

Gaming Win1 $2,010 $2,010
Effective Gaming and GST Tax Rate 39.0% 17.3%
Gaming and GST Taxes2 $784 $347 $436
Venetian Macao LTM EBITDAR at 9/30/08 $504
Difference in Gaming & GST Taxes from Above $436
Implied Marina Bay Sands EBITDAR,Assuming Comparable Gaming Win
37
The Marina Bay SandsTM
Profitability Illustration
1. 12 months ended September 30, 2008 for Venetian Macao.1. 12 months ended September 30, 2008 for Venetian Macao.2. Gaming tax in Macao is 39%. Projected blended effective GST2. Gaming tax in Macao is 39%. Projected blended effective GST and gaming tax in Singapore is 17.3%.and gaming tax in Singapore is 17.3%.
Venetian Marina BayMacao Sands Difference
(US$ in millions)(US$ in millions)
$940
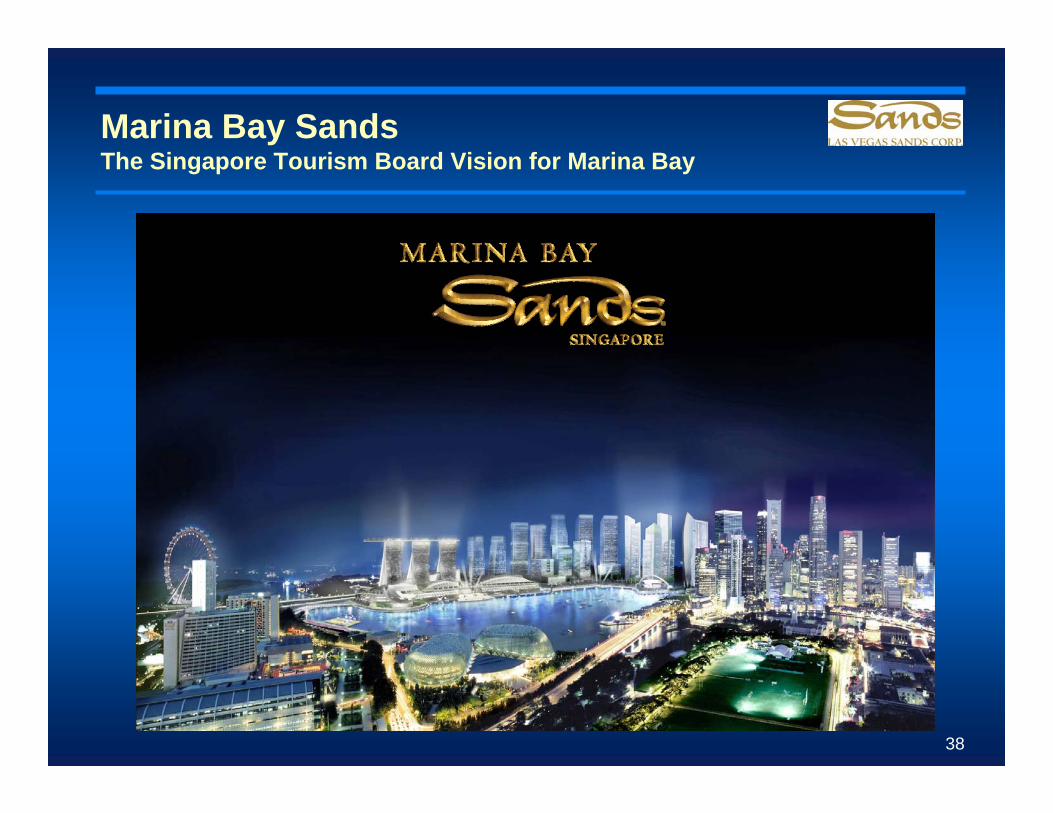
Marina Bay SandsThe Singapore Tourism Board Vision for Marina Bay
38

3939
Q&AQ&A