laser-gain scanning microscopy: a new characterization technique for dopant engineered gain media
TRANSCRIPT
Laser-gain scanning microscopy: a new characterization technique for
dopant engineered gain media
Jeff A. Wisdom1, Romain M. Gaume
2,* and Robert L. Byer
2
1Coherent Inc., 5100 Patrick Henry Drive, Santa Clara, CA 95054,USA 2Edward L. Ginzton Laboratory, Stanford University, Stanford, CA 94305, USA
Abstract: We demonstrate an optical technique, called laser-gain scanning microscopy (LGSM), to map dopant concentration profiles in engineered laser gain-media. The performance and application range of this technique are exampled on a Nd
3+ concentration profile embedded in a YAG
transparent ceramic sample. Concentration profiles measured by both LGSM and SIMS techniques are compared and agree to within 5% over three-orders of magnitude in Nd
3+ doping level, from 0.001 at.% to 0.9
at.%. One of the unique advantages of LGSM over common physical methods such as SIMS, XPS and EMPA, is the ability to correlate optical defects with the final doping profile.
©2010 Optical Society of America
OCIS codes: (160.3380) Laser materials; (120.4630) Optical inspection; (180.5810) Scanning microscopy.
References and links
1. R. Wilhelm, M. Frede, and D. Kracht, “Power scaling of end-pumped Nd:YAG rod lasers into the kilowatt region” in Advanced Solid-State Photonics, OSA Technical Digest Series (CD) (Optical Society of America, 2007), paper MB19.
2. I. Shoji, S. Kurimura, Y. Sato, T. Taira, A. Ikesue, and K. Yoshida, “Optical properties and laser characterization of highly Nd3+-doped Y3Al5O12 ceramics,” Appl. Phys. Lett. 77, 939–941 (2000).
3. D. Kracht, D. Freiburg, R. Wilhelm, M. Frede, and C. Fallnich, “Core-doped Ceramic Nd:YAG Laser,” Opt. Express 14(7), 2690–2694 (2006).
4. A. Sträßer, and M. Ostermeyer, “Improving the brightness of side pumped power amplifiers by using core doped ceramic rods,” Opt. Express 14(15), 6687–6693 (2006).
5. M. Ostermeyer, and I. Brandenburg, “Simulation of the extraction of near diffraction limited gaussian beams from side pumped core doped ceramic Nd:YAG and conventional laser rods,” Opt. Express 13(25), 10145–10156 (2005).
6. K. Yoshida, “H. Ishii, T. Kumada, T. Kamimura, A. Ikesue, T. Okamoto, “All ceramic composite with layer by layer structure by advanced ceramic technology,” Proc. SPIE 5647, 247–254 (2005).
7. A. Le Claire, “The analysis of grain boundary diffusion measurements,” Br. J. Appl. Phys. 14(6), 351–356 (1963).
8. K. Otsuka, T. Narita, Y. Miyasaka, C. C. Lin, J.-Y. Ko, and S.-C. Chu, “Non-linear dynamics in thin-slice Nd:YAG ceramic lasers: coupled local-mode laser model,” Appl. Phys. Lett. 89(8), 081117 (2006).
9. R. Kawai, Y. Miyasaka, K. Otsuka, T. Ohtomo, T. Narita, J.-Y. Ko, I. Shoji, and T. Taira, “Oscillation spectra and dynamic effects in a highly-doped microchip Nd:YAG ceramic laser,” Opt. Express 12(10), 2293–2302 (2004).
10. H. Haneda, “Role of diffusion phenomena in the processing of ceramics,” J. Ceram. Soc. Jpn. 111(1295), 439–447 (2003).
11. S. H. Chakmakjian, K. K. S. Papademitriou, and C. R. Stroud, “Effects of pump modulation on a four-level laser amplifier,” J. Opt. Soc. Am. B 6(9), 1746–1751 (1989).
12. V. Lupei, A. Lupei, S. Georgescu, T. Taira, Y. Sato, and I. Ikesue, “The effect of Nd concentration on the spectroscopic and emission decay properties of highly doped Nd:YAG ceramics,” Phys. Rev. B 64(9), 092102 (2001).
13. E. Desurvire, “Erbium-Doped Fiber Amplifiers”, John Wiley and Sons, Inc., (New York, 1993), pp 115–126. 14. K. Shimoda, H. Takahasi, and C. H. Townes, “Fluctuation in amplification of quanta with application to maser
amplifiers,” J. Phys. Soc. Jpn. 12(6), 686–700 (1957).
#127393 - $15.00 USD Received 23 Apr 2010; revised 6 May 2010; accepted 7 May 2010; published 20 Aug 2010(C) 2010 OSA 30 August 2010 / Vol. 18, No. 18 / OPTICS EXPRESS 18912
1. Introduction
Transparent ceramic laser materials have generated much interest owing to their size scalability and lower processing temperatures. Another unique feature of laser ceramic materials is the ability to engineer gain profiles by spatially varying the concentration of gain ions known as a doping profile. An engineerable doping profile in solid-state lasers is a valuable concept to improve performance by homogenizing stress as well as simultaneously improving both brightness and efficiency. For example, in end-pumped laser rods, a hyperbolic doping profile has been predicted to substantially increase the maximum output power by reducing the stress at the pump entrance [1]. Other analytic doping profiles can homogenize the excited-state population in symmetrically-pumped configurations [2], such as a symmetrically end-pumped rod or edge-pumped slabs. An end-pumped ceramic-rod laser with a radial-step doping profile exhibited more than 64% optical-to-optical efficiency in CW operation compared to absorbed 808 nm pump power [3]. In the pulsed regime, a side-pumped core-doped rod demonstrated improved brightness compared to a uniformly doped rod [4,5].
The most intuitive method to fabricate ceramic structures with smooth doping profiles would be to start with the proper spatial dopant distribution of materials in the green ceramic state [6]. However, the doping profile of the final product is complicated by grain-boundary diffusion occurring during the sintering process as well as changes of material phase when reaction-sintering is employed. Because of the angular mismatch between the crystalline lattices of adjacent grains randomly oriented with respect to one another, various defects form in the vicinity of a grain-boundary. As a result, the transport of atomic species along the grain-boundary network is typically more than a thousand times faster than through the bulk of grains. Rapid grain-boundary diffusion can therefore limit the minimum size of profiles in ceramic laser gain-media. For a step-doping profile, the first-order approximation of the dopant concentration No(x) versus position after the ceramic has been sintered for a time t at a temperature T is given by Eq. (1):
( ) ( ) ( ) ( )( )
3/51/2
0
06/5
ln 4ln 0
0.66
gb vD Td N x D T
Ntdx
δ−−
= − −
(1)
where δ is the grain boundary thickness, Dgb is the grain boundary diffusion rate, and Dv is the diffusion rate through the lattice [7]. This relationship can be rewritten as Eq. (2):
( ) ( )0
6/5 3/10
lnd N x T
dx t
Λ= (2)
where Λ(T) is the effective slope constant. Measuring the dependence of Λ(T) on the ceramic properties (e.g., grain size, composition, etc.) is essential in determining which concentration profiles can be realized with a given fabrication process. Since concentration profiles dropping off exponentially with distance are expected, one needs to make accurate measurements over a large dynamic range in concentration.
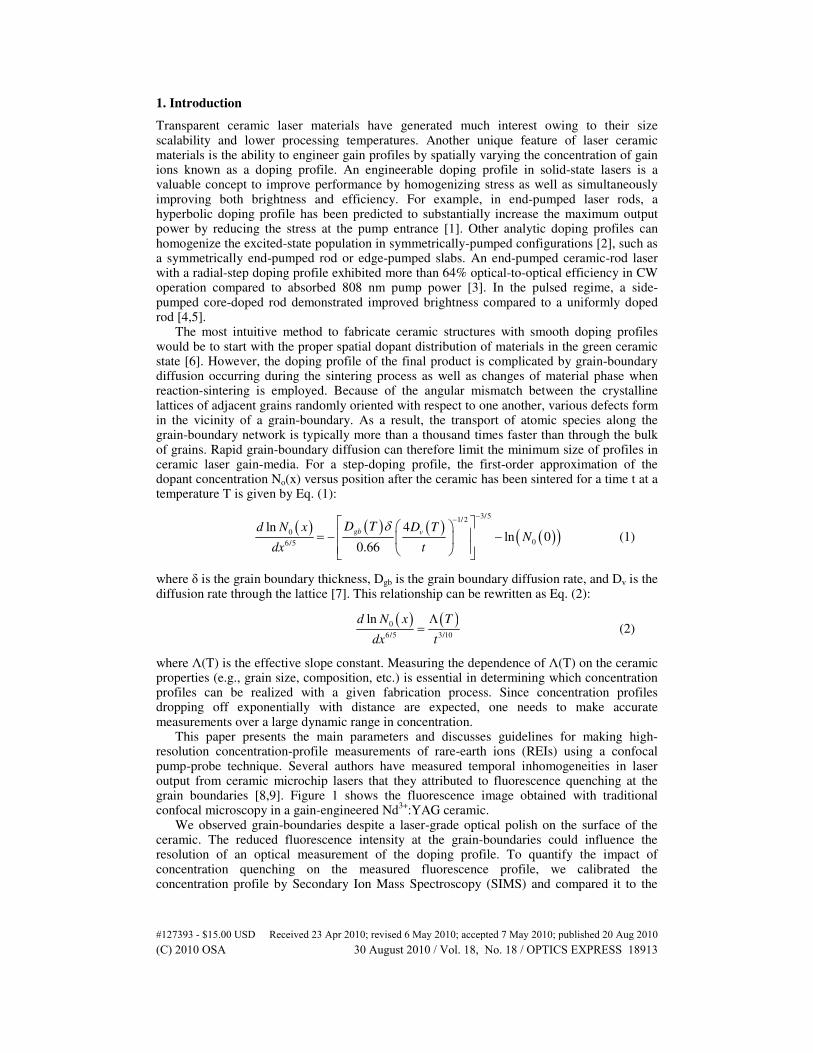
This paper presents the main parameters and discusses guidelines for making high-resolution concentration-profile measurements of rare-earth ions (REIs) using a confocal pump-probe technique. Several authors have measured temporal inhomogeneities in laser output from ceramic microchip lasers that they attributed to fluorescence quenching at the grain boundaries [8,9]. Figure 1 shows the fluorescence image obtained with traditional confocal microscopy in a gain-engineered Nd
3+:YAG ceramic.
We observed grain-boundaries despite a laser-grade optical polish on the surface of the ceramic. The reduced fluorescence intensity at the grain-boundaries could influence the resolution of an optical measurement of the doping profile. To quantify the impact of concentration quenching on the measured fluorescence profile, we calibrated the concentration profile by Secondary Ion Mass Spectroscopy (SIMS) and compared it to the
#127393 - $15.00 USD Received 23 Apr 2010; revised 6 May 2010; accepted 7 May 2010; published 20 Aug 2010(C) 2010 OSA 30 August 2010 / Vol. 18, No. 18 / OPTICS EXPRESS 18913
optically-measured concentration profile. The measurements obtained by the technique matched the SIMS data well, indicating negligible influence of quenching at the grain-boundaries on the measured concentration profile. Relatively few techniques are available to reliably measure the concentration of optically active ions in the concentration range of 1 ppm to 0.05% with a spatial resolution of 10–20 µm [10]. The majority of these techniques require expensive equipment not commonly found in photonics laboratories. Laser-Gain Scanning Microscopy (LGSM) is an inexpensive approach to accurately measure doping profile shapes with high-spatial resolution and high dynamic range. Furthermore, this technique simultaneously measures material transmission at a laser signal wavelength. This is a useful component of the technique since changes in composition that affect grain-growth rates of the material can produce optical defects. Lastly, this technique offers a method to compare quantum efficiency between samples.
Fig. 1. 885 nm fluorescence of a Nd3+ doped YAG ceramic imaged by confocal microscopy. Brighter regions indicate higher Nd3+ concentration. There is a reduction of about 4% in the collected power at the grain boundary.
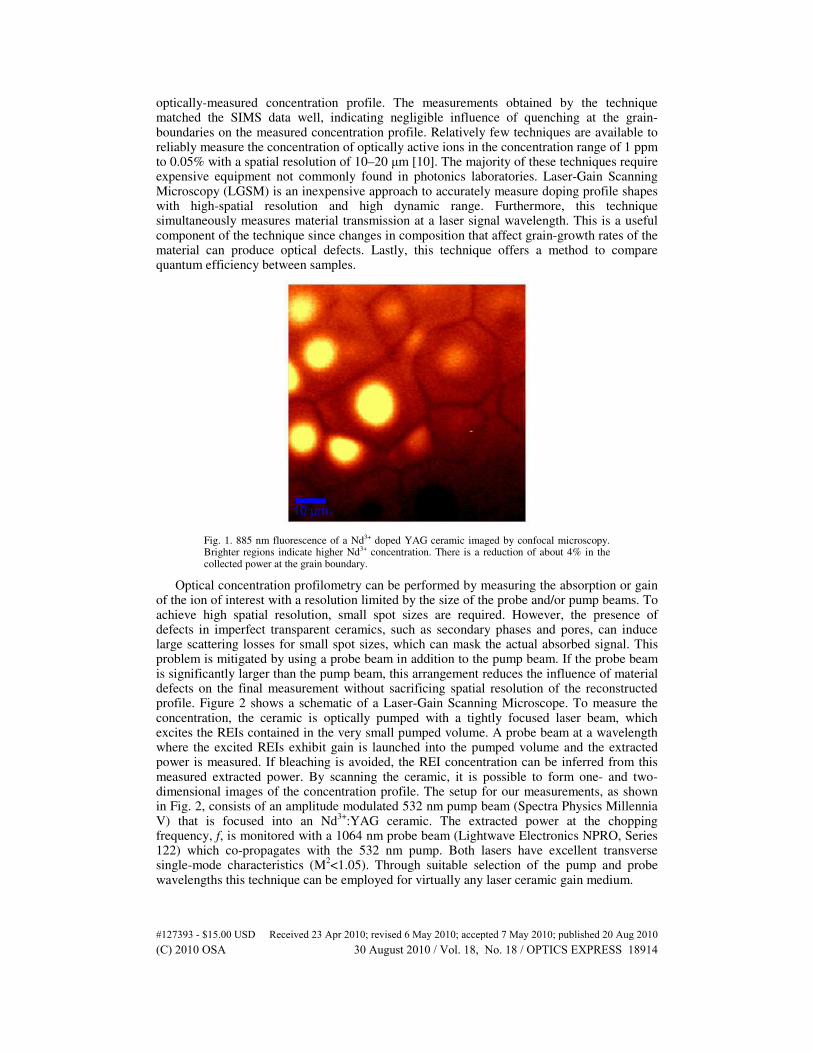
Optical concentration profilometry can be performed by measuring the absorption or gain of the ion of interest with a resolution limited by the size of the probe and/or pump beams. To achieve high spatial resolution, small spot sizes are required. However, the presence of defects in imperfect transparent ceramics, such as secondary phases and pores, can induce large scattering losses for small spot sizes, which can mask the actual absorbed signal. This problem is mitigated by using a probe beam in addition to the pump beam. If the probe beam is significantly larger than the pump beam, this arrangement reduces the influence of material defects on the final measurement without sacrificing spatial resolution of the reconstructed profile. Figure 2 shows a schematic of a Laser-Gain Scanning Microscope. To measure the concentration, the ceramic is optically pumped with a tightly focused laser beam, which excites the REIs contained in the very small pumped volume. A probe beam at a wavelength where the excited REIs exhibit gain is launched into the pumped volume and the extracted power is measured. If bleaching is avoided, the REI concentration can be inferred from this measured extracted power. By scanning the ceramic, it is possible to form one- and two- dimensional images of the concentration profile. The setup for our measurements, as shown in Fig. 2, consists of an amplitude modulated 532 nm pump beam (Spectra Physics Millennia V) that is focused into an Nd
3+:YAG ceramic. The extracted power at the chopping
frequency, f, is monitored with a 1064 nm probe beam (Lightwave Electronics NPRO, Series 122) which co-propagates with the 532 nm pump. Both lasers have excellent transverse single-mode characteristics (M
2<1.05). Through suitable selection of the pump and probe
wavelengths this technique can be employed for virtually any laser ceramic gain medium.
#127393 - $15.00 USD Received 23 Apr 2010; revised 6 May 2010; accepted 7 May 2010; published 20 Aug 2010(C) 2010 OSA 30 August 2010 / Vol. 18, No. 18 / OPTICS EXPRESS 18914
Fig. 2. Experimental setup of the Laser-Gain Scanning Microscope for the measurement of doping profiles in transparent YAG ceramics. The sample was translated along the x direction to draw out the profile. The inset shows the orientation of the sample relative to the coordinate axis of the laboratory frame. The position of the laser beams is parameterized by the distance a, relative to the edge of the slab. The laser beams propagate in the z direction, and the profile varies exclusively along the x direction. AOM: Acousto-optic modulator, PD: Photodiode
2. Theory of laser-gain scanning microscopy
For a four-level system, assuming very weak absorption such that the absorbed pump power varies linearly with sample length and that the REI stimulated emission rate is much less than the pumping rate, the steady-state inversion density is given by Eq. (3):
,
pump
g
pump sat
IN N
I∆ = (3)
where ∆N is the density of excited ions, Ipump is the pump intensity, Ng is the number of ions in the ground-state, and Ipump,sat is the pump saturation intensity given by Eq. (4):
,
pump
pump sat ul
pump
Iω
γσ
=ℏ
(4)
where γul is the relaxation rate from the upper laser-level to the lower laser-level, and σpump and ωpump are the absorption cross section and the angular frequency of the pump beam, respectively. For a sample of thickness, L, the extracted power from the sample, ∆P, as a function of the displacement a in the x-direction and as visualized in the inset of Fig. 2, is given by Eq. (5):
( ) ( )2
02exp
probe pump probe pump
ul probe probe pump res
P PL xP a N x a dx
w w w
σ σηγ ω π
∆ = − −
∫
ℏ (5)
where wres is the effective spatial resolution of the measurement, ωprobe and σprobe are the angular frequency and stimulated emission cross-section of the probe beam, respectively, Pprobe and Ppump are the probe and pump powers, respectively, and η is the quantum efficiency. All other absorption mechanisms of the sample that do not lead to fluorescence, such as absorption due to impurity ions or clustering of Nd
3+ leading to fast decay times, are
incorporated into a lower-than-anticipated quantum efficiency. Since the setup uses free-
#127393 - $15.00 USD Received 23 Apr 2010; revised 6 May 2010; accepted 7 May 2010; published 20 Aug 2010(C) 2010 OSA 30 August 2010 / Vol. 18, No. 18 / OPTICS EXPRESS 18915
space beams, the pump and probe laser intensities are taken to be Gaussian with 1/e2 intensity
waists wpump and wprobe, respectively so that:
2 2 2
1 1 1
res pump probew w w
= + (6)
Equation (5) is a convolution of the product of the pump and probe beam intensities with the concentration profile. Measurement of the probe and pump beam intensity distributions allows the concentration profile to be numerically determined through the deconvolution of the measured curve of extracted power versus position. Equation (5) shows that the spatial resolution is not affected by small misalignments between the beams.
For profiles that vary slowly compared to wres, we can replace the integral in Eq. (5) with the
average concentration within the pump spot, ( )N a , and the extracted power can be written
as:
( ) ( )ul
LP a AN aη
γ∆ = (7)
where all of the remaining parameters from Eq. (5) have been grouped into the constant A. The extracted power is quite small because of the low power of the pump and probe
beams. To aid detection, the pump beam is modulated sinusoidally at a frequency f and a lock-in amplifier is used to monitor the probe-beam power. Due to the finite upper-state lifetime of Nd
3+, the extracted power depends on the modulation frequency and on the phase
between the chopper and the lock-in amplifier. Following the analysis presented in [11], we can modify Eq. (7) given a pump modulation frequency f and write:
( ) ( ) ( ) ( )2
2, cos sin
21
ul ul
ul
N aL fP a A
f
πϕ η ϕ ϕ
γ γπγ
∆ = +
+
(8)
where φ is the phase offset of the lock-in amplifier from the pump modulation. The simple proportionality between the average concentration and the extracted power is
complicated by concentration quenching of the upper-state lifetime of Nd3+
in YAG. The dependence of the relaxation is given by [12]
( )2
0
0 ,0 '
0
1ul ul
NN
Nγ γ
= +
(9)
where γul,o is the low-concentration decay rate, and N’0 is a characteristic concentration. For
Nd3+
:YAG ceramics, the measured values of γul,o and N’0 are 4032 s
−1 and 2.8 at.%,
respectively. These values match values measured in single-crystal samples of 4000 s−1
and 2.8 at.% [2].
There is a minimum extracted power required to make a concentration measurement. This limits the concentration sensitivity to a value Nmin. The minimum extracted power is dependent on the noise power in the system, Pnoise, and the desired signal-to-noise ratio, SNR, is:
noise
PSNR
P
∆= (10)
To estimate Nmin, we consider a sample with a uniform doping profile and assume that wprobe >> wpump, such that we can replace A in Eq. (8) with:
#127393 - $15.00 USD Received 23 Apr 2010; revised 6 May 2010; accepted 7 May 2010; published 20 Aug 2010(C) 2010 OSA 30 August 2010 / Vol. 18, No. 18 / OPTICS EXPRESS 18916
probe pump
pump signal
probe
A P Iσ σ
ω=ℏ
(11)
To preserve the higher spatial resolution afforded with a small spot size, we limit the
sample thickness, L, to
2
host pumpn wπ
λ, for a host material with refractive index nhost. Using Eq.
(5) for in-phase signal detection, we rewrite Eq. (10) as:
2
min 2
21
probe pumpul
noise
probe pump pump probe ulpump
SNR fN P
P I w
ω λγ πηπ σ σ γ
= +
ℏ (12)
This expression demonstrates the trade-off between high spatial resolution (i.e., small wpump) and high sensitivity to concentration. As the spot size of the pump decreases, the maximum length of the sample drops, lowering the total power deposited in the sample, and accordingly increasing the lowest detectable doping level. The fundamental concentration detection limit of the technique is given by the shot noise in the probe beam. To develop an expression for the minimum detectable concentration imposed by the shot noise, we follow the formalism of Desurvire [13]. The shot-noise constraint on the system is
( )n L σ∆ ≥ (13)
where <∆n(L)> is the average number of photons extracted from a sample of length, L, during a period equal to half the modulation frequency period, and σ is the variance of the photon distribution. We will assume that the photon statistics are determined by the master equation developed by Shimoda et al. [14], and that the probe beam has a Poisson photon distribution function. Equation (13) can then be rewritten as
( )2
1 2
min22
21
probe pump pump probe host pump
probe probe
ul probe pump
ul
P I n wN fP
f
σ σπη ωγ ω λπ
γ
>
+
ℏℏ
(14)
For a 400 µm thick sample of Nd3+
:YAG pumped with 300 mW of 532 nm light at a modulation frequency of 400 Hz and probed at 1064 nm with 10 mW of power, Eq. (14)
predicts a detection limit as low as 1010
Nd3+
/cm3, i.e. 10
−3 ppb.
The lock-in signal must be calibrated to obtain the actual concentration profile. One method is to characterize a standard sample with a well-determined concentration as a reference. However, differences in the quantum efficiency between samples due to contaminants or varying degrees of transparency make such a direct comparison unreliable. If the quantum efficiency is spatially uniform, the most convenient method to calibrate the lock-in amplifier signal is to adjust the constant of proportionality between the voltage and the concentration until the integral of the concentration profile matches the total amount of Nd
3+
initially placed in the ceramic.
3. Experimental results
3.1 Measurement linearity: weak pumping condition
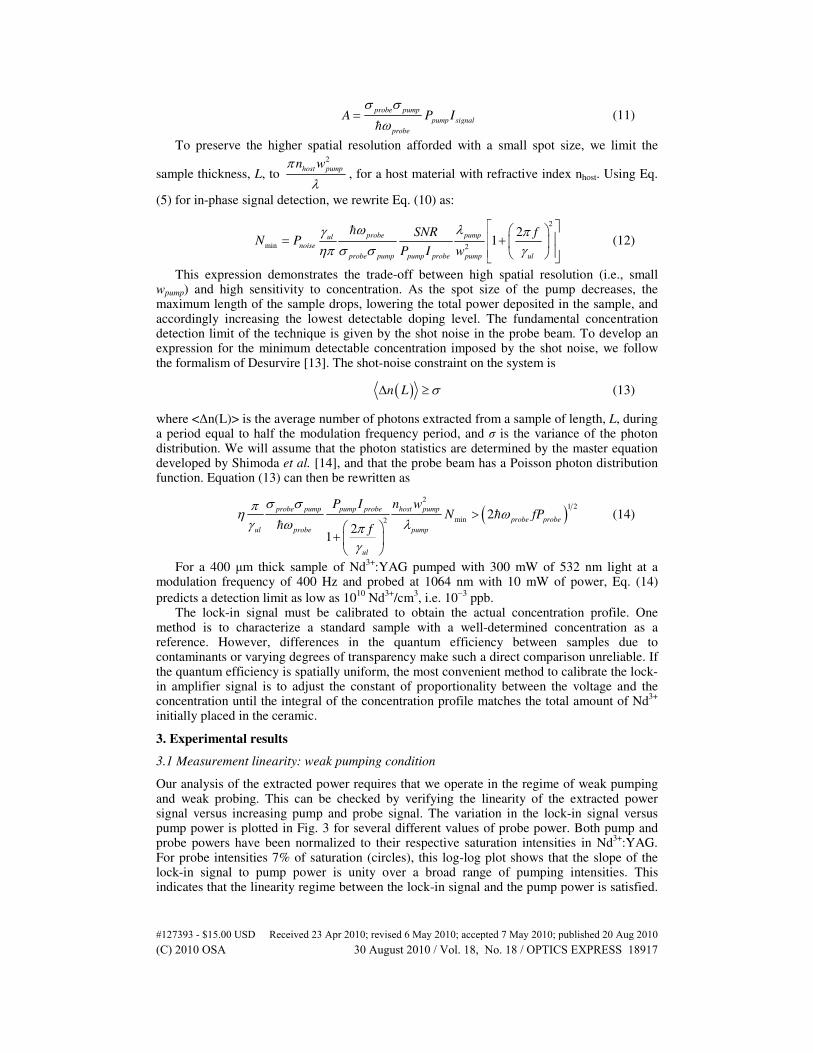
Our analysis of the extracted power requires that we operate in the regime of weak pumping and weak probing. This can be checked by verifying the linearity of the extracted power signal versus increasing pump and probe signal. The variation in the lock-in signal versus pump power is plotted in Fig. 3 for several different values of probe power. Both pump and probe powers have been normalized to their respective saturation intensities in Nd
3+:YAG.
For probe intensities 7% of saturation (circles), this log-log plot shows that the slope of the lock-in signal to pump power is unity over a broad range of pumping intensities. This indicates that the linearity regime between the lock-in signal and the pump power is satisfied.
#127393 - $15.00 USD Received 23 Apr 2010; revised 6 May 2010; accepted 7 May 2010; published 20 Aug 2010(C) 2010 OSA 30 August 2010 / Vol. 18, No. 18 / OPTICS EXPRESS 18917
However, as the probe intensity approaches the saturation intensity (triangles and squares), this graph shows that slopes depart from unity and that consequently, the linear relationship between the extracted power signal and the pump breaks down at successively lower pump powers. The saturation intensities used in Fig. 3 are 3.6 x 10
7 W/cm
2 for the pump and 2.2
kW/cm2 for the probe. These values were calculated from the attenuation coefficient at 532
nm measured in 1 at.% Nd3+
:YAG ceramics (0.75 cm−1
) and the lifetime data in [2].
Fig. 3. Measured in-phase lock-in amplifier signal versus normalized pump intensity for different probe intensities.
3.2 Phase-sensitive detection
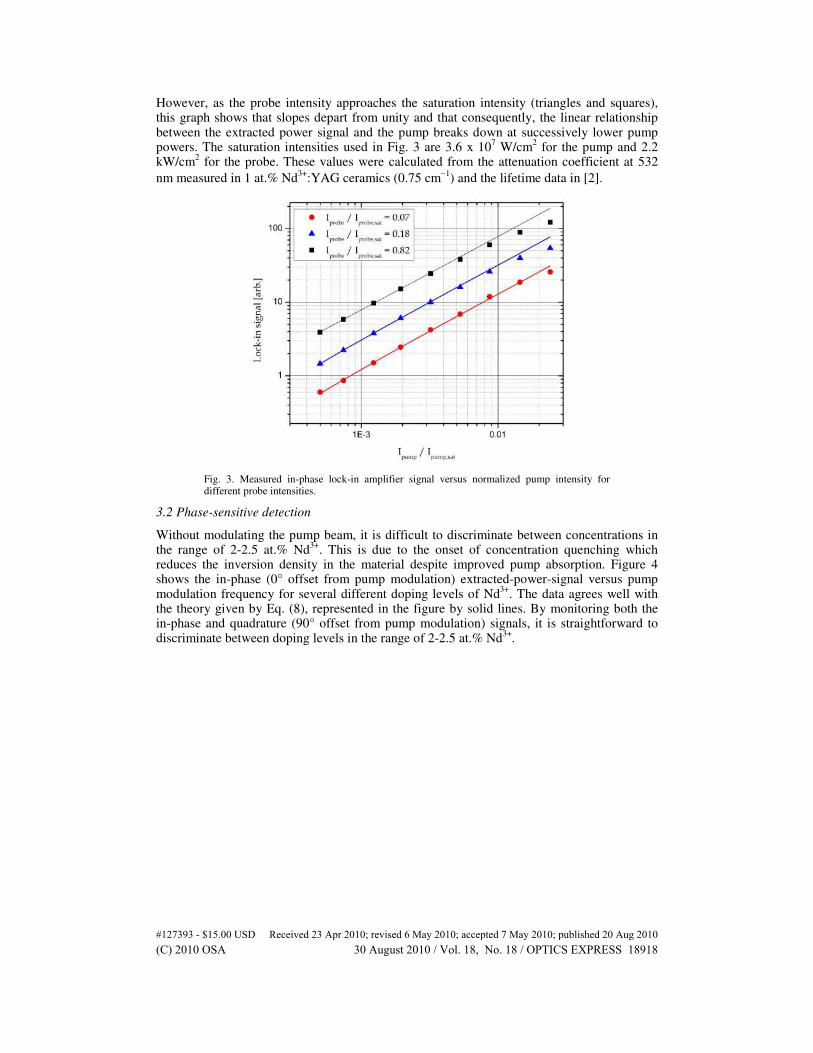
Without modulating the pump beam, it is difficult to discriminate between concentrations in the range of 2-2.5 at.% Nd
3+. This is due to the onset of concentration quenching which
reduces the inversion density in the material despite improved pump absorption. Figure 4 shows the in-phase (0° offset from pump modulation) extracted-power-signal versus pump modulation frequency for several different doping levels of Nd
3+. The data agrees well with
the theory given by Eq. (8), represented in the figure by solid lines. By monitoring both the in-phase and quadrature (90° offset from pump modulation) signals, it is straightforward to discriminate between doping levels in the range of 2-2.5 at.% Nd
3+.
#127393 - $15.00 USD Received 23 Apr 2010; revised 6 May 2010; accepted 7 May 2010; published 20 Aug 2010(C) 2010 OSA 30 August 2010 / Vol. 18, No. 18 / OPTICS EXPRESS 18918
Fig. 4. Evolution of the in-phase signal response versus pump modulation frequency for different concentrations of Nd3+ in transparent YAG ceramics.
3.3 Application of the LGSM technique
The concentration profile of Nd3+
in a gain-engineered transparent YAG ceramic was characterized with the present technique. A composite ceramic green body, consisting of a 400 µm thick Nd
3+ doped core layer clad in between two undoped layers was formed by
pressing precursor powders of Nd2O3, Al2O3 and Y2O3 in the stoichiometric ratio to produce 1 at.% Nd
3+:Y3Al5O12 against two pellets of a stoichiometric mix of Al2O3 and Y2O3 to produce
Y3Al5O12. The composite sample was sintered in vacuum for 10 h at 1780 °C [3,11]. SiO2 was used as a sintering aid to promote densification. After sintering, the core layer thickness shrunk to 330 µm as the voids in the green ceramic collapsed.
SIMS measurements using an oxygen ion beam were performed on a polished cross-section surface of the ceramic coated with a thin layer of chromium to disperse built-up charge. Two series of SIMS measurements were done on adjacent areas of the ceramic as a check of repeatability, which indeed gave identical results. Calibration of the SIMS signal was performed by making SIMS measurements on a uniformly doped Nd
3+:YAG ceramic
with a known Nd3+
concentration. The laser-gain scanning microscope used a 532 nm single-frequency laser pump, focused
to a 1/e2-intensity diameter of 20 µm. The pump beam was modulated by passing it through
an acousto-optic modulator (AOM). A single-frequency 1064 nm laser beam was overlapped with the 532 nm beam and focused to a 1/e
2-intensity waist diameter of 115 µm. The large
difference in size between the pump and probe beams greatly reduced the influence of uncorrelated pointing instabilities between the two lasers. After propagation through the sample, the two beams were separated with dichroic mirrors and filters before being detected by photodiodes. The power launched into the sample was monitored with a photodiode for each laser.
The thickness of the ceramic wafer that we optically probed had a thickness, L, of 400 µm. It was oriented at Brewster’s angle and placed at the focus of the laser beams. The modulation on the 1064 nm photodiode was monitored with a lock-in amplifier as the ceramic was translated along the doping profile with a stepper motor. The DC value of the 1064 nm photodiode voltage was recorded at each point with a data acquisition board and used to monitor the total effective transmission of the sample. The photodiode monitoring the 532 nm signal was used to estimate the effective absorption of the sample. The data collected from the LGSM setup and by SIMS are shown in Fig. 5.
#127393 - $15.00 USD Received 23 Apr 2010; revised 6 May 2010; accepted 7 May 2010; published 20 Aug 2010(C) 2010 OSA 30 August 2010 / Vol. 18, No. 18 / OPTICS EXPRESS 18919
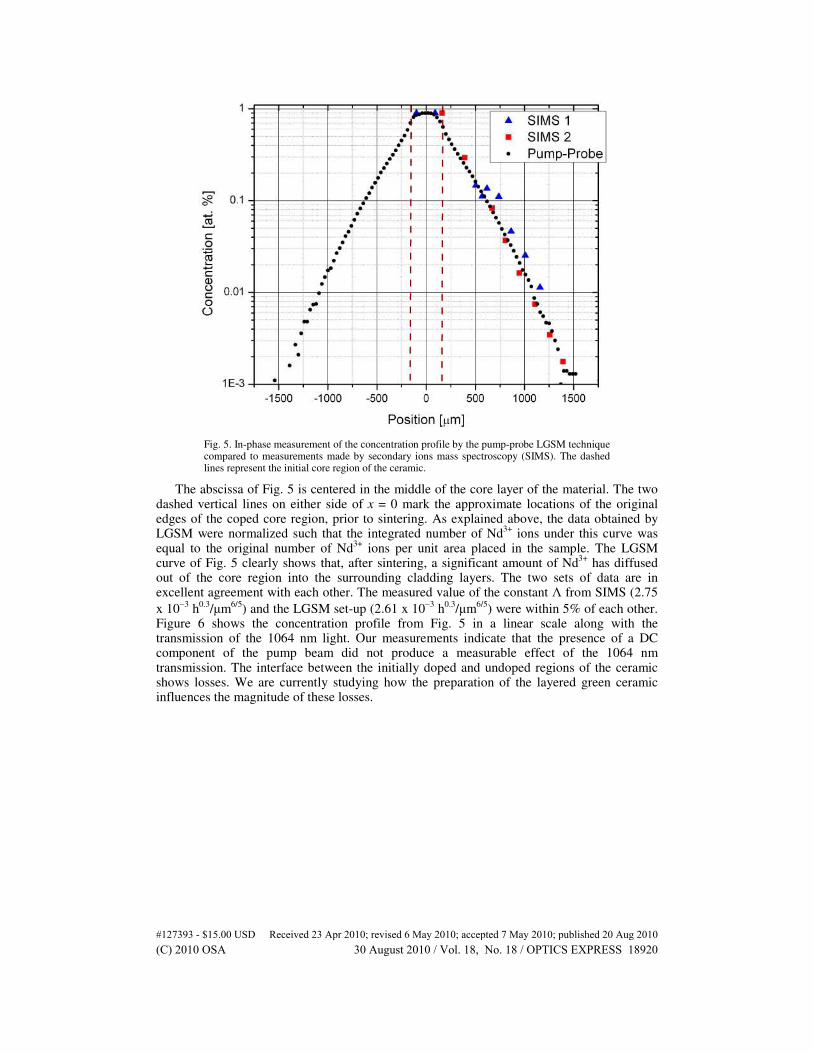
Fig. 5. In-phase measurement of the concentration profile by the pump-probe LGSM technique compared to measurements made by secondary ions mass spectroscopy (SIMS). The dashed lines represent the initial core region of the ceramic.
The abscissa of Fig. 5 is centered in the middle of the core layer of the material. The two dashed vertical lines on either side of x = 0 mark the approximate locations of the original edges of the coped core region, prior to sintering. As explained above, the data obtained by LGSM were normalized such that the integrated number of Nd
3+ ions under this curve was
equal to the original number of Nd3+
ions per unit area placed in the sample. The LGSM curve of Fig. 5 clearly shows that, after sintering, a significant amount of Nd
3+ has diffused
out of the core region into the surrounding cladding layers. The two sets of data are in excellent agreement with each other. The measured value of the constant Λ from SIMS (2.75
x 10−3
h0.3
/µm6/5
) and the LGSM set-up (2.61 x 10⁻³
h0.3
/µm6/5
) were within 5% of each other. Figure 6 shows the concentration profile from Fig. 5 in a linear scale along with the transmission of the 1064 nm light. Our measurements indicate that the presence of a DC component of the pump beam did not produce a measurable effect of the 1064 nm transmission. The interface between the initially doped and undoped regions of the ceramic shows losses. We are currently studying how the preparation of the layered green ceramic influences the magnitude of these losses.
#127393 - $15.00 USD Received 23 Apr 2010; revised 6 May 2010; accepted 7 May 2010; published 20 Aug 2010(C) 2010 OSA 30 August 2010 / Vol. 18, No. 18 / OPTICS EXPRESS 18920
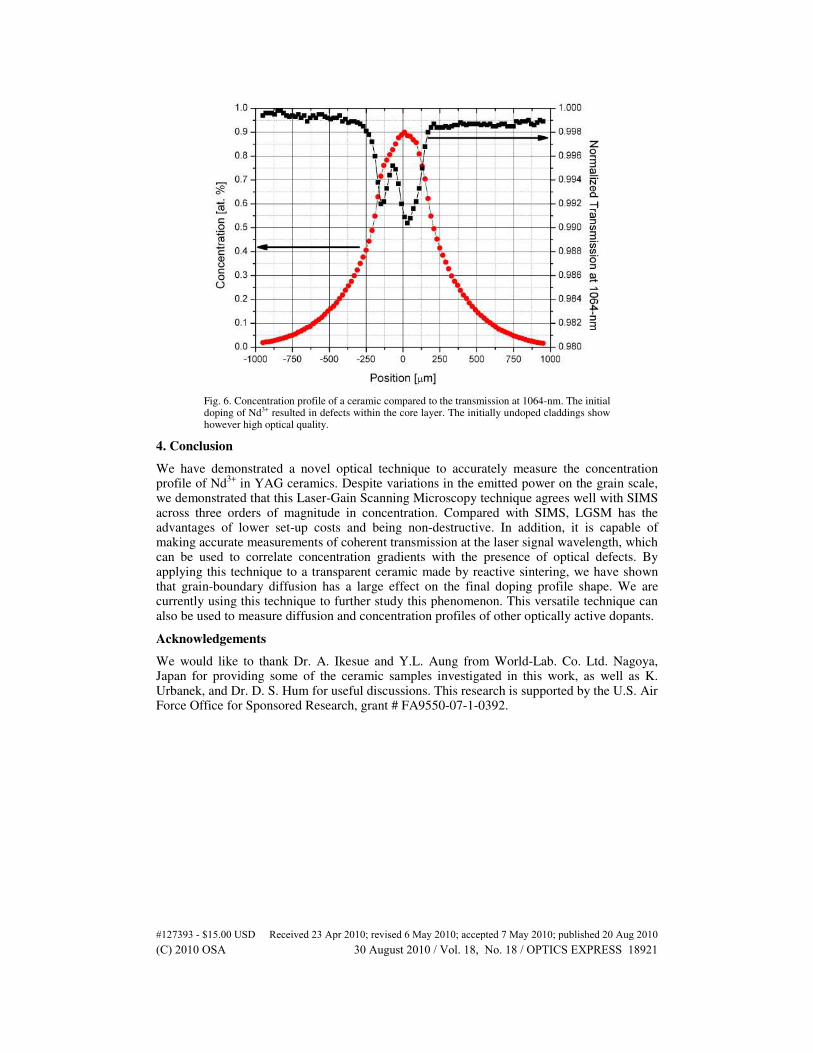
Fig. 6. Concentration profile of a ceramic compared to the transmission at 1064-nm. The initial doping of Nd3+ resulted in defects within the core layer. The initially undoped claddings show however high optical quality.
4. Conclusion
We have demonstrated a novel optical technique to accurately measure the concentration profile of Nd
3+ in YAG ceramics. Despite variations in the emitted power on the grain scale,
we demonstrated that this Laser-Gain Scanning Microscopy technique agrees well with SIMS across three orders of magnitude in concentration. Compared with SIMS, LGSM has the advantages of lower set-up costs and being non-destructive. In addition, it is capable of making accurate measurements of coherent transmission at the laser signal wavelength, which can be used to correlate concentration gradients with the presence of optical defects. By applying this technique to a transparent ceramic made by reactive sintering, we have shown that grain-boundary diffusion has a large effect on the final doping profile shape. We are currently using this technique to further study this phenomenon. This versatile technique can also be used to measure diffusion and concentration profiles of other optically active dopants.
Acknowledgements
We would like to thank Dr. A. Ikesue and Y.L. Aung from World-Lab. Co. Ltd. Nagoya, Japan for providing some of the ceramic samples investigated in this work, as well as K. Urbanek, and Dr. D. S. Hum for useful discussions. This research is supported by the U.S. Air Force Office for Sponsored Research, grant # FA9550-07-1-0392.
#127393 - $15.00 USD Received 23 Apr 2010; revised 6 May 2010; accepted 7 May 2010; published 20 Aug 2010(C) 2010 OSA 30 August 2010 / Vol. 18, No. 18 / OPTICS EXPRESS 18921