last mile supply chain program: visibility and analytics
TRANSCRIPT

V A N M A N U A L
ThinkWell @thinkwellglobal
www.thinkwell.global
Last Mile Supply Chain Program: Visibility and Analytics Networks Manual

| 2
T A B L E O F C O N T E N T S
Table of contents .......................................................................................................... 2
A B B R E V I A T I O N S ................................................................................................... 3
I Introduction ........................................................................................................... 4
II Background ............................................................................................................ 4
III Developing the VAN in the LMSC project ................................................................... 4
IV The VAN Dashboard step by step............................................................................. 7
V Principles of the VAN ............................................................................................ 13
People ............................................................................................................................ 13
Processes ........................................................................................................................ 15
Technology ..................................................................................................................... 16
VI Policy and Governance Considerations for Decision Making ..................................... 17
Annex ........................................................................................................................ 20

| 3
A B B R E V I A T I O N S
4PL Fourth Party Logistics Provider
LMSC Last Mile Supply Chain
BMGF Bill & Melinda Gates Foundation
MELP Monitoring Evaluation and Learning Plan
CHAI Clinton Health Access Initiative
MISAU Ministry of Health
CHASS Clinical and Community HIV/AIDS Services Strengthening
MSF Doctors without Borders
CIP Centre for Public Integrity NSCA National Supply Chain Assessment
CMAM Central Medical Stores PELF Strategic Plan for Pharmaceutical Logistics
CS Health Center (Centro de Saude)
PEPFAR The U.S. President's Emergency Plan for AIDS Relief
DCL Central Laboratory Department
PLM Project Last Mile
DDM District Medical Stores PSM Global Health Supply Chain Program-Procurement and Supply Management
DDS District Health Directorate SARA Service Availability and Readiness Assessment
DPM Province Medical Stores SELV Electronic Vaccine Logistics System
DPS Provincial Health Directorate SI-MAM Information System for Management of Medicines and Medical Supplies
EPI Expanded Program on Immunization
SIGLUS Mobile Health Logistics Data System
eSIP Electronic Personnel Information System for health
TB Tuberculosis
FGH Friends in Global Health TSS Outsourcing in the Health Sector
FHI360 Family Health International TWG Technical Working Group
HCD Human-Centred Design UNFPA United Nations Population Fund
HF Health Facility USAID United States Agency for International Development
HRH Human Resources for Health VAN Visibility & Analytics Network
IR Intermediate Result VAT Value Added Tax
ISG Information Systems Group VIGIAM Visibility and Integrated Management of Medication Supply
IW Intermediate Warehouse WS Workstream

| 4
I I N T R O D U C T I O N
The Visibility & Analytics Network (VAN) comprises tools and visualizations developed to support decision-makers and executors in the logistics area. The VAN achieves this by increasing visibility on gaps versus target performance, allowing analysis of those gaps, and spelling out intervention areas to improve on them. Within the Last Mile Supply Chain (LMSC) project, the VAN aims at empowering supply chain stakeholders with policies, processes, and technology to make the supply chain more collaborative, efficient, and responsive to last mile needs, by providing end-to-end data visibility and facilitating more agile and aligned solutions. The central objective of LMSC’s VAN is to leverage existing information systems to ensure the availability of health commodities at the Health Facility (HF) level.
The VAN Manual and Toolkit aims to provide guidance to ensure the right people, technology, processes, and policies are aligned to deliver health products when and where they are needed. It will illustrate how to establish teams comprised of people who are trained to select indicators, and who are empowered to use their data to make operational and strategic decisions that continually improve the performance of these indicators and ultimately, their supply chain. To that end, the document will:
1. Detail key elements of the people, process, technology, and policy that form the Visibility and Analytics Networks for the LMSC project, providing a common reference model for further developing the VAN.
2. Provide an overview of interpretation, use and updating for the VAN Dashboard in its current form.
3. Provide guiding principles and structure for the overall governance of the LMSC’s VAN. 4. Provide VillageReach with the tools and information to advance with and expand the
VAN independently.
The manual describes the VAN process and the toolkit provides templates and instructions for meetings, dashboard updating and other tools.
I I B A C K G R O U N D
The LMSC’s VAN builds on established global best practices as well as project partners’ specific experience and expertise. The basis for the LMSC’s VAN is the blueprint developed by the Bill & Melinda Gates Foundation (BMGF), which aims to leverage private sector design approaches and practices to improve the end-to-end visibility of the most relevant public health supply chain information. Moreover, the LMSC’s VAN also builds on the experience and expertise gained by VillageReach while supporting the Mozambican Expanded Program on Immunization (EPI) in visualizing, interpreting and leveraging SELV data (Sistema Electrónico de Logistica de Vacinas or Electronic Vaccine Logistics System) through the SELV+ dashboard.
During the first year of the project, the team made efforts to improve data visibility – including the development of supporting processes, tools and templates for data collection, analysis, reporting and review. This process culminated in this Manual and Toolkit annexed.
I I I D E V E L O P I N G T H E V A N I N T H E L M S C P R O J E C T
To kickstart the design of the VAN Dashboard, ThinkWell researched similar efforts in Mozambique to learn from previous attempts. ThinkWell conducted stakeholder meetings with representatives from Project Last Mile (PLM), Clinton Health Access Initiative (CHAI), Procurement and Supply Management (PSM) as well as from the Province Medical Stores (DPM) and the DPS (Provincial Health Directorate) in Zambézia to improve the project’s

| 5
understanding on the VAN process, as well as to identify usable and useful information with respect to available data and indicators.
Equipped with these initial findings, the consortium designed the process to establish a VAN in Zambézia. This was built on VillageReach’s extensive experience both in VAN, coming from the SELV work done with the Extended Program on Immunization (EPI), and in Zambézia, due to the well-established local presence in the provincial EPI program. ThinkWell used the insights and capabilities for data visualization available within the consortium to forge the first proposal for a VAN dashboard.
Following the initial desk review, stakeholder meetings, and field visits to Zambézia, ThinkWell selected key indicators to be included in the VAN Dashboard. The Dashboard design process led ThinkWell to select indicators that could be calculated using readily available system data and distribution-specific data collected by the project’s 4PL partner, Bollore. Indicators selected for the first iteration of the VAN Dashboard included:
― Average number of stockouts, by district: This indicator displayed the number of essential medicines at each health facilities that were stocked out. Specifically, it shows how many of Stock Keeping Units (SKUs) and tracer SKUs have been stocked out per health facility during the month.
― Percentage of on-time Mobile Health Logistics Data System (SIGLUS) requisitions: This indicator estimated the percentage number of health facilities that submitted requisitions on SIGLUS within the pre-established requisition deadline.
― Percentage of on-time distributions: This indicator provided information on whether not distributions were completed according to the existing distribution plan.
― Percentage of discrepancies: This indicator estimated what the percentage of deliveries in which the number of medicines delivered is not equal to the amounts defined in the delivery guides.
― Percentage of damages: This indicator estimated what percentage of medicines was delivered damaged or in unusable condition.
― Average waiting time: This indicator illustrated the average time the delivery vehicle is parked and waiting for the medicines to be unloaded during delivery.
Figure 1. VAN dashboard as used in the first distribution meeting, 7th November 2018

| 6
Establishing the VAN Process
Since the first distribution in September, the VAN working group has met monthly. ThinkWell worked with the project’s VAN coordinator to guarantee an updated dashboard, technical support, and a matrix to track discussions and agreed actions, as part of the VAN development process.
The VAN has been a DPS-owned process from the start. After an initial brief on the VAN material, the DPM Director led the VAN working group. This approach underlines the efforts to ensure that the VAN will be a DPS-led process that is institutionalized as part of the existing policies and structures.
With each VAN working group meeting, the VAN dashboard and activities continued to evolve and improve. ThinkWell used a human-centered design (HCD) approach to modify the dashboard. With the support of ThinkWell staff and the VAN coordinator, meetings have integrated a root cause analysis (The Five Whys) to improve data analysis and participants’ understanding of problems, and to ensure that solutions are fit for purpose. To track the discussion, and the action steps agreed upon during the meetings, a matrix with agreed actions was developed and distributed after each meeting.
Continuous Improvement of the VAN ThinkWell designed a second iteration of the VAN dashboard, to increase user friendliness and incorporate feedback from VillageReach and the distribution working group. The new dashboard was designed to be more readable and functional, with more graphs and breakdowns for each district. This moved the VAN dashboard towards the goal of being usable on different levels, for a wider audience, and to replicate VAN processes at the district level. Updating the dashboard ahead of the month working group meetings was also made easier.
Figure 2 First VAN working group meeting
W H A T I S H U M A N - C E N T E R E D D E S I G N ?
HCD is a creative approach to problem-solving that starts with users and ends with innovative solutions that are tailor-made to suit their needs.
H C D I N T H E L M S C V A N D E S I G N S O F A R
Understand the problem - Conducted background research on VAN - Interviewed users and other key stakeholders (Village Reach, PLM, PSM, EPI VAN leader, DPSZ) Ideate solutions to the problem -Decided to create a VAN dashboard and VAN meetings to improve end-to-end supply chain data at provincial level Prototype solutions to the problem -Established monthly VAN meetings with distribution WG -Created low and medium fidelity prototypes of the VAN dashboard (on excel) -Tested the VAN dashboard at monthly meetings Refine and iterate the solution -Refined visuals in the VAN dashboard and included root cause analysis in monthly meetings

| 7
Figure 3: Dashboard V1 – October 2018
Figure 4: Dashboard V2 – March 2019
The new dashboard was designed and presented for the first time in April, at the March distribution meeting. It uses the same sources of data as the original iteration—namely SIGLUS and the Bollore Distrbution report. The new dashboard visualises results from all districts and has a tab with the breakdown of each district at the health facility level.
Since launching the new dashboard, additional feedback from the VAN coordinator, the LMSC technical director, and the working group has been incorporated. The new dashboard included an overview of ARV stockout levels, and it was requested that the same be done for rapid tests, as seen below.
Figure 5: Dashboard V2.1 - current version, May 2019
I V T H E V A N D A S H B O A R D S T E P - B Y - S T E P
The VAN Dashboard enhances visibility in support of supply chain analytics. In most supply chain systems, there are many different information systems with a lack of a unified connecting point . Each system operates individually, leading to a duplication of efforts in many cases and missed opportunities for data analysis that could lead to system

| 8
improvements. A person must consult several different spreadsheets and databases to get a full picture of the system. The dashboard aggregates these information systems and is key to the successful implementation of a VAN. Below are some key steps that should be followed to creating a dashboard:
1. Establishing the dashboard starts with consolidating existing data sources. Survey the data landscape. For LMSC only at electronic sources of data are relevant given the national objective of making the medicine supply chain data systematic and electronic, to be available nationally and in real-time. This enabled monthly updates. The sources for data for the VAN are currently SIGLUS monthly data and Bollore’s monthly distribution reports. These reports are available as Microsoft Excel worksheets.
2. Discuss with stakeholders the kind of KPIs and visualizations they would like to include in the dashboard. This may be limited by the capacity of partners with regards to data analysis and may be more appropriate at a later date when members are more familiar with the data set and evidence-based decision making.
3. Construct the dashboard with a focus on visuals that are clear and concise for easy interpretation. Consider the level of capacity for data analysis of the users and how project needs may change over time.
4. Present the dashboard to the working group. Dedicating one or more of the monthly meetings to the strengths and weaknesses of the dashboard for constant improvement. It is also essential to guide users through reading the dashboard.
5. Changes will be made constantly based on the needs of the group, changes in data sources/technology and more. As the project progresses there may be increased/improved data. In the case of LMSC, SIGLUS reporting changed and working group members gave feedback on the lack of clarity in the first dashboard. This led to a change in the visualizations to make them easier to read and interpret.
Dashboard Visualization and Interpretation The Dashboard is a central part to the VAN process. The monthly distribution meetings share the updated dashboards with working group members for them to discuss and analyze. The dashboard’s excel file is attached (Annex 5) and is to be updated with every month by the responsible team member (see section IV).
District-level Dashboard The “Dashboard – Distritos” tab on the excel file shows the data visualizations.
‘Percentage of requisitions submitted on time’ (% pedidos submetidos a tempo)
This indicator shows if a district has submitted monthly requisitions at all or on time. Data is compiled from SIGLUS.
A tempo - % of HFs in the district that submitted requisitions electronically during the mandated period of the 21st to the 25th of each month.
Submetidos - % of HFs in the district that submitted requisitions electronically, including those who submitted after the 25th of the month.
The first line shows the average for all project districts.
Example: In the district of Pebane, 64% of the total number of HFs submitted electronic requests on time, of those, 43% of the total number of HFs submitted electronic requisitions on time.
Figure 6- Requisitions submitted on time

| 9
Figure 8- HFs with rapid tests out of stock
Figure 9- HFs deliveries during working hours
‘Percentage of HFs with ARVs out of stock’ (% de US com ARV em rotura de estoque)
This indicator shows the percentage of HFs in a district that endured a stockout of ARVs during the statistical month of the 21st to the 20th. The stockout need only to have occurred once and the graph does not display the length of the stockout.
Example: During the month in question, 29% of HFs in Mocuba were stocked out of ARVs at least once.
‘Percentage of HFs with rapid Tests out of stock’ (% de US com TDR em rotura de estoque)
This indicator shows the percentage of HFs that stocked out of rapid tests during the statistical month. The stockout need only to have occurred once and the graph does not display the length of the stockout.
Example: During the distribution month, 26% of the HFs in the district of Morrumbala were stocked out of rapid tests
at least once.
Figure 7- HFs with rapid tests out of stock
‘Percentage of HF Deliveries during work hours’ (% US entregue na hora de expediente)
This graph shows the percentage of HFs that receive deliveries during the working of 7:30 am and 3:30 pm. It also shows the percentage of HFs that receive a delivery at all.
Na hora: deliveries made during working hours.
Entregue: % of facilities in a district that received deliveries.
Example: in Zambezia province, 88% of the HFs in the project districts received deliveries. 0% received deliveries during the work hours.

| 10
The below table (placed beneath the main graphs shown above in the excel sheet) depicts complementary and supplementary information.
This table is designed to improve the ability of the user’s to interpret and analyse the dashboard. It also provides information but may not necessarily be displayed at every monthly– it is for the VAN Coordinator and DPS to decide which figures show the most valuable information.
The first section shows the project districts, as well as average figures for all districts in the “All districts” row. The second section visualises Figure 5 differently; this may come in handy if the graph is difficult to decipher because values are too close or for those who have trouble distinguishing the 2 colours.
The third section has more detailed information about stock outs. Under “Medicamentos em rotura” it shows the average number of medicines stocked out in a district and the average number of weeks the medicines were stocked out. Under “ARV em rotura” and “Testes rapidos em rotura” the table shows the percentage of health facilities sotcked out as well as the average length of the stockouts for ARVs and for rapid tests.
The last section of the table details delivery information also shown in the figures. It shows the percentage of HFs visited, the percentage of deliveries made during work hours (Figure 9), the percentage of health facilitie that reported discrepancies, the average waiting time of delivery trucks in hours, and the number of deliveries in each waiting time category (low, medium, high).
Health Facility-level Dashboard The “Dashboard - Unidades Sanitarias” tab on the excel file has the same information provided by the district-level dashboard, broken down by health facility in each district. This provides more granular information allowing the user to understand what is driving district-level indicators and to elaborate targeted improvement action plans. Below is an example from the district of Gilè.
F
Figure 3- HFs with ARVs out of stock
Figure 10- District level dashboard
Figure 11- Health facility level Dashboard

| 11
Figure 11 follows the same structure as Figure 10, providing the same information at health facility level. The first section of the table lists the health facilities in the district. The second section shows the date of the submission of the requisition and whether it was in the mandated period. Health facilities that did not submit their requisitions electronically are highlighted with a red dot.
The third section of the table shows information on stockouts. The first column provides the number of tracer commodities stocked out in a health facility. The following column shows the average length of stock outs in weeks. The next two sections detail the stockouts of ARVs and Rapid Tests, with the first column being the number of commodities stocked out and the second being the average length of time in weeks.
The fourth and final section of the table shows the distribution details, illustrating whether the delivery took place, whether it took place during work hours, whether there were any discrepancies, the wait time of delivery vehicles in hours, and whether the wait time was low, medium or high (defined in figure 10).
This table provides complementary information to those summarized in the district-level dashboard. For example, while Fig 6 shows an average of 31% of HFs that experienced stockouts for rapid tests, Fig 11 shows exactly which HFs those are (CS Alto Ligonha, CS Monela and CS Uape). A step-by-step guide to updating the dashboard every month is provided in Annex 1.
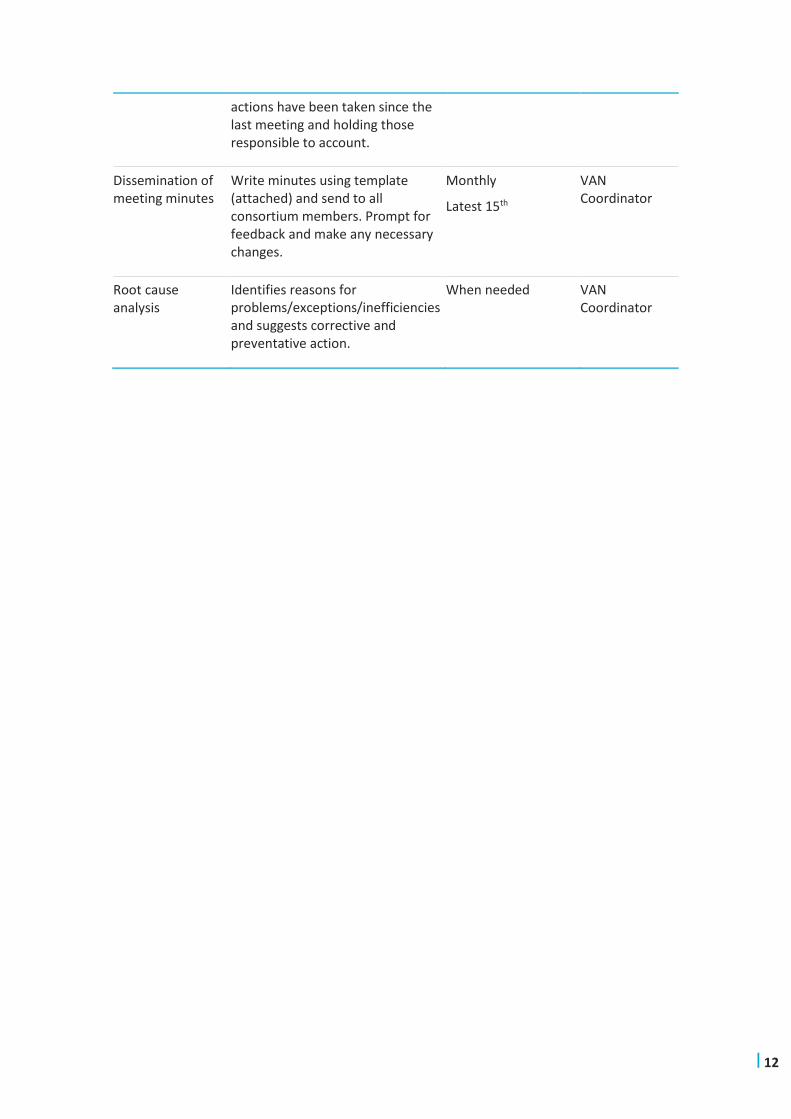
Key VAN Activities The VAN is supported by several routine activities that ensure consistent participation, up-to-date data and mechanisms to hold members accountable. A regular forum is advisable as well as tools such as monthly meetings presentation and minutes template (Annexes 2 and 3). Below is a description of suggested activities and timeline:
Process Description Frequency/When Responsibility
Data collection Collect data from SIGLUS and Bollore
Monthly
End of distribution period (end of month)
DPM data collector. Bollore
Dashboard update Using the data collected and following the steps described in an above section, update the dashboard.
Monthly
1-5 of month
VAN coordinator
Meeting date setting
Organize the place/time and make sure those invited are aware. If any changes are made, let working group members know immediately.
Monthly
During meeting
VAN coordinator
Working group meeting
Discussion of monthly dashboard, analyzing of data, taking appropriate decisions and allocating those responsible. The meeting should also summarize each distribution and discuss what
Monthly
Around the 10th
DPM/VAN Coordinator
| 12
actions have been taken since the last meeting and holding those responsible to account.
Dissemination of meeting minutes
Write minutes using template (attached) and send to all consortium members. Prompt for feedback and make any necessary changes.
Monthly
Latest 15th
VAN Coordinator
Root cause analysis
Identifies reasons for problems/exceptions/inefficiencies and suggests corrective and preventative action.
When needed VAN Coordinator

| 13
V P R I N C I P L E S O F T H E V A N
The VAN’s design aims to make use of the existing information technology and management structures, while challenge existing ways of working and building greater collaboration and coherency. The following are key principles:
― People: Establishing clearly defined roles and responsibilities, and skills requirements for data analysis and supply chain planning, and where necessary advocating for hiring and capacity building to enable new ways of working.
― Processes: Establishing fine-grained, closed loop forecasting and planning processes, to support and enhance ‘quantification’, and allow inventory and distribution planning to match expected demand.
― Technology: Ensuring that actors at all levels (MISAU, national programs, county, sub-county) can see and analyze key data points which will result in coordinating their actions.
― Policy: Establishing a shared understanding of supply chain performance, common and inter-operable metrics and governance of continuous improvement projects.
As LMSC is executed at the provincial level, the principles of ‘people,’ ‘processes,’ and ‘technology’ are most pertinent. The principle of ‘policy’ will be discussed in concert with decision making and expected outcomes in the last section.
P E O P L E
People drive the design, process and use of technology for the largest impact
Within the LMSC project, VillageReach, ThinkWell, PSM, FGH and FHI have been providing technical assistance to the Ministry of Health (MISAU) as well as the Provincial Health Directorate (DPS) on logistics and supply chain management. This technical assistance has only touched the surface of data utilization to drive decisions. For a strong VAN, MISAU and DPS must recognize the need for increased human resources and analytical capability to lead continuous improvement efforts. To develop the people component of the VAN, the following steps have been undertaken in Zambézia and will need to be undertaken in any future geographical expansion of the VAN:
1. Build internal capacity at the DPS, DDS and at health facility level to manage the VAN cycle. This work begins at data collection and goes through data analysis, developing and implementing an improvement plan, and confirming results based on further data analysis. Capacity building will need to be provided through two channels:
― A technical advisor to the DPS/DPM, to provide capacity building for data analytics and utilization. The technical advisor drives the systematic data review processes and provides guidance to the provincial level to ensure proper data review, analysis, and evidence-based decisions. In the LMSC context, this is the VAN coordinator.
― A dedicated technical assistant to the DPM/DDM from the larger networks of partners. Using the human resources available in consortium networks, targeted capacity building can be done when the need emerges. For example, if incorporating geospatial information to the supply chain, a partner could arrange for training for the working group in geographic information system (GIS). This has not happened to date inZambézia .
Objective: People exist to ensure that there is a unified and efficient governance of the supply chain professionals that form the VAN. This team organizes and aggregates tasks to speed up and improve decision making. Team members should be well placed to make decisions and have the correct training to perform data analysis of the supply chain. It is not simply a group of existing roles that operate within the supply chain, roles may need to change or be redefined.

| 14
2. Increase DPS’ capacity to improve efficiencies in transportation. Consortium partners provide guidance, technology, and insights to identify and implement efficiencies in the transportation system. This increases transportation managers’ ability to track key indicators related to cost, driver performance, and asset management, helping them develop distribution performance management plans to leverage efficiencies in transportation.
Roles and Responsibilities The following is a summary of expected VAN roles and responsibilities.
Role/Entity Responsibility Skills
DPM Director
1. Take lead/ownership on VAN process 2. Share inventory details with planner 3. Discuss supply chain challenges 4. Raise issues faced by HFs with VAN
personnel 1. Coordinate with transporters/HFs/DDMs
to resolve issues 2. Input knowledge of healthcare/supply
chain to service delivery setting 3. Drive continuous improvement in supply
chain processes
Supervision
Developing policies and standards
Knowledge of supply chain process
Ability to work with various stakeholders
Decision making, presentation, organization and analytic skills
Experience with relevant software packages
Logistics coordinator (Bollore)
1. Create distribution plans 2. Transport cost management and
optimization 3. Perform root cause analysis for receipts
of transport delays 4. Provide monthly distribution report
Management and coordination skills
Geographical knowledge
Intuition to make judgement calls
Consortium Partners
1. Share of resources/information 2. Coordinate with other stakeholders 3. Drive continuous improvement in supply
chain processes
Communication and organization
Data analysis
VR VAN Coordinator
1. Responsible for updating monthly dashboard, presentation, meeting agenda and minutes
2. Responsible for sharing working group information such as date/time of meetings
3. Advocate for necessary changes with MISAU/DPS
4. Coach, assist and train relevant healthcare staff on data analysis and root cause analysis
5. Offer technical support on Dashboard to 6. Establish transition plan for VAN to DPM
Knowledge of supply chain
Ability to work with partners and advocate for project
Quality control
Organization and management
Strong analytic skills
Experience of software packages including Microsoft office (particularly Excel)

| 15
7. Drive continuous improvement in supply chain processes
DDM Director
1. Coordinate with DPM and HFs 2. Facilitate and disseminate distribution
plan 3. Future potential to start district VANs
Organization and management
Communication
Data analysis
SIGLUS Data Manager - DPM
1. Collect and organize monthly data 2. Flag issues to DDM and attempt to
resolve 3. Track and report data monthly
Microsoft Excel
Data analysis
P R O C E S S E S
Processes for data collection, analysis and utilization need to be clarified at each level of the system to build accountability measures and expectations of high performance. To ensure an effective functioning of the LMSC’s VAN, the following processes have been established:
1. Systematic monthly reviews of logistics data. Systematic reviews of monthly logistics reports have been established and are embedded in monthly meetings of the working group. During these meetings, the data from project districts are reviewed and analyzed and the review process is thoroughly documented. With a view to the future, a key aspect will be analyzing data from the multiple data systems to better assess performance of the health system in general.
2. Establish KPIs that drive action. Currently, MISAU/DPS seldom considers logistics KPIs when assessing health system performance, although the programmatic success depends on an efficient and functioning supply chain. Clear KPIs for measuring success at both the provincial and district VAN have been established through the data sources that available. These KPIs will become an integral part of the monthly logistics data review process and tied to roles that create clear accountability for specific business processes. The KPIs will be added to the information system for real-time measurement of each metric.
3. Continuous improvement of data collection in all HFs and districts. A continuous push to improve data quality at all levels is essential to guarantee an effective VAN. To this end, processes have been established to improve data collection, starting from key data points. This also includes efforts to support the national implementation of SIGLUS. Improved data collection will lead to insight into the following areas of interest for MISAU and DPS:
Best practices:
• Upload data/dashboard and all pertinent documents to DropBox/shared drive as soon as it’s collected.
• Use the agreed upon naming convention when saving data in the shared DropBox.
• If there are changes to the data flow, notify the VR M&E and VR VAN Leads.
Objective: Processes are focused on using a data driven approach to plan, proactively respond and recommend continuous improvements to the functional components of the supply chain. There is continuous improvement to adherence and SOPs, however, it is more than just a one-off system redesign.

| 16
― Current cold chain inventory with improved visibility into functioning and nonfunctioning equipment.
― True wastage rates, the reasons behind them, and recommendations for better stock management to reduce wastage.
― More reliable data on consumption, by which more accurate coverage rates can be estimated.
― Transport capacity and management practices.
Process Components The following supply chain functional processes are relevant for the Visibility and Analytics Network and when analysis monthly data it is useful to frame problems and decisions by these categories:
1. Demand Planning is the process of forecasting future demand based on consumption patterns, and inputs from healthcare experts and health facility pharmaceutical staff using statistical tools. In the LMSC case, health facility pharmaceutical staff using SIGLUS input data on medicine consumption that provides a baseline to predict demand.
2. Supply Planning, Inventory Management is the process of defining the right inventory levels at various points within a supply chain network to minimize stock out, reduce material waste due to expiry, and optimize investment in inventory and storage facilities based on the available resources/budget. The supply planning process secures supplies to meet future projected demand. Supply planning involves coordinating with suppliers, in this case the DPM who supplies the Districts, to get supply commitments, purchase orders according to the supply plan, and review supplies. In case of a supply disruption, the supply planning process will inform all stakeholders and initiate inventory allocation/movement to manage risk.
3. Distribution/Transportation Management is the process of ensuring storage and distribution of products between warehouses/HFs. The transport planner (Bollore) generates a distribution plan in partnership with the DPM that is executed (picked, packed, and shipped) by the DPM. In case of exceptions due to delayed or short/excess stock, an alert is sent to all concerned stakeholders. This process also includes management of third-party service providers, optimization of resources, and securing the supply chain.
T E C H N O L O G Y
The current information systems available to MISAU for supply chain management– SIGLUS and SIMAM– fall short for ease of usability, functionality and analytics. As a short-term
Objective: Technologies concerned with the systems for data collection and aggregation. It is not simply a registry for existing systems, it aims to maximize and improve data use and visibility.
Visibility and Analytics Network (VAN) Component
1. Demand Planning2. Supply Planning,
Inventory Management
3. Distribution/Transportation
Management

| 17
solution, the VAN dashboard is hosted in Excel, where data sources are consolidated manually. To facilitate processes and increase the VAN’s effectiveness, the following steps should be considered:
1. Consolidate platforms for data collection and analysis. The VAN Dashboard consolidates data currently collected through different platforms, representing a first step towards a vision of unified data sources. Consolidated data platforms will bring enhanced visibility to information required for stakeholder and donor reporting, forecasting, procurement, transport management, cold chain equipment procurement, and warehouse planning.
2. Upgrade the software currently hosting the VAN dashboard, with an eye to automatically update and fully integrate with data collection platforms. The current dashboard is hosted on Microsoft Excel. The decision to use Microsoft Excel was based on its ease of availability, the relative ease of finding human resources capable of working with it, and its flexibility, since the initial phases the dashboard required several iterations. As more funds become available, alternative technologies should be considered, including PowerBI, Tableau, and Superset. Future considerations can also be made for geospatial mapping, real-time cold chain monitoring and more. Eventually, there is the possibility for a web-based dashboard with better tracking of actions to take and accountability measures.
Much more can be done with technology based on priorities, budgets and human resources. As the project advances, there is always room to change the selection based on the needs of the project and resources.
V I P O L I C Y A N D G O V E R N A N C E C O N S I D E R A T I O N S F O R D E C I S I O N M A K I N G
Assumptions and Prerequisites A very critical element for the VANs success is the presence of actors and stakeholders able to galvanize strategic information and lead the change process. Managers at the DPS/DPM need to support and understand the VAN, as well as be active and visible to stakeholders and relevant partners.
The VAN can take supply chain management to the next phase of growth by fine-tuning the distribution system and expanding the data visibility, analysis and continuous improvement practices to LMSC districts and provinces. By enhancing data visualization and analytics which then forms the basis for continuous improvement, the following results can be expected:
― Improved accountability through action-driven alerts ― Improved data quality as a result of feedback loops to each level of the supply chain ― Proactive decision making driven by increased insight into the performance of the
supply chain ― Policy definition informed by data ― Improved supply chain performance as a result of improved planning and execution
To generate quality decisions, the problems and needs of the supply chain need to be defined, agreed upon and communicated. There must be accountability within the VAN working group and all entities must commit to communicating to necessary actors and sharing necessary data. The VAN meeting minute template (Annex 3) has been designed to make accountability central and to be able to keep track of progress.
Objective: Policy aims to empower stakeholders with data visibility and performance measurement methods to make lasting change in the supply chain.

| 18
Below are some examples of decisions that have emerged as a result of the VAN process in the LMSC.
Case study – How VAN data helped decision making in Zambézia
Problem observed Action taken
Long wait time at DPM when loading the truck
Organize packages (sort, pack) the day prior to delivery
Use all human resources possible on organizing days; ensure they are available
DDM not being aware of the delivery (no call-ahead)
Consolidate distribution plan early
Communicate plan to districts as soon as plan is made and again a few days before
Truck storage quality (it is important to use containerized and sealable trucks)
Bollore will put a public tender to get transporters with suitable vehicles
Evidence from the VAN was used to identify problems, such as long wait times at the provincial warehouses (visualized in figures 9 and 10). In subsequent meetings, these data could be used to monitor to set goals/standards and monitor improvement. The solutions consider how to improve supply chain functional processes of planning and inventory management.
The focus on policy should be about generating evidence that can be fed back to the central level with the aim of improving the supply chain. Although the LMSC VAN is active at provincial level and as such, with better data visibility the VAN can generate evidence for potential improvements and support the case for the required policy changes. Some potential policy changes that could come out of improved visibility include:
― Updating and revising implementation plans throughout the year to have a more fluid plan that reacts to immediate needs, instead of an inflexible annual plan.
― Optimizing distribution systems or a complete system redesign if additional visibility shows inefficiencies or a breakdown of distribution flows at certain levels.
― Improving feedback loops by ensuring it is automatic. Each HF has access to a tablet with SIGLUS in which feedback and more complex analysis functions could be programmed. This will lead to better analysis of stock information and historical consumption to capture trends over time to improve demand planning. Alerts could be built into the system to highlight trend excursions, such as when consumption has a more than 15% increase or decrease, in order to seek more information to better understand the situation.
How the VAN Approach can make a Difference
VAN principles allow actors to think outside of the current policies and plans in place, and instead focus on continuous course correction. With this small group of highly skilled workers who are encouraged to make or recommend adjustments based on the data as and when they deem appropriate, there is the potential to make policy and process improvements that can ultimately be expanded and adopted. Since VAN changes can occur on a short timeline, they can generate evidence on which policies are based.

| 19
V I I C H A L L E N G E S T O T H E I M P L E M E N T A T I O N O F T H E V A N
Coordination amongst the VAN coordinator and the ThinkWell team has not been optimal. Despite the VAN dashboard having been introduced with the first distribution in September and meetings having happened monthly since then, ThinkWell has not fully implemented the workplan on the VAN component. The team has not been able to participate in all the VAN meetings to observe the interaction amongst partners and support capacity building on the VAN use, as communications on meetings have not been always timely. Additionally, the iterative process of revision of the VAN dashboard, although based on joint analysis of bottlenecks and root causes, was led by the ThinkWell’s team, with limited involvement of the VAN coordinator.
Gaps in ability, such as use of Excel or other technologies at the DPS level can hamper the use and update of the dashboard by the provincial authorities. Despite having worked with the project’s VAN coordinator to guarantee, as part of the VAN development process, an updated dashboard, continuous technical support as well as a matrix to track the discussion and agreed actions, ThinkWell contributed only partially to fill gaps in ability at DPS level.
V I I I L E S S O N S L E A R N E D
The experience of VAN for transportation in Zambézia province can be capitalized for further expansion in other provinces. The VAN dashboard and working group can be replicated in other provinces at a relative low cost, given that the project has already put in place a dashboard and a full manual and toolkit for the functioning of the VAN process, including update of the dashboard.
VAN meetings and process can be used to improve planning and communication around transportation from the provincial level to facilities. According to the Capability Assessment in 155 health facilities conducted by ThinkWell within the LMSC project, results related to visibility of day-of-dispatch and operations plans, for instance, were very low in all the districts. Therefore, VAN meetings could be used within LMSC to improve indicators related to transportation. Next steps in communication should include providing an immediate feedback loop to health facilities and other supply chain actors.
Communication around VAN meetings should be improved in order to guarantee participation of relevant actors. ThinkWell’s presence in the VAN meetings could have ensured support to the VAN coordinator in the capacity building process to the DPS on the use of the VAN dashboard, as well as continue feeding the process’ improvement plan.
Based on this experience, ThinkWell recommends using a human-centered design (HCD) approach to upgrade the Visual Analytics Network, focusing on specific aspects that need fine tuning. Possible utilization of HCD includes:
1. On the VAN meetings to optimize the network, the tools and sharpen the process.
2. On the VAN dashboard to identify appropriate technology to host the high-fidelity VAN dashboard and to fine tune requirements (such as indicators to be included, visual).

| 20
A N N E X
Annex 1- Guide to monthly update of VAN
Annex 2 - Presentation template
Annex 3- Minutes template
Annex 4- Monthly Checklist
Annex 5 -VAN Excel

| 21
ANNEX 1 Actualização mensal da dashboard VAN
1. Relatório de distribuição de medicamentos (Bollore distribution report)
a. Abrir o file VAN e entrar na folha “Bollore distribution report”
b. Selecionar o conteúdo das colunas C, D, E, F, G, H (não selecionar os títulos das colunas

| 22
c. Cancelar o conteúdo das colunas selecionadas
d. Abrir o Relatório de distribuição e identificar as seguintes colunas:
i. Health Facility ii. Actual Arrival Date
iii. Actual Delivery Date iv. Time Spent at Delivery v. KPI - Normal Business Hours
vi. Discrepancy
e. Copiar o conteúdo da coluna “Health Facility” no Relatório de distribuição

| 23
f. Colar o conteúdo da coluna “Health Facility” na folha “Bollore distribution report” do VAN, na coluna certa.

| 24
g. Repetir os pontos “1.e” e “1.f” por cada coluna identificada no ponto 1.d
h. Scroll until the end das colunas das colunas C, D, E, F, G, H, e controlar que o
conteúdo das colunas A e B chega exactamente ate a mesma linha. i. Se o conteúdo das colunas A e B chega mais abaixo, cancelar o conteúdo
extra

| 25
ii. Se o conteúdo das colunas A e B chega não chega ate a ultima linha das
colunas C, D, E, F, G, H, drag down to fill in the empty cells
i. Filtrar a coluna A para identificar os erros

| 26
j. Olhar para o nome do centro de saúde/armazém na coluna C.
k. Na folha “HF masterlist (quickstart)” identificar o mesmo centro de
saúde/armazém.

| 27
l. Actualizar o nome do centro de saúde/armazém na coluna C da folha “Bollore
distribution report”, copiando o nome encontrado na coluna I da folha “HF masterlist (quickstart)” e colando-lho na célula certa na coluna C da folha “Bollore distribution report”.
m. Repetir ate ter eliminado todos os erros

| 28
2. SIGLUS Stock level data
a. Na folha “Stock level data”, selecionar e cancelar o conteúdo das colunas C ate N
b. Copiar o conteúdo de cada ficheiro de stock level data por cada produto sentinela

| 29
c. Colar na folha “Stock level data” nas colunas C ate N
d. Repetir ate ter copiado os dados de cada produto sentinela
e. Similarmente ao ponto 1.h, controlar que o conteúdo da coluna A chega exatamente ate a última linha das colunas C ate N
f. Similarmente aos pontos 1.i ate 1.l, identificar os erros na coluna A, e corrigir-lhos
copiando os nomes das unidades sanitárias/armazém que encontrarmos na coluna H da folha “HF masterlist (quickstart)”

| 30
3. Pedidos SIGLUS
a. Na folha “Pedidos SIGLUS”, selecionar e cancelar o conteúdo das colunas B ate L
b. Copiar o conteúdo do relatório dos pedidos SIGLUS

| 31
c. Colar os valores copiados na folha “Pedidos SIGLUS”, nas colunas certa (B ate L)
d. Repetir os pontos 2.e e 2.f