last year of life study - centers for medicare & medicaid services
TRANSCRIPT

Centers for Medicare & Medicaid Services, Office of the Actuary
Last Year of Life Study
Steve Calfo Jonathan Smith
Mark Zezza
Contents
Executive Summary ........................................................................................................................ 1 I. Introduction ................................................................................................................................. 3 II. Research Design......................................................................................................................... 5
Data..........................................................................................................................................5 Study Sample...........................................................................................................................5 Death and Survivor Cohort Determination..............................................................................6 Expenditure Allocation to a Monthly Basis ............................................................................6 Exposure Determination..........................................................................................................6
III. Findings..................................................................................................................................... 7 Per Capita Costs ......................................................................................................................7 Per Capita Decedent/Survivor Ratios .....................................................................................8 Relative Cost Factors...............................................................................................................9 Decedent and Survivor Age Group Costs Relative to the Total............................................10 Relative Per Capita Age Group Ratios within Decedent and Survivor Cohorts ...................10 Death Percentage ...................................................................................................................11 Share Analysis .......................................................................................................................12 Types of Service ....................................................................................................................12
IV. Discussion............................................................................................................................... 13 References..................................................................................................................................... 15 Appendix I. Discussion of Decedent to Survivor Expenditure Ratios......................................... 16 Appendix III. Discussion of BBA Impacts on LYOL Expenditures ........................................... 18 Appendix IV. Formula Definitions .............................................................................................. 19 Tables............................................................................................................................................ 20

Executive Summary
Factors that make up last-year-of-life expenditure effects include practice patterns, technological advances, and patient preferences. The purpose of this study is to investigate the characteristics of Medicare expenditures for care provided in the last year of life from 1994 through 1999. During the study period, impacts due to legislation and changes in managed care enrollment also were considered.
The analysis was performed using claims data from the five percent sample standard analytical files for the Home Health, Inpatient, Outpatient, Durable Medical Equipment, Hospice, Skilled Nursing Facility, and Physician record types. The date of death and demographic information for beneficiaries in the sample were drawn from Denominator files for the period.
The study yielded the following key Findings:
• The percentage of Medicare expenditures attributable to those beneficiaries in their last year of life increased from 26.5 percent in 1994 to 27.9 percent in 1999. These results are consistent in magnitude with the findings of other research (Lubitz and Riley, 1993; and Hogan et al., 2001). However, an upward trend was found in this study, which is inconsistent with prior research.
• The per capita costs (unadjusted for population changes) for decedents increased from $20,134 in 1994 to $24,856 in 1999, or 23.5 percent, while survivor costs increased from $3,081 to 3,669, or 19.1 percent over the same period. The increases in per capita costs were greatest in the youngest age groups. As observed in prior research (Lubitz and Riley, 1993), decedent costs decrease with increasing age while survivor costs increase with age.
• Decedent to survivor per capita cost ratios increased during the period, both in aggregate and by age group. For each group, the ratios increased at different rates with the largest increases found in those aged 85-89 and over 90 (the two oldest age groups). The relative cost factors (RCFs) for decedents increased over the period. Increases were greatest for the youngest males and females in the group aged 70-74. Survivor RCFs decreased during the period.
• Relative to survivor costs, decedent costs by type of service show increases as a share of total expenditures in the more intense services. The greatest increases in the decedent share of expenditures were for inpatient hospital and skilled nursing facility care across age groups and gender. The last-year-of-life effects on the distribution of services were mitigated by legislative effects. However, the legislative effects were small relative to the last-year-of-life effects.
• The significant changes in managed care enrollment over the study period may have introduced some bias into the findings. Beneficiaries enrolling in managed care utilize fewer services than in Fee-For-Service (FFS). This trend suggests higher survivor costs in FFS than there would have been absent the changes in managed care enrollment and, as a result, lower decedent survivor ratios. Fully quantifying the extent to which the results are influenced by this effect will require additional research.
1

This study contributes to the current body of research in this area by examining the most current data, a more robust sample, and a methodology that allows analysis of actual rather than extrapolated last-year-of-life expenses. The analysis has shown current trends in decedent/survivor costs, their relationship to each other, and the changes in this relationship over time. In addition, the finding that the relationship has changed to varying degrees by age groups provides the impetus for including age, gender, and decedent/survivor refinements into the current Medicare projection methodology.
2

I. Introduction
The U.S. population is expected to age rapidly through 2030, when 19.6 percent of the population will be over the age of 65, compared with 12.3 percent in 2000.1 Two major reasons for this increase are the aging of the baby-boom generation (those born between 1946 and 1965) and increased longevity. Due to the aging of the baby-boom generation, there will be a significant increase in the number of Medicare eligibles starting around 2011, shifting the age distribution of the population to the 65-and-over age group (The Medicare Boards of Trustees, 2002). Increased longevity also contributes to this phenomenon in two ways. First, more people will be alive at the Medicare eligibility age of 65. That is, those reaching the Medicare eligibility age in 2003 were born in 1938, when life expectancies for the average person equaled 63.5 years (Centers for Disease Control, 2001). In comparison, the average person born in 2003 is expected to live 77.1 years.2 In addition, individuals’ duration of eligibility will increase. Persons reaching 65 years of age in 2000 are expected to live 4 years, or 28.7 percent, longer than persons reaching 65 years of age in 1950.
In 2001, Medicare spending accounted for 17.0 percent of total national health expenditures (Centers for Medicare & Medicaid Services, 2003). Total Medicare expenditures, as a percent of total gross domestic product, rose from 1.8 percent in 1990 to 2.4 percent in 2000, suggesting that the burden of financing this program has been increasing. The aging of the population will intensify this burden as a greater percentage of the population becomes eligible to retire, reducing Medicare income tax revenue, and a greater proportion of the population enters the Medicare program, increasing Medicare expenditures. Multiple factors must be considered when assessing the impact of the aging of the population on the solvency of the Medicare program.
Starting in 2011, the baby boomers will begin entering the Medicare program, causing a major shift to the young-elderly age groups (Table 1). Then around 2031, there will be a shift toward the groups aged 85 and older. This shift is important because on average these age groups have different per capita costs. As the Medicare population increases and the distribution shifts to older age groups, there will be increases to aggregate Medicare expenditures.
Historically, approximately one-quarter of Medicare expenditures are for last-year-of-life (LYOL) care (Hogan et al., 2001; and Lubitz and Riley, 1993). It has been shown that expenditures for beneficiaries in their last year of life are approximately six times higher than those of survivors (Lubitz and Riley, 1993). Lubitz and Riley (1993) calculated 1976 Medicare decedent costs to be over ten times the costs for beneficiaries aged 65 to 69. This ratio steadily declines with age, as decedent costs were only four times greater than survivor costs for Medicare beneficiaries 85 years of age and older. The pattern of decreasing end-of-life expenditures with increasing age has been attributed to decisions reached by patients, their families, and their physicians to avoid aggressive care that may have less benefit for older patients (Lewinsky et al., 2001).
1 Based on estimates made by the Social Security Administration, Office of the Actuary. 2 Based on estimates from the U.S. Census Bureau, International Database.
3
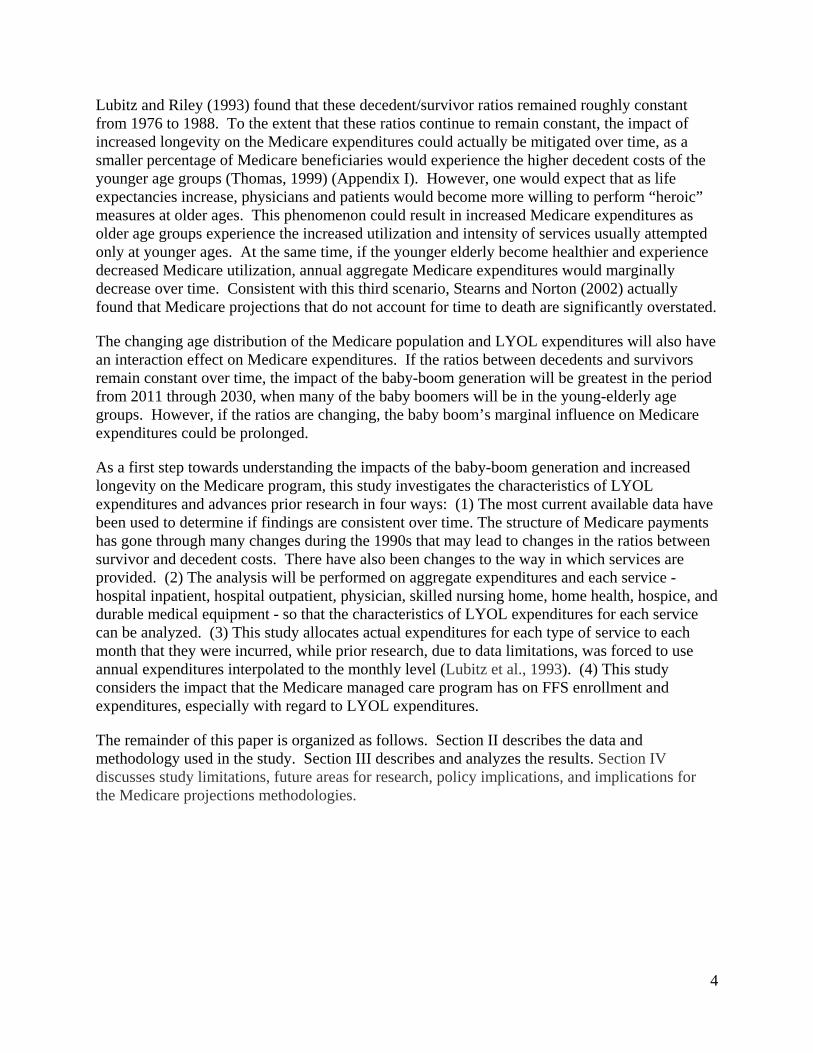
Lubitz and Riley (1993) found that these decedent/survivor ratios remained roughly constant from 1976 to 1988. To the extent that these ratios continue to remain constant, the impact of increased longevity on the Medicare expenditures could actually be mitigated over time, as a smaller percentage of Medicare beneficiaries would experience the higher decedent costs of the younger age groups (Thomas, 1999) (Appendix I). However, one would expect that as life expectancies increase, physicians and patients would become more willing to perform “heroic” measures at older ages. This phenomenon could result in increased Medicare expenditures as older age groups experience the increased utilization and intensity of services usually attempted only at younger ages. At the same time, if the younger elderly become healthier and experience decreased Medicare utilization, annual aggregate Medicare expenditures would marginally decrease over time. Consistent with this third scenario, Stearns and Norton (2002) actually found that Medicare projections that do not account for time to death are significantly overstated.
The changing age distribution of the Medicare population and LYOL expenditures will also have an interaction effect on Medicare expenditures. If the ratios between decedents and survivors remain constant over time, the impact of the baby-boom generation will be greatest in the period from 2011 through 2030, when many of the baby boomers will be in the young-elderly age groups. However, if the ratios are changing, the baby boom’s marginal influence on Medicare expenditures could be prolonged.
As a first step towards understanding the impacts of the baby-boom generation and increased longevity on the Medicare program, this study investigates the characteristics of LYOL expenditures and advances prior research in four ways: (1) The most current available data have been used to determine if findings are consistent over time. The structure of Medicare payments has gone through many changes during the 1990s that may lead to changes in the ratios between survivor and decedent costs. There have also been changes to the way in which services are provided. (2) The analysis will be performed on aggregate expenditures and each service - hospital inpatient, hospital outpatient, physician, skilled nursing home, home health, hospice, and durable medical equipment - so that the characteristics of LYOL expenditures for each service can be analyzed. (3) This study allocates actual expenditures for each type of service to each month that they were incurred, while prior research, due to data limitations, was forced to use annual expenditures interpolated to the monthly level (Lubitz et al., 1993). (4) This study considers the impact that the Medicare managed care program has on FFS enrollment and expenditures, especially with regard to LYOL expenditures.
The remainder of this paper is organized as follows. Section II describes the data and methodology used in the study. Section III describes and analyzes the results. Section IV discusses study limitations, future areas for research, policy implications, and implications for the Medicare projections methodologies.
4

II. Research Design
Data
The National Claims History files, prepared by the Centers for Medicare & Medicaid Services (CMS), contain cost information and dates of service for the health care services of all Medicare beneficiaries except Medicare managed care enrollees. By using the dates of service, rather than payment dates, incurred payments could be obtained. Claims data from 1993 through 2000 are used for the analysis.3 The claims are organized by type of service: hospital inpatient, hospital outpatient, physician, skilled nursing home, home health, hospice, and durable medical equipment.
The claims data are limited to those services covered by Medicare. For example, costs incurred for prescription drugs not included in a hospitalization are not contained in the claims data. Also excluded were costs that were not paid by Medicare. For example, a working aged beneficiary’s primary payer is the employer, and Medicare is the secondary payer. As a result, any costs for Medicare-covered services that were paid for by an employer are not included as Medicare expenditures. Finally, these claims payments did not include any amounts paid for by a beneficiary. Therefore, any deductible or coinsurance amounts were excluded from the expenditure tabulation.
Denominator files from 1993 though 2000, also prepared by CMS, were used to obtain age, date of death, and managed care status for each beneficiary. The information on each Denominator file was used to tabulate beneficiaries into five-year age groups based on an attained age basis. The seven age groupings are as follows: under 65, 65-69, 70-74, 75-79, 80-84, 85-89, and 90 and older. The study focused on the over-65 population.
Study Sample
The five-percent sample of beneficiaries was used. A five-percent sample includes approximately one-and-a-half million beneficiaries for each year, thus producing robust sample sizes for each cohort (Table 2). The study sample consisted of Medicare beneficiaries who had either Part A or Part B exposure, including disabled and end-stage-renal-disease (ESRD) beneficiaries. Only Medicare managed care enrollees were excluded from the sample since no claims data are available for them.4
3 Data are available as far back as 1992; however, expenditure data are incomplete for durable medical equipment in 1992. In order to construct an analysis year, the previous year and the following year are required. Therefore, we only report results from 1994 though 1999. 4 The five-percent sample is based on the last digit of the person’s identification number used by CMS. It is possible for new beneficiaries to enter the sample during any given year. There are rare cases in which a beneficiary’s identification number may change, such as when his or her reason for entitlement changes. Therefore, a beneficiary may enter the sample for reasons other than initial enrollment and leave for reasons other than death. However, for purposes of this study, it is not necessary to have the same sample of beneficiaries for each year.
5

Death and Survivor Cohort Determination
For each year included in the study, Medicare expenditures were assigned to either decedents or survivors. For example, in the case of calendar year 1998, beneficiaries who survived through December 31, 1999, were identified as survivors in 1998. All of their enrollment exposure in 1998 and their Medicare expenditures for services provided in 1998 were assigned to survivors. Enrollment exposure and expenditures in 1998 for persons who died in 1998 were assigned to decedents. Additionally, for beneficiaries who died in 1999, a portion of expenditures for calendar year 1998 was assigned to survivors, and a portion was assigned to decedents. For example, if a person died on May 30, 1999, that person contributed the last 215 days of 1998 to the exposure count for 1998 decedents, and all Medicare expenditures for services provided during those 215 days were assigned to 1998 decedents. The first 150 days of 1998 for that same person were assigned to the exposure count for 1998 survivors, and all expenditures for services provided within that period were assigned to 1998 survivors. Appendix II provides a graphical interpretation of the decedent and survivor cohort determination process. The next two sections elaborate on the methodology.
Expenditure Allocation to a Monthly Basis
Claims data expenditures were converted from a from-through-date basis to a monthly one.
This conversion was completed on a uniform basis, separately for each type of service. All claims include a from-date (the date the claim was opened) and a through-date (date the claim was closed). The following methodology was used to allocate expenditures through the claim period. First, the number of days was calculated by taking the day of the year associated with the through date and subtracting the day of the year associated with the from-date. The total dollars of the claim were then divided by the number of days in which the claim was opened and the resulting amount was assigned to each day. Finally, the daily amounts were allocated to the appropriate month. For example, if a beneficiary had a home health claim with a from-date of November 17, 1998, and a through-date of February 11, 1999, with total expenditures of $348. The number of days for this claim would amount to 87 (14 for November plus 31 for December plus 31 for January plus 11 for February). The daily amount would be $4 ($348/87). Thus, the expenditures allocated to each month would be $56 for November, $124 for December, $124 for January, and $44 for February.
Exposure Determination
For each calendar year, an exposure value was calculated for each beneficiary. Within a given year, a beneficiary was assigned a count of 1 for each month in which he or she was enrolled in Medicare. Therefore, if a beneficiary was enrolled in Medicare for an entire calendar year, the beneficiary received 12 months of exposure, or 1 person-year. Decedents received 1 exposure count for each month the beneficiary lived during the calendar year of death. Decedents received 1 exposure count for each month that the beneficiary lived and was enrolled in Medicare in the preceding calendar year from the period of time between the date of death less 1 year and the end of the preceding calendar year. For example, suppose a beneficiary was enrolled in Medicare from January 1997 through his or her date of death, May 1998. That beneficiary would receive a
6

decedent exposure value of 5 assigned to 1998, plus a decedent value of 7 assigned to 1997. The beneficiary would also be assigned a survivor exposure value of 5 for calendar year 1997.
III. Findings
The findings of this study are presented from three general analytical perspectives: an analysis of changes in per capita costs for survivors and decedents; shifts in the ratios of survivor to decedent expenditures and relative cost factors; and changes in the share of costs in aggregate, by type of service, and by age group for survivors and decedents. In addition, these results are compared with other studies that examine last-year-of-life effects.
The analysis of the per capita costs offers insight into the changes in last-year-of-life expenditures, both in aggregate and by age group, for survivors and decedents. The examination of last-year-of-life effects within and across age, gender, and survivor/decedent cohorts will help explain the impacts of these effects on Medicare expenditures. Also, analyzing the shifts in service and age group shares of last-year-of-life expenditures over the study period helps describe how changes across services are provided to the elderly.
Per Capita Costs
Annual per capita costs were calculated in total and separately for each survivor and decedent cohort. Table 3 illustrates increases in per capita costs for both decedents and survivors. Aggregate per capita costs increased from $3,971 in 1994 to $4,863 in 1999, while decedent and survivor per capita costs increased from $20,134 and $3,081 in 1994 to $24,856 and $3,669 in 1999, respectively. The difference between survivor and decedent costs is attributed to volume and greater intensity of utilization (Barnado et al., 2001). Accumulated growth in per capita costs during the period amounted to 23.5 percent and 19.1 percent for decedent and survivor cohorts, respectively, demonstrating a 4.3 percent accumulated growth rate for decedents over survivors. Annualized growth in per capita costs for the decedent cohort grew 0.7 percentage point faster than for the survivor cohort, at rates of 4.3 percent and 3.6 percent, respectively. On an annual basis, increases in per capita costs were higher for the decedents in all years except 1995.
Table 4 displays the annual per capita costs for each age group separately for decedents and survivors. Consistent with prior research, decedent per capita costs decreased with increasing age for every year in the study (Lubitz, 1993). Also, survivor per capita costs increased with increasing age through the 85-89 age group, after which they decreased. For decedents, the accumulated cost growth for the youngest age groups was greater than that for the oldest age groups. This difference would suggest that the increase in intense efforts being performed for younger age groups in the last year of life were more pronounced than for older decedents. One possible explanation for this phenomenon is quality of life; that is, the physician, beneficiary, or their advocates may be less willing to pursue aggressive medical intervention in the older age groups. (Levinsky et al., 2001).
To determine the nature of the relationship between the decedent and survivor costs across the age groups for the study period, the spread or the ratio of the higher value of the per capita decedent costs of the 65-69 and 90+ age groups to the lower value was examined. The decedent spread increased from 1.84 in 1994 to 1.97 in 1999, indicating that the spread in decedent per
7

capita costs between the youngest and oldest age groups widened over the time period. This increase is due to the youngest and most expensive age group growing faster than the oldest age group. Examination of the survivor spread revealed a different pattern. The survivor spread decreased from 1.74 in 1994 to 1.58 in 1999, indicating that the spread in survivor per capita costs between the youngest and oldest age groups narrowed over the time period. This change is due to the youngest (in this case the less expensive) age group growing faster than the oldest age group.
One possible explanation for the increasing spread for decedents is the use of new and more expensive technology accompanied by continued heroic measures for the youngest age groups. Additionally, new technology and aggressive care may be used with less frequency for the oldest age groups. In the case of the survivor spread, a possible proliferation of more successful aggressive care for the younger age groups may be a cause of their faster growth rates.
In Figure 1, the vertical distance between points within an age group represents the change in the per capita costs across the study period for decedents. The three youngest age groups in the decedent cohort showed the largest absolute and relative increases over time, while the older age groups experienced progressively smaller increases in per capita costs.
Per Capita Decedent/Survivor Ratios 5
Table 5 displays the overall and age-group specific ratios of decedent to survivor per capita costs (D/S). At the aggregate level, the D/S ratio increased from 6.5 in 1994 to 6.8 in 1999. When the per capita D/S ratios are controlled for age and gender, the D/S ratio in 1999 increased to 7.0. The D/S ratio increased at different rates for each age group over the period, with the largest relative increases found in the two oldest age groups, 85-89 and over 90. This finding is contrary to prior research, which had shown the relationship to be constant over time (Lubitz, 1993). These results are significant when considering the impact on the current Medicare projections methodology.
The current Medicare projection methodology is based on extrapolation of past trends on a per capita basis; however, no explicit adjustments exist for age, gender, and decedent status. (The Medicare Boards of Trustees, 2002; Technical Review Panel on the Medicare Trustees Reports, 2000). By accounting for the distribution of the Medicare population, the current projection methodology implicitly incorporates some of the effect that changes in the D/S relationship have on Medicare. However, because the ratios are not stable and are changing at different rates, the current methodology does not account for changes over time in the per capita costs by age group in the projections. Modifying the current projection methodology to incorporate age and gender explicit factors by decedent status would more accurately reflect the changes in the D/S relationships across age groups.
No definitive explanation exists regarding the change in the nature of the ratios during the study period. One possible explanation is that improvements in life expectancy have caused a change in practice patterns of providers. In the 1980s and early 1990s, heroic efforts using high-intensity services were provided primarily to beneficiaries in the younger, 65-74 age group. 5 Appendix IV defines all formulas.
8
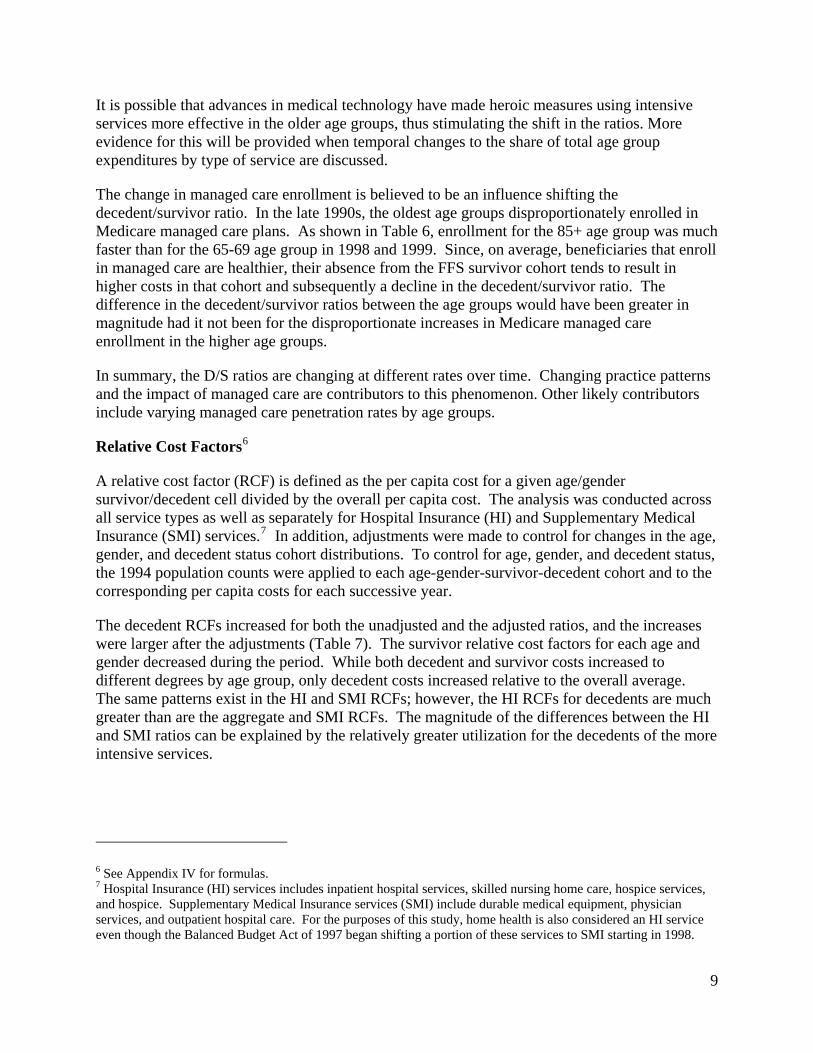
It is possible that advances in medical technology have made heroic measures using intensive services more effective in the older age groups, thus stimulating the shift in the ratios. More evidence for this will be provided when temporal changes to the share of total age group expenditures by type of service are discussed.
The change in managed care enrollment is believed to be an influence shifting the decedent/survivor ratio. In the late 1990s, the oldest age groups disproportionately enrolled in Medicare managed care plans. As shown in Table 6, enrollment for the 85+ age group was much faster than for the 65-69 age group in 1998 and 1999. Since, on average, beneficiaries that enroll in managed care are healthier, their absence from the FFS survivor cohort tends to result in higher costs in that cohort and subsequently a decline in the decedent/survivor ratio. The difference in the decedent/survivor ratios between the age groups would have been greater in magnitude had it not been for the disproportionate increases in Medicare managed care enrollment in the higher age groups.
In summary, the D/S ratios are changing at different rates over time. Changing practice patterns and the impact of managed care are contributors to this phenomenon. Other likely contributors include varying managed care penetration rates by age groups.
Relative Cost Factors6
A relative cost factor (RCF) is defined as the per capita cost for a given age/gender survivor/decedent cell divided by the overall per capita cost. The analysis was conducted across all service types as well as separately for Hospital Insurance (HI) and Supplementary Medical Insurance (SMI) services.7 In addition, adjustments were made to control for changes in the age, gender, and decedent status cohort distributions. To control for age, gender, and decedent status, the 1994 population counts were applied to each age-gender-survivor-decedent cohort and to the corresponding per capita costs for each successive year.
The decedent RCFs increased for both the unadjusted and the adjusted ratios, and the increases were larger after the adjustments (Table 7). The survivor relative cost factors for each age and gender decreased during the period. While both decedent and survivor costs increased to different degrees by age group, only decedent costs increased relative to the overall average. The same patterns exist in the HI and SMI RCFs; however, the HI RCFs for decedents are much greater than are the aggregate and SMI RCFs. The magnitude of the differences between the HI and SMI ratios can be explained by the relatively greater utilization for the decedents of the more intensive services.
6 See Appendix IV for formulas. 7 Hospital Insurance (HI) services includes inpatient hospital services, skilled nursing home care, hospice services, and hospice. Supplementary Medical Insurance services (SMI) include durable medical equipment, physician services, and outpatient hospital care. For the purposes of this study, home health is also considered an HI service even though the Balanced Budget Act of 1997 began shifting a portion of these services to SMI starting in 1998.
9

Decedent and Survivor Age Group Costs Relative to the Total8
This set of ratios demonstrates the ratio of per capita costs for an age group to the total per capita costs across all age groups and cohorts (Dt/T and St/T) (see Table 8). These ratios were adjusted for changing age group distributions.
The decedent-to-total ratios when controlled for age, increased over time for all age groups, suggesting that decedent costs rose faster than survivor costs during the period. The magnitudes of the increases differed by age groups: Increases were largest for the youngest age groups and smallest for the oldest. As did the relative cost factors, the survivor-to-total ratios, when controlled for age, decreased during the period. The decreases were smallest for the youngest age groups and largest for the oldest.
Relative Per Capita Age Group Ratios within Decedent and Survivor Cohorts9
This section examines the relative changes in per capita spending across the age groups within the decedent and survivor cohorts (Dt/D and St/S). This analysis is performed by examining the ratio of per capita costs of an age group to total per capita costs for the cohort. As shown on Table 8, the decedent ratios, when not controlled for age, increased for all but the two highest age groups, highlighting greater increases in decedent per capita costs in the younger over the older age groups. Although the increases are smaller, the same pattern emerges after controlling for age.
Temporal changes in the number of decedents in the study sample constitute one factor influencing the behavior of the ratios. The number of decedents decreased for the four youngest age groups and increased for the two highest. As Medicare managed care enrollment was highly skewed towards the youngest age groups at the beginning of the study period (1994 through 1996), this result is expected.
A somewhat different pattern emerges for the survivor ratios. In both, the age-adjusted and unadjusted cases, there were small changes in the ratios for the younger age groups. This is consistent with the character of enrollment in the survivor cohort, as 90 percent of the enrollment is in the younger age groups. This enrollment characteristic minimized the effect of controlling for age. However, the 85-89 and 90+ age groups changed significantly in 1998 and 1999. The ratios for the 90+ age group, for example, ranged from 1.27 to 1.39 for 1994 through 1997 and fell to 1.26 and 1.15 in 1998 and 1999 respectively. The reason for this decline revolved around the dramatic decreases in home health expenditures for survivors. Aggregate home health expenditures significantly decreased in 1998 and 1999, an effect compounded by the 90+ age group as its share of spending for home health decreased from 24.1 percent in 1997 to 14.7 percent in 1998 and to 11.4 percent in 1999. The 85-89 age group followed a similar trend.
8 See Appendix IV for formulas. 9 See Appendix IV for formulas.
10
Death Percentage
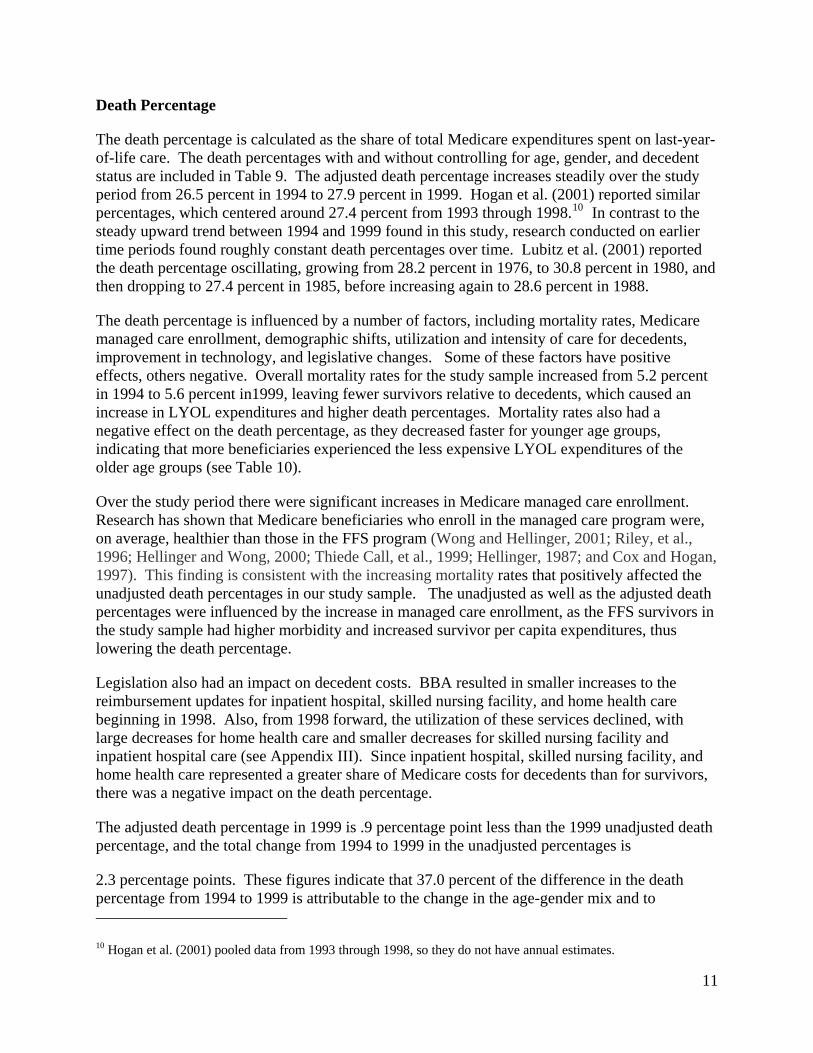
The death percentage is calculated as the share of total Medicare expenditures spent on last-year-of-life care. The death percentages with and without controlling for age, gender, and decedent status are included in Table 9. The adjusted death percentage increases steadily over the study period from 26.5 percent in 1994 to 27.9 percent in 1999. Hogan et al. (2001) reported similar percentages, which centered around 27.4 percent from 1993 through 1998.10 In contrast to the steady upward trend between 1994 and 1999 found in this study, research conducted on earlier time periods found roughly constant death percentages over time. Lubitz et al. (2001) reported the death percentage oscillating, growing from 28.2 percent in 1976, to 30.8 percent in 1980, and then dropping to 27.4 percent in 1985, before increasing again to 28.6 percent in 1988.
The death percentage is influenced by a number of factors, including mortality rates, Medicare managed care enrollment, demographic shifts, utilization and intensity of care for decedents, improvement in technology, and legislative changes. Some of these factors have positive effects, others negative. Overall mortality rates for the study sample increased from 5.2 percent in 1994 to 5.6 percent in1999, leaving fewer survivors relative to decedents, which caused an increase in LYOL expenditures and higher death percentages. Mortality rates also had a negative effect on the death percentage, as they decreased faster for younger age groups, indicating that more beneficiaries experienced the less expensive LYOL expenditures of the older age groups (see Table 10).
Over the study period there were significant increases in Medicare managed care enrollment. Research has shown that Medicare beneficiaries who enroll in the managed care program were, on average, healthier than those in the FFS program (Wong and Hellinger, 2001; Riley, et al., 1996; Hellinger and Wong, 2000; Thiede Call, et al., 1999; Hellinger, 1987; and Cox and Hogan, 1997). This finding is consistent with the increasing mortality rates that positively affected the unadjusted death percentages in our study sample. The unadjusted as well as the adjusted death percentages were influenced by the increase in managed care enrollment, as the FFS survivors in the study sample had higher morbidity and increased survivor per capita expenditures, thus lowering the death percentage.
Legislation also had an impact on decedent costs. BBA resulted in smaller increases to the reimbursement updates for inpatient hospital, skilled nursing facility, and home health care beginning in 1998. Also, from 1998 forward, the utilization of these services declined, with large decreases for home health care and smaller decreases for skilled nursing facility and inpatient hospital care (see Appendix III). Since inpatient hospital, skilled nursing facility, and home health care represented a greater share of Medicare costs for decedents than for survivors, there was a negative impact on the death percentage.
The adjusted death percentage in 1999 is .9 percentage point less than the 1999 unadjusted death percentage, and the total change from 1994 to 1999 in the unadjusted percentages is
2.3 percentage points. These figures indicate that 37.0 percent of the difference in the death percentage from 1994 to 1999 is attributable to the change in the age-gender mix and to 10 Hogan et al. (2001) pooled data from 1993 through 1998, so they do not have annual estimates.
11

differences in the mortality rates of the Medicare population over the time period. The residual 63.0 percent is attributable to all other factors, including improvements and utilization of new technology, increase in use of intensity of services, more aggressive practice patterns for those nearing death, and heroic efforts to keep beneficiaries alive.
Share Analysis
The shares of total cost by age group and decedent status were analyzed over time in aggregate and separately for HI and SMI (Table 11). The share of decedent expenditures for HI services increased over the period from 31.6 percent to 35.2 percent, indicating an increase in decedents’ utilization of HI services relative to that of survivors.
In contrast, the decedent share of SMI services remained roughly the same over the study period, fluctuating from 17.8 percent in 1994 to 17.6 percent in 1999. For each HI type of service (inpatient hospital, home health, hospice, and skilled nursing facility care), the decedent share of total costs increased (Tables 12). Within SMI service types for decedents, the physician share and outpatient hospital share increased, and the durable medical equipment share decreased.
The key finding is that the increase in decedent expenditures, relative to those for survivors, is attributable primarily to the increase in HI spending by decedents. This was especially the case for inpatient and skilled nursing care services, as decedents use more intensive services.
Types of Service
Table 13a illustrates the distribution of expenditures within each of the decedent/survivor cohorts for each year. The shares of total decedent expenditures attributable to inpatient, skilled nursing facility, physician, and hospice care, although somewhat volatile over the study period, were higher at the end of the period than in the beginning. On the other hand, the share of expenditures attributable to home health, outpatient hospital, and durable medical equipment decreased. Previous trends, from 1976 though 1995, show a decline in the proportion of Medicare expenditures in the last year of life for inpatient hospital care and an increase in the share of home health care and hospice (Garber et al., 1998).
In the case of the survivor cohort, the share of total expenditures attributable to inpatient, skilled nursing, physician, outpatient, and durable medical equipment services increased slightly, while the share of home health expenditures significantly decreased. This decrease in the home health share explains the increase in the share attributable to the other services.
Table 13b compares results from this study to those of prior research (Lubitz, 1993). Although changes in practice patterns and programmatic changes to Medicare complicate comparisons with the earlier study, there have been considerable shifts in the distribution of service utilization for both cohorts.
Table 14 differs from Table 13 by showing shares for each type of service and for each cohort relative to aggregate expenditures as opposed to the share relative to the total spending within each of the cohorts. The interesting finding here is that the decedent cohort’s share of expenditures for inpatient and skilled nursing facility care increased, accounting for most of the growth in the total share of expenditures for decedents. Home health is the only type of service
12

within the decedent cohort for which the share of spending decreased over the study period, falling from 2.1 in 1994 to 1.3 in 1999. The total share of expenditures for the survivor cohort fell during the period, from 73.5 percent in 1994 to 71.2 percent in 1999. This decline is explained by a small decrease in the inpatient hospital share and a larger decrease in the home health share.
Tables 12 and 15 illustrate the share distributions for each type of service by age group and for each age group by type of service, respectively. For each type of service, the share of expenditures was calculated for each age group and decedent/survivor cell. Conversely, for each age group, the share of expenditures was calculated for each type of service and decedent/survivor cell.
An examination of Table 12 reveals that for each type of service except for durable medical equipment, the share for decedents increased. The shares within each age group except for those aged 65-69 increased over time. The effect of Medicare managed care enrollment and the subsequent decline in the number of decedents could help explain this phenomenon. In the sample, there are approximately 2,000 (or 2.5 percent) fewer decedents in 1999 than in1994. Inpatient care had the largest share of decedent spending at 34.3 percent, followed by skilled nursing care at 39.9 percent.
Table 15 shows that for each age group, the expenditures for decedents as a share of total expenditures for a given age group are increasing over time. From 1994 through 1999, the increases in the share of inpatient hospital spending within age groups are greater for the older ones. This finding further suggests that more intensive care is used at older age groups.
Conversely, survivor expenditures as a share of total expenditures for each age group are decreasing over time and across age groups. Within each age group, the share of expenditures is increasing by type of service for decedents and decreasing by type of service for survivors. This is true for all types except home health.
IV. Discussion
The purpose of this study is to investigate the characteristics of Medicare expenditures for care provided in the last year of life from 1994 through 1999. Factors that make up last-year-of-life expenditure effects include practice patterns, technological advances, and patient preferences. During the study period, impacts due to legislation and changes in managed care enrollment also had to be considered.
Several factors are changing over time: practice patterns, including more aggressive medical care that uses a higher intensity of services; improvements in and increased utilization of new technological devices; increased longevity due to innovations in technology and the utilization of improved and new prescription drugs; and family/beneficiary choice in receiving or declining aggressive medical care. These factors influence to varying degrees the expenditures for those in their last year of life.
This study has analyzed the current trends in decedent/survivor costs and the changes in this relationship over time. The findings indicate that the relationship of decedent costs to survivor costs has changed to varying degrees for each age group.
13

In summary, the divergent nature of the survivor and decedent spreads and the differences in changes in per capita costs by age group support the hypothesis that the relative magnitudes in expenditures between the youngest and oldest age groups for decedents and survivors are changing over time. In addition, contrary to results found in prior research (Lubitz, 1993), decedent expenditures as a percent of total Medicare expenditures steadily increased each year during the study period. Changing practice patterns and the impact of managed care are contributors to this phenomenon. Other likely contributors include varying Medicare managed care penetration rates by age groups.
The characteristics of last-year-of-life expenditures should be updated periodically to monitor the changes in the D/S ratios and to determine whether the death percentage will continue to increase. Incorporating these factors into the Medicare projection methodology may increase the precision of the estimates.
During this analysis, issues and questions emerged, the resolution of which would add additional clarity to the results and provide an impetus for future research. A major issue impacting the interpretation of the findings was the effect of managed care enrollment changes. The findings could be clarified further by an analysis that quantified the Medicare managed care effect on survivor costs. Areas of future research include an examination of the changes in the intensity of services of decedents and a study of expenditures for those in their last year of life on a durational basis by month prior to death.
The authors would like to thank Cathy Curtis for her helpful comments.
14
15
References
Barnato, A. E. et al., 2001. Trends in the Use of Intensive Procedures at the End of Life. NBER/Frontiers in Health Policy Research, 4: 95-114.
Centers for Medicare & Medicaid Services. 2003. <http://cms.hhs.gov/statistics/nhe1/. Available as of January 20, 2003.>
Centers for Disease Control. 2001. National Vital Statistics Report, 48 (18). <http://www.cdc.gov/nchs/fastats/lifexpec.htm. Available as of April 1, 2002.>
Cox, D. F. and Hogan, C. 1997. Biased Selection and Medicare HMOs: Analysis of the 1989-1994 Experience. Medical Care Research and Review, 54(3) 259-274.
Garber, A. M. et al. 1998. Medical Care at the End of Life: Diseases, Treatment Patterns, and Costs. National Bureau of Economic Research, working paper 6748.
Hellinger, F. J. 1987. Selection Bias in Health Maintenance Organizations: Analysis of Recent Evidence. Health Care Financing Review, 9(2): 55-63.
Hellinger, F. J. and Wong, H. S. 2000. Selection Bias in HMOs: A Review of the Evidence. Medical Care Research and Review, 57(4): 405-439.
Hogan et al. 2002. Medicare Beneficiaries’ Cost of Care in the Last Year of Life. Health Affairs, 20(4): 189-195.
Levinsky, N. G. et al. 2001. Influence of Age on Medicare Expenditures and Medical Care in the Last Year of Life. Journal of the American Medical Association, 286(11): 1349-1355.
Lubitz, J. D. and Riley, G. F. 1993. Trends in Medicare Payments in the Last Year of Life. New England Journal of Medicine, 328 (15): 1092-1096.
Riley, G. et al. 1996. Health Status of Medicare Enrollees in HMOs and Fee-for-Services in 1994. Health Care Financing Review, 17(4): 65-76.
Stearns, S. C. and Norton, E. C. 2002. Time to Include Time to Death? The Future of Health Care Expenditure Predictions. Triangle Health Economics Working Paper Series, working paper 4.
Thiede Call, K., et al. 1999. Selection Experiences in Medicare HMOs: Pre-Enrollment Expenditures. Health Care Financing Review, 20(4): 197-209.
The Medicare Boards of Trustees. 2002. The 2002 Annual Report of the Boards of Trustees of the Federal Hospital Insurance and Federal Supplementary Medical Insurance Trust Funds. Washington: Government Printing Office.
Technical Review Panel on the Medicare Trustees Reports. 2002. Review of Assumptions and Methods of the Medicare Trustees’ Financial Projections.
Thomas, C. 1999. Health Status, Technological Innovation, and Health Expenditures. Background paper prepared for the Council on the Economic Impact of Health System Change
Wong, H.S. and Hellinger, F. J. 2001. Conducting Research on the Medicare Market: The Need for Better Data and Methods. Health Services Research, 36(1): 291-308.

Appendix I. Discussion of Decedent to Survivor Expenditure Ratios
Decedent to Survivor Expenditure Ratios under Three Assumptions
0
2
4
6
8
10
12
14
65-69 70-74 75-79 80-84 85-89 90+
Age Groups
C1
C2
C3
Given the previous analysis of historical trends in decedent to survivor per capita expenditure ratios, the figure above highlights three possible scenarios regarding future annual aggregate Medicare expenditures. It is assumed in the analysis that the projected Medicare population will follow the total projected population estimated by the Social Security Administration, Office of the Actuary (see Table 1), and that all other factors such as technology, practice patterns, and inflation, are held constant, influencing decedent and survivor costs in the same way.
C1 depicts the 1999 decedent/survivor ratios found in our study. As people live longer and the Medicare population increases, annual aggregate Medicare expenditures will increase. To the extent that these ratios continue to remain constant over time, the impact of expected increases in longevity on the Medicare expenditures could actually be mitigated in the long run, as a smaller share of Medicare beneficiaries would experience the higher decedent costs of the younger age groups.
However, one may expect that as life expectancies increase, physicians and patients will become more willing to perform “heroic” measures at older ages. Such a scenario could result in increased annual aggregate Medicare expenditures as older age groups experience the increased utilization and intensity of services currently attempted only at younger ages. The shift from C1 to C2 depicts the behavior of the decedent/survivor ratio in this case.
16

Moreover, if the younger elderly were to become healthier (that is, have less chronic intensive care in the last year of life), and consequently require less medical care utilization, the marginal change in Medicare expenditures would decrease over time. The movement of line C1 to line C3 depicts this third scenario.
The following table summarizes the effects that the three scenarios could have on medical expenditures.
Summary of Impacts that Decedent/Survivor Ratios Could Have on Medicare Expenditures
Scenario 2011-2030 2031-2050
Trends in Share of Elderly Population Young-elderly Share of Population is Increasing
Young-elderly Share of Population is Decreasing
Trends in Decedent/Survivor Ratio Constant Constant C1
Impact on Aggregate Medicare Spending Increasing Spending Decreasing Spending
Trends in Share of Elderly Population Young-elderly Share of Population is Increasing
Young-elderly Share of Population is Decreasing
Trends in Decedent Ratio Increasing with Increasing Age Increasing with Increasing Age C2
Impact on Aggregate Medicare Spending Marginal Increase in Spending from C1 Marginal Increase in Spending from C1
Trends in Share of Elderly Population Young-elderly Share of Population is Increasing
Young-elderly Share of Population is Decreasing
Trends in Decedent Ratio Increasing at Older Age Groups and Decreasing at Younger Age Groups
Increasing at Older Age Groups and Decreasing at Younger Age Groups
C3
Impact on Aggregate Medicare Spending Marginal Decrease in Spending from C1 Marginal Decrease in Spending from C1
17

Appendix III. Discussion of BBA Impacts on LYOL Expenditures
Beginning in 1998, per capita trends for inpatient, home health, and nursing home services changed drastically from what they had been in the prior 3-year period. This change was due primarily to the Balanced Budget Act of 1997 and efforts to combat fraud and abuse. Conversely, per capita trends for SMI services in 1998 and 1999 were similar to those in prior years, resulting in small or negative trends for HI services and positive trends for SMI services. These trends, accompanied by the fact that decedents use a relatively greater share of HI services than do survivors, indicates that BBA caused downward pressure on both the death percentage and the decedent/survivor ratios (D/S). Consequently, had BBA not been passed, the death percentage and D/S ratios would have been even higher for 1998 and 1999.
Simulations were performed to quantify the magnitude of BBA’s impact on expenditures. Inpatient, home health, and skilled nursing facility services for 1998 and 1999 were increased at rates similar to those prior to 1998. The result was that the death percentage increased, after adjusting for age/gender, from 27.9 percent to 28.2 percent. On a service-specific basis, inpatient and skilled nursing facility services contributed positively to the death percentage, while home health contributed negatively - survivors use a greater share of home health services than decedents.
18

Appendix IV. Formula Definitions
• The per capita decedent/survivor ratios:
i
iSD
Where: “D” represents the per capita expenditures for the decedent cohort. “S” represents the per capita expenditures for the survivor cohort. “i” represents the age group.
• Relative cost factors:
T
Dij and TSij
Where: “D” represents the per capita expenditures for the decedent cohort. “S” represents the per capita expenditures for the survivor cohort. “T” represents the per capita expenditures for the entire sample. “i” represents the age group. “j” represents the gender cohort.
• Decedent and survivor age group costs relative to the total:
T
Di and TSi
Where: “D” represents the per capita expenditures for the decedent cohort. “S” represents the per capita expenditures for the survivor cohort. “T” represents the per capita expenditures for the entire sample. “i” represents the age group.
• Relative per capita age group ratios within decedent and survivor cohorts:
t
iDD
and t
iSS
Where: “D” represents the per capita expenditures for the decedent cohort. “S” represents the per capita expenditures for the survivor cohort. “i” represents the age group. “t” represents the per capita expenditures for the entire decedent status cohort.
19

Tables
Table 1. Population Counts and Percentages for Elderly Populations 1980 1990 2000 2010 2020 2030 Population Counts (in millions) Total Population 235.2 260.2 285.8 310.2 333.7 353.6 65-84 23.7 28.7 30.9 34.2 47.4 62.0 85+ 2.4 3.3 4.6 5.3 5.7 7.4
65-69 8.8 10.2 9.6 12.3 18.0 20.2 70-74 6.9 8.2 8.9 9.2 14.1 18.2 75-79 4.9 6.2 7.4 7.2 9.4 14.0 80-84 3.1 4.1 5.0 5.6 6.0 9.5 85-89 1.7 2.2 3.0 3.4 3.5 4.8 90+ 0.7 1.1 1.6 1.9 2.2 2.6 Share of the Total Population 65-84 10.1% 11.0% 10.8% 11.0% 14.2% 17.5%85+ 1.0 1.3 1.6 1.7 1.7 2.1
65-69 3.7 3.9 3.4 4.0 5.4 5.7 70-74 2.9 3.2 3.1 3.0 4.2 5.2 75-79 2.1 2.4 2.6 2.3 2.8 3.9 80-84 1.3 1.6 1.7 1.8 1.8 2.7 85-89 0.7 0.8 1.0 1.1 1.0 1.4 90+ 0.3 0.4 0.6 0.6 0.7 0.7 Share of the Elderly Population 65-84 90.7% 89.6% 87.1% 86.7% 89.3% 89.3%85+ 9.3 10.4 12.9 13.3 10.7 10.7
65-69 33.7 31.9 27.0 31.2 33.8 29.2 70-74 26.4 25.7 25.1 23.2 26.6 26.3 75-79 18.7 19.4 20.9 18.1 17.7 20.1 80-84 11.9 12.6 14.1 14.1 11.2 13.7 85-89 6.4 6.8 8.4 8.6 6.5 7.0 90+ 2.9 3.6 4.5 4.7 4.2 3.8 Decennial Growth 65-84 21.0% 7.7% 10.6% 38.7% 30.6%85+ 37.2 38.1 14.8 8.3 30.5
65-69 15.8 -6.0 28.3 45.9 12.7 70-74 19.2 8.3 2.8 54.1 29.1 75-79 27.2 19.2 -3.5 31.3 48.6 80-84 30.0 23.4 11.7 6.9 59.5 85-89 29.8 37.9 13.9 1.6 39.2 90+ 53.8 38.7 16.5 20.6 16.9
Source: Social Security Administration, Office of the Actuary
20

Table 2. Population Counts for Cohorts in the Study Sample 1994 1995 1996 1997 1998 1999 Decedents 65-69 8,852 8,476 8,070 7,714 7,366 7,006 70-74 12,410 12,448 11,856 11,307 11,005 10,547 75-79 14,133 14,247 14,270 14,084 13,878 13,867 80-84 15,510 15,464 15,428 15,342 15,069 14,970 85-89 13,310 13,604 13,854 13,907 13,883 14,389 90+ 12,576 13,012 13,264 13,351 13,829 14,121 Total 76,790 77,250 76,743 75,705 75,030 74,899
Survivors 65-69 387,872 375,449 359,086 338,066 321,328 314,433 70-74 384,113 376,061 361,850 349,010 336,774 325,996 75-79 278,851 279,818 281,277 277,703 273,922 276,476 80-84 188,884 189,372 187,695 183,776 182,786 180,794 85-89 100,056 101,033 100,568 99,784 99,699 100,720 90+ 54,623 55,396 55,607 55,582 55,764 55,859 Total 1,394,400 1,377,130 1,346,083 1,303,920 1,270,272 1,254,278
Table 3. Expenditure Levels and Growth Rates for Decedent and Survivor Cohorts 1994 1995 1996 1997 1998 1999Aggregate Expenditures (in millions) All Benficiaries 5,842 6,372 6,669 6,843 6,548 6,464Decedents 1,546 1,701 1,807 1,887 1,868 1,862Survivors 4,296 4,671 4,863 4,956 4,679 4,602Per Capita Expenditures All Beneficiaries 3,971 4,381 4,687 4,960 4,867 4,863Decedents 20,134 22,017 23,543 24,921 24,902 24,856Survivors 3,081 3,392 3,612 3,801 3,684 3,669Annual Growth All Beneficiaries 10.3% 7.0% 5.8% -1.9% -0.1%Decedents 9.4% 6.9% 5.9% -0.1% -0.2%Survivors 10.1% 6.5% 5.2% -3.1% -0.4%
21

22 22
Table 4. Per Capita Costs by Decedent Status and Age Group for Select Years
Age Groups 1976*
Decedents 1976*
Survivors 1988*
Decedents1988*
Survivors1994
Decedents1994
Survivors1999
Decedents1999
Survivors
Growth 1994-1999 Decedents
Growth 1994-1999 Survivors
<65 NA NA NA NA 27,325 3,666 33,457 4,087 0 0
65-69 4,271 401 15,436 1,455 24,633 2,240 31,702 2,630 29 17 70-74 4,046 472 15,778 1,845 23,926 2,812 31,344 3,390 31 21 75-79 3,670 560 14,902 2,176 22,930 3,450 28,834 4,075 26 18 80-84 3,238 608 12,838 2,403 19,977 3,936 25,066 4,564 25 16 85-89 NA NA 11,422 2,578 17,223 4,282 21,327 4,825 24 13 90+ NA NA NA NA 13,358 3,897 16,079 4,155 20 7
>65 3,488 492 13,316 1,924 20,134 3,081 24,856 3,669 23 19 >85 2,566 631 10,208 2,465 15,345 4,146 18,727 4,586 22 11
All Beneficiaries 20,590 3,151 25,463 3,732 24 18
* Source: Lubitz, J. D. and Riley, G. F. 1993. Trends in Medicare Payments in the Last Year of Life. New England Journal of Medicine, 328 (15): 1092-1096.
Table 5. Decedent/Survivor Expenditure Ratios, Select Years Age Group 1976* 1988* 1994 1999<65 NA NA 7.5 8.265-69 10.7 10.6 11.0 12.170-74 8.6 8.6 8.5 9.275-79 6.6 6.8 6.6 7.180-84 5.3 5.3 5.1 5.585-89 NA 4.4 4.0 4.490+ NA NA 3.4 3.9
>65 7.1 6.9 6.5 6.8>85 4.1 4.1 3.7 4.1
All Beneficiaries 6.5 6.8
* Source: Lubitz, J. D. and Riley, G. F. 1993. Trends in Medicare Payments in the Last Year of Life. New England Journal of Medicine, 328 (15): 1092-1096.
Table 6. Annual Growth in Medicare Managed Care Enrollment for Part A Age Group 1995 1996 1997 1998 1999 65-69 19.5% 27.0% 24.8% 17.4% 5.8% 70-74 21.3 23.4 22.2 17.4 6.5 75-79 22.7 25.8 24.5 18.8 9.2 80-84 26.3 23.8 22.2 19.2 8.3 85+ 30.9 25.1 23.9 21.4 11.5
Source: Office of the Actuary, Centers for Medicare & Medicad Serivces

Table 7a. Relative Cost Factors for all Beneficiaries by Age Group, Gender, and Decedent Status Cohorts: 1994-1999
Age Group Gender
Decedent Status 1994 1995 1996 1997 1998 1999
65-69 Male Survivors 0.58 0.57 0.56 0.54 0.54 0.5570-74 Male Survivors 0.74 0.73 0.71 0.71 0.72 0.7275-79 Male Survivors 0.90 0.87 0.87 0.87 0.85 0.8880-84 Male Survivors 1.01 1.01 0.99 0.99 0.98 0.9885-89 Male Survivors 1.06 1.06 1.08 1.05 1.03 1.0290+ Male Survivors 0.86 0.88 0.91 0.94 0.83 0.8265-69 Female Survivors 0.55 0.54 0.53 0.52 0.53 0.5470-74 Female Survivors 0.68 0.68 0.68 0.67 0.67 0.6875-79 Female Survivors 0.85 0.85 0.83 0.82 0.82 0.8180-84 Female Survivors 0.98 0.99 0.99 0.97 0.93 0.9285-89 Female Survivors 1.09 1.11 1.11 1.10 1.03 0.9890+ Female Survivors 1.02 1.06 1.04 1.09 0.97 0.8765-69 Male Decedents 5.54 5.57 5.52 5.65 5.88 5.9970-74 Male Decedents 5.65 5.51 5.79 5.79 5.87 6.0175-79 Male Decedents 5.49 5.42 5.54 5.55 5.68 5.7580-84 Male Decedents 5.14 5.09 5.14 5.12 5.21 5.2785-89 Male Decedents 4.63 4.62 4.56 4.63 4.69 4.6390+ Male Decedents 3.84 3.79 3.73 3.71 3.77 3.7865-69 Female Decedents 7.18 6.84 7.16 7.15 7.24 7.2370-74 Female Decedents 6.51 6.55 6.51 6.58 6.73 6.9875-79 Female Decedents 6.08 5.88 5.94 5.97 6.22 6.1280-84 Female Decedents 4.94 5.01 4.94 5.03 5.16 5.0685-89 Female Decedents 4.16 4.28 4.16 4.18 4.24 4.2490+ Female Decedents 3.19 3.23 3.17 3.08 3.16 3.14
Table 7b. Relative Cost Factors for all Beneficiaries by Age Group, Gender, and Decedent Status Cohorts: 1994-1999 (Adjusted for Population Changes)
Age Group Gender
Decedent Status 1994 1995 1996 1997 1998 1999
65-69 Male Survivors 0.58 0.57 0.57 0.55 0.55 0.5670-74 Male Survivors 0.74 0.73 0.72 0.72 0.74 0.7475-79 Male Survivors 0.90 0.88 0.88 0.88 0.87 0.9080-84 Male Survivors 1.01 1.01 1.00 1.01 1.00 1.0085-89 Male Survivors 1.06 1.06 1.09 1.07 1.06 1.0490+ Male Survivors 0.86 0.88 0.92 0.95 0.85 0.8465-69 Female Survivors 0.55 0.54 0.54 0.53 0.54 0.5570-74 Female Survivors 0.68 0.68 0.69 0.68 0.68 0.7075-79 Female Survivors 0.85 0.85 0.84 0.84 0.84 0.8380-84 Female Survivors 0.98 1.00 1.00 0.98 0.95 0.9485-89 Female Survivors 1.09 1.11 1.12 1.12 1.05 1.0190+ Female Survivors 1.02 1.06 1.05 1.10 0.99 0.8965-69 Male Decedents 5.54 5.61 5.58 5.75 6.02 6.1470-74 Male Decedents 5.65 5.54 5.85 5.89 6.00 6.1675-79 Male Decedents 5.49 5.45 5.60 5.65 5.81 5.9080-84 Male Decedents 5.14 5.12 5.20 5.21 5.33 5.4085-89 Male Decedents 4.63 4.65 4.61 4.71 4.80 4.7590+ Male Decedents 3.84 3.81 3.77 3.78 3.86 3.8765-69 Female Decedents 7.18 6.88 7.24 7.28 7.41 7.4170-74 Female Decedents 6.51 6.59 6.59 6.70 6.88 7.1675-79 Female Decedents 6.08 5.91 6.01 6.07 6.36 6.2780-84 Female Decedents 4.94 5.04 5.00 5.12 5.28 5.1985-89 Female Decedents 4.16 4.30 4.21 4.26 4.34 4.3490+ Female Decedents 3.19 3.25 3.20 3.14 3.23 3.22
23

Table 7c. Relative Cost Factors for all Beneficiaries by Age Group, Gender, and Decedent Status Cohorts: 1994-1999 (Hospital Insurance) Age Group Gender
Decedent Status 1994 1995 1996 1997 1998 1999
65-69 Male Survivors 0.52 0.51 0.50 0.48 0.48 0.4870-74 Male Survivors 0.67 0.65 0.63 0.63 0.64 0.6375-79 Male Survivors 0.82 0.79 0.80 0.78 0.76 0.7980-84 Male Survivors 0.96 0.95 0.93 0.93 0.90 0.9085-89 Male Survivors 1.06 1.04 1.08 1.04 1.00 0.9790+ Male Survivors 0.91 0.93 0.98 1.01 0.86 0.8465-69 Female Survivors 0.46 0.45 0.44 0.43 0.43 0.4370-74 Female Survivors 0.60 0.59 0.59 0.58 0.57 0.5775-79 Female Survivors 0.79 0.79 0.77 0.76 0.75 0.7280-84 Female Survivors 0.98 0.99 1.00 0.96 0.91 0.8985-89 Female Survivors 1.14 1.17 1.18 1.17 1.08 1.0390+ Female Survivors 1.12 1.17 1.15 1.22 1.08 0.9665-69 Male Decedents 6.46 6.44 6.27 6.44 6.84 7.0570-74 Male Decedents 6.58 6.39 6.67 6.63 6.87 7.0975-79 Male Decedents 6.48 6.34 6.47 6.49 6.73 6.9280-84 Male Decedents 6.19 6.07 6.13 6.07 6.28 6.4485-89 Male Decedents 5.66 5.64 5.51 5.55 5.76 5.7990+ Male Decedents 4.72 4.67 4.58 4.52 4.71 4.8365-69 Female Decedents 8.37 7.91 8.20 8.22 8.42 8.4170-74 Female Decedents 7.64 7.70 7.56 7.59 7.89 8.2975-79 Female Decedents 7.29 7.00 6.99 7.02 7.47 7.4880-84 Female Decedents 5.96 6.08 5.92 6.02 6.32 6.3185-89 Female Decedents 5.05 5.21 5.04 5.06 5.26 5.3890+ Female Decedents 3.89 3.92 3.82 3.72 3.93 4.04
Table 7d. Relative Cost Factors for all Beneficiaries by Age Group, Gender, and Decedent Status Cohorts: 1994-1999 (Adjusted for Population Changes) (Hospital Insurance)
Age Group Gender
Decedent Status 1994 1995 1996 1997 1998 1999
65-69 Male Survivors 0.52 0.51 0.51 0.49 0.50 0.5070-74 Male Survivors 0.67 0.65 0.64 0.65 0.65 0.6575-79 Male Survivors 0.82 0.79 0.81 0.80 0.79 0.8280-84 Male Survivors 0.96 0.96 0.94 0.95 0.93 0.9385-89 Male Survivors 1.06 1.05 1.09 1.07 1.03 1.0190+ Male Survivors 0.91 0.94 0.99 1.03 0.88 0.8765-69 Female Survivors 0.46 0.46 0.45 0.44 0.44 0.4570-74 Female Survivors 0.60 0.59 0.60 0.59 0.58 0.5875-79 Female Survivors 0.79 0.79 0.78 0.78 0.78 0.7580-84 Female Survivors 0.98 1.00 1.01 0.98 0.94 0.9285-89 Female Survivors 1.14 1.18 1.19 1.20 1.11 1.0690+ Female Survivors 1.12 1.17 1.17 1.25 1.11 0.9965-69 Male Decedents 6.46 6.48 6.36 6.58 7.04 7.2870-74 Male Decedents 6.58 6.44 6.76 6.77 7.07 7.3375-79 Male Decedents 6.48 6.39 6.56 6.63 6.93 7.1480-84 Male Decedents 6.19 6.12 6.21 6.20 6.47 6.6585-89 Male Decedents 5.66 5.68 5.58 5.67 5.93 5.9890+ Male Decedents 4.72 4.70 4.64 4.62 4.85 4.9965-69 Female Decedents 8.37 7.97 8.31 8.40 8.67 8.6870-74 Female Decedents 7.64 7.76 7.66 7.76 8.12 8.5675-79 Female Decedents 7.29 7.05 7.08 7.17 7.69 7.7280-84 Female Decedents 5.96 6.13 6.01 6.16 6.51 6.5285-89 Female Decedents 5.05 5.25 5.11 5.17 5.41 5.5690+ Female Decedents 3.89 3.95 3.87 3.80 4.04 4.17
24
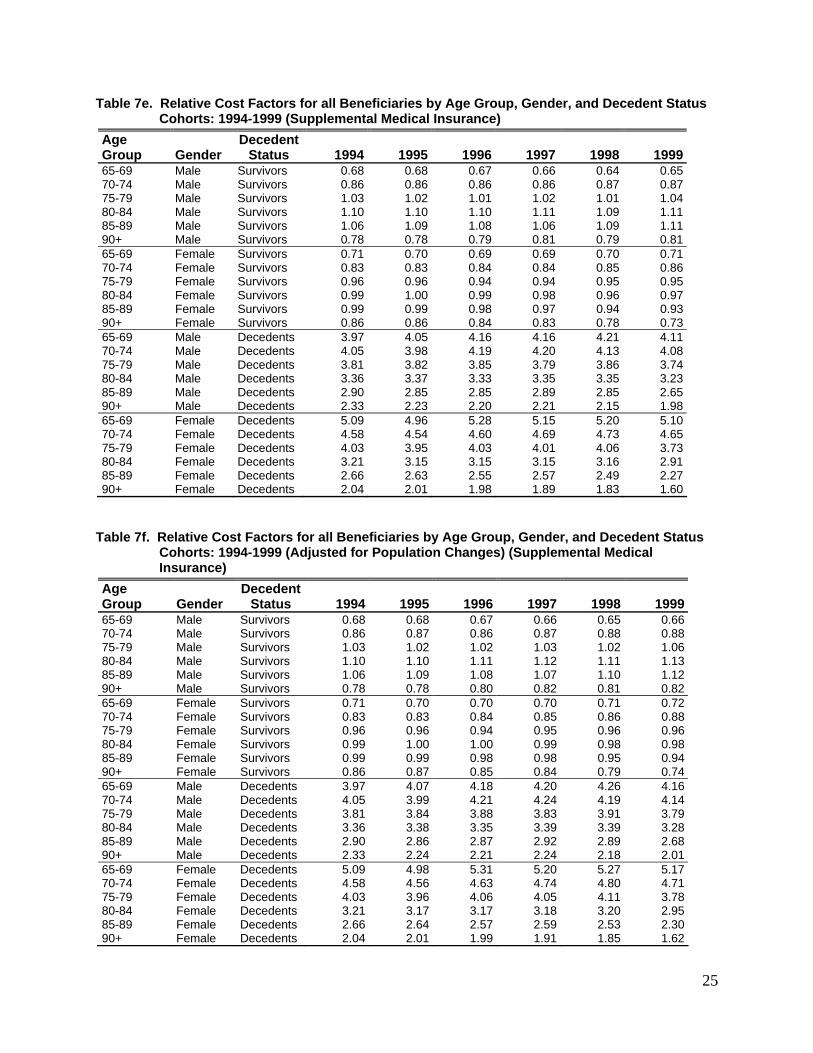
Table 7e. Relative Cost Factors for all Beneficiaries by Age Group, Gender, and Decedent Status Cohorts: 1994-1999 (Supplemental Medical Insurance)
Age Group Gender
Decedent Status 1994 1995 1996 1997 1998 1999
65-69 Male Survivors 0.68 0.68 0.67 0.66 0.64 0.6570-74 Male Survivors 0.86 0.86 0.86 0.86 0.87 0.8775-79 Male Survivors 1.03 1.02 1.01 1.02 1.01 1.0480-84 Male Survivors 1.10 1.10 1.10 1.11 1.09 1.1185-89 Male Survivors 1.06 1.09 1.08 1.06 1.09 1.1190+ Male Survivors 0.78 0.78 0.79 0.81 0.79 0.8165-69 Female Survivors 0.71 0.70 0.69 0.69 0.70 0.7170-74 Female Survivors 0.83 0.83 0.84 0.84 0.85 0.8675-79 Female Survivors 0.96 0.96 0.94 0.94 0.95 0.9580-84 Female Survivors 0.99 1.00 0.99 0.98 0.96 0.9785-89 Female Survivors 0.99 0.99 0.98 0.97 0.94 0.9390+ Female Survivors 0.86 0.86 0.84 0.83 0.78 0.7365-69 Male Decedents 3.97 4.05 4.16 4.16 4.21 4.1170-74 Male Decedents 4.05 3.98 4.19 4.20 4.13 4.0875-79 Male Decedents 3.81 3.82 3.85 3.79 3.86 3.7480-84 Male Decedents 3.36 3.37 3.33 3.35 3.35 3.2385-89 Male Decedents 2.90 2.85 2.85 2.89 2.85 2.6590+ Male Decedents 2.33 2.23 2.20 2.21 2.15 1.9865-69 Female Decedents 5.09 4.96 5.28 5.15 5.20 5.1070-74 Female Decedents 4.58 4.54 4.60 4.69 4.73 4.6575-79 Female Decedents 4.03 3.95 4.03 4.01 4.06 3.7380-84 Female Decedents 3.21 3.15 3.15 3.15 3.16 2.9185-89 Female Decedents 2.66 2.63 2.55 2.57 2.49 2.2790+ Female Decedents 2.04 2.01 1.98 1.89 1.83 1.60
Table 7f. Relative Cost Factors for all Beneficiaries by Age Group, Gender, and Decedent Status Cohorts: 1994-1999 (Adjusted for Population Changes) (Supplemental Medical Insurance)
Age Group Gender
Decedent Status 1994 1995 1996 1997 1998 1999
65-69 Male Survivors 0.68 0.68 0.67 0.66 0.65 0.6670-74 Male Survivors 0.86 0.87 0.86 0.87 0.88 0.8875-79 Male Survivors 1.03 1.02 1.02 1.03 1.02 1.0680-84 Male Survivors 1.10 1.10 1.11 1.12 1.11 1.1385-89 Male Survivors 1.06 1.09 1.08 1.07 1.10 1.1290+ Male Survivors 0.78 0.78 0.80 0.82 0.81 0.8265-69 Female Survivors 0.71 0.70 0.70 0.70 0.71 0.7270-74 Female Survivors 0.83 0.83 0.84 0.85 0.86 0.8875-79 Female Survivors 0.96 0.96 0.94 0.95 0.96 0.9680-84 Female Survivors 0.99 1.00 1.00 0.99 0.98 0.9885-89 Female Survivors 0.99 0.99 0.98 0.98 0.95 0.9490+ Female Survivors 0.86 0.87 0.85 0.84 0.79 0.7465-69 Male Decedents 3.97 4.07 4.18 4.20 4.26 4.1670-74 Male Decedents 4.05 3.99 4.21 4.24 4.19 4.1475-79 Male Decedents 3.81 3.84 3.88 3.83 3.91 3.7980-84 Male Decedents 3.36 3.38 3.35 3.39 3.39 3.2885-89 Male Decedents 2.90 2.86 2.87 2.92 2.89 2.6890+ Male Decedents 2.33 2.24 2.21 2.24 2.18 2.0165-69 Female Decedents 5.09 4.98 5.31 5.20 5.27 5.1770-74 Female Decedents 4.58 4.56 4.63 4.74 4.80 4.7175-79 Female Decedents 4.03 3.96 4.06 4.05 4.11 3.7880-84 Female Decedents 3.21 3.17 3.17 3.18 3.20 2.9585-89 Female Decedents 2.66 2.64 2.57 2.59 2.53 2.3090+ Female Decedents 2.04 2.01 1.99 1.91 1.85 1.62
25

Table 8. Relative Per Capita Age Group Ratios Within Decedent and Survivor Cohorts Unadjusted for Population Adjusted for Population Age
Group Ratio 1994 1995 1996 1997 1998 1999 1994 1995 1996 1997 1998 199965-69 Dt/D 1.22 1.21 1.23 1.25 1.26 1.28 1.22 1.21 1.22 1.23 1.24 1.2570-74 Dt/D 1.19 1.19 1.22 1.22 1.22 1.26 1.19 1.18 1.21 1.21 1.20 1.2375-79 Dt/D 1.14 1.12 1.14 1.14 1.16 1.16 1.14 1.12 1.13 1.13 1.14 1.1380-84 Dt/D 0.99 1.00 1.00 1.01 1.01 1.01 0.99 1.00 0.99 1.00 1.00 0.9985-89 Dt/D 0.86 0.88 0.86 0.87 0.86 0.86 0.86 0.87 0.85 0.86 0.85 0.8490+ Dt/D 0.66 0.67 0.66 0.65 0.65 0.65 0.66 0.67 0.65 0.64 0.64 0.6365-69 St/S 0.73 0.72 0.71 0.69 0.71 0.72 0.73 0.72 0.71 0.70 0.72 0.7370-74 St/S 0.91 0.90 0.90 0.90 0.91 0.92 0.91 0.91 0.91 0.91 0.93 0.9475-79 St/S 1.12 1.11 1.10 1.10 1.10 1.11 1.12 1.11 1.11 1.11 1.12 1.1380-84 St/S 1.28 1.29 1.29 1.27 1.25 1.24 1.28 1.29 1.30 1.29 1.27 1.2785-89 St/S 1.39 1.41 1.42 1.42 1.36 1.32 1.39 1.42 1.44 1.44 1.38 1.3490+ St/S 1.27 1.31 1.31 1.37 1.24 1.13 1.27 1.32 1.32 1.39 1.26 1.1565-69 Dt/T 6.20 6.09 6.19 6.27 6.45 6.52 6.20 6.12 6.25 6.36 6.58 6.6670-74 Dt/T 6.03 5.97 6.11 6.15 6.25 6.45 6.03 5.99 6.17 6.24 6.37 6.5975-79 Dt/T 5.77 5.64 5.73 5.75 5.94 5.93 5.77 5.66 5.79 5.83 6.05 6.0680-84 Dt/T 5.03 5.05 5.03 5.07 5.18 5.15 5.03 5.07 5.08 5.15 5.28 5.2785-89 Dt/T 4.34 4.41 4.31 4.35 4.41 4.39 4.34 4.43 4.35 4.41 4.49 4.4890+ Dt/T 3.36 3.38 3.31 3.25 3.32 3.31 3.36 3.39 3.34 3.29 3.38 3.3865-69 St/T 0.56 0.55 0.54 0.53 0.54 0.54 0.56 0.56 0.55 0.54 0.55 0.5570-74 St/T 0.71 0.70 0.69 0.69 0.69 0.70 0.71 0.70 0.70 0.70 0.70 0.7175-79 St/T 0.87 0.86 0.85 0.84 0.84 0.84 0.87 0.86 0.86 0.85 0.85 0.8680-84 St/T 0.99 1.00 0.99 0.97 0.95 0.94 0.99 1.00 1.00 0.99 0.96 0.9685-89 St/T 1.08 1.09 1.10 1.09 1.03 0.99 1.08 1.10 1.11 1.10 1.05 1.0190+ St/T 0.98 1.02 1.01 1.05 0.94 0.85 0.98 1.02 1.02 1.07 0.95 0.87
Table 9. Death Percentages 1994 1995 1996 1997 1998 1999 Death Percentage 26.5% 26.7% 27.1% 27.6% 28.5% 28.8% Death Percentage (Adjusted)* 26.5% 26.5% 26.7% 27.0% 27.8% 27.9% Difference 0.00% 0.23% 0.37% 0.57% 0.77% 0.85%
* Adjusted for Age Group, Gender, and Decedent Status.
Table 10. Mortality Rates in the Sample Age Group 1994 1995 1996 1997 1998 1999 65-69 0.63% 0.62% 0.60% 0.59% 0.58% 0.56% 70-74 0.89 0.90 0.88 0.87 0.87 0.84 75-79 1.01 1.03 1.06 1.08 1.09 1.11 80-84 1.11 1.12 1.15 1.18 1.19 1.19 85-89 0.95 0.99 1.03 1.07 1.09 1.15 90+ 0.90 0.94 0.99 1.02 1.09 1.13 Total 5.51 5.61 5.70 5.81 5.91 5.97
26

Table 11a. Distribution of Costs by Age Group and Decedent Status Cohorts: 1994-1999
Age Group Decedent Status 1994 1995 1996 1997 1998 1999
65-69 Decedents 3.7 3.6 3.5 3.5 3.5 3.470-74 Decedents 5.1 5.1 5.1 5.0 5.1 5.175-79 Decedents 5.5 5.5 5.7 5.9 6.1 6.280-84 Decedents 5.3 5.4 5.5 5.6 5.8 5.885-89 Decedents 3.9 4.1 4.2 4.4 4.5 4.790+ Decedents 2.9 3.0 3.1 3.1 3.4 3.5Total Decedent 26.5 26.7 27.1 27.6 28.5 28.865-69 Survivors 14.9 14.3 13.7 13.0 12.8 12.870-74 Survivors 18.5 18.1 17.6 17.4 17.3 17.175-79 Survivors 16.5 16.5 16.8 16.9 17.0 17.480-84 Survivors 12.7 13.0 13.1 13.0 12.8 12.885-89 Survivors 7.3 7.6 7.8 7.9 7.6 7.590+ Survivors 3.6 3.9 4.0 4.2 3.9 3.6Total Survivors 73.5 73.3 72.9 72.4 71.5 71.265-69 All Beneficiaries 18.6 17.9 17.3 16.5 16.3 16.270-74 All Beneficiaries 23.6 23.2 22.7 22.4 22.4 22.275-79 All Beneficiaries 22.0 22.0 22.5 22.8 23.1 23.680-84 All Beneficiaries 18.0 18.4 18.5 18.6 18.7 18.685-89 All Beneficiaries 11.3 11.7 12.0 12.2 12.2 12.390+ All Beneficiaries 6.5 6.9 7.0 7.4 7.3 7.1Total All Beneficiaries 100.0 100.0 100.0 100.0 100.0 100.0
Table 11b. Hospital Insurance Distribution of Costs by Age Group and Decedent Status Cohorts: 1994-1999
Age Group Decedent Status 1994 1995 1996 1997 1998 1999
65-69 Decedents 4.4 4.1 4.0 4.0 4.1 4.070-74 Decedents 5.9 6.0 5.9 5.8 6.0 6.175-79 Decedents 6.6 6.5 6.7 6.9 7.3 7.580-84 Decedents 6.4 6.5 6.5 6.7 7.1 7.285-89 Decedents 4.8 5.0 5.1 5.3 5.6 6.090+ Decedents 3.5 3.7 3.7 3.8 4.2 4.5Total Decedent 31.6 31.8 32.0 32.5 34.3 35.265-69 Survivors 12.8 12.3 11.8 11.2 10.9 10.870-74 Survivors 16.4 15.9 15.5 15.2 14.9 14.675-79 Survivors 15.2 15.1 15.5 15.5 15.4 15.680-84 Survivors 12.5 12.7 12.8 12.7 12.3 12.285-89 Survivors 7.6 7.9 8.1 8.2 7.8 7.790+ Survivors 4.0 4.2 4.3 4.7 4.3 3.9Total Survivors 68.4 68.2 68.0 67.5 65.7 64.865-69 All Beneficiaries 17.2 16.4 15.8 15.2 15.0 14.870-74 All Beneficiaries 22.3 21.9 21.3 21.0 20.9 20.675-79 All Beneficiaries 21.8 21.7 22.2 22.4 22.8 23.180-84 All Beneficiaries 18.9 19.2 19.4 19.4 19.4 19.485-89 All Beneficiaries 12.4 12.9 13.2 13.5 13.5 13.690+ All Beneficiaries 7.5 7.9 8.1 8.5 8.5 8.4Total All Beneficiaries 100.0 100.0 100.0 100.0 100.0 100.0
27

Table 11c. Supplementary Medical Insurance Distribution of Costs by Age Group and Decedent Status Cohorts: 1994-1999
Age Group Decedent Status 1994 1995 1996 1997 1998 1999
65-69 Decedents 2.7 2.6 2.6 2.6 2.5 2.470-74 Decedents 3.6 3.6 3.6 3.6 3.6 3.475-79 Decedents 3.8 3.8 4.0 4.0 4.1 3.980-84 Decedents 3.5 3.5 3.5 3.6 3.6 3.485-89 Decedents 2.5 2.5 2.6 2.7 2.7 2.690+ Decedents 1.8 1.8 1.9 1.9 2.0 1.8Total Decedent 17.8 17.8 18.2 18.4 18.5 17.665-69 Survivors 18.3 17.7 17.2 16.5 16.1 16.170-74 Survivors 22.1 21.8 21.5 21.5 21.4 21.375-79 Survivors 18.6 18.9 19.1 19.5 19.8 20.580-84 Survivors 13.2 13.5 13.6 13.6 13.7 13.985-89 Survivors 6.9 7.0 7.1 7.2 7.3 7.490+ Survivors 3.1 3.2 3.2 3.3 3.3 3.2Total Survivors 82.2 82.2 81.8 81.6 81.5 82.465-69 All Beneficiaries 21.0 20.3 19.8 19.1 18.6 18.570-74 All Beneficiaries 25.7 25.4 25.2 25.1 25.0 24.775-79 All Beneficiaries 22.4 22.7 23.1 23.5 23.9 24.480-84 All Beneficiaries 16.6 16.9 17.1 17.2 17.3 17.385-89 All Beneficiaries 9.4 9.6 9.7 9.9 10.0 10.090+ All Beneficiaries 4.9 5.1 5.1 5.2 5.2 5.0Total All Beneficiaries 100.0 100.0 100.0 100.0 100.0 100.0
Table 12a. Distribution of Inpatient Hospital Spending by Age Group and Decedent Status: 1994-1999
Age Group Decedent
Status 1994 1995 1996 1997 1998 199965-69 Decedents 4.8 4.6 4.6 4.7 4.6 4.470-74 Decedents 6.4 6.5 6.5 6.5 6.4 6.475-79 Decedents 6.8 6.8 7.0 7.3 7.5 7.680-84 Decedents 6.2 6.3 6.3 6.7 6.8 6.985-89 Decedents 4.4 4.6 4.6 4.9 5.0 5.490+ Decedents 3.0 3.1 3.1 3.2 3.5 3.7Total Decedents 31.6 31.9 32.1 33.3 33.6 34.365-69 Survivors 14.7 14.4 13.9 13.1 12.6 12.270-74 Survivors 17.9 17.6 17.2 16.9 16.7 16.075-79 Survivors 15.5 15.5 15.9 15.9 16.0 16.380-84 Survivors 11.3 11.6 11.7 11.4 11.6 11.785-89 Survivors 6.1 6.2 6.3 6.3 6.5 6.690+ Survivors 2.9 2.9 2.9 3.0 3.0 2.9Total Survivors 68.4 68.1 67.9 66.7 66.4 65.765-69 All Beneficiaries 19.5 19.0 18.4 17.8 17.1 16.670-74 All Beneficiaries 24.3 24.1 23.7 23.4 23.0 22.375-79 All Beneficiaries 22.3 22.3 22.9 23.3 23.5 23.980-84 All Beneficiaries 17.5 17.9 18.0 18.1 18.3 18.685-89 All Beneficiaries 10.5 10.8 10.9 11.2 11.6 11.990+ All Beneficiaries 5.9 6.0 6.0 6.2 6.5 6.7Total All Beneficiaries 100.0 100.0 100.0 100.0 100.0 100.0
28

Table 12b. Distribution of Outpatient Hospital Spending by Age Group and Decedent Status: 1994-1999
Age Group Decedent
Status 1994 1995 1996 1997 1998 199965-69 Decedents 2.8 2.8 2.8 2.6 2.7 2.970-74 Decedents 3.6 3.6 3.6 3.5 3.6 3.875-79 Decedents 3.4 3.5 3.6 3.6 3.8 3.780-84 Decedents 3.1 3.0 3.1 3.2 3.2 3.185-89 Decedents 2.1 2.2 2.2 2.4 2.3 2.190+ Decedents 1.5 1.6 1.7 1.7 1.7 1.4Total Decedents 16.5 16.8 17.1 17.1 17.4 17.065-69 Survivors 20.8 19.5 19.0 18.2 17.9 18.570-74 Survivors 22.6 22.4 22.2 22.1 22.2 22.675-79 Survivors 18.4 18.5 18.7 19.4 19.5 20.280-84 Survivors 12.4 12.9 13.0 12.9 13.0 12.785-89 Survivors 6.4 6.8 6.7 6.9 6.8 6.490+ Survivors 2.9 3.3 3.3 3.4 3.2 2.6Total Survivors 83.5 83.2 82.9 82.9 82.6 83.065-69 All Beneficiaries 23.6 22.3 21.8 20.9 20.7 21.470-74 All Beneficiaries 26.3 26.0 25.9 25.6 25.8 26.375-79 All Beneficiaries 21.8 22.0 22.3 23.0 23.2 24.080-84 All Beneficiaries 15.5 15.9 16.1 16.2 16.2 15.985-89 All Beneficiaries 8.5 8.9 9.0 9.3 9.2 8.590+ All Beneficiaries 4.4 4.9 5.0 5.1 5.0 3.9Total All Beneficiaries 100.0 100.0 100.0 100.0 100.0 100.0
Table 12c. Distribution of Physician Spending by Age Group and Decedent Status: 1994-1999
Age Group Decedent
Status 1994 1995 1996 1997 1998 199965-69 Decedents 2.5 2.5 2.5 2.5 2.5 2.470-74 Decedents 3.5 3.5 3.5 3.6 3.5 3.575-79 Decedents 3.7 3.7 3.9 4.0 4.1 4.180-84 Decedents 3.4 3.4 3.5 3.6 3.7 3.785-89 Decedents 2.4 2.5 2.6 2.7 2.7 2.990+ Decedents 1.7 1.8 1.8 1.8 1.9 2.0Total Decedents 17.3 17.4 17.8 18.3 18.5 18.565-69 Survivors 18.0 17.5 17.0 16.1 15.6 15.470-74 Survivors 22.3 22.0 21.6 21.5 21.3 20.975-79 Survivors 19.0 19.2 19.5 19.8 20.0 20.580-84 Survivors 13.5 13.7 13.8 13.9 14.1 14.185-89 Survivors 6.9 7.1 7.2 7.2 7.4 7.590+ Survivors 3.0 3.1 3.1 3.2 3.1 3.1Total Survivors 82.7 82.6 82.2 81.7 81.5 81.565-69 All Beneficiaries 20.5 20.0 19.5 18.6 18.0 17.870-74 All Beneficiaries 25.8 25.5 25.2 25.1 24.9 24.475-79 All Beneficiaries 22.7 22.9 23.4 23.8 24.1 24.680-84 All Beneficiaries 16.9 17.1 17.3 17.5 17.8 17.885-89 All Beneficiaries 9.4 9.6 9.7 10.0 10.1 10.490+ All Beneficiaries 4.7 4.8 4.9 5.0 5.1 5.1Total All Beneficiaries 100.0 100.0 100.0 100.0 100.0 100.0
29

Table 12d. Distribution of Nursing Facility Spending by Age Group and Decedent Status: 1994-1999
Age Group Decedent
Status 1994 1995 1996 1997 1998 199965-69 Decedents 2.7 2.4 2.4 2.3 2.2 1.970-74 Decedents 4.2 4.6 4.6 4.4 4.5 4.175-79 Decedents 6.7 6.7 6.9 7.2 6.9 6.780-84 Decedents 9.0 8.9 8.9 9.3 9.0 8.985-89 Decedents 8.6 8.9 8.6 9.0 8.9 9.690+ Decedents 7.6 7.6 7.2 7.5 8.0 8.7Total Decedents 38.8 39.2 38.6 39.7 39.6 39.965-69 Survivors 4.6 4.6 4.7 4.6 4.3 4.270-74 Survivors 8.7 8.3 8.5 8.3 7.8 7.975-79 Survivors 12.1 12.0 12.2 12.1 12.4 12.380-84 Survivors 14.9 14.7 14.7 14.1 14.8 14.185-89 Survivors 12.6 12.7 13.1 12.6 12.3 12.990+ Survivors 8.3 8.6 8.3 8.6 8.8 8.6Total Survivors 61.2 60.8 61.4 60.3 60.4 60.165-69 All Beneficiaries 7.3 7.0 7.1 6.9 6.6 6.170-74 All Beneficiaries 12.9 12.9 13.1 12.7 12.4 12.075-79 All Beneficiaries 18.8 18.8 19.1 19.3 19.3 19.080-84 All Beneficiaries 23.9 23.5 23.5 23.4 23.7 23.085-89 All Beneficiaries 21.3 21.6 21.7 21.6 21.3 22.590+ All Beneficiaries 15.9 16.2 15.5 16.2 16.8 17.3Total All Beneficiaries 100.0 100.0 100.0 100.0 100.0 100.0
Table 12e. Distribution of Home Health Spending by Age Group and Decedent Status: 1994-1999
Age Group Decedent
Status 1994 1995 1996 1997 1998 199965-69 Decedents 2.0 1.9 1.8 1.4 1.8 1.970-74 Decedents 3.3 3.2 3.1 2.6 3.5 3.575-79 Decedents 4.4 4.2 4.3 3.5 4.7 4.880-84 Decedents 5.2 4.8 4.9 4.0 5.1 5.485-89 Decedents 4.2 4.2 4.3 3.5 4.6 5.290+ Decedents 3.4 3.5 3.6 3.1 4.2 4.4Total Decedents 22.5 21.9 22.1 18.0 23.8 25.265-69 Survivors 8.1 8.0 7.8 7.8 7.6 7.570-74 Survivors 13.6 13.5 12.9 13.4 12.8 12.775-79 Survivors 16.2 16.4 16.8 17.5 16.9 17.080-84 Survivors 18.5 18.2 17.8 18.5 16.9 16.685-89 Survivors 13.3 13.7 13.8 14.6 13.3 12.890+ Survivors 7.9 8.4 8.7 10.1 8.7 8.2Total Survivors 77.5 78.1 77.9 82.0 76.2 74.865-69 All Beneficiaries 10.1 9.9 9.6 9.3 9.4 9.470-74 All Beneficiaries 16.9 16.7 16.0 16.0 16.2 16.275-79 All Beneficiaries 20.7 20.6 21.2 20.9 21.6 21.980-84 All Beneficiaries 23.6 23.0 22.7 22.5 22.0 22.085-89 All Beneficiaries 17.5 17.9 18.1 18.1 17.9 18.090+ All Beneficiaries 11.3 12.0 12.4 13.2 12.9 12.6Total All Beneficiaries 100.0 100.0 100.0 100.0 100.0 100.0
30

31
Table 12f. Distribution of Hospice Spending by Age Group and Decedent Status: 1994-1999 Age Group
Decedent Status 1994 1995 1996 1997 1998 1999
65-69 Decedents 12.3 10.9 11.1 10.7 10.0 9.270-74 Decedents 15.3 15.5 15.0 15.6 14.8 14.175-79 Decedents 17.6 16.7 17.8 17.4 18.9 17.980-84 Decedents 17.2 16.9 17.3 18.3 18.2 18.285-89 Decedents 12.3 13.4 13.6 14.9 16.0 15.990+ Decedents 10.0 11.5 11.6 12.9 13.7 13.9Total Decedents 84.6 84.9 86.4 89.7 91.6 89.265-69 Survivors 0.9 1.7 1.4 1.1 0.5 0.470-74 Survivors 2.5 1.5 1.7 1.0 1.0 1.375-79 Survivors 2.6 2.6 2.3 1.9 1.3 2.280-84 Survivors 2.7 2.8 2.5 2.3 2.5 2.185-89 Survivors 3.5 3.5 1.9 1.5 1.6 2.390+ Survivors 3.2 3.2 3.7 2.5 1.6 2.5Total Survivors 15.4 15.1 13.6 10.3 8.4 10.865-69 All Beneficiaries 13.2 12.6 12.6 11.7 10.5 9.670-74 All Beneficiaries 17.9 17.0 16.7 16.6 15.8 15.475-79 All Beneficiaries 20.2 19.3 20.1 19.2 20.2 20.180-84 All Beneficiaries 19.8 19.7 19.8 20.6 20.7 20.385-89 All Beneficiaries 15.8 16.9 15.5 16.4 17.6 18.290+ All Beneficiaries 13.2 14.6 15.3 15.4 15.3 16.4Total All Beneficiaries 100.0 100.0 100.0 100.0 100.0 100.0
Table 12g. Distribution of DME Spending by Age Group and Decedent Status: 1994-1999
Age Group Decedent
Status 1994 1995 1996 1997 1998 199965-69 Decedents 3.4 3.2 3.1 3.1 2.8 2.670-74 Decedents 4.7 4.6 4.7 4.6 4.2 4.075-79 Decedents 5.2 5.1 5.3 5.3 5.0 4.880-84 Decedents 5.2 5.1 5.1 5.1 4.7 4.485-89 Decedents 4.2 4.3 4.0 4.0 3.9 3.790+ Decedents 3.5 3.6 3.3 3.3 3.2 3.0Total Decedents 26.3 25.9 25.5 25.3 23.7 22.565-69 Survivors 14.1 14.1 14.1 13.8 14.1 14.270-74 Survivors 18.3 18.1 18.1 18.5 19.0 19.675-79 Survivors 16.4 16.3 17.2 17.3 17.6 18.580-84 Survivors 12.8 13.2 13.0 13.0 13.3 13.085-89 Survivors 7.9 7.9 7.7 7.7 7.9 7.990+ Survivors 4.2 4.5 4.4 4.4 4.4 4.3Total Survivors 73.7 74.1 74.5 74.7 76.3 77.565-69 All Beneficiaries 17.5 17.3 17.1 16.8 16.9 16.870-74 All Beneficiaries 23.0 22.7 22.8 23.2 23.2 23.675-79 All Beneficiaries 21.6 21.4 22.5 22.6 22.6 23.380-84 All Beneficiaries 18.0 18.3 18.2 18.1 18.0 17.485-89 All Beneficiaries 12.1 12.1 11.7 11.7 11.8 11.690+ All Beneficiaries 7.7 8.1 7.7 7.7 7.6 7.3Total All Beneficiaries 100.0 100.0 100.0 100.0 100.0 100.0

Table 13a. Distribution of Medicare Spending by Type of Service and Decedent Status Relative to Decedent Cohort Spending, 1994-1999
1994
Decedent 1994
Survivor1995
Decedent1995
Survivor1996
Decedent1996
Survivor1997
Decedent 1997
Survivor1998
Decedent1998
Survivor1999
Decedent1999
SurvivorPer Capita Expenditures $20,134 $3,081 $22,017 $3,392 $23,543 $3,612 $24,921 $3,801 $24,902 $3,684 $24,856 $3,669
Inpatient 57.9 45.2 56.2 43.7 55.7 43.7 56.4 43.0 56.6 44.6 58.4 45.3SNF 6.3 3.6 7.6 4.3 8.6 5.1 10.0 5.8 10.3 6.3 8.8 5.3Home Health 7.9 9.8 8.4 10.9 8.6 11.3 6.6 11.4 5.5 7.0 4.4 5.3Hospice 3.2 0.2 3.4 0.2 3.4 0.2 3.3 0.1 3.6 0.1 3.9 0.2Outpatient 5.4 9.7 5.4 9.8 5.6 10.1 5.6 10.4 5.6 10.6 5.2 10.3Physician 16.9 29.1 16.4 28.4 15.6 26.9 15.5 26.4 16.2 28.5 17.1 30.5DME 2.4 2.4 2.6 2.7 2.5 2.7 2.5 2.8 2.3 2.9 2.2 3.1
Table 13b. Distribution of Medicare Spending by Type of Service and Decedent Status Relative to Decedent Cohort Spending, 1994-1999
1985*
Decedent 1985*
Survivor 1988*
Decedent 1988*
Survivor 1994
Decedent 1994
Survivor 1999
Decedent 1999
Survivor Per Capita Expenditures $10,617 $1,621 $13,316 $1,924 $20,134 $3,081 $24,856 $3,669
Inpatient 71.9 59.0 70.3 53.3 57.9 45.2 58.4 45.3Physician 19.8 30.4 20.2 34.1 19.3 31.5 19.3 33.6Outpatient 4.0 7.1 4.7 9.2 5.4 9.7 5.2 10.3Other** 4.3 3.4 4.8 3.5 17.5 13.6 17.1 10.8
* Source: Lubitz, J. D. and Riley, G. F. 1993. Trends in Medicare Payments in the Last Year of Life. New England Journal of Medicine, 328 (15): 1092-1096. ** Includes SNF, Home Health, and Hospice
Table 14. Distribution of Medicare Spending by Type of Service and Decedent Status Relative to Total Spending, 1994-1999
1994
Decedent 1994
Survivor1995
Decedent1995
Survivor1996
Decedent1996
Survivor1997
Decedent 1997
Survivor1998
Decedent1998
Survivor1999
Decedent1999
SurvivorPer Capita Expenditures $20,134 $3,081 $22,017 $3,392 $23,543 $3,612 $24,921 $3,801 $24,902 $3,684 $24,856 $3,669
Inpatient 15.3 33.2 15.0 32.0 15.1 31.9 15.6 31.2 16.2 31.9 16.8 32.2SNF 1.7 2.6 2.0 3.1 2.3 3.7 2.8 4.2 2.9 4.5 2.5 3.8Home Health 2.1 7.2 2.2 8.0 2.3 8.2 1.8 8.3 1.6 5.0 1.3 3.8Hospice 0.9 0.2 0.9 0.2 0.9 0.1 0.9 0.1 1.0 0.1 1.1 0.1Outpatient 1.4 7.2 1.4 7.2 1.5 7.4 1.5 7.5 1.6 7.6 1.5 7.3Physician 4.5 21.4 4.4 20.8 4.2 19.6 4.3 19.1 4.6 20.4 4.9 21.7DME 0.6 1.7 0.7 2.0 0.7 2.0 0.7 2.0 0.6 2.1 0.6 2.2Total 26.5 73.5 26.7 73.3 27.1 72.9 27.6 72.4 28.5 71.5 28.8 71.2
32

Table 15a. Distribution of Spending for 65-69 Age Group by Decedent Status: 1994-1999
Services Decedent
Status 1994 1995 1996 1997 1998 1999Inpatient Decedents 12.5 12.2 12.4 13.2 13.5 13.2SNF Decedents 0.6 0.7 0.8 1.0 1.0 0.8Home Health Decedents 1.0 1.1 1.1 0.9 0.7 0.6Hospice Decedents 0.7 0.7 0.7 0.7 0.7 0.7Physician Decedents 3.5 3.5 3.4 3.5 3.8 3.9Outpatient Decedents 1.3 1.3 1.5 1.4 1.5 1.6DME Decedents 0.4 0.5 0.5 0.5 0.5 0.5Total Decedents 20.1 19.9 20.4 21.2 21.7 21.2Inpatient Survivors 38.4 37.9 37.8 37.0 37.0 37.0SNF Survivors 1.1 1.3 1.6 1.9 2.0 1.6Home Health Survivors 4.1 4.6 4.8 4.8 3.0 2.3Hospice Survivors 0.0 0.1 0.1 0.1 0.0 0.0Physician Survivors 25.0 24.7 23.5 22.8 23.9 25.3Outpatient Survivors 9.6 9.4 9.8 10.0 10.1 10.1DME Survivors 1.8 2.1 2.1 2.3 2.3 2.5Total Survivors 79.9 80.1 79.6 78.8 78.3 78.8Inpatient All Beneficiaries 50.9 50.0 50.2 50.2 50.5 50.2SNF All Beneficiaries 1.7 2.0 2.5 2.9 3.0 2.4Home Health All Beneficiaries 5.0 5.7 5.9 5.7 3.8 2.9Hospice All Beneficiaries 0.7 0.7 0.8 0.7 0.7 0.8Physician All Beneficiaries 28.5 28.2 26.9 26.3 27.7 29.2Outpatient All Beneficiaries 10.9 10.8 11.2 11.4 11.6 11.6DME All Beneficiaries 2.2 2.6 2.6 2.8 2.8 2.9Total All Beneficiaries 100.0 100.0 100.0 100.0 100.0 100.0
Table 15b. Distribution of Spending for 70-74 Age Group by Decedent Status: 1994-1999
Services Decedent
Status 1994 1995 1996 1997 1998 1999Inpatient Decedents 13.2 13.2 13.4 13.5 13.6 14.0SNF Decedents 0.8 1.0 1.2 1.4 1.5 1.2Home Health Decedents 1.3 1.4 1.5 1.2 1.0 0.8Hospice Decedents 0.7 0.7 0.7 0.7 0.7 0.8Physician Decedents 3.8 3.8 3.7 3.7 4.0 4.2Outpatient Decedents 1.3 1.3 1.4 1.4 1.5 1.5DME Decedents 0.5 0.5 0.5 0.6 0.5 0.5Total Decedents 21.6 22.0 22.4 22.5 22.8 23.0Inpatient Survivors 36.8 35.8 35.7 35.2 35.7 35.3SNF Survivors 1.6 1.8 2.3 2.6 2.6 2.2Home Health Survivors 5.4 5.9 6.0 6.1 3.7 2.9Hospice Survivors 0.1 0.1 0.1 0.0 0.0 0.1Physician Survivors 24.5 23.9 22.7 22.4 23.8 25.0Outpatient Survivors 8.2 8.3 8.7 8.9 9.1 9.0DME Survivors 1.8 2.1 2.1 2.3 2.3 2.5Total Survivors 78.4 78.0 77.6 77.5 77.2 77.0Inpatient All Beneficiaries 50.0 49.0 49.0 48.8 49.3 49.3SNF All Beneficiaries 2.4 2.9 3.5 3.9 4.1 3.4Home Health All Beneficiaries 6.7 7.4 7.5 7.2 4.7 3.7Hospice All Beneficiaries 0.8 0.8 0.8 0.8 0.8 0.9Physician All Beneficiaries 28.3 27.7 26.4 26.2 27.7 29.2Outpatient All Beneficiaries 9.6 9.7 10.1 10.3 10.6 10.5DME All Beneficiaries 2.3 2.6 2.6 2.8 2.8 3.0Total All Beneficiaries 100.0 100.0 100.0 100.0 100.0 100.0
33

Table 15c. Distribution of Spending for 75-79 Age Group by Decedent Status: 1994-1999
Services Decedent
Status 1994 1995 1996 1997 1998 1999Inpatient Decedents 14.9 14.5 14.6 15.0 15.5 15.8SNF Decedents 1.3 1.6 1.9 2.2 2.2 1.8Home Health Decedents 1.9 1.9 2.0 1.5 1.3 1.0Hospice Decedents 0.8 0.8 0.8 0.8 0.9 1.0Physician Decedents 4.4 4.3 4.1 4.1 4.4 4.6Outpatient Decedents 1.3 1.4 1.4 1.4 1.5 1.4DME Decedents 0.6 0.6 0.6 0.6 0.6 0.6Total Decedents 25.2 25.1 25.5 25.7 26.5 26.2Inpatient Survivors 34.2 33.1 33.1 32.7 33.3 33.8SNF Survivors 2.4 2.8 3.3 3.7 4.0 3.3Home Health Survivors 6.9 7.6 7.9 7.7 4.8 3.6Hospice Survivors 0.1 0.1 0.1 0.1 0.1 0.1Physician Survivors 22.3 22.0 20.7 20.3 21.6 23.2Outpatient Survivors 7.2 7.3 7.4 7.7 7.7 7.6DME Survivors 1.8 2.0 2.0 2.1 2.1 2.2Total Survivors 74.8 74.9 74.5 74.3 73.5 73.8Inpatient All Beneficiaries 49.2 47.6 47.7 47.7 48.8 49.6SNF All Beneficiaries 3.7 4.4 5.1 5.9 6.2 5.1Home Health All Beneficiaries 8.7 9.6 9.9 9.3 6.1 4.7Hospice All Beneficiaries 0.9 0.9 0.9 0.9 1.0 1.1Physician All Beneficiaries 26.7 26.2 24.8 24.4 26.1 27.8Outpatient All Beneficiaries 8.5 8.6 8.8 9.1 9.2 9.0DME All Beneficiaries 2.3 2.6 2.6 2.7 2.6 2.8Total All Beneficiaries 100.0 100.0 100.0 100.0 100.0 100.0
Table 15d. Distribution of Spending for 80-84 Age Group by Decedent Status: 1994-1999
Services Decedent
Status 1994 1995 1996 1997 1998 1999Inpatient Decedents 16.6 16.2 16.1 16.7 17.4 18.1SNF Decedents 2.2 2.5 2.9 3.5 3.6 3.0Home Health Decedents 2.7 2.7 2.8 2.2 1.8 1.5Hospice Decedents 1.0 1.0 1.0 1.0 1.1 1.2Physician Decedents 4.9 4.7 4.5 4.6 5.0 5.3Outpatient Decedents 1.5 1.4 1.5 1.6 1.6 1.5DME Decedents 0.7 0.8 0.7 0.7 0.7 0.7Total Decedents 29.4 29.2 29.4 30.3 31.1 31.3Inpatient Survivors 30.4 29.6 29.7 28.6 29.8 31.0SNF Survivors 3.6 4.1 4.8 5.2 5.9 4.8Home Health Survivors 9.5 10.1 10.1 10.1 5.9 4.5Hospice Survivors 0.1 0.2 0.1 0.1 0.1 0.1Physician Survivors 19.3 18.8 17.8 17.5 18.9 20.2Outpatient Survivors 5.9 6.0 6.2 6.3 6.4 6.1DME Survivors 1.7 1.9 1.9 1.9 1.9 2.0Total Survivors 70.6 70.8 70.6 69.7 68.9 68.7Inpatient All Beneficiaries 47.0 45.8 45.7 45.4 47.2 49.1SNF All Beneficiaries 5.7 6.6 7.7 8.7 9.4 7.8Home Health All Beneficiaries 12.2 12.8 12.9 12.2 7.7 6.0Hospice All Beneficiaries 1.1 1.1 1.1 1.1 1.2 1.4Physician All Beneficiaries 24.2 23.5 22.3 22.0 23.8 25.5Outpatient All Beneficiaries 7.4 7.5 7.7 7.9 8.0 7.6DME All Beneficiaries 2.4 2.7 2.6 2.7 2.6 2.7Total All Beneficiaries 100.0 100.0 100.0 100.0 100.0 100.0
34
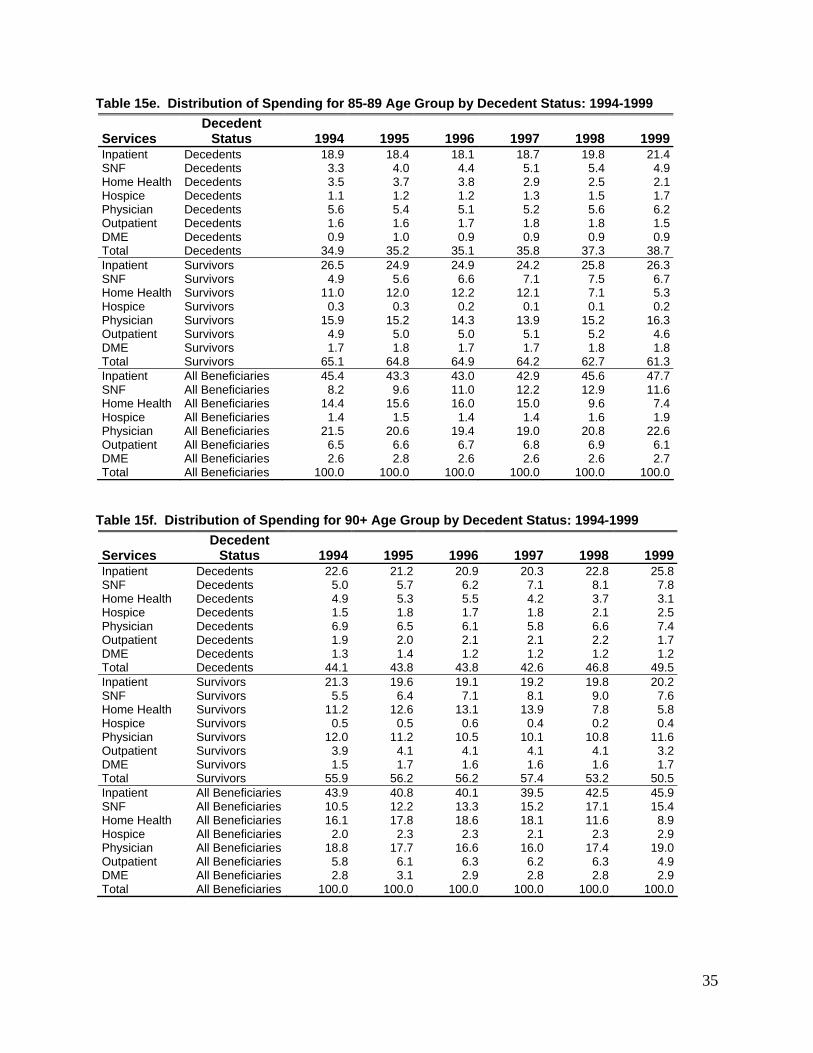
35
Table 15e. Distribution of Spending for 85-89 Age Group by Decedent Status: 1994-1999
Services Decedent
Status 1994 1995 1996 1997 1998 1999Inpatient Decedents 18.9 18.4 18.1 18.7 19.8 21.4SNF Decedents 3.3 4.0 4.4 5.1 5.4 4.9Home Health Decedents 3.5 3.7 3.8 2.9 2.5 2.1Hospice Decedents 1.1 1.2 1.2 1.3 1.5 1.7Physician Decedents 5.6 5.4 5.1 5.2 5.6 6.2Outpatient Decedents 1.6 1.6 1.7 1.8 1.8 1.5DME Decedents 0.9 1.0 0.9 0.9 0.9 0.9Total Decedents 34.9 35.2 35.1 35.8 37.3 38.7Inpatient Survivors 26.5 24.9 24.9 24.2 25.8 26.3SNF Survivors 4.9 5.6 6.6 7.1 7.5 6.7Home Health Survivors 11.0 12.0 12.2 12.1 7.1 5.3Hospice Survivors 0.3 0.3 0.2 0.1 0.1 0.2Physician Survivors 15.9 15.2 14.3 13.9 15.2 16.3Outpatient Survivors 4.9 5.0 5.0 5.1 5.2 4.6DME Survivors 1.7 1.8 1.7 1.7 1.8 1.8Total Survivors 65.1 64.8 64.9 64.2 62.7 61.3Inpatient All Beneficiaries 45.4 43.3 43.0 42.9 45.6 47.7SNF All Beneficiaries 8.2 9.6 11.0 12.2 12.9 11.6Home Health All Beneficiaries 14.4 15.6 16.0 15.0 9.6 7.4Hospice All Beneficiaries 1.4 1.5 1.4 1.4 1.6 1.9Physician All Beneficiaries 21.5 20.6 19.4 19.0 20.8 22.6Outpatient All Beneficiaries 6.5 6.6 6.7 6.8 6.9 6.1DME All Beneficiaries 2.6 2.8 2.6 2.6 2.6 2.7Total All Beneficiaries 100.0 100.0 100.0 100.0 100.0 100.0
Table 15f. Distribution of Spending for 90+ Age Group by Decedent Status: 1994-1999
Services Decedent
Status 1994 1995 1996 1997 1998 1999Inpatient Decedents 22.6 21.2 20.9 20.3 22.8 25.8SNF Decedents 5.0 5.7 6.2 7.1 8.1 7.8Home Health Decedents 4.9 5.3 5.5 4.2 3.7 3.1Hospice Decedents 1.5 1.8 1.7 1.8 2.1 2.5Physician Decedents 6.9 6.5 6.1 5.8 6.6 7.4Outpatient Decedents 1.9 2.0 2.1 2.1 2.2 1.7DME Decedents 1.3 1.4 1.2 1.2 1.2 1.2Total Decedents 44.1 43.8 43.8 42.6 46.8 49.5Inpatient Survivors 21.3 19.6 19.1 19.2 19.8 20.2SNF Survivors 5.5 6.4 7.1 8.1 9.0 7.6Home Health Survivors 11.2 12.6 13.1 13.9 7.8 5.8Hospice Survivors 0.5 0.5 0.6 0.4 0.2 0.4Physician Survivors 12.0 11.2 10.5 10.1 10.8 11.6Outpatient Survivors 3.9 4.1 4.1 4.1 4.1 3.2DME Survivors 1.5 1.7 1.6 1.6 1.6 1.7Total Survivors 55.9 56.2 56.2 57.4 53.2 50.5Inpatient All Beneficiaries 43.9 40.8 40.1 39.5 42.5 45.9SNF All Beneficiaries 10.5 12.2 13.3 15.2 17.1 15.4Home Health All Beneficiaries 16.1 17.8 18.6 18.1 11.6 8.9Hospice All Beneficiaries 2.0 2.3 2.3 2.1 2.3 2.9Physician All Beneficiaries 18.8 17.7 16.6 16.0 17.4 19.0Outpatient All Beneficiaries 5.8 6.1 6.3 6.2 6.3 4.9DME All Beneficiaries 2.8 3.1 2.9 2.8 2.8 2.9Total All Beneficiaries 100.0 100.0 100.0 100.0 100.0 100.0