late life management of onshore and offshore pipelines - · pdf filelate life management of...
TRANSCRIPT
Late life management of onshore
and offshore pipelines
By Nathan Baranello
SUT Engineering Solutions for Mature Subsea & Pipeline
Assets, July 2016
2 - Wood Group Kenny
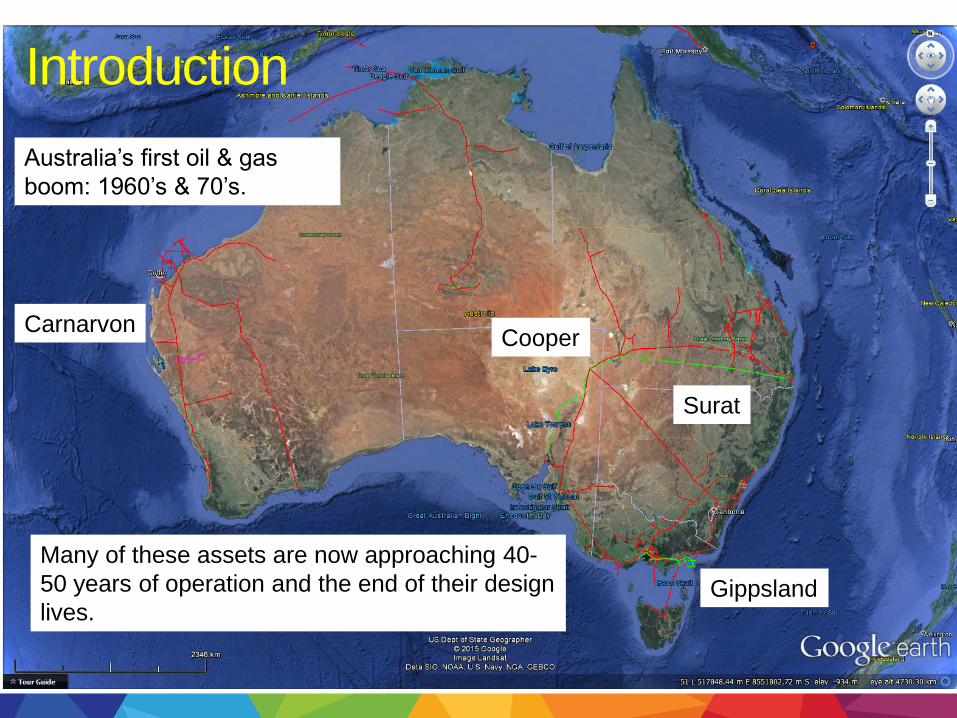
Introduction
Gippsland
Cooper Carnarvon
Surat
Australia’s first oil & gas
boom: 1960’s & 70’s.
Many of these assets are now approaching 40-
50 years of operation and the end of their design
lives.
3 - Wood Group Kenny
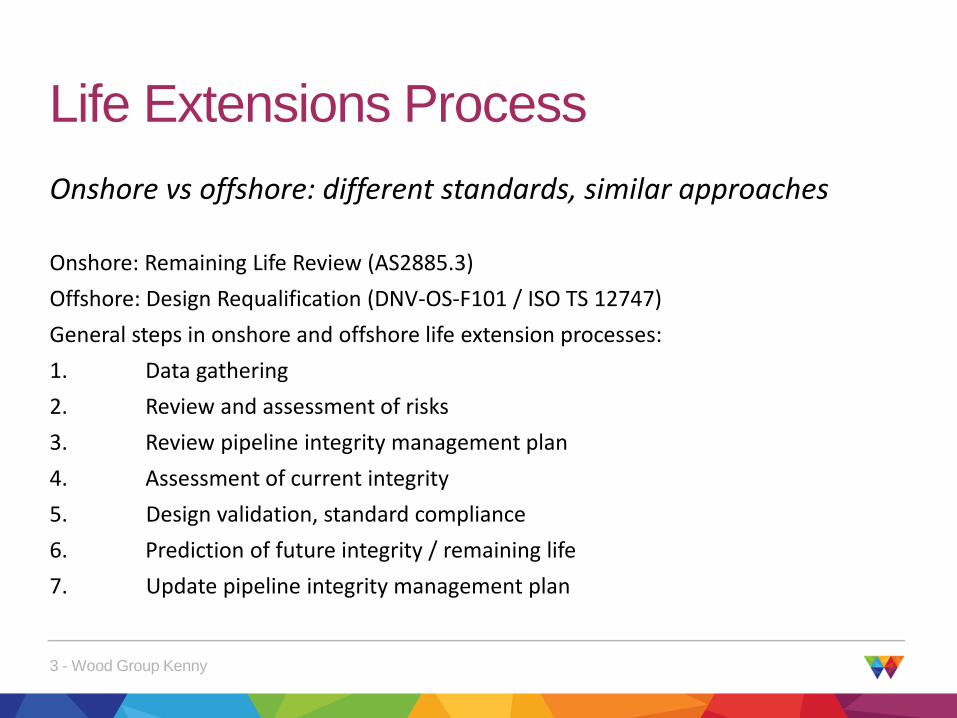
Onshore vs offshore: different standards, similar approaches
Onshore: Remaining Life Review (AS2885.3)
Offshore: Design Requalification (DNV-OS-F101 / ISO TS 12747)
General steps in onshore and offshore life extension processes:
1. Data gathering
2. Review and assessment of risks
3. Review pipeline integrity management plan
4. Assessment of current integrity
5. Design validation, standard compliance
6. Prediction of future integrity / remaining life
7. Update pipeline integrity management plan
Life Extensions Process
4 - Wood Group Kenny
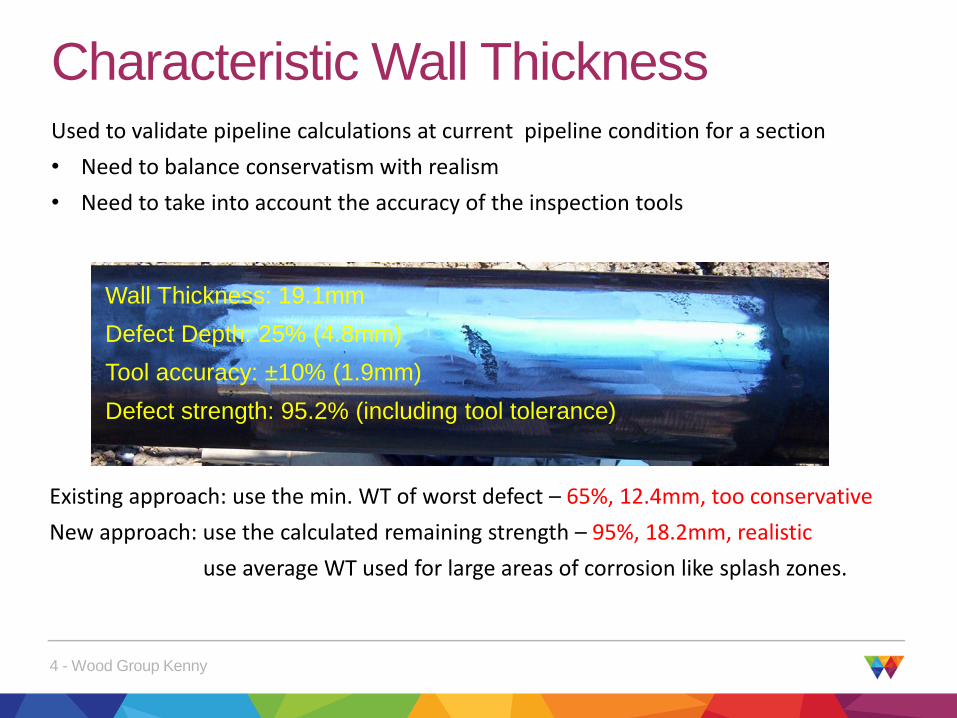
Used to validate pipeline calculations at current pipeline condition for a section
• Need to balance conservatism with realism
• Need to take into account the accuracy of the inspection tools
Characteristic Wall Thickness
Defect Depth: 25% (4.8mm)
Tool accuracy: ±10% (1.9mm)
Wall Thickness: 19.1mm
Defect strength: 95.2% (including tool tolerance)
Existing approach: use the min. WT of worst defect – 65%, 12.4mm, too conservative
New approach: use the calculated remaining strength – 95%, 18.2mm, realistic
use average WT used for large areas of corrosion like splash zones.
5 - Wood Group Kenny
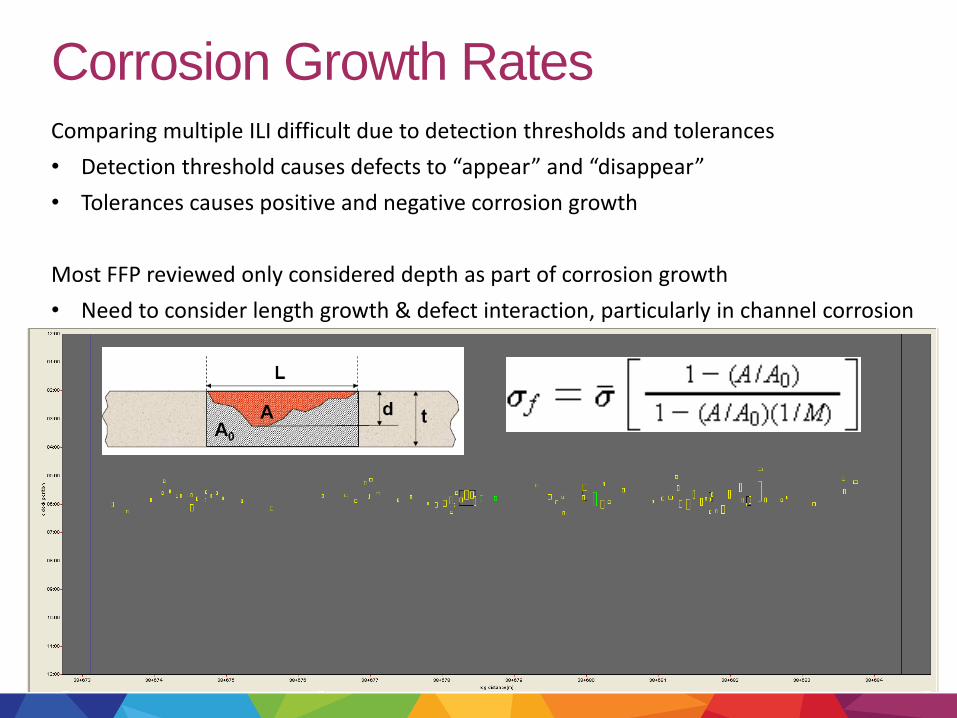
Comparing multiple ILI difficult due to detection thresholds and tolerances
• Detection threshold causes defects to “appear” and “disappear”
• Tolerances causes positive and negative corrosion growth
Most FFP reviewed only considered depth as part of corrosion growth
• Need to consider length growth & defect interaction, particularly in channel corrosion
Corrosion Growth Rates

6 - Wood Group Kenny
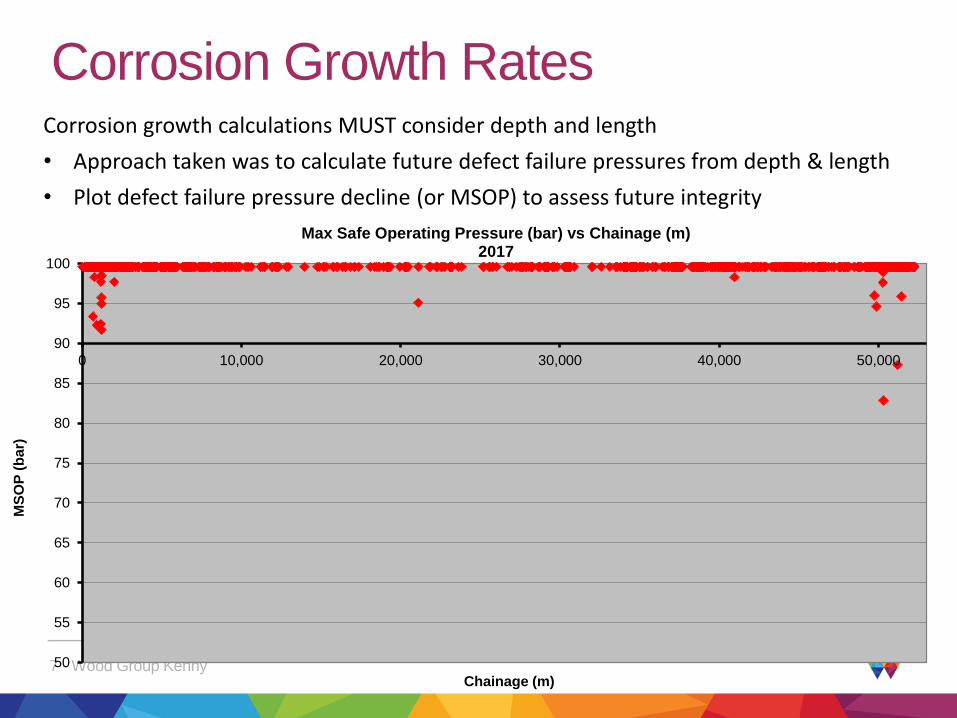
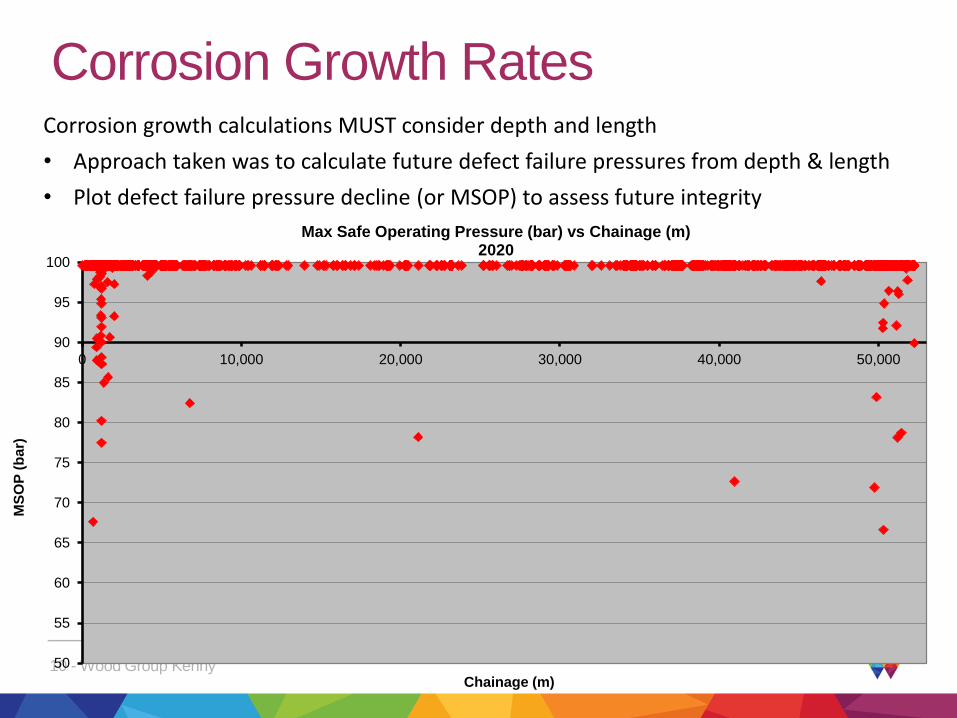
Corrosion Growth Rates Corrosion growth calculations MUST consider depth and length
• Approach taken was to calculate future defect failure pressures from depth & length
• Plot defect failure pressure decline (or MSOP) to assess future integrity
50
55
60
65
70
75
80
85
90
95
100
0 10,000 20,000 30,000 40,000 50,000
MS
OP
(b
ar)
Chainage (m)
Max Safe Operating Pressure (bar) vs Chainage (m) 2016
7 - Wood Group Kenny
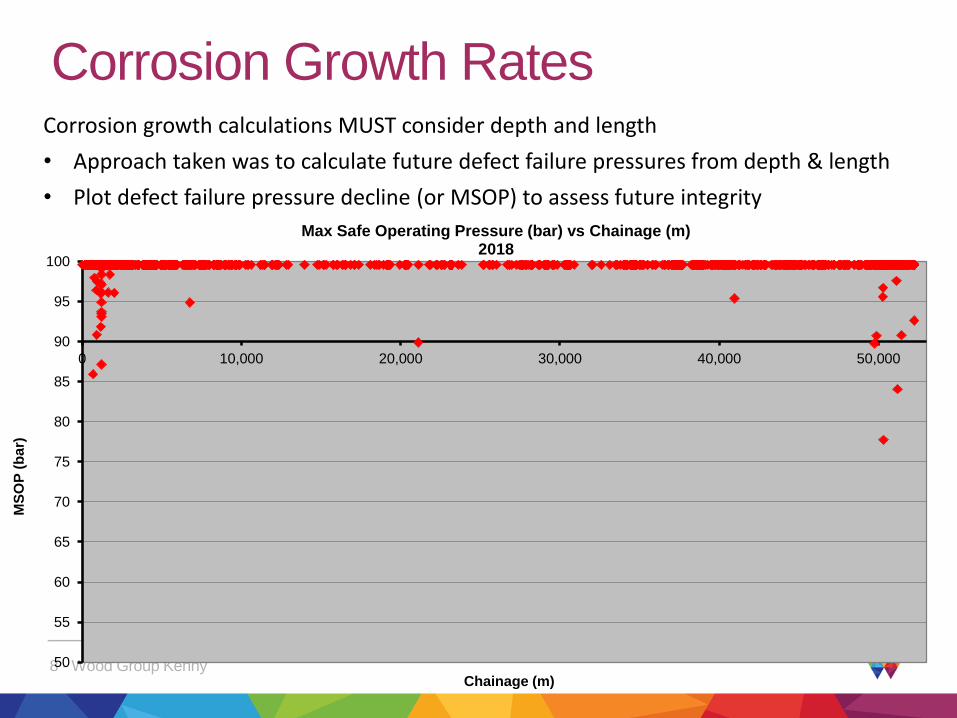
Corrosion Growth Rates Corrosion growth calculations MUST consider depth and length
• Approach taken was to calculate future defect failure pressures from depth & length
• Plot defect failure pressure decline (or MSOP) to assess future integrity
50
55
60
65
70
75
80
85
90
95
100
0 10,000 20,000 30,000 40,000 50,000
MS
OP
(b
ar)
Chainage (m)
Max Safe Operating Pressure (bar) vs Chainage (m) 2017
8 - Wood Group Kenny
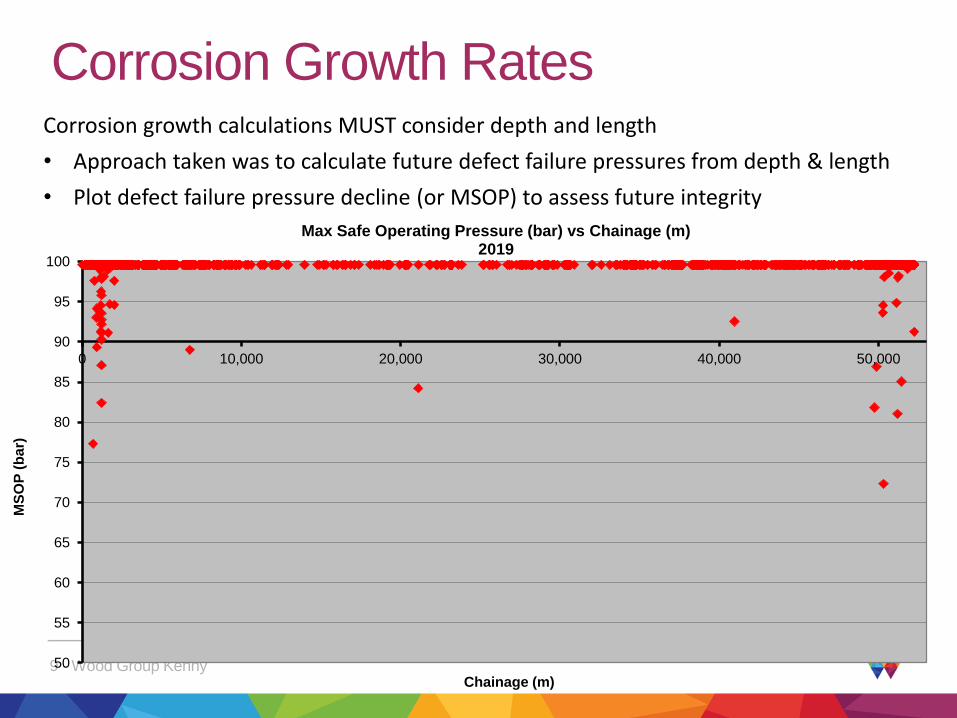
Corrosion Growth Rates Corrosion growth calculations MUST consider depth and length
• Approach taken was to calculate future defect failure pressures from depth & length
• Plot defect failure pressure decline (or MSOP) to assess future integrity
50
55
60
65
70
75
80
85
90
95
100
0 10,000 20,000 30,000 40,000 50,000
MS
OP
(b
ar)
Chainage (m)
Max Safe Operating Pressure (bar) vs Chainage (m) 2018
9 - Wood Group Kenny
Corrosion Growth Rates Corrosion growth calculations MUST consider depth and length
• Approach taken was to calculate future defect failure pressures from depth & length
• Plot defect failure pressure decline (or MSOP) to assess future integrity
50
55
60
65
70
75
80
85
90
95
100
0 10,000 20,000 30,000 40,000 50,000
MS
OP
(b
ar)
Chainage (m)
Max Safe Operating Pressure (bar) vs Chainage (m) 2019
10 - Wood Group Kenny
Corrosion Growth Rates Corrosion growth calculations MUST consider depth and length
• Approach taken was to calculate future defect failure pressures from depth & length
• Plot defect failure pressure decline (or MSOP) to assess future integrity
50
55
60
65
70
75
80
85
90
95
100
0 10,000 20,000 30,000 40,000 50,000
MS
OP
(b
ar)
Chainage (m)
Max Safe Operating Pressure (bar) vs Chainage (m) 2020
11 - Wood Group Kenny
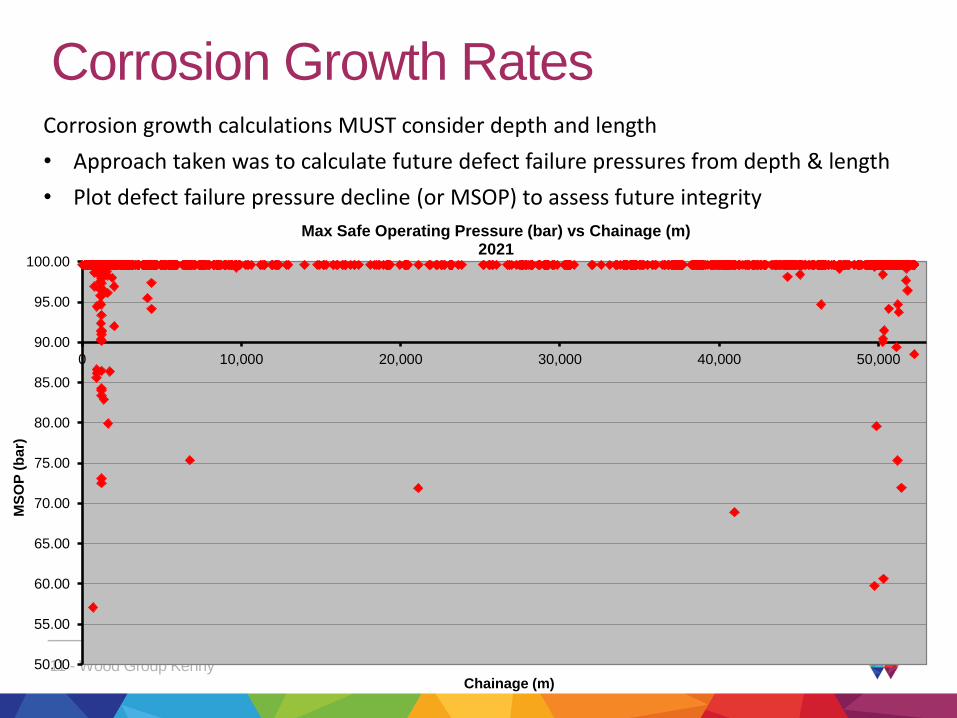
Corrosion Growth Rates Corrosion growth calculations MUST consider depth and length
• Approach taken was to calculate future defect failure pressures from depth & length
• Plot defect failure pressure decline (or MSOP) to assess future integrity
50.00
55.00
60.00
65.00
70.00
75.00
80.00
85.00
90.00
95.00
100.00
0 10,000 20,000 30,000 40,000 50,000
MS
OP
(b
ar)
Chainage (m)
Max Safe Operating Pressure (bar) vs Chainage (m) 2021
12 - Wood Group Kenny
"That men do not learn very much from the lessons of history is the most important of all the lessons of history.“ Aldous Huxley
WGK have completed life extensions studies on 30 offshore and 20 onshore pipeline in
the last 2 years, from which many key lessons have been learned.
Key lessons learned:
1. Allow sufficient time for data gathering
2. Prepare a Basis of Re-qualification document
3. Pay attention to pipeline interfaces such as shore crossings and splash zones
4. Always critically review theoretical predictions against reality
5. Carefully consider how to apply modern standards to old pipelines
Lessons Learned
13 - Wood Group Kenny
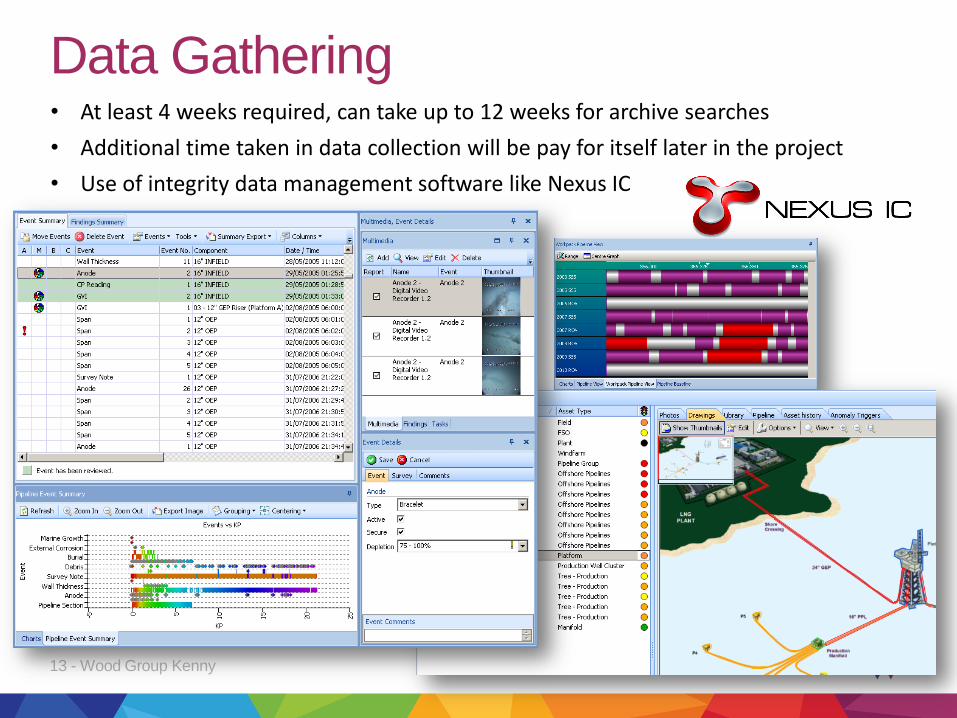
• At least 4 weeks required, can take up to 12 weeks for archive searches
• Additional time taken in data collection will be pay for itself later in the project
• Use of integrity data management software like Nexus IC
Data Gathering
14 - Wood Group Kenny
Like a good foundation, a Basis document is vital
• Provides a framework for completing the life extension work
• Clearly identify missing & contradictory data from data gathering
• Document assumptions made to complete missing data
• Document resolution to data conflicts
• Minimises the likelihood of rework being required
Basis of Re-qualification
15 - Wood Group Kenny
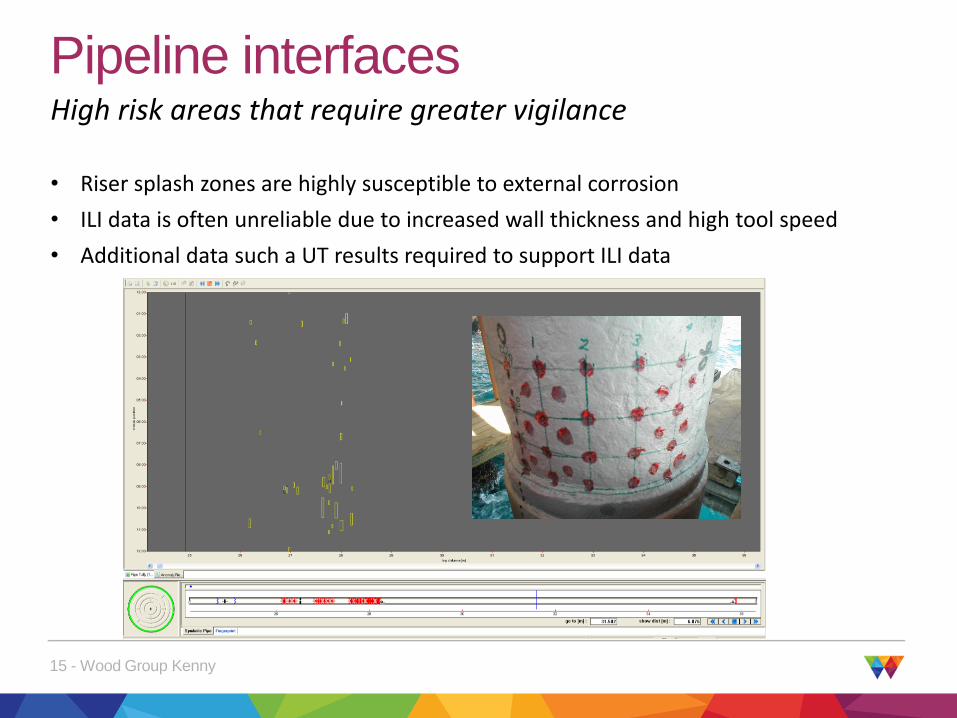
High risk areas that require greater vigilance
• Riser splash zones are highly susceptible to external corrosion
• ILI data is often unreliable due to increased wall thickness and high tool speed
• Additional data such a UT results required to support ILI data
Pipeline interfaces
16 - Wood Group Kenny
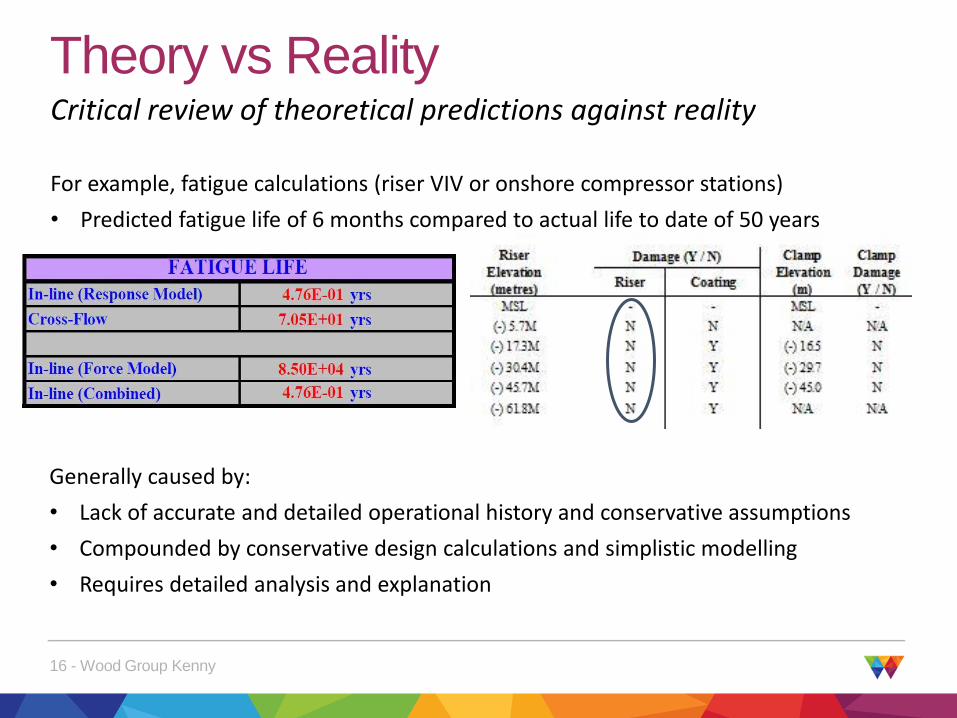
Critical review of theoretical predictions against reality
For example, fatigue calculations (riser VIV or onshore compressor stations)
• Predicted fatigue life of 6 months compared to actual life to date of 50 years
Theory vs Reality
Generally caused by:
• Lack of accurate and detailed operational history and conservative assumptions
• Compounded by conservative design calculations and simplistic modelling
• Requires detailed analysis and explanation
17 - Wood Group Kenny
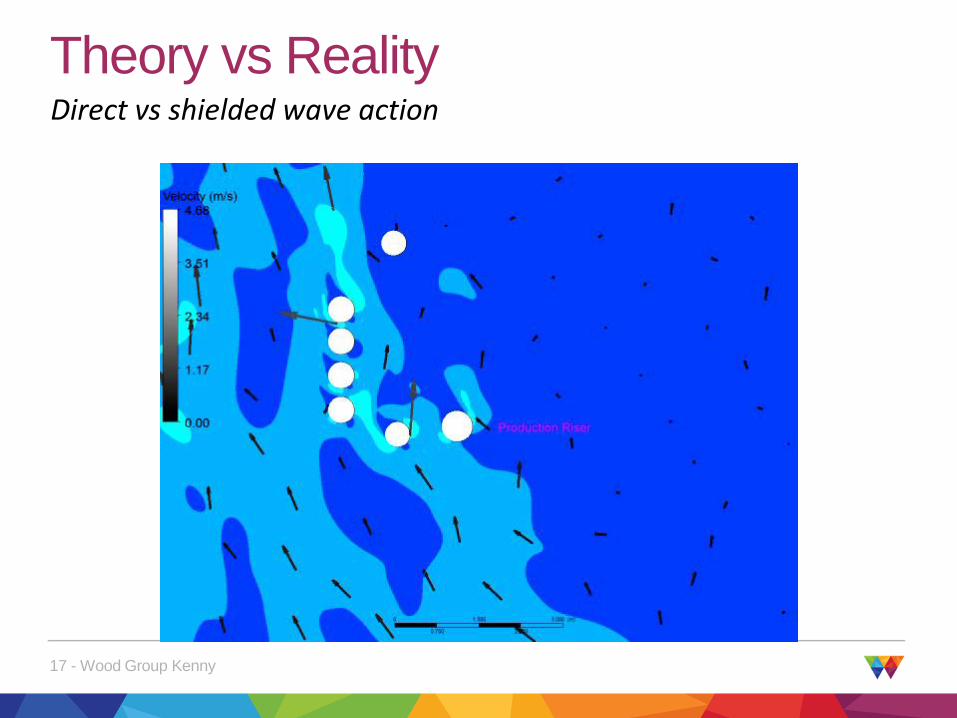
Theory vs Reality Direct vs shielded wave action
18 - Wood Group Kenny
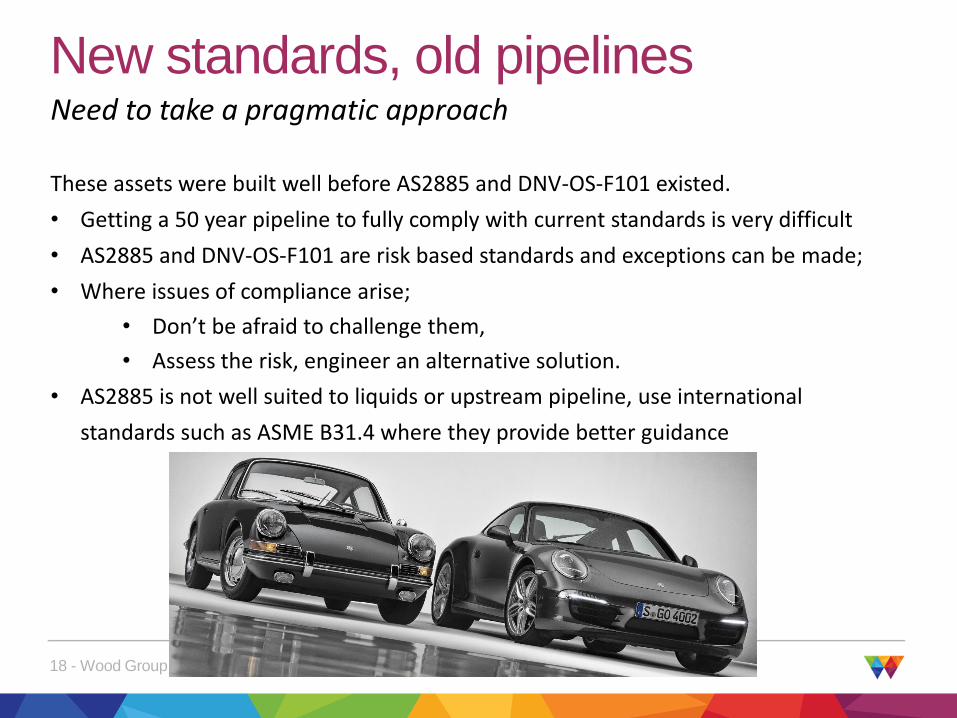
Need to take a pragmatic approach
These assets were built well before AS2885 and DNV-OS-F101 existed.
• Getting a 50 year pipeline to fully comply with current standards is very difficult
• AS2885 and DNV-OS-F101 are risk based standards and exceptions can be made;
• Where issues of compliance arise;
• Don’t be afraid to challenge them,
• Assess the risk, engineer an alternative solution.
• AS2885 is not well suited to liquids or upstream pipeline, use international
standards such as ASME B31.4 where they provide better guidance
New standards, old pipelines
19 - Wood Group Kenny
Not just a tick in the box
Life extensions processes under AS2885 and DNV-OS-F101 provide a rigorous
framework under which to assess current and future integrity
• Design, construction and operations is collated in one place, often for the first time
in many decades
They provide asset managers with:
• A sound basis to make decisions of life extensions
• Provide clear direction for ongoing pipeline integrity activities
• Allow for efficient allocation of OPEX resources based
on condition and risk
Conclusions