late nitrogen frenzy kemptville 2016
TRANSCRIPT

Late Nitrogen Frenzy
Jason Van Maanen, Veritas Scott Banks, OMAFRA Greg Stewart, Maizex

Research in N Uptake in Corn • 37% of N needed after
tassel • Modern hybrids use 37%
of N after tassel (30% in older hybrids)
Source: Pioneer Crop Insights

Equipment options

High Yield Contest Winners
• Several (Francis Child, David Hula, Randy Dowdy) have spoken across Ontario
• Promoted the concept of feeding the crop late (VT) to maximize yields.

Key Question?
• 1) Does a late season N application (V10 – VT) provide an economic advantage over earlier application strategies?
• Conditions: • No Significant N Shortfall (not a Rescue N
Application) • Total N Applied is Equivalent Across All
Comparisons

SW Ontario Data
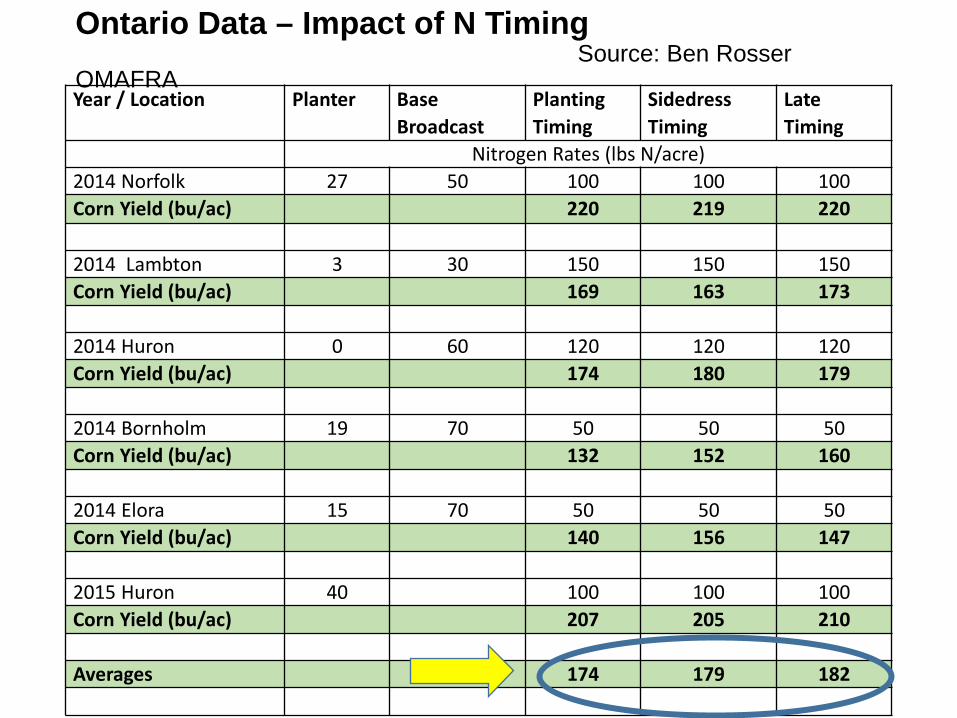
Ontario Data – Impact of N Timing Source: Ben Rosser OMAFRA Year / Location Planter Base
Broadcast Planting Timing
Sidedress Timing
Late Timing
Nitrogen Rates (lbs N/acre) 2014 Norfolk 27 50 100 100 100 Corn Yield (bu/ac) 220 219 220 2014 Lambton 3 30 150 150 150 Corn Yield (bu/ac) 169 163 173 2014 Huron 0 60 120 120 120 Corn Yield (bu/ac) 174 180 179 2014 Bornholm 19 70 50 50 50 Corn Yield (bu/ac) 132 152 160 2014 Elora 15 70 50 50 50 Corn Yield (bu/ac) 140 156 147 2015 Huron 40 100 100 100 Corn Yield (bu/ac) 207 205 210 Averages 174 179 182

Indiana Data

Timing of last N application (50 pounds/acre) in Irrigated Corn (mean of P1498 and P1360 at 2 populations in 2015)
180185190195200205210215220225230235
V6 V10 V14 V18 V6 V10 V14 V18
30000 40000
Pop x N timing
R1 R1
Yields bu/acre
Source: T.J. Vyn

Becks Hybrids Data High Clearance Sidedressing

Beck’s Hybrids
• 4 year average comparing traditional sidedress to V10 High Clearance Sidedress.
• + 3.06 bu/acre or $16.34/acre
• No adjusting for application costs

Illinois Data

13
Treatment UR-15 MN-15 DK-15 Avg PT UAN 150 injected 228 217 204 216 PT Urea/AT 150 broadcast 237 223 200 220 PT NH3 150 injected 219 213 201 211 *PT UAN/Instinct 150 broadcast 229 225 183 213 *PT UAN 100 inj + V9 UAN 50 drbl row 233 223 198 218 *PT UAN 100 inj + VT UAN 50 row mid 241 215 179 212 *PT UAN 100 inj + VT UAN 50 drbl in row 238 228 184 217 *New in 2015
Treatments added in 2015
VT applications performed well, but not clearly better than some other treatments in a “high-loss” year
Source: E. Nafziger

Eastern Ontario Data

Y Drop Trial Treatment Starter
N Sidedress
N Late
N Total
N
Grower Rate 30 100 130
Grower Rate Split (2/3, 1/3) 30 60 40 130
Grower Rate Reduced (- 25 lbs) and Split 30 50 25 105
Grower Rate Increased ( + 50 lbs) 30 150 180
Grower Rate Increased and Split 30 100 50 180
Starter Only 30 30

Locations Agri-Business Agrodrain Systems Ltd. 360 Yield Center
Brugmans Farms Cropland Consulting Inc.,
Cedar Lodge Farms Dekalb,
Hilltone Farms Ltd. DuPont Pioneer
Jockbrae Farms Ltd. GPS Ontario
Kemp Farms Inc. OMAFRA
Nandale Farms Ltd. OSCIA Panmure Farms Ltd. Ottawa-Carleton SCIA
Vanden Bosch Farms P.T. Sullivan Agro Inc.
Vernon Valley Farms Ltd. SGS Agri-Food Laboratories

Corn Yield Response to Late N Application Y-Drop Project - 2015
Jockbrae PanmureTotal N Yield (bu/ac) Yield (bu/ac)
34 173 221.7103 198 224.0109 207 222.8118 208 226.0154 215 226.5149 208 226.0
111.2 201.5 224.5
20 (19-22) (22-56)14 (7-21) (21-46)
Summary of Plots Total N
No side dress 48Grower Split with 75 % 84Grower Rate 113Grower Split with YD 117125 % of grower rate with YD 141125 % of grower rate 141
Average 107.3
Average PSNT-June 5( range) 39Average PSNT-June 17( range) 34Soil TexturePrevious Crop
Sandy LoamSoybean
Silt loam to loamWinter wheat
Summary by P.T. Sullivan Agro Inc.
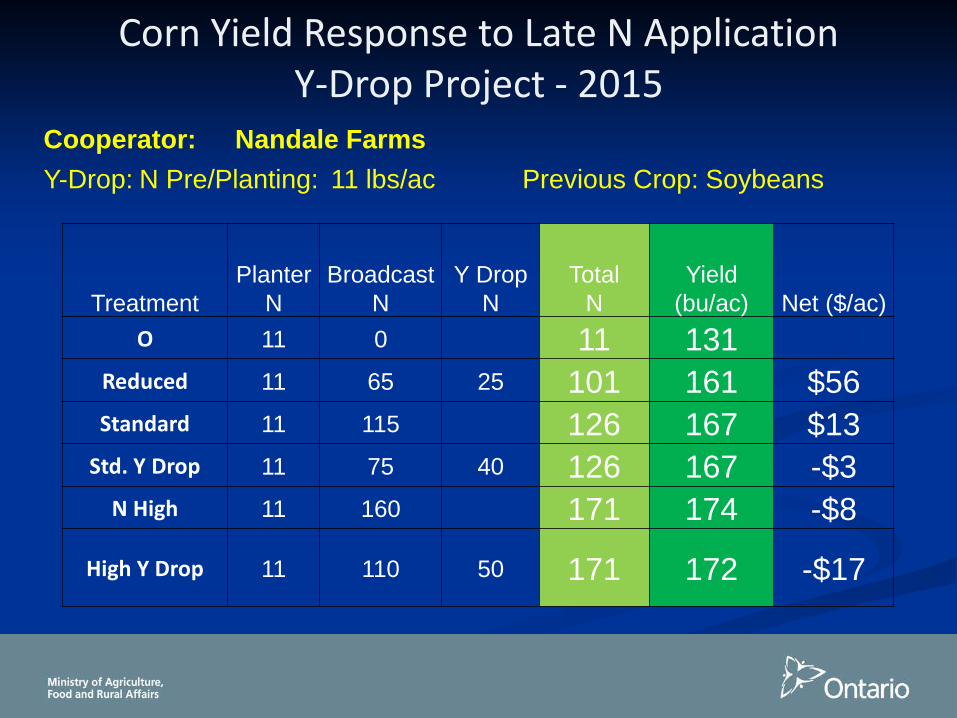
Corn Yield Response to Late N Application Y-Drop Project - 2015
Cooperator: Nandale Farms Y-Drop: N Pre/Planting: 11 lbs/ac Previous Crop: Soybeans
Treatment Planter
N Broadcast
N Y Drop
N Total
N Yield
(bu/ac) Net ($/ac) O 11 0 11 131
Reduced 11 65 25 101 161 $56 Standard 11 115 126 167 $13
Std. Y Drop 11 75 40 126 167 -$3 N High 11 160 171 174 -$8
High Y Drop 11 110 50 171 172 -$17

Nandale Farms –Y Drop 2015

Corn Yield Response to Late N Application Y-Drop Project - 2015
Cooperator: Nandale Farms Previous Crop: Soybeans
80
90
100
110
120
130
140
15030 65 10
013
517
020
524
027
531
034
538
041
545
048
552
055
559
062
5
MER
N (N
lbs/
ac)
Distance Down Field (feet)
MERN ( N lbs/ac)
Yields Plots 9 = 11 lbs N and 10 = 171 lbs N

Summary of Results
• Evidence Does Not Suggest That Later is Significantly, Consistently Better (Yield or Economics)
• Appears to be Little Negative Impact of Applying up to Tassel (VT)
• Late N Advantage Disappears after Tassel

Late N Advantages
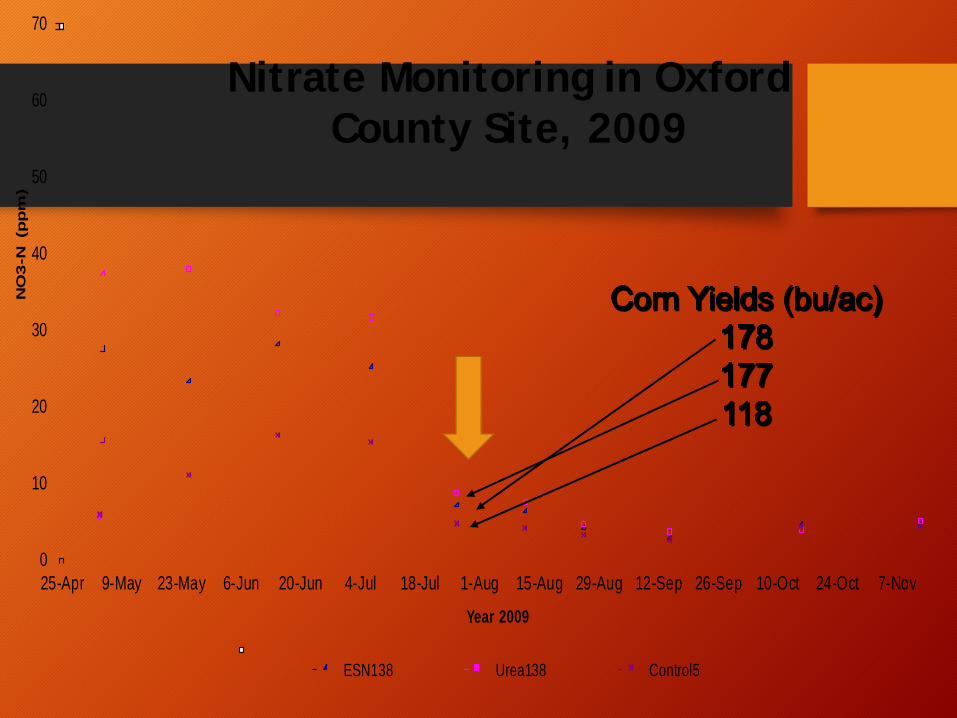
• Reducing the Size of the Nitrate Pool that is at Risk to Loss
• Rate Adjustment for Various Conditions

Advantage - Reducing the Nitrate Pool
• Leaching • Lighter soil – Early N moving down
with moisture
• Denitrification • Heavy soil – Gaseous losses of N in
saturated conditions
0
10
20
30
40
50
60
70
25-Apr 9-May 23-May 6-Jun 20-Jun 4-Jul 18-Jul 1-Aug 15-Aug 29-Aug 12-Sep 26-Sep 10-Oct 24-Oct 7-Nov
NO
3-N
(p
pm
)
Year 2009
ESN138 Urea138 Control5
Nitrate Monitoring in Oxford County Site, 2009

Advantage - N Rate Adjustment
• Preplant vs Sidedress vs Late • Decisions are 30 Days “Smarter”
• Crop Yield Potential • Rainfall x Soil Type • Soil Nitrate Status • Crop Health (Colour / NDVI)
• Making your N rate more precise

What to do after 9 inches of rain in June?
G. Stewart, Maizex Seeds


Nitrogen Management Millbank Site
Hybrid Over the Tile Between the Tiles No
Additional N
Plus 50 lbs/acre N
No Additional N
Plus 50 lbs/acre N
MZ3515DBR 174 194 138 172
MZ3066DBR 185 205 126 191
MZ2810DBR 194 206 166 191
Average 184 202 143 184
Source: G. Stewart, Maizex Seeds

4 Key Factors in Late N Decisions Factor Millbank Site
Yield Potential High - 37,000 PPA.
May / June Rainfall High - 9 inches in June
Soil Nitrate Values Relatively low
Plant Colour / NDVI Fading between tiles
G. Stewart, Maizex Seeds

Late Nitrogen Fine Tuning
Placement Urea vs UAN:Agrotain Yes or No Nitrate Soil Tests Precision Ag Approaches
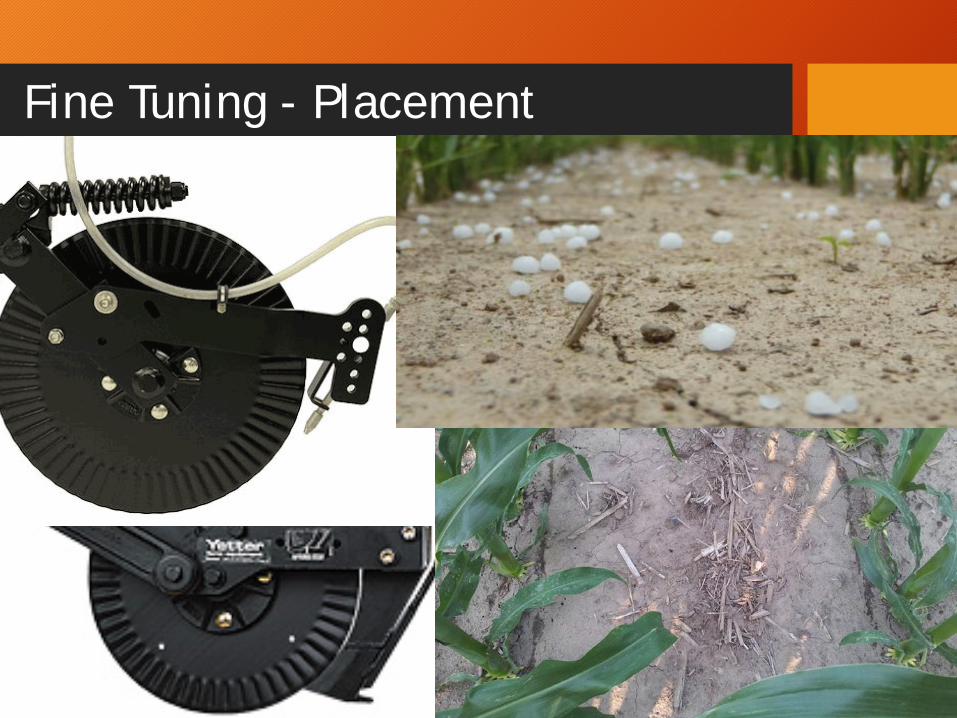
Fine Tuning - Placement

Fine Tuning – Products and Protection
N Rate per Acre (lb N) Product 50 65 Urea $38.00 $47.00 Urea + Agrotain $42.50 $52.00 UAN $44.00 $53.00
UAN + Agrotain $47.50 $58.00 ESN $51.00 $64.00
• Cost of material and application
J. Van Maanen, Veritas

The Cost of Loss
N Rate per Acre (lb N)
Product 50 65 Urea $38.00 $47.00
Urea + Agrotain $42.50 $52.00 UAN $44.00 $53.00
UAN + Agrotain $47.50 $58.00 ESN $51.00 $64.00
• Cost of material and application
J. Van Maanen, Veritas

The Cost of Loss
N Rate per Acre (lb N)
Product 50 65 Urea $38.00 $47.00
Urea + Agrotain $42.50 $52.00 UAN $44.00 $53.00
UAN + Agrotain $47.50 $58.00 ESN $51.00 $64.00
• Cost of material and application
J. Van Maanen, Veritas

Fine Tuning - Agrotain with UAN Applications?
Factors to Consider: Is the soil damp at the surface? Is there significant residue on the soil surface? Is the weather forecast dry? Is the canopy fully developed - windspeed?

Fine Tuning - Soil N Testing (Late)
• What do Soil N Tests Mean once Crop N Uptake is Significant? i.e. V10 +
• Perhaps Nothing.

38
0
50
100
150
200
250
300
350
4/6 4/26 5/16 6/5 6/25 7/15 8/4
Soil
N in
top
2 ft
., lb
/acr
e
Sampling date
Sangamon County 2015 None 100 AA Fa 200 AA Fa100 Fa+50+50 200 AA Spr 50 pl+150 SD
Yield None 145 Fall NH3 270 Fa100+Pl50+SD50 269 Spr NH3 264 Pl50+SD150 277
Source: E. Nafziger

Fine Tuning - Precision Ag Approaches
• Do Precision Ag sensors (i.e. GreenSeeker) give you more meaningful information later in the season?
• Crop canopy at V6 versus V12; NDVI signal.

Fine Tuning - Precision Ag Approaches
• Crop canopy at V12 gives superior NDVI signal compared to V3
Source: Veritas

Timing? Can You be Too Late?
• What is the risk associated with July 25th Nitrogen?
• Risk is real, if the soil is dry and no rain occurs for three weeks, it is less likely that you can get the N to the crop.
Conclusions
• Evidence Does Not Suggest That Later is Significantly, Consistently Better (Yield and Economics)
• More Economic Advantage Can Be Realized if Late N Applications are Rate Adjusted for the Conditions that Exist. Defining those conditions?!
• N Loss Risks are Lowered by Reducing the Size of the Nitrate Pool
• Urea is Much More likely to Benefit from Agrotain than UAN (monitor conditions)

Conclusions
• Late (July) Soil N Test Not a Good Indicator of Late N Requirements
• Late N Needs to be In To Plant by VT, watch timing and conditions (i.e. too dry)

Thank you.
Contact Information:
Jason van Maanen [email protected] Greg Stewart [email protected] Scott Banks [email protected]


Maizex Agronomy Data, 2015 Site Base N Late N Yield
Campbellford 150 203Plus 50 - June 23 202Plus 50 - July 16 210
Granton 150 235Plus 50 - July 22 236
Erin 180 194Plus 50 - June 18 196Plus 50 - July15 192
Millbank 160 164Plus 50 - July 5 193
Langton 160 187Plus 50 - June 19 211Plus 50 - July 11 207
Kingston 135 222Plus 50 - July 16 230Plus 100 - July 16 249
Source: G. Stewart, Maizex Seeds