latent semantic indexing debapriyo majumdar information retrieval – spring 2015 indian statistical...
TRANSCRIPT

Latent Semantic Indexing
Debapriyo Majumdar
Information Retrieval – Spring 2015
Indian Statistical Institute Kolkata

2
Vector space modelEach term represents a dimension
Documents are vectors in the term-space
Term-document matrix: a very sparse matrix
Entries are scores of the terms in the documents (Boolean Count Weight)
Query is also a vector in the term-space
d1 d2 d3 d4 d5 q
car 0.5 0 0 0 0 1
automobile 0.2 0.8 0 0.2 0 0
engine 0.7 0.6 0.9 0 0.5 0
search 0 0 0.7 0.5 0.8 0
Vector similarity: cosine of the angle between the vectors
What is the problem?
car ~ automobile
But in the vector space model each term is a different dimension
Recall

3
Synonyms in different dimensions
Synonyms
Car and automobiles are synonyms
But different dimensions
Same situation for terms belonging to similar concepts
Goal: can we map synonyms (similar concepts) to same dimensions automatically?
automobile
car
d2
qd1
engine
d1 d2 d3 d4 d5 q
car 0.5 0 0 0 0 1
automobile 0.2 0.8 0 0.2 0 0
engine 0.7 0.6 0.9 0 0.5 0
search 0 0 0.7 0.5 0.8 0

4
Linear algebra review Rank of a matrix: number of linearly independent
columns (or rows) If A is an m × n matrix, rank(A) ≤ min(m, n)
d1 d2 d3 d4 d5
car 1 2 0 0 1
Rank of automobile 1 2 0 0 0 = ?
engine 1 2 1 0.2 0
search 0 0 1 0.2 0.8

5
Linear algebra review A square matrix M is called orthogonal if its rows and columns
are orthogonal unit vectors (orthonormal vectors)– Each column (row) has norm 1– Any two columns (rows) have dot product 0
For a square matrix M, if there is a vector v such that
Av = λv
for some scalar λ, then v is called an eigenvector of A
λ is the corresponding eigenvalue

6
Singular value decompositionIf A is an m × n matrix with rank r
Then there exists a factorization of A as:
where U (m × m) and V (n × n) are orthogonal, and
Σ (m × n) is a diagonal-like matrix
Σ = (σij), where σii = σi, for i = 1, …, r are the singular values of A, all non-diagonal entries of Σ are zero
σ1 ≥ σ2 ≥ … ≥ σr ≥ 0
Columns of U are the left singular vectors of A

7
Singular value decomposition
n × n
σ1
σr 0
0
m × nm × m
m × r
σ1
σr
r × r r × n

8
Matrix digonalization for symmetric matrix
If A is an m × m matrix with rank r
Consider C = AAT. Then:
C has rank r
Σ2 is a diagonal matrix with entries σi
2, for i = 1, …, r
Columns of U are the eigenvectors of C
σi2 are the corresponding
eigenvalues of C

9
SVD of term – document matrix
Documents are vectors in the m dimensional term space
But we would think there are less number of concepts associated with the collection
m terms, k concepts. k << m
Ignore all but the first k singular values, singular vectors
m × kk × k k × n
Low rank approximation
Ak
VkTΣk

10
Low-rank approxmation
Rank k
Now compute cosine similarity with the query q
Computationally, still m dimensional
vectors

11
Retrieval in the concept space Retrieval in the term-space (cosine): both q and d are m
dimensional vectors (m = #of terms)
Term space (m) concept space (k) Use the first k singular vectors
Query: q UkTq (k × m, m × 1 = k × 1)
Document: d UkTd (k × m, m × 1 = k × 1)
Cosine similarity in the concept space:
Other variants: map using (UkΣk)T

12
How to find the optimal low-rank? Primarily intuitive– Assumption that a document collection has exactly k
concepts– No systematic method to find optimal k– Experimental results are not very consistent

13
HOW DOES LSI WORK?Bast & Majumdar, SIGIR 2005

Spectral retrieval – general framework
Term-document matrixA
(m × n)m terms, n documents
q(m × 1)
dimension reduction to concept space
L(k× m)
L . A(k × n)
k concepts, n documents
L . q(k × 1)
cosine similarities in concept space
cosine similarities in term space
Singular value decomposition (SVD)
A = U Σ VT
m × n m × r r × r r × n
Uk = first k columns of U
L = UkT (k × m)
LSI and other LSI-based retrieval methods are called
“Spectral retrieval”

Spectral retrieval as document "expansion"
1 1 0 0
1 1 0 0
0 0 1 0
0 0 0 1
car
auto
engine
search
·
0-1 expansion matrix
car auto engine search
1
1
1
0
=
0
1
1
0

Spectral retrieval as document "expansion"
1 1 0 0
1 1 0 0
0 0 1 0
0 0 0 1
car
auto
engine
search
·
add car if auto is present
0-1 expansion matrix
1
1
1
0
=
0
1
1
0
car auto engine search

Spectral retrieval as document "expansion"
0.29 0.36
0.25-0.12
0.36 0.440.30-0.17
0.25 0.300.44 0.30
-0.12
-0.170.30 0.84
car
auto
engine
search
0
1
1
0
Ideal expansion matrix should have– high scores for intuitively related terms– low scores for intuitively unrelated terms
expansion matrix UkUkT
0.61
0.74
0.74
0.13matrix L = U2U2
T projecting to 2 dimensions
0.42 0.51 0.66 0.370.33 0.43 -0.08 -0.84
add car if auto is present
· =
expansion matrix depends heavily on the subspace dimension!
car auto engine search
LSI expansion matrix

Why document "expansion"
0.93 -.12 0.20 -0.11
-0.12 0.80 0.34 -
0.18
0.20 0.34 0.44 0.30
-0.11
-0.18 0.30 0.84
car
auto
engine
search
0
1
1
0
Ideal expansion matrix should have– high scores for intuitively related terms– low scores for intuitively unrelated terms
0.08
1.13
0.78
0.12
0.42 0.51 0.66 0.370.33 0.43 -0.08 -0.84
-0.80 0.59 0.06 -
0.01
add car if auto is present
· =
expansion matrix UkUkT
matrix L = U3U3T projecting to
3 dimensions
car auto engine search
LSI expansion matrix
expansion matrix depends heavily on the subspace dimension!
Finding the optimal number of dimensions k remained an open problem

Relatedness Curves How the entries in the expansion matrix depend on the
dimension k of the subspace Plot (i,j)-th entry of expansion matrix T = LTL = UkUk
T against the dimension k
Cumulative dot product of the i-th and j-th rows of U
i
jk
U = {singular vectors}
k

node / vertex
200 400 6000subspace dimension
logic / logics
200 400 6000subspace dimension
logic / vertex
200 400 6000subspace dimension
Types of Relatedness Curves
Three main types
expa
nsio
n m
atrix
ent
ry
0
No single dimension is appropriate for all term pairs
But the shape of the curve indicates the term-term relationship!

Curves for related terms
01
01
101
110
10101
10110
0000......
11...
1111......
We call two terms perfectly related if they have an identical co-occurrence pattern
200 400 6000subspace dimension
200 400 6000subspace dimension
200 400 6000subspace dimension
expa
nsio
n m
atrix
ent
ry
proven shape for perfectly related terms
provably small change after slight perturbation more perturbation
shape: up, then down point of fall-off is different for every term pair, we can calculate that
term 1
term 2
0
00
D
bb
B
a00a
AA
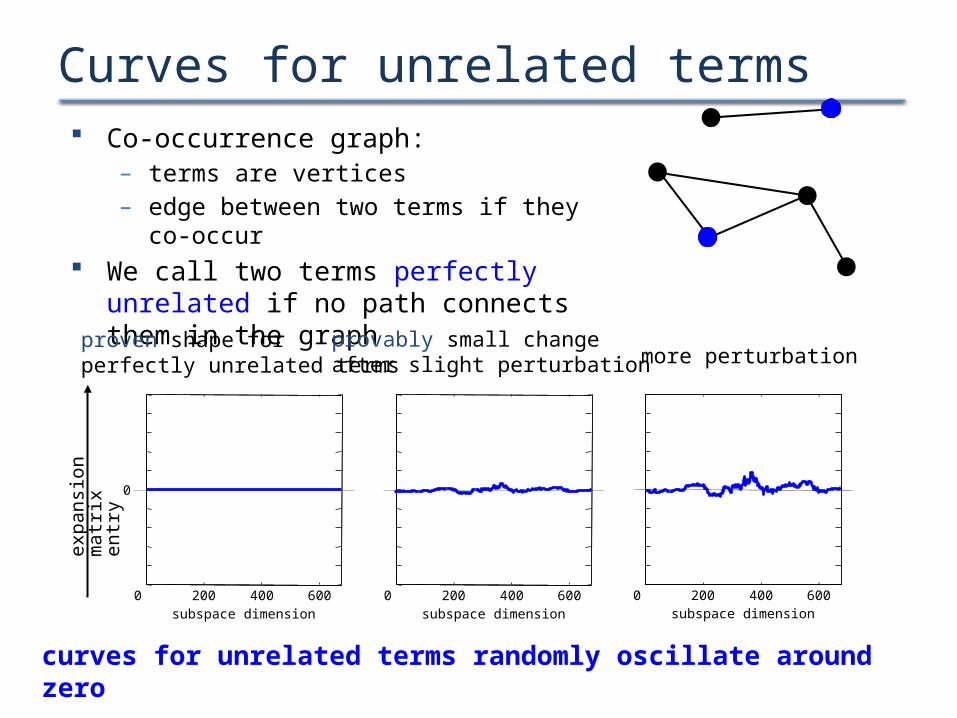
Curves for unrelated terms Co-occurrence graph:
– terms are vertices– edge between two terms if they co-occur
We call two terms perfectly unrelated if no path connects them in the graph
curves for unrelated terms randomly oscillate around zero
proven shape forperfectly unrelated terms
provably small changeafter slight perturbation more perturbation
200 400 6000subspace dimension
200 400 6000subspace dimension
200 400 6000subspace dimension
expa
nsio
n m
atrix
ent
ry
0

TN: the non-negativity Test1. Normalize term-document matrix so that theoretical point of fall-off is
same for all term pairs
2. Discard the parts of the curves after this point
3. For each term pair: if curve is never negative before this point, set entry in expansion matrix to 1, otherwise to 0
200 400 6000subspace dimension
200 400 6000subspace dimension
200 400 6000subspace dimension
A simple 0-1 classification, produces a sparse expansion matrix!
Related terms
set entry to 1
Related terms
set entry to 1
Unrelated terms
set entry to 0exp
ansi
on
matr
ix e
ntr
y
0

TS: the Smoothness Test1. Again, discard the part of the curves after the theoretical point of fall-off
(same for every term-pair, after normalization)
2. For each term pair compute the smoothness of its curve (= 1 if very smooth, 0 as number of turns increase)
3. If smoothness is above some threshold, set entry in expansion matrix to 1, otherwise to 0
200 400 6000subspace dimension
200 400 6000subspace dimension
200 400 6000subspace dimension
0.82 0.69 0.07
exp
ansi
on
matr
ix e
ntr
y
Related terms
set entry to 1
Related terms
set entry to 1
0.82 0.69 0.07
Unrelated terms
set entry to 0
0
Again, 0-1 classification, produces a sparse expansion matrix!

Experimental results
Time
63.2%
62.8%
58.6%
59.1%
62.2%
64.9%
64.1%
COS
LSI*
LSI-RN*
CORR*
IRR*
TN
TM
425 docs3882 terms
* the numbers for LSI, LSI-RN, CORR, IRR are for the best subspace dimension!
Baseline: cosine similarity in term space
Latent Semantic Indexing Dumais et al. 1990
Term-normalized LSI Ding et al. 2001
Correlation-based LSI Dupret et al. 2001
Iterative Residual Rescaling Ando & Lee 2001
non-negativity test
smoothness test
Average precision

Experimental results
Time
63.2%
62.8%
58.6%
59.1%
62.2%
64.9%
64.1%
COS
LSI*
LSI-RN*
CORR*
IRR*
TN
TM
425 docs3882 terms
Reuters
36.2%
32.0%
37.0%
32.3%——
41.9%
42.9%
21578 docs5701 terms
Ohsumed
13.2%
6.9%
13.0%
10.9%——
14.4%
15.3%
233445 docs99117 terms
* the numbers for LSI, LSI-RN, CORR, IRR are for the best subspace dimension!
Average precision

Asymmetric term-term relations
Related terms: fruit – apple Until some dimension k’ the curve
fruit – apple is above the curve apple - apple
Until dimension k’ apple is more related to fruit than to apple itself
Asymmetric relation: fruit is more general than apple
0k
fruit - apple
fruit - fruit
apple - apple
Bast, Dupret, Majumdar & Piwowarski, 2006

Examples
More general
Less general
More general
Less general
Apple -- Fruit Car -- Opel
Space -- Solar Restaurant
-- Dish
India -- Gandhi Fashion -- Trousers
Restaurant
-- Waiter Metal -- Zinc
Sweden -- Stockholm
India -- Delhi
Church -- Priest Opera -- Vocal
Metal -- Aluminum Fashion -- Silk
Saudi -- Sultan Fish -- Shark

29
Sources and Acknowledgements IR Book by Manning, Raghavan and Schuetze: http
://nlp.stanford.edu/IR-book/ Bast and Majumdar: Why spectral retrieval works.
SIGIR 2005– Some slides are adapted from the talk by Hannah Bast