lateral collapse potential of wood pallets
TRANSCRIPT

Lateral Collapse Potential of Wood Pallets
by
Daniel L. Arritt
Thesis Submitted to the Faculty of the
Virginia Polytechnic and State University
in partial fulfillment of the requirements for the degree
of
APPROVED:
MASTER OF SCIENCE
in
Forest Products
T.E. McLain, Chairman
M.S. White
G. Ifju
September, 1985
Blacksburg, Virginia

Lateral Collapse Potential of Wood Pallets
by
Daniel L. Arritt
(Abstract}
Lateral collapse is a failure mode of wood pallets which
most frequently occurs during transportation and handling. ' The study objective was to develop a simplified procedure
for making relative comparisons in the lateral collapse
potential of competing pallet designs.
A theoretical model was developed to predict the maximum
horizontal force a pallet can sustain. A simple equilibrium
of forces approach including joint rigidity was used. A
lateral load test machine was built which induces and
measures the amount of horizontal force required to collapse
a pallet. After testing, the model was shown to be accurate
when no upper deckboard bending occured and inaccurate when
bending occured.
To account for bending, two multiple regression equations
were developed to predict modification factors using a

matrix structural analysis program.
predicts K-factors for two stringer
A closed form solution
designs. These K-
factors are used to modify the resisting·moments generated
by the fastened joints. The modified model was shown to
slightly overpredict maximum collapse load but did
accurately discern differences in relative lateral collapse
potential.
The ratio of the maximum horizontal load to the vertical
load on the pallet provides a means of ranking the potential
for lateral collapse. Those designs whose ratios fall
between 0.0 and 0.6 are at high risk, from 0.6 but less then
1.0 are at medium risk, and from 1.0 to infinity are at low
risk of lateral collapse. These ratios have been calibrated
against documented cases of lateral collapse. The factors
that influence the lateral collapse potential of a design
are stringer aspect ratio, joint characteristics, unit load,
and upper deck flexural rigidity.
ACKNOWLEDGEMENTS
The author wishes to extend his sincere appreciation to
his committee members Drs. Thomas McLain, Marshall White,
Geza Ifju, and Albert DeBonis for their leadership, advice
and friendship throughout this study.
Special thanks are extended to the Cooperative Pallet
Research Project funded by Va. Tech and the NWPCA for their
financial.support throughout this study.
Grateful acknowledgment is given to the author's
employer, Timber Truss Housing Systems, Inc. of Salem,
Virginia, for allowing him a leave of absence to complete
this thesis.
Finally, a personal note of gratitude is extended to the
author's wife, Kim, for her encouragement and sacrifices
during the study, to the author's family for assisting with
the basic educational opportunity and for moral support, and
to Kelly Mulheren and Harold Vandivort for their invaluable
assistance during this project.
iv
TABLE OF CONTENTS
TITLE
1. Introduction
2. Literature Review
2.1 Pallet Stability
2.2 Joint Characteristics
3. Theorectical Model Development
3.1 General
3.2 Type I Model
3.3 Type II Model
PAGE
1
4
6
8
17
17
30
36
3.3.1 Three and Four Stringer Designs 38
3.3.2 Two Stringer Design 40
4. Experimental Verification
4.1 Introduction
4.2 Development of Lateral Load Test Machine
4.3 Model Verification: Type I
4.4 Model Verification: Type II
4.5 Experimental Verification of LCAN
5. Design Procedures and Calibration
5.1 Introduction
5.2 Field Survey and LCP Categories
V
46
46
46
51
61
68
73
73
73
TABLE OF CONTENTS (continued)
TITLE
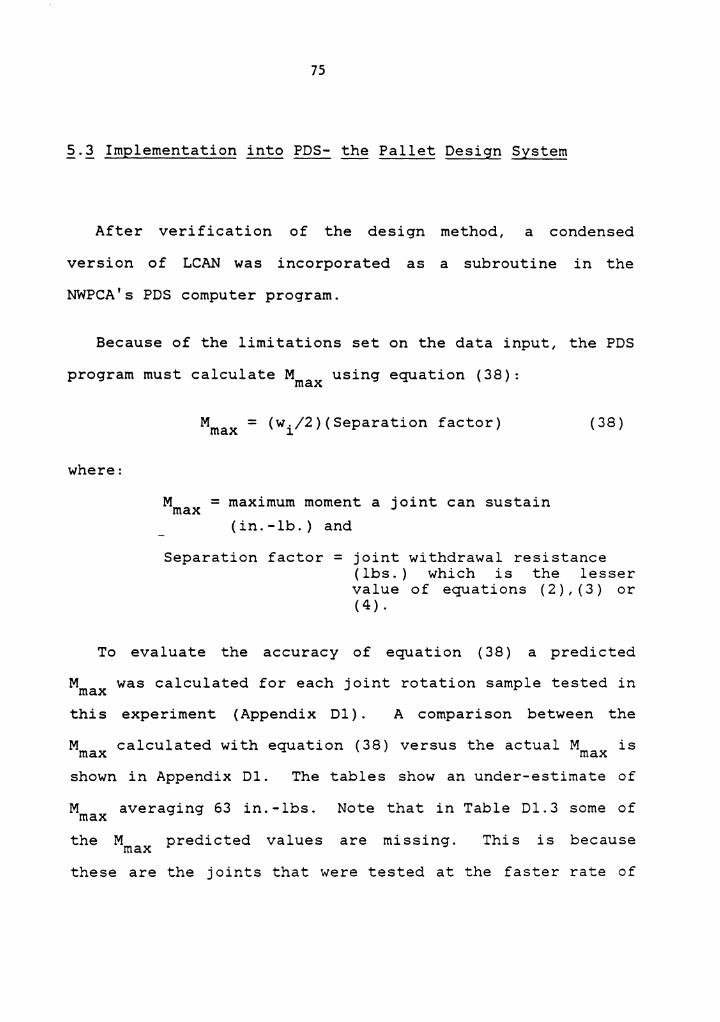
5.3 Implementation into PDS-the Pallet Design System
5.4 Documented Lateral Collapse Failures
5.5 Variable Sensitivity
PAGE
75
76
77
6. Conclusions 84
LITERATURE CITED 86
APPENDIX A 89
Al - Machine Drawings 90
A2 - Machine Wiring 94
A3 - Machine Operation 96
A3.1 - Pre Test Calibration Procedures 97
A3.2 - Typical Test Procedures 98
APPENDIX B 100
Bl - Listing of LCAN Program 101
B2 - Analog Models 118
B3 - Pallet Designs for Computer 121
B3.l - Three Stringer, Double-Faced Pallets Designed for K-Factor Development 122
B3.2 - Four Stringer, Double-Faced Pallets Designed for K-Factor Development 123
vi
TABLE OF CONTENTS (continued)
TITLE
B3.3 - Three Stringer, Single-Faced Pallets Designed for K-Factor Development
B3.4 - Four Stringer, Single-Faced Pallets Designed for K-Factor Development
APPENDIX C
Cl - Fastener Patterns
C2 - Construction Specifications and Unit Load for Type I Pallets
C3 - Construction Specifications for Joint Rotation Samples
C3.1 - Specification of Joint Rotation Samples Fastened with Nails
C3.2 - Specification of Joint Rotation Samples Fastened with Staples
C3.3 - Specification of Joint Rotation Samples for Rate of Loading Study
C4 - Upper Deckboard MOE by Pallet
CS - Construction Specifications and Unit Load for Type II Pallets
C6 - Construction Specifications and Unit Load for Field Pallets
APPENDIX D
Dl - Result of Joint Rotation Tests
Dl.1 - Test Results of Joint Rotation Samples for Nails
vii
PAGE
124
125
126
127
130
132
133
134
135
136
140
142
145
146
147
TABLE OF CONTENTS (continued)
TITLE
Dl.2 - Test Results of Joint Rotation Samples for Staples
Dl.3 - Test Results of Joint Rotation Samples for Rate of Loading Study
D2 - Regression Equations for Individual Joints
D2.l - K-factor Regression Equations and Corresponding R-Square Values for 3 Stringer, Single-faced Pallets
D2.2 - K-factor Regression Equations and Corresponding R-Square Values for 3 Stringer, Double-faced Pallets
D2.3 - K-factor Regression Equations and Corresponding R-Square Values for 4 _?tringer, Single-faced Pallets
D2.4 - K-factor Regression Equations and Corresponding R-Square Values for 4 Stringer, Double-faced Pallets
VITA
viii
PAGE
148
149
150
151
152
153
154
155
List of Abbreviations
Ar aspect ratio (w/d) (in./in.)
b width of upper deckboards (in.)
c diagonal distance of stringer cross section (in.)
CL inside distance between the legs of the staple measured at the crown (in.)
C compression perpendicular to the grain (lbs.)
d height of stringer (in.)
E modulus of elasticity (psi.)
Et combined E of upper deckboards (psi.)
FQI fastener quality index
FWT fastener withdrawal resistance (lbs.)
G specific gravity
h horizontal force applied to each stringer (lbs.)
H horizontal force applied to pallet (lbs.)
Heq H required to maintain equilibrium of SPACEPAL
HP
HX
i
analog models (lbs.)
maximum Ha pallet can sustain before collapse (lbs.)
H applied to SPACEPAL analog models (lbs.)
head diameter of nail (in.)
head pull-through resistance (lbs.)
number of helix per inch of thread length
number of a stringer A
combined moment of inertia of upper deckboards (in-)
ix

List of Abbreviations (continued)
j number of a deckboard
Kl modification factor for top joint moments
K2 modification factor for bottom joint moments
K3 three stringer modification factor for joint moments
K4 four stringer modification factor for joint moments
t center to center distance between outer stringers (in. )
t' deckboard overhang (in.)
LCP lateral collapse potential
ml resisting moments of individual top deckboard-stringer joints (in.-lb.)
m2 resisting moments of individual bottom deckboard-stringer joints (in.-lb.)
M moment (in.-lb.)
Ml
M2
MC
ND
sum of ml (in. - lb. )
sum of m2 ( in. -lb.)
total ml from SPACEPAL
total m2 from SPACEPAL
moisture content ( % )
total number of upper
analysis
analysis
deckboards
NS total number of stringers
(in.-lb.)
(in. - lb. )
P penetration in holding member (in.)
q upper deckboard thickness (in.)
X

List of Abbreviations (continued)
rl R of top deckboard-stringer joints (in.-lb./radian)
r2 R of bottom deckboard-stringer joints (in.-lb./radian)
R rotation modulus (in.-lb./radian)
Rl sum of rl (in.-lb./radian)
R2 sum of r2 (in.-lb./radian)
S reaction to unit load by stringers (lbs.)
T thickness of fastened member (in.)
TH thread-crest diameter of a nail (in.)
u distributed unit load (lbs./in.)
V unit load (lbs.)
w width of stringer (in.)
WD wire diameter (in.)
WW diameter or width of crown (in.)
X horizontal displacement of stringer (in.)
Y ·vertical distance from assumed point of rotation to hi (in.)
Z lever-arm distance of V (in.)
a angle between C and w (radians)
a' angle between C and horizontal plane at point A (radians)
~1 opening of the upper deckboard-stringer joints for a Type II, two stringer pallet (radians)
~2 opening of the lower deckboard-stringer joints for a Type II, two stringer pallet (radians)
xi
List of Abbreviations (continued)
; angular rotation (radians)
;1 ; of upper deckboard-joint (radians)
;2 ; of lower deckboard-joint (radians)
\l angle between horizontal plane at point A and top deckboards due to end moments (radians)
tl angle between horizontal plane at point A and top deckboards due to distributed load between supports (radians)
total angular rotation between horizontal plane at point A and top deckboards due to unit load (radians)
xii
List of Figures
FIGURE PAGE
2.1 - An Illustration of Tests which Determine Joint Properties 10
2.2 - Typical Moment (in.-lb.)-Rotation (Radians) Curve from Joint Rotation Test 11
2.3 - Nail Nomenclature 14
2.4 - Staple Nomenclature 16
3.1 - The Effect Unit Load has on a Collapsing, Type I Pallet 19
3.2 - Load Distribution on a Two Stringer Pallet 23
3.3 - Load Distribution on a Three Stringer Pallet 24
3.4 - Load Distribution on a Four Stringer Pallet 25
3.5 - The Deckboard-Stringer Joint 28
3.6 - The Effect Unit Load has on a Collapsing, Type II Pallet 37
3.7 - The Effect Unit Load has on a Collapsing, Two Stringer, Type II Pallet 41
3.8 - An Illustration of how Al and A2 are Calculated Utilizing the Principles of Superposition · 43
4.1 - Photograph of Test Machine 48
4.2 - Plan and Profile Views of Test Machine 49
4.3 - Photograph of Collapse Test 53
4.4 - Horizontal Force (lbs.) vs. Horizontal Translation (in.) Curve from Collapse Test 54
xiii

List of Figures (continued)
FIGURE
4.5 - The Change in Rank of H2 /V Versus the max
PAGE
Hlmax/V Rank for 3 Stringer Pallets 66
4.6 - The Change in Rank of H2 /V Versus the max Hl /V Rank for 4 Stringer Pallets 67 max
5.1 - The Effect Stringer Aspect Ratio has on Hmax/V 78
5.2 - The Effect Unit Load Ratio has on H /V 80 max 5.3 - The Effect of Flexural Rigidity on Hmax/V 81
5.4 - The Effect Maximum Moment of the Joints has on H /V 83 max
Al.1 - End Profile Views of Test Machine
Al.2 - Plan and Profile Views of Buttress-Load Head Connection
Al.3 Details of LVDT Bracket
91
92
93
A2.1 - Electrical Wiring Diagram of Test Machine 95
B2.1 - Three Stringer Analog Model 119
B2.2 - Four Stringer Analog Model 120
Cl.1 - Nail Patterns 128
Cl.2 - Staple Patterns 129
xiv
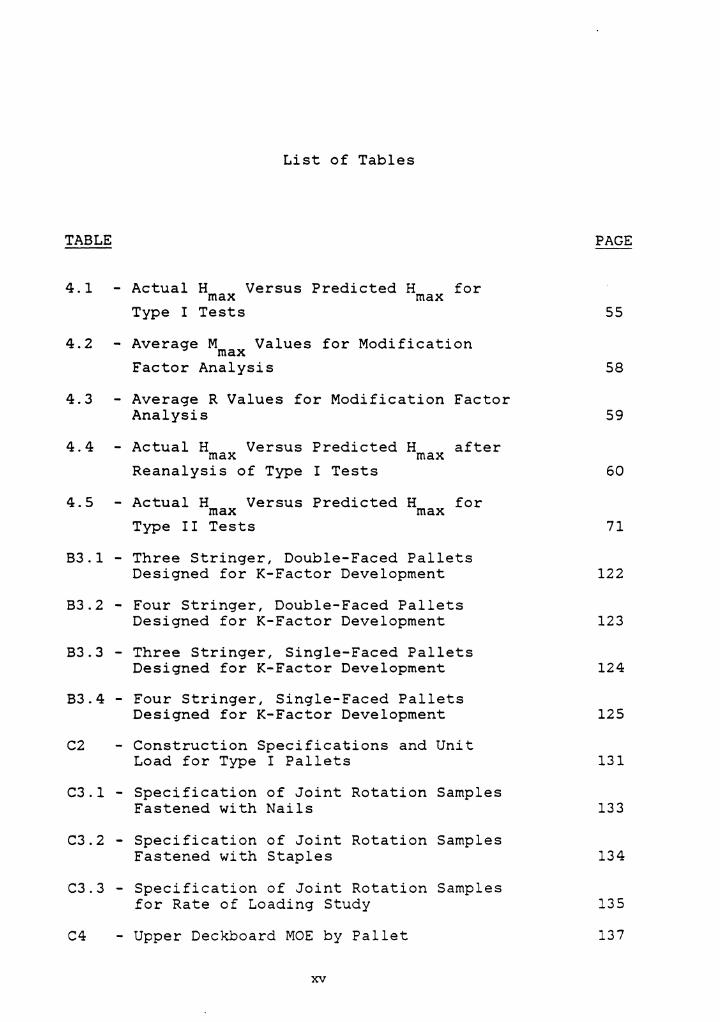
List of Tables
TABLE
4.1 - Actual H Versus Predicted H for max max Type I Tests
4.2 - Average M Values for Modification max Factor Analysis
4.3 - Average R Values for Modification Factor Analysis
4.4 - Actual H Versus Predicted H after max max Reanalysis of Type I Tests
4.5 - Actual H Versus Predicted H for max max Type II Tests
B3.l - Three Stringer, Double-Faced Pallets Designed for K-Factor Development
B3.2 - Four Stringer, Double-Faced Pallets Designed for K-Factor Development
B3.3 - Three Stringer, Single-Faced Pallets Designed for K-Factor Development
B3.4 - Four Stringer, Single-Faced Pallets Designed for K-Factor Development
C2 - Construction Specifications and Unit Load for Type I Pallets
C3.l - Specification of Joint Rotation Samples Fastened with Nails
C3.2 - Specification of Joint Rotation Samples Fastened with Staples
C3.3 - Specification of Joint Rotation Samples for Rate of Loading Study
C4 - Upper Deckboard MOE by Pallet
xv
PAGE
55
58
59
60
71
122
123
124
125
131
133
134
135
137

List of Tables (continued)
TABLE
cs
C6
- Construction Specifications and Unit Load for Type II Pallets
- Construction Specifications and Unit Load for Field Pallets
01.1 - Test Results of Joint Rotation Samples for Nails
01.2 - Test Results of Joint Rotation Samples for Staples
01.3 - Test Results of Joint Rotation Samples for Rate of Loading Study
02.1 - K-factor Regression Equations and Corresponding R-Square Values for 3 Stringer, Single-faced Pallets
02.2 - K-factor Regression Equations and Corresponding R-Square Values for 3 Stringer, -Double-faced Pallets
02.3 - K-factor Regression Equations and Corresponding R-Square Values for 4 Stringer, Single-faced Pallets
02.4 - K-factor Regression Equations and Corresponding R-Square Values for 4 Stringer, Double-faced Pallets
xvi
PAGE
141
143
147
148
149
151
152
153
154
CHAPTER 1
INTRODUCTION
Pallets are an essential component of todays' materials
handling industry. They offer an economical, efficacious
intermediary between unitized products and the lift-truck.
More than 277 million wooden pallets were manufactured in
the U.S. during 1980 (15) which shows the large demand for
this product.
There are currently
wooden pallets which
no standard design procedures
would insure a minimum level
for
of
structural performance and serviceability. As a result most
pallets are designed by trial and error, experience or not
at all. Because of the very competitive nature of the
industry the user, the manufacturer and the pallet industry
as a whole suffer because there are no uniformly recognized
guidelines for establishing a minimum pallet design for a
specific application. In response to this void and a major
concern with product liability, Virginia Polytechnic
Institute and State University, the National Wooden Pallet
and Container Association, and the U.S. Forest Service
1

2
entered into a cooperative Pallet Research Program ( PRP).
The objective of this program were to develop rational
design procedures ~hich will provide a means of assessing a
pallet's durability and structural adequacy prior to
manufacture.
One damaging failure mode of stringer pallets in service
is lateral collapse. For the purpose of this study lateral
collapse is defined as the overturning of all stringers in a
pallet with a unit load as a result of in-plane vibration 6r
load. This collapse may result from an impact load
perpendicular to the wide face of the stringers or to the
unit load itself. Collision between forklift tines and
stringers commonly induces these lateral impact loads but
other horizontal, in-plane forces may also contribute to
this failure. Pallets may also experience collapse due to
transverse vibration during transportion of palletized
loads. Lateral col lapse is known to occur during rai 1 or
truck shipment with inadequate dunnage.
There are relatively few well documented cases of la~eral
collapse available to researchers. However, within the
industry it is a well known problem although one that many
users do not necessarily report to manufacturers.
3
Unfortunately, analysis of the load or vibration required to
cause collapse is a complicated dynamic problem made further
complex by innumerable different pallet geometries,
fasteners, unit load types and service conditions.
The materials handling industry will benefit if some
relative measure of the potential of a pallet to collapse in
"average" service could be made. Undoubtedly, this could be
gained empirically, although the cost of doing so would be
prohibitive. As a result, this study was initiated with the
global objective of developing a method to estimate a
relative measure of the Lateral Collapse Potential (LCP) of
single- and double-faced, stringer pallets.
CHAPTER 2
LITERATURE REVIEW
Understanding structural collapse and its prevention is
no simple task. A review of the literature is presented to
help explain these topics.
During the early years of structural engineering, large
building materials, such as stones and timbers were
frequently used.
their design,
By incorporating these large elements into
ec~~neers were mostly concerned with
instability, not strength (23,24).
These massive building materials were gradually replaced
and were virtually eliminated early in the nineteenth
century with the advent of metals. Long, slender elements
could be fashioned from metal and used to build in new
geometric proportions. With these designs, new buckling and
stability problems arose. In the latter part of the
nineteenth century
buckling design.
Euler's equation became popular in
Since its refinement in the early
twentieth century, Euler's equation has made the analysis of
4

5
buckling less a problem than overall structural stability
( 7). Today,
constructed
economic pressures
with less material
demand buildings to be
and in more extreme
proportions which may exagerate stability problems.
The analysis of structural stability is pursued in many
directions. Often the structure, the environment, and the
behavior is simulated by models; however, this approach has
limited practicality. Entirely theoretical analyses are
useful, but rare. The most popular approach to structural
analysis is semi-theoretical
"column curves". Quite often,
used in the final design (9).
and empirical for example,
all of these techniques are
Even with the most sophisticated analysis, uncertainty of
the system and environment will influence design (23). It
is a good engineering practice to apply a margin of safety
to the analysis and the variables affecting stability. The
level of safety should be in balance with other design
principles: servicability, feasibility, repairability, and
aesthetics (3).
In summary of the reviewed literature to this point, the
stability of any structure is a function of its environment
and its design ( 9, 23, 30). Included in the environmental

6
factors are equilibrium moisture content, snow loads, wind
loads, and seismic forces. Some structural factors include
material quality, fasteners, and foundations (8).
behavior is governed by similar criteria.
Pallet
2.1 Pallet Stability
Wallin et al.
should consider
(28) suggests that the design of a pallet
both static and shock loads. Their
investigations concluded that the two most important factors
affecting impact strength are 1) the method of pallet
assembly and 2) the type and quality of pallet shook. The
Pallet Exchange Program (as cited by 12) recommends placing
high quality shook on the periphery of a pallet to optimize
its contribution to impact resistance.
The destructive vibrational forces inflicted on a
structure by shock loads are resisted by damping forces
( 11) . The damping forces come from internal friction and
the friction between the structure and its
( 4). To avoid failure of pallets due to
support system
impact loads,
nailed joints should not be too rigid (27). Dunmire (5)
found that those pallets whose deckboards were dry and whose
stringers were green during assembly were more durable
against shock loads than those assembled from completely

7
green material. He hypothesized that as the structure
dries, a large gap is formed between the deckboards and the
stringers which causes greater absorption of impact energy.
In addition to horizontal impact forces, unit loads are
applied to the pallet deck. A unit load is composed of
materials and products that a pallet supports (19). These
materials are frequently stacked individually, in boxes, or
in bags. Unit loads are considered most often to be 1)
uniformly distributed over the entire deck, 2) uniformly
distributed over part of the deck, or 3) concentrated (6).
In summary, the loads most frequently applied to a pallet
are lateral impact and unit loads. The environment of a
pallet offers many types of loads that must be recognized
during design to assure a semi-predictable behavior. The
arrangement of materials and the quality of those materials
play a significant role in structural stability.
For instance, pallet shook always exhibits variability.
As a result, each pallet will behave differently in an
environment. To maximize pallet durability, those stringers
and deckboards that have few defects should be placed on the
periphery of the structure (19,22). To assess the overall
quality of the material, a grading procedure can be
incorporated into the manufacturing process (19).
8
The typical wooden stringer manufactured in the U.S. has
dimensions ranging from 1. 00 x 3. 00 to 2. 00 x 4. 00 inches
(31). Gregory (7) describes the relationship between
stability and geometry of rectangles and solids. He
concluded that as an object's base, hinged at one corner,
increases and/or its height decreases, the horizontal load
applied to the top required to induce instability increases.
In a pallet the stringers act similarly. For example a
pallet with greater lateral strength is produced if 3 x 4
inch stringers are used instead of 2 x 4' s. Similarly, a
four stringer pallet will exhibit more lateral stiffness
than a three stringer pallet made with the same size
stringers ( 22) .
2.2 Joint Characteristics
Pallet
connected
stringers
by nails
and
or
deckboards are most
staples. The rigidity
frequently
of these
connections is likely to be an important variable in pallet
lateral behavior. Commonly used models to describe joint
rigidity are translational stiffness, separation modulus,
and rotation modulus. Translational stiffness measures the
rigidity of a joint in lateral loading. Loferski (12) notes
that the durability of a pal let under an impact load is

9
directly related to the lateral load carrying capacity. The
separation modulus is "the ratio of the applied withdrawal
force to the corresponding separation" ( Figure 2. 1) . This
modulus is helpful in predicting ber...: lng stiffness of a
pallet (10). The third model of joint rigidity, rotation
modulus, is defined by Kyokong (10) as "the ratio of the
applied moment to the angular rotation", or as defined in
the following equation:
where:
R = M/<11 ( 1)
R = rotation modulus (in.-lb./radian),
M = moment (in.-lb.), and
<II= angular rotation (radians).
Figure 2.2 is a M-<11
illustrated, there are
curve for a nailed joint. As
three distinct zones of interest
along the curve. Zone 1 is the initial part of the curve
where M is a linear function of f. Conversely, Zone 2 is
characterized by non-linear behavior of the joint. Zone 3
is joint failure. For the purpose of modeling the M-<11
behavior the linear function which describes the secant to
Zone 1 can be used until the line intersects with a
horizontal line where M = M max

l
l
r
L. ______ I I
~
10
r I
J -- -·-~~]
Translational Stiffness
Separation Modulus
Rotation Modulus
FIGURE 2.1 - An Illustration of Tests which Determine Joint Properties

700
650
600
550
500
450
400 M a M 350 E N T 300
250
200
150
100
50
0
11
I ----------------------------,-------------------·~- .... - ---T~-:;..:_----------------------------
0 2
' I I
I
' I I
' I I
' I I
ZONe e ZONE 3
4 6 8 10 12 14 16 ANGULAR ROTATION
F"IGURE 2.2 - TYPICAL MOMENT (IN.-LB.)-ROTATION
(RADIANS) CURVE FROM JOINT ROTAT'ON TEST
18 20

12
Certainly there are numerous variables that affect the M-
; behavior of a joint. One such variable of a nailed joint
is withdrawal resistance. Both the rotation modulus and the
separation modulus are dependent on this characteristic.
Withdrawal resistance is a function of several variables
which include specific gravity, nail diameter, depth of
penetration, type of nail shank, type of nail point, thread
angle, surface coatings on the nail, wood seasoning effects,
and moisture content (12,32).
Wallin and Whitenack (29) have developed an equation to
estimate the withdrawal resistance of nails and staples.
First:
where:
FWT = 222.2(FQI)(G 2 · 25 )(P)/(MC-3)
FWT = Fastener Withdrawal Resistance (lbs.),
FQI = 221.24(WD)+ 27.lS(TD-WD)(Hx)+l,
WD = wire diameter (in.),
TH = thread-crest diameter (in.),
Hx = number of helix per inch of thread length,
( 2)
G = specific gravity of the holding member,
P = penetration in holding member (in.), and
MC = moisture content at assembly of the holding member (%).
13
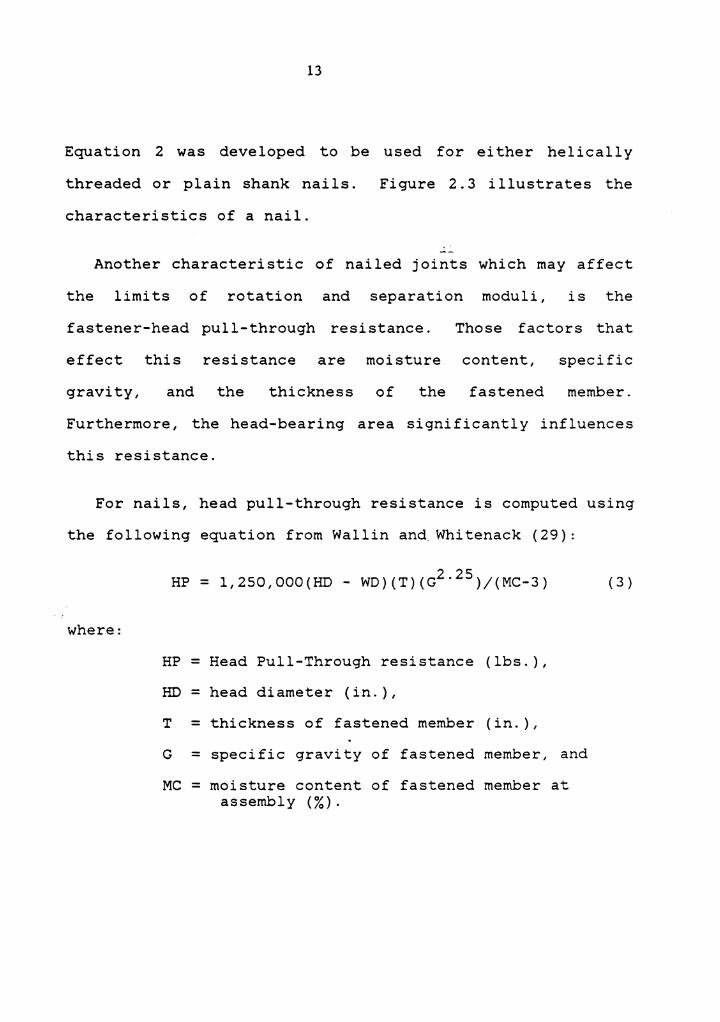
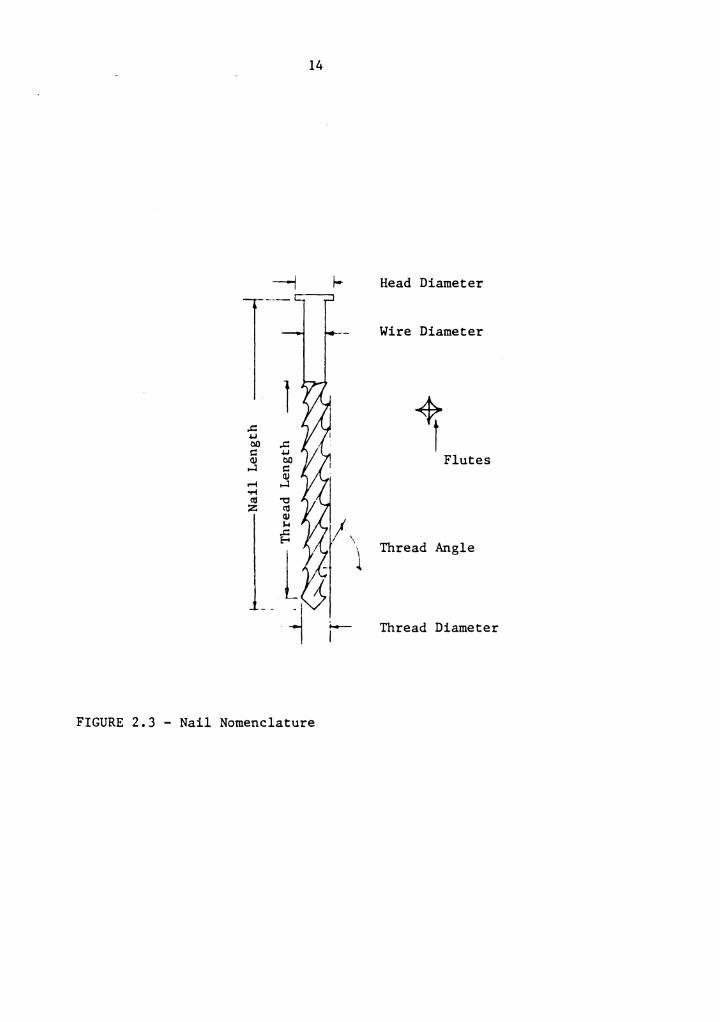
Equation 2 was developed to be used for either helically
threaded or plain shank nails. Figure 2.3 illustrates the
characteristics of a nail.
Another characteristic of nailed joints which may affect
the limits of rotation and separation moduli, is the
fastener-head pull-through resistance. Those factors that
effect this resistance are moisture content, specific
gravity, and the thickness of the fastened member.
Furthermore, the head-bearing area significantly influences
this resistance.
For nails, head pull-through resistance is computed using
the following equation from Wallin and_ Whitenack (29):
HP= 1,250,000(HD - WD)(T)(G 2 ·25 )/(MC-3) (3)
where:
HP = Head Pull-Through resistance (lbs.),
HD = head diameter (in. ) ,
T = thickness of fastened member (in. ) ,
G = specific gravity of fastened member, and
MC = moisture content of fastened member at assembly (%).
14
Head Diameter
Wire Diameter
l +i .c: 4,J CIO .c: C: 4,J Qj CIO Flutes ...:l C:
Qj .... ...:l -..t <11 "O z <11
Qj
/\ S..
eS Thread Angle
l l .__ Thread Diameter I
FIGURE 2.3 - Nail Nomenclature

15
For staples, HP is computed as:
where:
HP= l,591,550(CL)(WW)(T)(G 2 ·25 )/(MC-3) (4)
CL= inside distance between the legs of the staple measured at the crown (in.) and
WW= diameter or width of the crown (in.).
Figure 2.4 illustrates the characteristics of a staple.

T I
Length
I !
1
Crown Length
~--- - ----
16
---
\
FIGURE 2. 4 - Staple Nomenclature
Wire Thickness
l -9-1
Wire Width
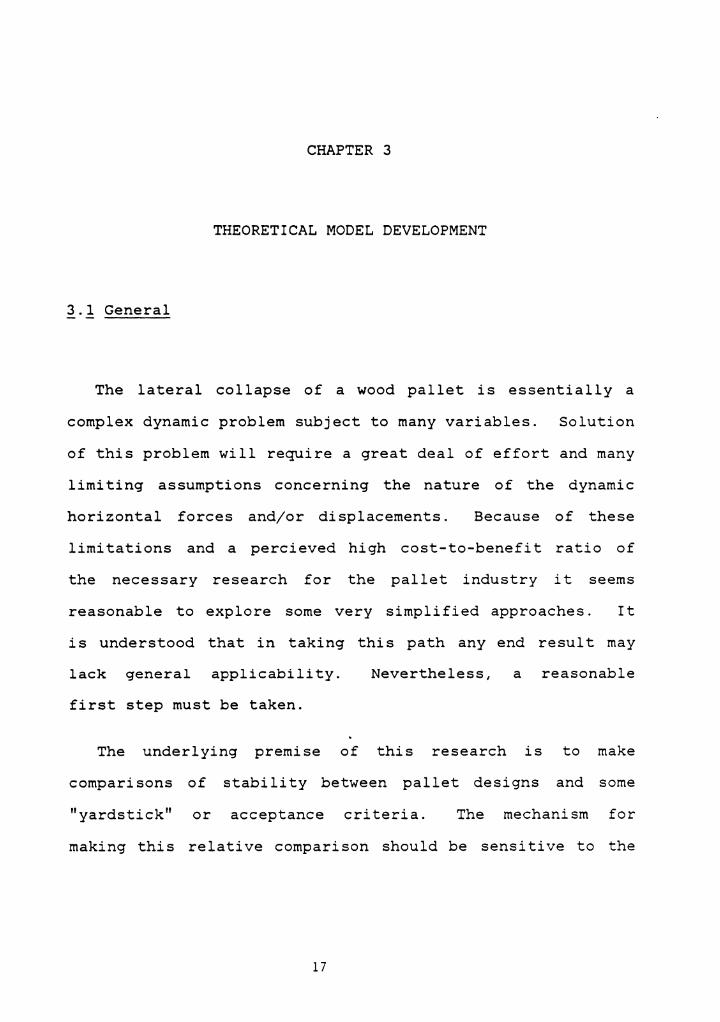
CHAPTER 3
THEORETICAL MODEL DEVELOPMENT
3.1 General
The lateral collapse of a wood pallet is essentially a
complex dynamic problem subject to many variables. Solution
of this problem will require a great deal of effort and many
limiting assumptions concerning the nature of the dynamic
horizontal forces and/or displacements. Because of these
limitations and a percieved high cost-to-benefit ratio of
the necessary research for the pallet industry it seems
reasonable to explore some very simplified approaches. It
is understood that in taking this path any end result may
lack general applicability. Nevertheless, a reasonable
first step must be taken.
The underlying premise of this research is to make
comparisons of stability between pallet designs and some
"yardstick" or acceptance criteria. The mechanism for
making this relative comparison should be sensitive to the
17

18
same variables that influence the dynamic forces causing
instability. By making relative comparisons the potential
problems with lateral collapse for a certain pallet design
can be assessed. This technique can not identify whether a
pallet will collapse under any given situation.
One simplified approach for a relative comparison is to
consider a horizontal force (H) applied to a pallet in the
plane of the top deckboards. This pallet may have stringers
(rectangular solid elements) of varying widths ·but not
varying height. A unit load exerts some uniformly
distributed force over the top deckboard. A bottom deck may
or may not be present. If His great enough, then the top
deck will translate causing the stringer to rotate as in
Figure 3. 1. After some critic al amount of rotation, the
pallet will collapse.
Two approaches
immediately. The
to this stability problem come to mind
first is a prediction of the energy
required to cause the pallet stringers to rotate 90 degrees
to the fully collapsed position. The second approach is to
predict a maximum horizontal force (Hmax) that wi 11 cause
the stringer to rotate to a position of unstable
equilibrium. That is, to a point where the unit load by
itself will complete stringer collapse.

H
19
,- - r·-· .. I L_ ---- -~. ---- -- ----· i,
V
! -----_-__._I __ C . J
..........___'7¢,~ s,
I
I ¢a, ~J
......... ···-··· ----- _________ _]
FIGURE 3.1 - The Effect Unit Load has on a Collapsing, Type I Pallet
20
Both approaches require simplifing assumptions concerning
the geometry of failure, joint properties past the "elastic"
range and the horizontal force which is a function of
displacement. A clear selection of one approach over the
other is not obvious to the author. However, a mitigating
factor is that the procedure must be simple and must make
sense when explained and used by users and manufacturers in
the pallet industry. Since this group is relatively
inexperienced in engineering science and the process of
design, the procedure must be simple to be "solid". If the
procedure is not accepted by this group, then all will have
been for naught. For this reason the maximum horizontal
force approach was selected as tne most likely candidate.
The ratio of H to the vertical unit load (V) a pallet max can sustain provides a convenient, unitless means of
comparing the lateral behavior of pallets. The boundaries
of Hmax/V are zero and infinity. A pallet with a H /V max ratio equal to zero, requires very little horizontal load to
cause collapse. Conversely, ~he pallet which has a Hmax/V
ratio of infinity simply will not collapse.
This ratio, Hmax/V, incorporates the unit load because
comparison without this value is meaningless. To illustrate
21
this, compare two pallet designs using H alone as the max governing criteria. If design #1 has an H of 8,000 lbs. max and design #2 has an Hmax of 6,000 lbs., one is likely to
conclude that design #1 has greater resistance to lateral
collapse. On the other hand, if design #1 is known to
support 5,000 lbs. and design #2 supports 1,000 lbs., the
Hmax/V ratios for design #1 and #2 are 1.6 and 6,
respectively. Utilizing the boundary conditions stated in
the previous paragraph one concludes that design #2 is the
least likely of the two designs to experience lateral
collapse. This ratio can only be used as a relative, not an
absolute comparison. It may well be that under some
conditions both designs may collapse. To help explain the
design approach, the following paragraphs describe the
assumptions involved in the collapse model derivation.
First, the horizontal load applied to the pallet during
collapse is considered to be applied at the lower edge of
the top deckboards and perpendicular to the length of the
stringers ( Figure 3. 1). This assumption was made so that
the model would recognize various deckboard thicknesses and
stringer heights. It is also assumed that the unit load
does not slip on the top deckboard but maintains its
relative placement.
22
Another assumption made was that the unit load on the
pallet is transmitted to the stringers in certain
percentages. The load on each stringer is designated as Vi
where i=l to the number of stringers. The V.s in the model 1
are considered to act in a vertical direction on the corners
of each deckboard-stringer joint. Thus, reactions S. where 1
i = 1 to the number of stringers are created at the
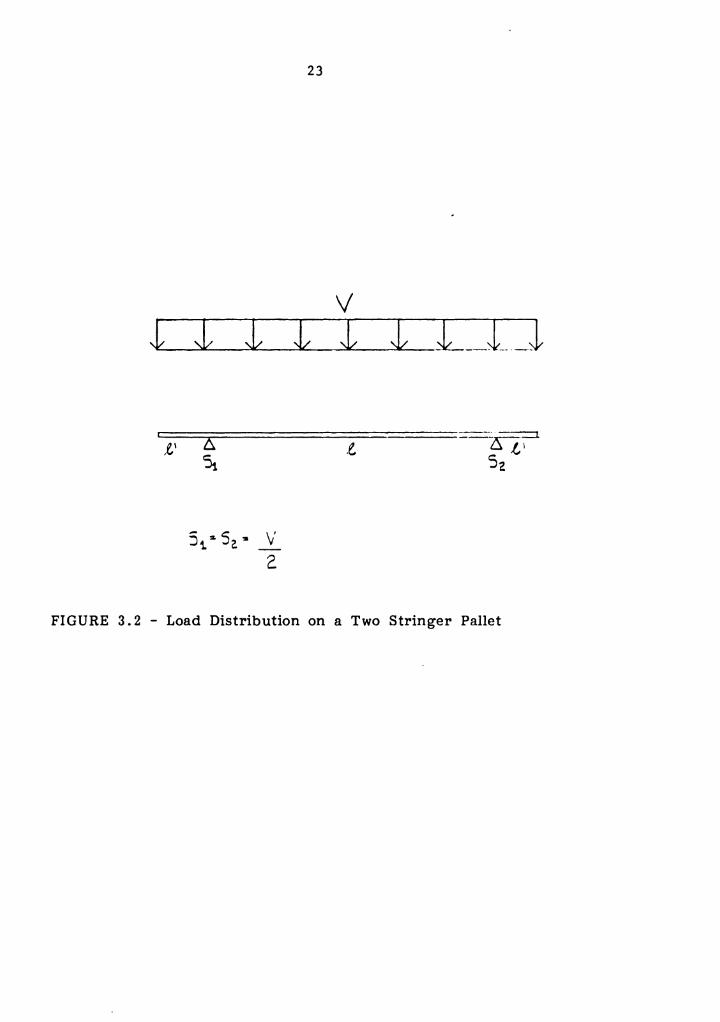
stringers to support V. For example Figure 3.2 shows s1 and
s2 of a two stringer pallet equals 50% of V. For the three
and four stringer pallets ( Figures 3. 3 and 3. 4) equations
are given which are used to compute the reactions. For
example, if a 3 stringer pallet that had 48" deckboards,
Where 11 '= 4" and 11 = 40 11 , d V 1000 lb th S S -292 .. .. an = s.' en 1 = 3-
lbs. and s2=708 lbs.
The slight rounding of the stringer's edges that occurs
during collapse because of the compression perpendicular to
This grain (C.11.) of wood is not recognized in the model.
assumption was made because· the extreme variability of
C~ among species would have made it extremely difficult to
account for in the model. Furthermore, the rounding effect
results in only a small change in the location of Vi that
the overall effect on H is negligible. max
23
V 1 ____ 1 __ r _r _____ r ______ r_1 ___ r. _____ 1
i,' .e.
FIGURE 3. 2 - Load Distribution on a Two Stringer Pallet

24
V
ll
- ( V) ( l/e. \ , 2 .l' + .l J
FIGURE 3. 3 - Load Distribution on a Three Stringer Pallet
25
\/
FIGURE 3.4 - Load Distribution on a Four Stringer Pallet

26
The assumptions presented have dealt with the external
forces that may act on a pallet. An internal characteristic
considered is the nailed or stapled deckboard-stringer
joints which causes resisting moments to collapse as a
horizontal force is applied. These moments are denoted by
m .. where i=l to the number of stringers (NS) and j=l to the 1)
number of deckboards (ND) along each stringer. The value of
each moment is a function of all the material and geometric
parameters as well as the amount of rotation the joints
experience. For example, if there are six upper deckboards
on a pallet, then mil' ... mi 6 resisting moments occur along
each stringer. Summation of these moments yields the total
resisting moments for each stringer. The total moment for MD
the top joints are denoted by Ml 1. = r ml ... j•\ 1]
And the total MO
bottom moment is M21. = r m2 ... js.l 1)
Additionally, define a weighted average of the upper
deckboards' moduli of elasticity as:
where:
MD (}: (b.)(E.)) j•l J J
Et= combined modulus of elasticity of upper deckboards (psi),
b. = width of the jth upper deckboard (in.), J
( 5)

27
E. = modulus of elasticity of jth upper J
deckboard (psi), and
ND= number of upper deckboards.
Similarly, the moment of inertia of the upper deckboards
is calculated as:
where:
3 ND It= (q l: b.)/12
j•I J
It= combined moment of inertia of upper
deckboards (in. 4 ) and
q = upper deckboard thickness (in.).
(6)
A typical pallet deckboard-stringer joint is modeled as
shown in Figure 3.5 where:
x. = horizontal displacement of point A on l.
stringer i (in. ) from initial rest position,
Y. = vertical distance from assumed point of l.
rotation (o) to h. on stringer i (in. ) , 1
v. = vertical load assumed to be transmitted l.
stringer i (lbs.) at point
h. = horizontal disturbing force l.
(lbs. ) ,
di= height of stringer i (in.),
w. = width of stringer i (in.}, l.
A,
on stringer
to
i
¢1.= angular opening of upper deckboard-stringer i l.
joint (radians),

28
h· I.
FIGURE 3. 5 - The Deckboard-Stringer Joint
29
~2.= angular opening of lower deckboard-stringer i 1
joint (radians),
Ml.= sum of the resisting moments from the 1
joints along the top of stringer i (in.-lb./radian), and
M2.= 1
sum of the resisting joints along the (in.-lb./radian).
moments from the top of stringer i
Finally, a very important criterion is the inter-3 relationship between Etit/1 (l=distance between stringers)
of the upper deckboards and the unit load on the pal let.
Each plays a significant role in the amount of bending of
the upper deckboards. For this study two pallet responses
are recognized: Type I where negligible bending occurs in
the top deck and Type II where the upper deckboards
significantly bend under load. The reason bending plays a
role in lateral collapse is that it influences joint
behavior during collapse. When no bending occurs in the
upper-deckboards each joint has the same amount of rotation
for a given top deck translation. Therefore, by using the
M-~ curve all joint mij's can be determined and solving for
Hmax is a linear problem.
On the otherhand, deckboard bending during collapse
causes the joints to open by unequal amounts. As a result,
the moment generated in each joint is different making the
determination of Hmax a complex non-linear problem.

30
l-~ ~ l Model
Type I pallets experience no bending in the upper
deckboards; therefore, the angular rotation, ~li and ~2i,
are equal. This is true for two, three, and four stringer
pallets. It is the purpose of this section to present the
theory used to develop the model which predicts H for the max Type I pallet.
The model is based on stability concepts described by
Gregory (7). Consider the diagram of an individual stringer
as illustrated in Figure 3.5, after some significant
rotation has occurred. Summing moments about point o
yields:
= 0 = h. (Y.) - V. (w.-X. )-Ml.-M2. 1 1 1 1 1 1 1 ( 7)
Rearranging equation (7) gives:
h. = (V.(w.-X.)+Ml.+M2.)/Y. 1 1 1 1 1 1 1
( 8)
Before using equation (8) to calculate Hmax an explanation
of each variable is in order ..

31
In Figure 3.5, Vi is located on the uppermost corner of
the stringer and has a leverarm distance (Z.) with respect 1
to point o:
- x. 1
(9)
As the force hi is applied to the structure its lever-arm
distance, Yi' increases (Figure 3.5). This is true until Yi
= Ci where:
where:
2 + w. 1
(10)
C. = diagonal distance of stringer i cross-section 1
(in. ) .
Since Zi and Ci are known, the lever-arm distance of hi
is:
- z~ 1
(11)
where:
Yi= lever-arm distance of hi (in.).
At this point all external rotational moments acting on a
pallet can be evaluated by multiplying force times lever-arm
distance. A method to calculate the internal resistance to
collapse was required to complete the model.

32
During collapse the resisting moments Ml. and M2. are 1 1
generated by the fasteners used to hold the joints together.
As explained in Chapter 2 the resisting moment of a joint
can be described by the M-; curve (Figure 2.2). For
simplification, the joint rotation is assumed to be
perfectly elasto-plastic with the secant to Zone 1 as the
linear initial portion of the curve. To calculate Ml. and 1
M2., 1
;
where:
And:
where:
must be
a. 1
computed
=
a. 1
angle
a. I 1
in the following
tan -1 (d. /w.) = 1 1
between C. and w. 1
. -1 = sin ( Y. /C. ) 1 1
1
mannar:
(12)
(radians).
(13)
ai' = angle between Ci and the horizontal plane at
point A (radians).
33
The angle through which the bottom joints rotate is then:
where:
~2. = a.' - a. l. l. l.
~2. = angular opening of lower deckboard-ith l.
stringer joint (radians).
(14)
Because of the definition of the Type I response it is
known that ~l.= ~2 .. Thus: l. l.
where:
Similarly:
where:
Ml. l.
moments from the
(15)
= sum of the resisting joints along the (in.-lb.),
top of stringer
Rl.= sum of rotational moduli of top deckboard-1
ith joints (in.-lb./radian).
(16)
M2i = sum of the resisting moments from the
i
joints along the bottom of the stringer i (in. -lb. ) and
R2.= sum of rotational moduli of bottom deck-1
board-ith stringer joints (in.-lb./radian).

34
Equations (15) and (16) are misleading by implying that
as long as ; increases, so does M. The results of actual
joint tests show that M does increase up to a maximum M max Ml. and M2. are computed with: 1,max 1,max
where:
Mli,max
ml .. 13,max
Ml. 1,max
M2. 1,max
M2. 1,max
ND = .I ml .. J.,.. lJ, max (17)
.. D = I m2 .. jal l) 'max (18)
= sum of maximum moments of joints along top or bottom of stringer i (in.-lb.) and
m2. . = maximum moments of 13,max individual joints along top or bottom of stringer i ( in. -lb.).
The Rl . and R2 . used in equation ( 15) and ( 16) are the l l
sums of the rotational moduli along each stringer where:
where:
NP ND Rl. = I rml ..
l jal lJ R21. = I rm2 ..
j:. I l J (19;20)
Rl. R2. = sum of rotational moduli of the l l
rml .. l)
joints along the top or bottom of stringer i (in.-lb./radian) and
rm2ij = rotational moduli of individual deckboard-stringer joint along top or bottom of stringer (in.-lb./radian).

35
Knowing the joint moments as a function of rotation (or
horizontal displacement, X) it is possible to solve equation
(8) for hi. However,. the computed hi is only the amount of
force necessary to cause an amount of displacement in
stringer i. The total horizontal force necessary .to cause
the total amount of displacement is found using:
NS H = l: h.
i.•l 1 (21)
The Hmax a pallet can sustain is determined by incrementing
X until His maximized. Generally, H occurs before X = 2 max inches in actual tests of typical pallets. To help minimize
the error in estimating Hmax the size of the increments of X
should not exceed 0.1 inch.
In summary, the solution to finding the Hmax for a Type I
pallet is as follows:
1. determine the load distributed to each stringer (Vi),
2. determine the constants which describe each joint type (Rij _and Mij ,max>,
3. introduce a small horizontal displacement (X),
4. determine Mli and M2i for each stringer by summing the proper mij's,
5. compute hi for each stringer using equation (8),
6. sum the h. 's (equation 21) to give the total 1
Hat that increment, and

36
7. repeat steps three through six until His maximized (Hmax>·
~-~~.!!Model
Type I I pallets experience upper deckboard deflection
during collapse, and therefore, lf)l. "f lf,2 .• 1 1
Figure 3.6 shows
that bending of the top deckboard cause the stringers to
experience different amounts of horizontal translations due
to geometric non-linearity.
translate differently, lflli 1 lf,2i.
Since each stringer may
As a result of this non-linearity, the moments generated
in the joints during collapse are not equal as they are in
the Type I pallet; therefore, the moments in equation (8)
must be modified. Another possibility is that the
deckboards will behave as combined bending and axial force
members and may buckle. For pallets with very low top deck
flexural stiffness, Etit, this mechanism may predominate
over a reduced joint moment contribution. However the end
fixity conditions are typically more rigid than pins and are
not easily determined. Since a beam column analysis
approach would add greatly to the complexity of the solution
37
V
l l I l
FIGURE 3.6 - The Effect Unit Load has on a Collapsing, Type II Pallet
l

38
with no readilly identifiable significant benefit, it was
not persued.
pallets and
The experimental results of a wide variety of
sections failed to demonstrate a significant
combined bending axial force influence on collapse.
However, this does not mean that this mode could not be
prevail in some circumstances.
~-~·± Three and Four Stringer Designs
The purpose of this section is to describe how the
modification factors for the joint moments in three and four
stringer pallets were developed for the Type II model.
Physically testing the influence of unit loads, stringer
dimensions, deckboard properties, and nail properties on
lateral collapse in this mode would be immensely time
consuming and expensive. This testing was reduced by
utilizing a computer program, SPACEPAL (17), which is
capable of analyzing structures using the stiffness method
of matrix structural analyses. SPACEPAL was used to model a
wide variety of pallet designs subjected to various
horizontal and unit loads. The resulting theoretical top
and bottom moments along each stringer (Mlsi and M2si) were
evaluated. These analyses are described in Chapter 4.

39
If Mlsi and M2si from SPACEPAL tests which accounts for
Type II behavior and Ml. and M2. from the Type I model are J. J.
known, then a modification factor can be computed for each
joint of all test pallets using:
where:
Ml. J.
= Mls. K2. (22;23)
K2. J.
J. J.
= modification factors for top and bottom joint moments,
M2s. = upper and lower deckboard-stringer J.
M2. J.
moments resulting from SPACEPAL analysis on pallets (in.-lb./radian) and
= moments from equations ( 15 ) and ( 16 ) .
Kl. and K2. values were computed for a wide variety of J. J.
different types of pallets. Multiple regression
relationships were then developed to estimate Kli and K2. J.
utilizing unit loads, stringer dimensions, deckboard
dimensions, deckboard MOE's, and fastener properties as the
variables. These estimated K-factors are multiplied by the
moments determined in a Type I analysis (Ml. or M2.) and the J. J.
product is an estimate of the moments in a Type II pallet.
One constraint imposed on the K-factors was that they fall

40
in a range O< K-factor <1. This assumes that the moment is
not less than zero or greater than M max T~erefore, if K>l,
then K=l or if K<O, then K=O.
Equation (8) for h. now becomes: 1
V1. ( w . - X . ) + Kl . ( Ml . ) + K2 . ( M2 . ) 1 1 1 1 1 1
l-l-~ Two Stringer Design
Y. 1
(24)
The relative simplicity of the two stringer pallet
~llowed the development of a closed form solution to compute
Kli and K2i. Utilizing the principle of superposition the
actual structure (Figure 3.7) was modeled as both a simply
supported beam with a uniform load and a simply supported
beam with end moments.
In Figure 3.7, .1 1 and .1 2 are computed with:
,1 1 = (-u) (1)
24(Et) ( It)
,1 2 = (u) (1) )
(25;26)

41
V c----------r---- - i ·--'iiL _ ---
_i_·----·--J
\?A.RTIAL \/ ~------1--··-.. --~]----___ -__ 1 ______ ___,.J
H
+ PAKTIAL V
CD
H ---t,,,' ;<:;.
I I
·' I I
~/ I -- ..
FIGURE 3.7 - The Effect Unit Load has on a Collapsing, Two-Stringer, Type II Pallet
where:
42
t1 1 ; t1 2 = angle between horizontal plane and
upper deckboard at the ith support point due to distributed load between supports (clockwise negative) (radians) and
u = distributed load (lb./in.).
Looking at Figure 3.7 it is apparent that t1 1 and tl 2 are
equal in magnitude but opposite in direction for the assumed
symetrical loads.
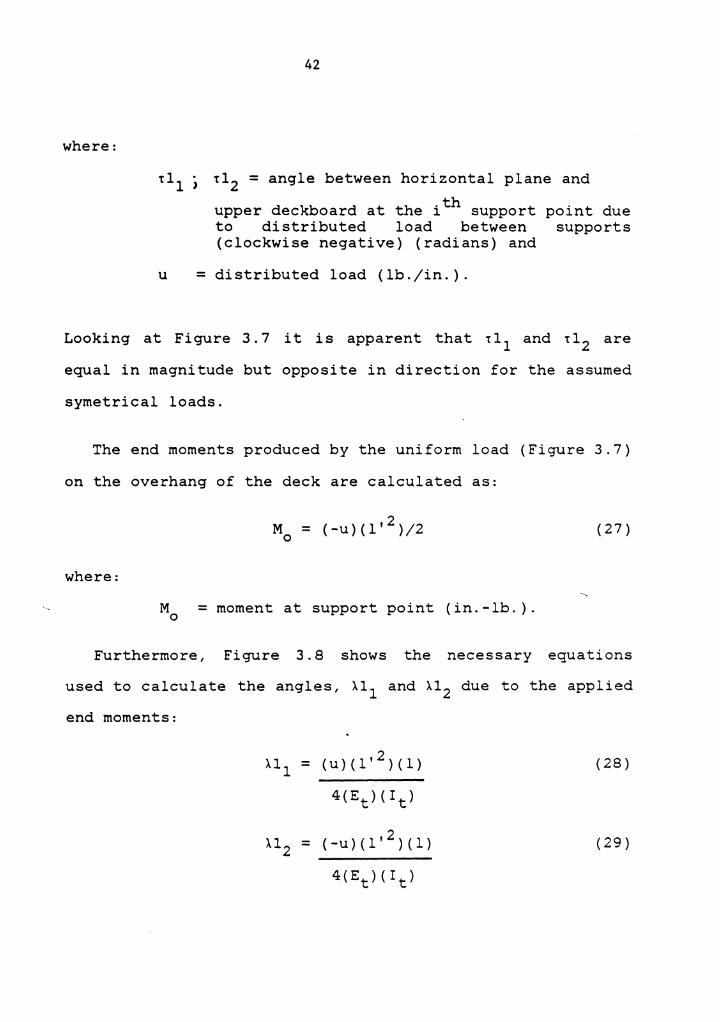
The end moments produced by the uniform load (Figure 3.7)
on the overhang of the deck are calculated as:
where:
M = (-u)(l 12 )/2 0
M = moment at support point (in.-lb. ). 0
(27)
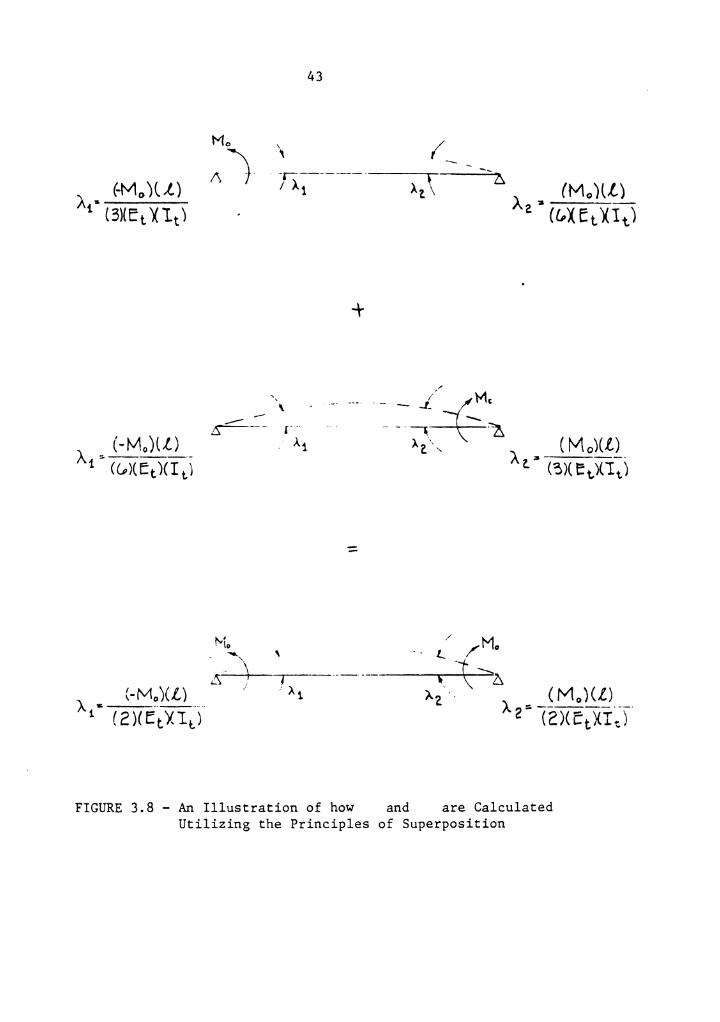
Furthermore, Figure 3.8 shows the necessary equations
used to calculate the angles, All and Al2 due to the applied
end moments:
All = (u)(l' 2 )(1) (28)
4(Et)(It)
A12 = (-u)(l' 2 )(1) (29)
4(Et)(It)
C-l'-1 o) Cl) " 1• { 3)( Et)( lt)
\
'
43
FIGURE 3.8 - An Illustration of how and are Calculated Utilizing the Principles of Superposition

where:
44
All j A12 = angle between horizontal plane and top deckboard due to end moment (radians).
Since tli and Ali can be computed, then the total angular
rotation due to loading (Figure 3.7) can be computed from:
E;l. = tl. + Al. (30) l. l. l.
In the Type I model <1>11 and <1>12 are assumed equal. With
this in mind:
where:
fH = (/)11 - E;ll = <t>l - (u)(l) ((1 2/6) -1' ) 1 1 (31)
4(Et)(It)
IH2 = <t>l -2 1;12 = <t>l2 + (u)(l) (( 12 ;6) -1 I ) (32)
4(E)(I)
Bli = total opening of the upper deckboard-ith stringer joint (Figure 11) for a Type II, 2 stringer pallet (radians).
Equations (30) and (31) or (32) supply enough information
to compute:
= tl. + Bl. l. l.
(33)
where:
45
62. total opening of the lower deckboard-l.
ith stringer joint for a Type II, 2 stringer
pallet.
Since all angles of the 2 stringer collapse specimen
(Figure 3.7) can be computed, a K-factor can be calculated
from:
Kl. = 61. l. l.
~1. l.
(34;35) ,
where the K-factor is again based on the angular rotation of
a Type I pallet. These K-factors are used in equation (24)
to compute h .. l.

CHAPTER 4
Experimental Verification
4.1 Introduction
Experimental verification of the ability of the model to
predict Hmax was necessary to justify its use in design.
Without strong support from experimental data the model will
not be an accepted tool.
taken to verify the model.
This Chapter describes each step
4.2 Development of a Lateral Load Test Machine
To physically measure the Hmax of a full-size pallet a
test machine was designed and constructed. The machine was
capable of testing pallet sections with dimensions as small
as 8" x 30" and full-size pallets with dimensions as large
as 72 11 x 72". Furthermore, the machine accomodates
realistic unit loads and is capable of inducing a uniformly
distributed horizontal load on the leading stringer of a
test specimen. For simplification and consistency with the
limitation of the theoretical model, the horizontal load was
quasi-static in nature, rather than dynamic.
46

47
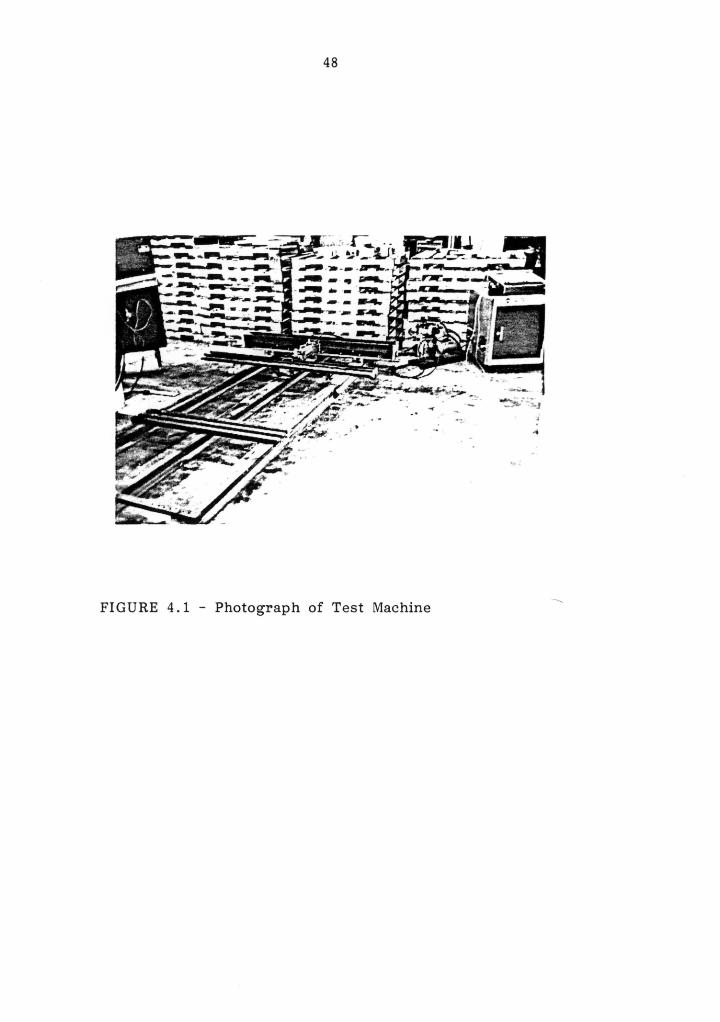
Figure 4 .1 is a photograph of the test machine. The
backbone of this machine (Figure 4.2) is made of three 4 11
wideflange I-beams each 12' long. These lay on a concrete
floor and are interconnected by one piece of 2.5 11 angle iron
at each end. Holes are drilled every 4 11 throughout the
length of the angle irons. The center I-beam always remains
stationary unlike the two outer beams which are connected by
bolts to the angle iron. This enables them to be moved to
accomodate pallets whose stringers range from 8 11 to 72 11 in
length.
Fastened perpendicular to the base I-beams is a 6 11 wide-
flange I-beam. This beam acts as a buttress for the load
head. It is attached to the base I-beams by bolts which
allow spacer blocks to be placed beneath the buttress I-
beam, thereby, allowing vertical adjustment.
A 10,000 lb. hydralic cylinder is attached by a swivel
connection to the buttress I-beam. The controls and motor
for the cylinder are stationed beside the test machine. A
4 11 x 2.75 11 , I-beam which is 72 11 long, is connected to the
hydralic piston. Teflon coated slider blocks are mounted
underneath the load head which rests on the two outboard
base I-beams. Necessary vertical adjustments to the load
48
FIGURE 4 .1 - Photograph of Test Machine

l -. .
I
' I
-~
I I : I
1-u
~ -
----
I -- I
I
-- - ---·--·· - ------·--·-- - ---- 11'-0U -----·- 1
L_J-111---J]c c-=-_HJ--~__:"'2t± c{] a{) a{) 4J ==:J
FIGURE 4.2 - Plan and Profile Views of Test Machine
l
4· -c.,':
- - '
.I:-
'°

50
head are made by placing wood spacers beneath the slider
blocks.
Finally, to prevent the test specimen from sliding when
the horizontal load is applied, four restraining bars are
attached to the machine. These bars are mounted
perpendicular to the base I-beams and can be adjusted to any
position parallel to the base. When testing skids, a
restraining bar may be placed behind each stringer if
desired. For testing double-faced pallets, a bar may be
placed behind the last stringer to prevent specimen sliding.
A 10,000 lb. BLH type U3G2-S load cell was mounted in
series between the __ hydralic cylinder and the load head. A
Vishay amplifier sends an electronic signal from the load
cell to a Hewlett Packard model 7044A X-Y recorder.
The Y-coordinate of the recorder plots horizontal
translation of the upper deckboards of a test specimen.
This is accomplished with two LVDT's which are mounted along
any channel of the base I-beams. Two T-shaped brackets are
attached to the upper deckboards of the test specimen and
bear against the plunger of the LVDT's. For complete
machine drawings, wiring, and operation see Appendix A.
With the test machine complete, actual testing was ready to
commense.

51
4.3 Model Verification:~ I
The objective of this section is to describe the
experimental design and the analysis techniques used to
determine the validity of the Type I model.
First, a computer program entitled "LCAN" (an acronym for
Lateral Collapse ANalysis) was developed to caculate H max using the Type I model. LCAN is written in the Fortran IV
language, and is presented in Appendix B. The input
parameters required to run this program are the geometric
properties of the deckboards and stringers, the unit load
applied to the structure, and the rotation modulus and
maximum moment of each joint in the pallet. Once this data
is entered and the program run, the output echoes the input
data, the moments generated along each stringer, a predicted
H , and a H /V ratio. max max
To determine the accuracy of LCAN five full-size pallets,
eight pallet sections, and eighteen joint rotation samples
were built. All stringers and deckboards were oak (Quercus
spp.) and had moisture contents above 30%, The fasteners
used were 2-1/4 inch long, helically threaded, low-carbon
steel nails. They contained 4 flutes at 68 degrees with an
52
average thread crest diameter of 0.126 inches. The average
MIBANT (25) angle of the nail was 46 degrees. All nails
were meticulously placed in the patterns illustrated in
Appendix Cl.
The pallets built were expected to behave as the Type I
model. Refer to Appendix C2 for construction specifications
and for the unit load applied to test pallets. Testing was
conducted on the lateral load machine with a cross-head rate
of approximately 4 inches per minute. Figure 4.3 is a
photograph of a test in progress. During each test a
horizontal force (H} versus upper deckboard translation (X}
curve was plotted (Figure 4.4). H max was then determined
from each curve for the test specimens (Table 4.1).
After testing the pallets, joint rotation samples were
fabricated as described and to the dimensions specified in
Table Dl. 1 of the Appendix.
provide an estimate of M max
These samples were bui 1 t to
and R was for use in LCAN. The
joints were tested on a Tinius Olsen test machine with a
cross-head rate of O. 015 inches per minute. During each
test, a load-deflection curve was recorded and from it the
M and rotation modulus were determined (Appendix Dl.l). max After each test, the MC and G were determined for the

53
FIGURE 4.3 - Photograph of Collapse Test

H CJ R I z CJ N T A L F I) R C E
54
2200
2000
1800
1600
1400
1200
1000
800
600
400 ~
20:J I. I I' I I I.; I I I I I / I • I I [ i I I I I; I I I I I
0.0 0.2 0.4 0.6 0.8 1. 0 1. 2
HCJRIZCJNTAL TRANSLATION
FIGURE 4.4 - HORIZONTAL FORCE (LBS.) VS. HORIZONTAL
TRANSLATION (IN.) (;LJRVE FROM COLLA.PS;: EST
I I
1. 4
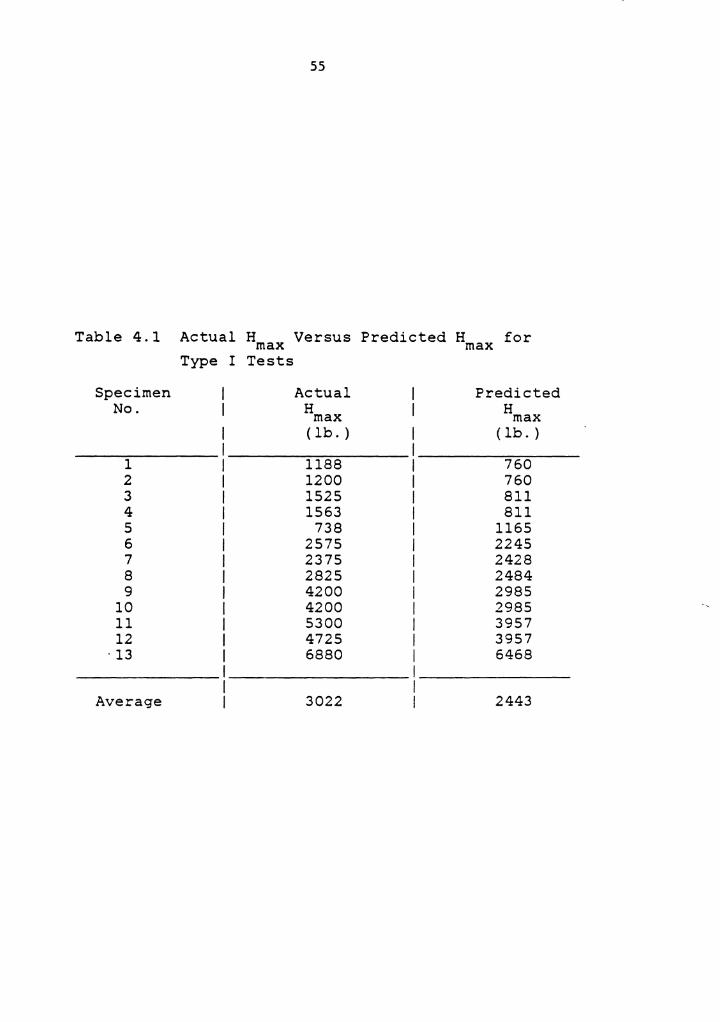
55
Table 4.1 Actual H Versus Predicted H for max max Type I Tests
Specimen Actual Predicted No. H H max max
(lb. ) (lb.)
1 1188 760 2 1200 760 3 1525 811 4 1563 811 5 738 1165 6 2575 2245 7 2375 2428 8 2825 2484 9 4200 2985
10 4200 2985 11 5300 3957 12 4725 3957
· 13 6880 6468
Average 3022 2443
56
deckboard and stringer components according to ASTM D-143
standards (1).
Once the testing was complete, each design was run
through LCAN to predict H . Table 4.1 shows those values max of H max It is apparent from the illustration that the
model tends to under estimate H by an average of 579 lbs. max or 19%. This error could be from an under estimate of Mmax
which can change because of the variability of wood's
mechanical properties and/or the fastener characteristics.
A hypothesis was developed to explain this under-
prediction. This was that the slower rate of loading, 0.015
inches per minute in the joint rotation tests produced lower
values for Mmax and R than were realistic for lateral
collapse testing at 4 inches per minute. With ...__these lower
values the model would indeed under-predict H . max
A study was conducted to determine how the rate of
loading influenced Mmax and R. Thirty matched joint
rotation samples were built according to the specifications
in Appendix C3 with nailing and stapling patterns as
specified in Appendix Cl. Each type joint was tested at 4
inches per minute and O. 015 inches per minute with four
repetitions each. A load-deflection curve was plotted

57
during each test and from these M and R were determined. max With this data a ratio of the M generated at 4 inches per max minute to 0:015 inches per minute was computed (Table 4.2).
The same procedure was performed for R (Table 4.3). Tables
4.2 and 4.3 show the average Mmax and R values of the joints
tested in the study. Table Dl.3 of the Appendix shows all
of the test data. The results show a significant increase
of Mmax and R with the rate of loading.
With this new information on hand, all values from the
initial joint rotation tests were increased by multiplying
them by the appropriate ratio from Tables 4.2 and 4.3.
Next, the Type I designs were re-analyzed using LCAN. The
results show that the Type I model now over-predicts H by max an average of 188 lbs. or a 6% error (Table 4.4). This is
obviously better than the original under-prediction.
It was concluded that the Type I model was an acceptable
foundation for further investigation of lateral collapse;
therefore, the next step in predicting LCP was to develop K-
factors that would modify the resisting moments in a Type II
pallet.

58
Table 4.2 Average Mmax Values for Modification Factor Analysis
M max I
Fastener Loading Rates 1 I Ratio I
Type # 0.015 4.0 I 0.015/4 I
nail 4 908 1100 I 1. 211 I
nail 3 750 1038 I 1. 384 I
staple 3 582 670 I 1.151 I
staple 1 183 232 I 1. 270 I
1 Rates are inches/minute
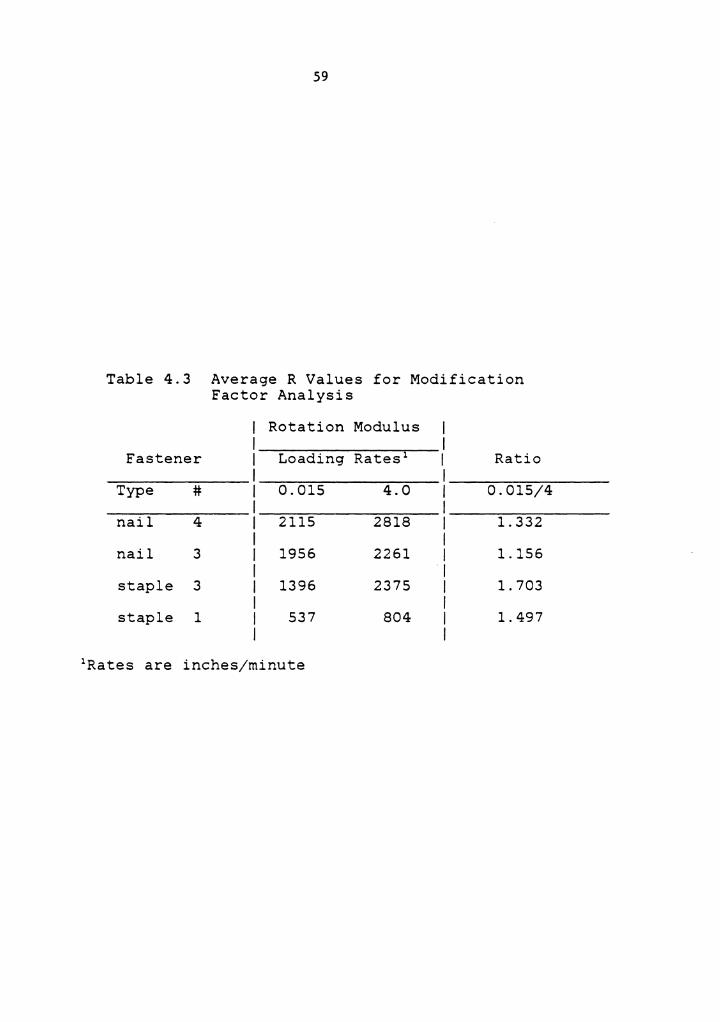
59
Table 4.3 Average R Values for Modification Factor Analysis
Rotation Modulus
Fastener Loading Rates 1 Ratio
Type # 0.015 4.0 0.015/4
nail 4 2115 2818 1.332
nail 3 1956 2261 1.156
staple 3 1396 2375 1.703
staple 1 537 804 1. 497
1 Rates are inches/minute

60
Table 4.4 Actual H Versus Predicted H after max max Re-analysis of Type I Tests
Specimen Actual Predicted No. H H max max
(lb. ) (lb. )
1 1188 1482 2 1200 1482 3 1525 1579 4 1563 1579 5 738 2026 6 2575 2778 7 2375 2825 8 2825 3315 9 4200 3424
10 4200 3424 11 5300 4942 12 4725 4942 13 6880 7931
Average 3022 3210

61
4.4 Model Verification:~ II
This section presents the methods and materials used to
develop and verify the moment modification factor for Type
I I pallets. Because of the complexity of the combined
bending-axial force actions in Type II pallets, some
simplifications were necessary. Consider the stringer
pallet shown in Figure 3.6. If there is significant flexure
in the top deckboards then many ¢ .. l. J values will be
dissimilar. The magnitude of an individual ¢. . will be a l. J
function of the actions of the vertical force causing deck
flexure as well as that of the horizontal force causing
collapse. Compared to a Type I pallet some of the Type II
joints will have reached M while others will still max undergo elastic rotation. Hence the difference in rotation
compared to the Type I pallet will lead to an erroneous
prediction of H using the Type I analog model procedure. max
To develop correction factors for three and four stringer
Type I I pallets the structural analysis program SPACEPAL
(17) was used. This program calculates the moments at each
joint for a given horizontal load. Initially, one SPACEPAL
model was developed for three stringer pallets and one for
62
four stringer pallets. These analog models are shown in
Appendix B2. These models are inherently unstable and some
initial horizontal force, H , is needed to insure initial . eq stability. Additional horizontal force will cause clockwise
rotation simulating lateral collapse.
A wide range of pallet styles, from expendables to
warehouse-type designs, were modeled with SPACEPAL to
determine the influence of various parameters on joint
moments. The three study variables were a) Etit/1 3 of the
top deckboards, b) stringer aspect ratio (d./w. ), and c) the l. l.
joint characteristics - Mmax and R. Appendix Tables B3 .1
and B3.2 describe all 27 designs of the three and 27 designs
of the four stringer, double-faced pallets, respectively.
Additionally, 18 single-faced three and four stringer pallet
designs specified in Tables B3.3 and B3.4 of the Appendix
were also analyzed for a total of 72 computer models. Each
model was submitted to SPACEPAL and analyzed with 500, 2250,
and 5000 lb. unit vertical loads. All 72 designs were
initially run through LCAN to determine the Type I Hmax and
M max The total horizontal load (Htot) applied to each
model was the Type I H from LCAN plus Heq max

63
The resulting theoretical moments developed at each joint
were recorded and individual K .. were computed using 1J equations (22) and (23). Multiple regression equations
between Kij and unit load, deck MOE, deck moment of inertia,
stringer width and height, Ml. and M2. were derived for the 1 1
three stringer and four stringer pallets. The result was
one different regression equation for each joint in the
structure (Appendix D2). For example, twelve equations were
developed for a four stringer double-faced pallet
representing one for each joint. R2 values for individual
joint regressions were consistantly high.
Use of the twelve regression equations provides the best
possible estimate of the needed modifications for Type I I
behavior. However, this approach is far too cumbersome for
general design use. A second set of regression equations
was developed by combining all K-factors from pallets with
the same number of stringers. Therefore, one regression
equation was used for three stringer and one equation for
four stringer pallets. The three and four stringer
regressions are presented in equations (36) and (37),
respectively:
K3 = 0.8956 + 0.0003(V) + 0.0013(Et)(It)/i 3 (36)
- l.6004(Ar) + O.OOOl(Mrnax)
where:
64
K4 = 0.1306 - O.OOOOl(V) + 0.0494(Et)(It)/t 3 (37)
- 0.0569(Ar) - 0.00002(Mmax)
Kk = K-factor for three and four stringer pallets and
Ar= wi/di of stringers (in./in.).
The R-square value for equations (36) and (37) was 0.358 and
0.579, respectively.
To evaluate this simplified approach, equations (36) and
(37) were implemented into LCAN and the 72 pallet designs
were re-analyzed. Although the regression equations
developed for each individual joint are likely to be more
accurate than the second set, the number and complexity of
the equations must be reduced without a sign~ficant loss of
accuracy. The output of LCAN produced two H /V ratios -max Hlmax/V and H2max/V - for each design. Hl /V was computed max using a unique K-factor equation for each joint and H2 /V max was computed with only one K-factor equation. Next, the two
sets of ratios were ranked "from lowest to highest. As
stated previously, the Hl /V order of rank was considered max to be the most accurate.
to the Hl /V rank. max
The H2 /V rank was then compared max
65
The purpose of the comparison was to note where each
design fell in the Hlmax/V rank versus where it fell in the
H2max/V 'rank. For example, if in the Hlmax/V rank a
particular design was ranked 29th and the same design was
ranked 34th in the H2max/V rank, the difference would be -5.
The differences were determined for each of the 72 pallet
designs. Then, the mean and standard deviation was
determined for the differences. If a low standard deviation
was found then one regression equation, (36) or (37), would
be used in the Type I I model. This is because the one
equatio~ would do as good a job modifying the moments as
would the individual equations for each joint.
The results of the three stringer case showed a mean
difference of zero with a standard deviation of 5.3. Figure
4. 5 illustrates that the change in rank was random and
showed no bi as towards any one group of H2 /V ratios. max Therefore, the assessment of a pallet's lateral collapse
potential based on its Hmax/V ratio would not be
significantly altered using equation (36).
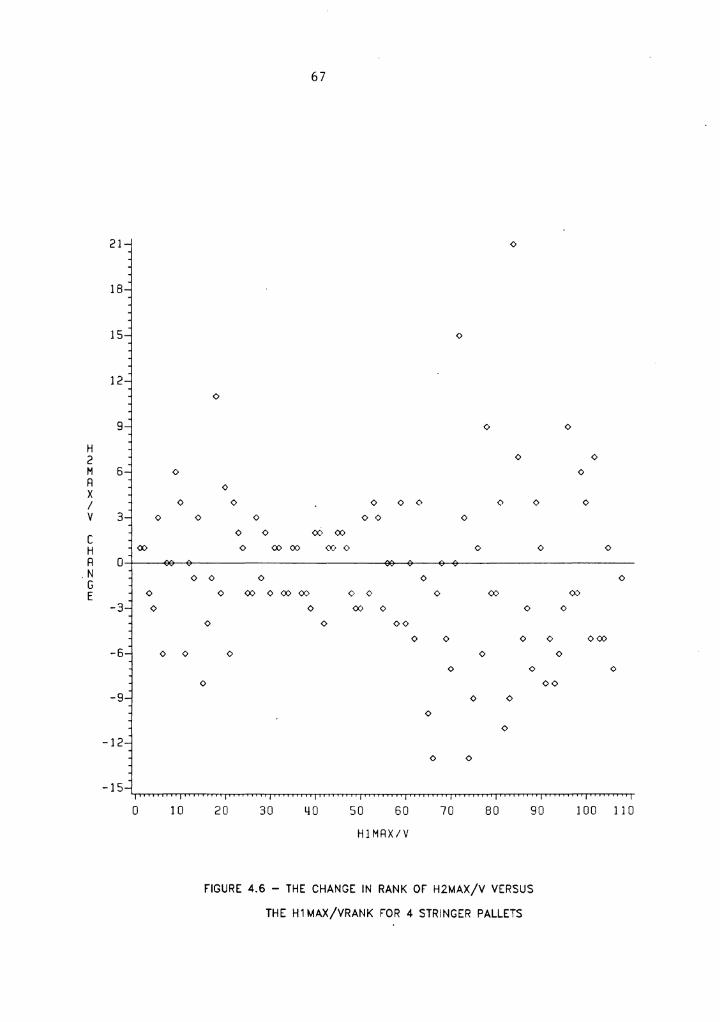
In the four stringer case the mean difference was again
zero with a standard deviation of 6. 1.
random and unbiased changes in ranks.
Figure 4. 6 shows
Based on these

66
15.0
<>
<> 12.5
<>
<> <> <> <>
10.0 <>
<> <> <> <> <> <> 7.S
<> <> <>
<> <> H 2 s.o <> M A <> <> X I <> <> 0 <> V 2.S
- 0 <> <> C H <» <> <> <X> A N 0.0 G E <X> <» 0 <> 0
<> <» <» <> ® <XI> <> <> -2.5
<» <> <> <» <> <> <> <> <> <> <> <>
<> <> <> 0 <>
-5.0 <» <» <>
<> <><> <> <>
<> 0 <> -7.5
<>
<><> <>
-10. 0
0 10 20 30 40 50 60 70 80 90 100 1 1 0
HlMRX/V
FIGURE 4.5 - THE CHANGE IN RANK OF H2MAX/V VE~SiJS
THE H1 MAX/V RANK FOR 3 STRINGE~ 0 ALLFS
21
18
15
12
9
H 2 M 6 <> A X I <> V 3 <>
C H ()0
A 0 .N G E 0
-3 0
-6 <> 0
-9
-12
-15
0 10
67
<>
<>
0
0 <>
<> <> <>
<> <> 0 <> 0 0 <> <>
0 <> <> <> 0
0 0 00 <X> 0 ()0 00 00 0 <> <>
0 <> 0 <> <> 0 <X> 0 ()0 00 0 <> 0 00 00
<> <X> <> <> 0
<> <> O<> <> 0 <> <> 0()0
0 0 0
0 <> 0
0 00
<> 0
<> 0
<> 0
20 30 40 50 60 70 80 90 100 110
HlMRX/V
FIGURE 4.6 - THE CHANGE IN RANK or H2MAX/V VERSUS
THE H1 MAX/VRANK FOR 4 STRINGER PALLETS

68
analyses, it was concluded that equations (36) and (37)
would provide acceptable K-factor predictions.
4.5 Experimental Verification of LCAN
A series of 18 different pallet designs were selected for
an experimental verification of the lateral collapse
analysis procedure. These designs were selected to
represent a range of expected H /V ratios and different max geometries. Six geometries of each two, three and four
stringer designs were chosen.
The pallet shook used to build the test specimens were of
aspen (Populus), oak (Quercus), and yellow poplar
(Liriodendron tulipifer). Each had a moisture content above
8%. The oak and poplar were used for stringer material and
the oak and aspen for deckboards. The pieces were
manufactured in final dimension and stored.
The fasteners used were the same helically threaded nail
previously described in Chapter 4 plus a 15 gauge, 2-1/4 x
0.074 x 0.067 inches, uncoated staple. The MIBANT angle of
the staple was 132 degrees as predicted by Padla (20).

69
To estimate the value of M and R of stapled joints, max six rotation samples with three replications, were built as
specified in Appendix C2 and Dl.2. Testing was conducted on
the Tinius Olsen test machine with a cross-head rate of
0.015 inches per minute. A load-deflection curve was
plotted during each test and from these, M and R were max determined (Appendix Dl.2). After testing, MC and G of the
deckboard and stringer were determined according to ASTM
D-143 standards. No nail joint tests were conducted since
the pallet shook ( oak) used to build these specimens came
from the same stack of shook that was used to build the Type
I test specimens. It was assumed that the joint
characteristics were similar.
The dimensions of the deckboard material used were -~
measured to the nearest 0.001 inch. Each board received an
identification number, and its E ( Appendix C4) was
determined by the dead-weight deflection method (21).
Knowing the deckboard dimensions, E-values, and predicted
joint characteristics, LCAN was used to analyze the eighteen
test geometries. These results showed that the actual test
pallets had theoretical Hmax/V ratio's ranging from O. 3 to
2.5.
70
The eighteen pallets were built according to the
specifications in Appendix CS with nailing and stapling
patterns as specfied in Appendix Cl. These pallets were
tested on the lateral test machine with an approximate
cross-head rate of 4 inches per minute. During each test a
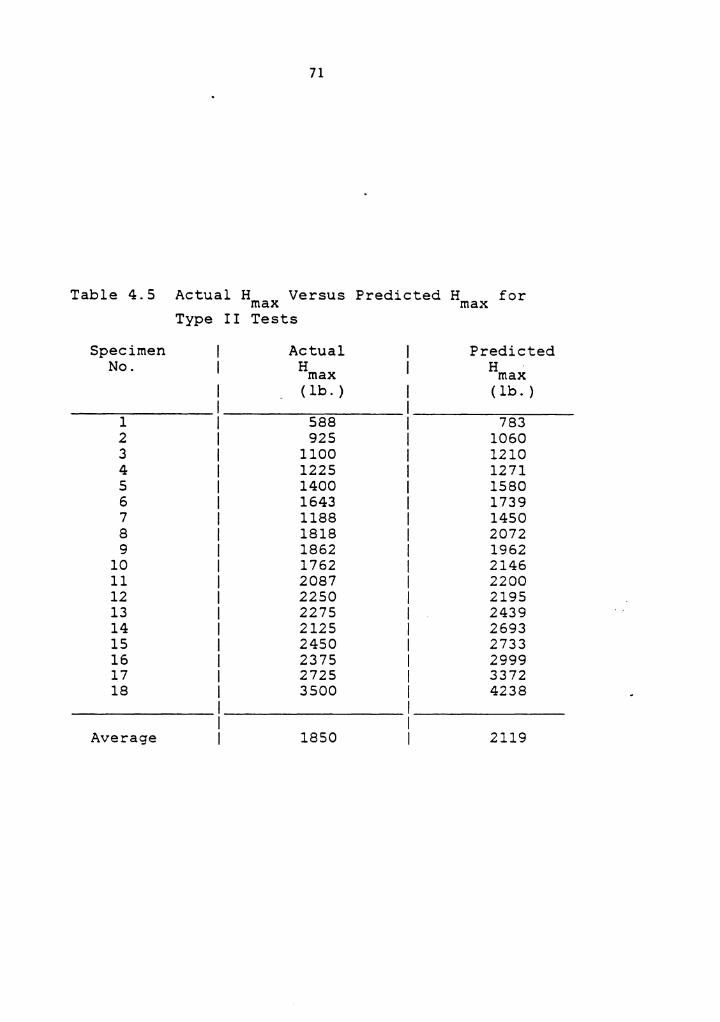
H versus X curve was generated. From these curves, H was max determined (Table 4.5).
After modifing Rand M for rate of loading, all of the max Type II pallets were analyzed with LCAN. The results
presented in Table 4.5 shows that the average difference in
H was a 269 lb. over-estimate or a 14. 5% error. max There
was no evidence from the analysis that the model was less
accurate at any one particular Hmax/V ratio compared to
another. Material variability, accuracy in load placement
during test and the use of simplified equations ( 36) and
(37) to generate the K-factors all contributed to the error.
However, for the purpose of this study this error is quite
resonable and it is concluded that the model provides an
acceptable means of assessing.the lateral collapse potential
of a pallet.
To determine the influence of the K-factors on the
computation of H max the pallets in Table 4.5 were re-
71
Table 4.5 Actual H Versus Predicted H for max max Type II Tests
Specimen Actual Predicted No. H H max max
(lb. ) (lb. )
1 588 783 2 925 1060 3 1100 1210 4 1225 1271 5 1400 1580 6 1643 1739 7 1188 1450 8 1818 2072 9 1862 1962
10 1762 2146 11 2087 2200 12 2250 2195 13 2275 2439 14 2125 2693 15 2450 2733 16 2375 2999 17 2725 3372 18 3500 4238
Average 1850 2119

72
analyzed without using the K-factors. The results show an
average 678 lb. over-estimate of the actual H or a 37% max error. From this analysis it was concluded that the K-
factors significantly improve the prediction of H and, max therefore, deserve a place in the model.
CHAPTER 5
Design Procedures and Calibration
5.1 Introduction
The global objective of this investigation was to develop
a design methodology that would evaluate the LCP of pallets.
At this point in the investigation the model would predict
H /V ratio. max For design purposes a "yardstick" must be
developed to determine acceptable and unacceptable ranges of
5.2 Field Survey and LCP Categories
For this purpose, it was necessary to locate pallets that
had experienced lateral collapse. The designs collected
form the basis of a definition of the transition points
between LCP categories of acceptable and unacceptable.
Forty manufacturers across the United States were surveyed.
While fourteen of those surveyed had some type of experience
with collapsing pallets, only two well documented designs
73
74
were found. Their design specifications and unit loads at
the time of collapse are specified in Appendix C6. Each of
the designs had three stringers with very low aspect ratios
and were fastened with staples. Their H /V ratios were max determined to be 0.47 and 0.50 by LCAN. AH /V ratio of max 0. 50 indicates that these designs could only withstand a
horizontal load no greater than one half the unit load.
Adding a safety factor of 0.10 to the Hmax/V ratio of 0.50
equals 0.60 which was defined to be the point between high
and medium LCP risk categories.
Since has been impossible to obtain field data on those
pallets that are in the medium and low risk categories, 1.0
was arbitrarily selected to be the transition point between
these categories. A pallet with this H /V ratio could max only withstand a maximum horizontal load equal to its unit
load. In all probability, pallets in the field are going to
experience a horizontal load of this magnitude. Due to this
likelihood, it was felt that those pallets that have a 0.60
< H /V < 1. 00 should be classified in the medium risk max collapse category. The two LCP transition points were
believed to be the best choices based on the available field
data and collapse theory.
75
5.3 Implementation into PDS- the Pallet Design System
After verification of the design method, a condensed
version of LCAN was incorporated as a subroutine in the
NWPCA's PDS computer program.
Because of the limitations set on the data input, the PDS
program must calculate M using equation (38): max
where:
Mmax = (wi/2)(Separation factor)
Mmax = maximum moment a joint can sustain (in. - lb. ) and
(38)
Separation factor= joint withdrawal resistance (lbs.) which is the lesser value of equations (2),(3) or ( 4) .
To evaluate the accuracy of equation ( 38) a predicted
Mmax was calculated for each joint rotation sample tested in
this experiment (Appendix Dl). A comparison between the
Mmax calculated with equation (38) versus the actual Mmax is
shown in Appendix Dl. The tables show an under-estimate of
M averaging 63 in.-lbs. Note that in Table Dl.3 some of max the M predicted values are missing. max This is because
these are the joints that were tested at the faster rate of

76
loading which equation (38) will not predict. With the
limited data from this investigation this method of
predicting M was considered the best available for the max PDS program.
5.4 Documented Lateral Collapse Failures
Since PDS has been in use, three pallet designs that have-
failed in lateral collapse have been documented. Their
specifications are in Appendix Table C6 as pallets #3, #4
and #5.
Designs #3 and #4 are three stringer, single-faced
pallets fastened with very low quality, helically threaded
nails. During their service lives, each design was expected
to sustain a maximum unit load of 2500 lbs. When the
designs are run through PDS their H /V ratios equal 0.90 max and 0.87, respectively. These ratios fall within the medium
collapse potential category which should indicate to a
pallet designer that there is a chance of lateral collapse
occuring.

77
Pallet #5 is a shipping pallet whose H /V = max 0.62
indicates a high to medium risk design. Utilizing the
lateral collapse model a pallet designer might expect this
design to collapse. To decrease the probability of failure
this pallet's geometry, material properties, and/or its
fastener characteristics should be changed.
5.5 Variable Sensitivity
After using PDS, a pallet designer should begin to sense
that there are four major variables that influence a
pallet's LCP. Each individual pallet designer must consider
which of the four variables are the most economically
feasible to change in his situation.
Figure 5 .1 illustrates the effects of aspect ratio on
Hmax/V. As this ratio increases, the pallet becomes more
resistant to lateral collapse. One explanation of this
change is that as the stringe~ height is reduced, the lever-
arm distance (Yi) of hi is decreased, and, therefore, H max increases. Similarly, as the lever-arm distance (Z.) of V.
J. J.
is increased by increasing the stringer width, the resisting
moment is increased. Thus, H increases as well. max Also,
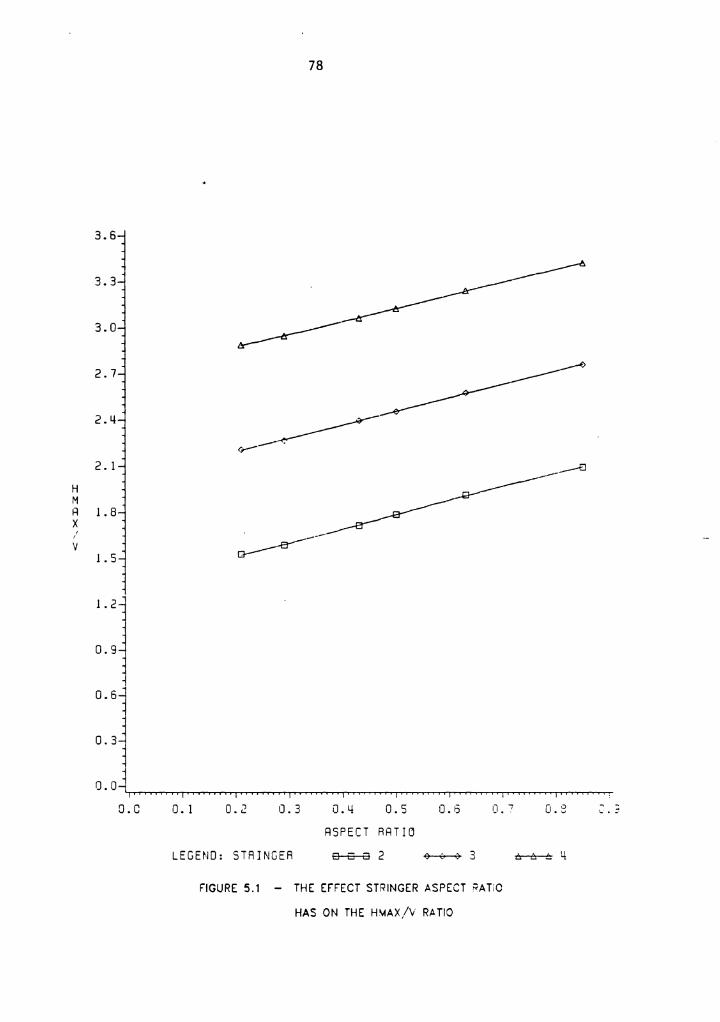
3.6
3.3
3.0
2. 7
2.4
2. 1
H M A 1. 8 X , V
1. 5
l. 2
0.9
0.6
0.3
0.0
o.c
78
0. 1 0.2 I]. 3
LEGEND: STRINGER
0.4 0.5 ASPECT RAT !Cl
e--e--e 2
I]. 6 IJ • ..,
FIGURE 5.1 - THE EFFECT STRINGER ASPECT i.AT,C
HAS ON THE H"1AX/V RA.TIO
D. 2 ·-. =

79
as the number of stringers increases, the LCP decreases.
Using this information, a d~signer can increase the Hmax/V
ratio of a pallet by increasing its stringer aspect ratio.
This finding was expected according to Gregory's (7)
stability theory.
Figure 5. 2 illustrates the effect of unit load on a
pallet's LCP. As the load is increased, the potential for
lateral collapse is_ increased. More specifically, the upper
deckboards will experience greater amounts of initial
deflection because the larger loads will tend to open the
deckboard-stringer joints. As a result, the total amount of
resisting moment from the joints decreases which, in turn
reduces H max Since it is quite possible for a pallet to be
subjected to a wide range of unit loads, it is important
during the design process to have relative feel for the
largest unit load the pallet will support.
Another variable that influences the LCP of a pallet is
its Et!t of the upper deckboards {Figure 5.3). As this
variable is increased the H /V ratio will increase up to a max point where the K-factor equation predicts no deckboard
bending. Beyond this point, no increase in H /V can be max accomplished. Decrease in pallet LCP might be more readily

50
45
40
35
30
H M A 25 X I V
20
15
10
5
0
0
80
500 1000 1500 2000 2500 3000 3500 4000 4500 5000 5500
UNIT urno !LBS.I
LEGEND: STRINGER e--e--e 2
FIGURE 5.2 - THE EFFECT UNIT LOAD HAS
ON THE HMAX/V RATIC
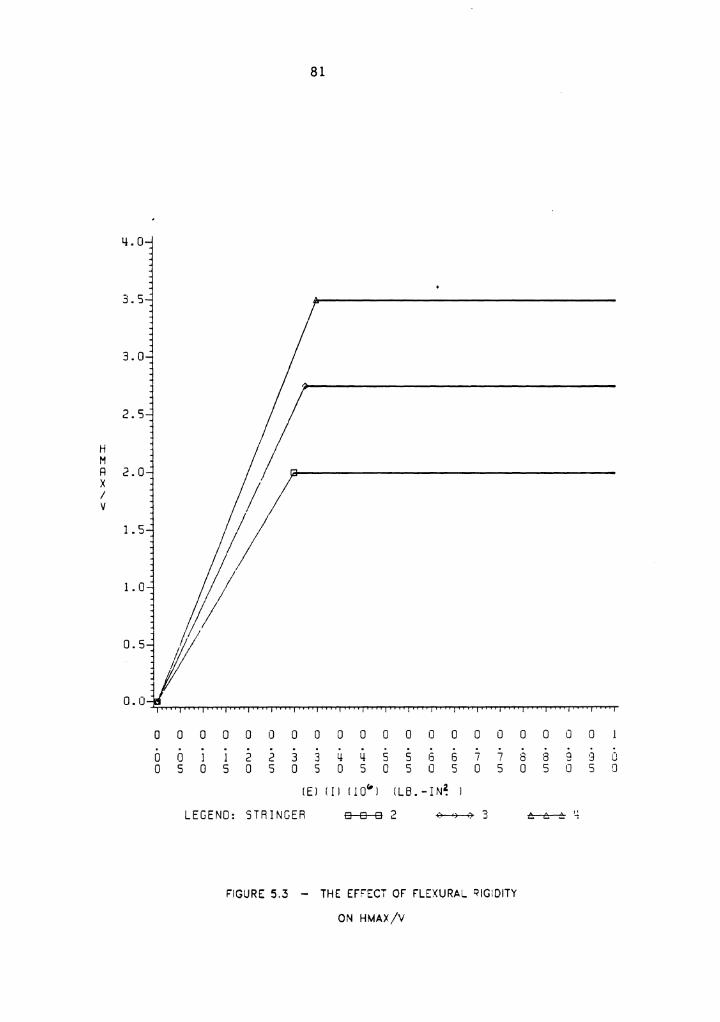
4.0
2.S
H M R 2.0 X I V
1. s
0 0
0 0 0 s
81
, 11 I 11 11 t 11 11 I 11 11 I 11 11 I 11 11 I 11 , I ii I' I' ii I I I Ii I' 'I '
0 0 0 0 0 0 0 0 0 0 0 0 0 0 . . . 1 l 2 2 3 3 4 4 s s 13 6 7 7 0 s 0 5 0 5 0 s 0 s 0 s 0 s
!El I I l 11 o" i ILB.-IN~ )
LEGEND: STA INGER e-e-e 2 ~ 3
FIGURE 5.3 - THE EFFECT OF F'LEXURAL ~IG:DITY
ON HMAX/V
f ''
0 0 0 0
8 8 9 9 0 0 s 0 5 0
e--6-::= ·'

82
and economically accomplished by changing one of the other
three variables discussed in this Chapter.
The type and number of nails used in the pallet will have
an effect on the M and rotation modulus. Figure 5. 4 max shows that as Mmax increases the Hmax/V ratio does the same
because of the greater resistance to overturning.
Therefore, if it is feasible to add another nail per joint
or to increase nail quality, a significant reduction in LCP
will result. This is likely to be the most economically
attractive means
collapse.
of improving resistance to lateral

6.0
5.5
5.0
4.5
4.0
3.5
H M R 3.0 X I V
2.5
2.0
1. s
1.0
0.5
83
0 200 400 600 800 1000 1200 1400 1600 1300 2000
MAXIMUM MOMENT PER JOINT IIN.-LB.l
LEGEND: STRINGER e-e-e 2
FIGURE 5.4 - THE EFFECT MAXIMUM MOM::'jT
PER JCINT -iAS ON HMAX/v

CHAPTER 6
Conclusions
A model of static lateral collapse of wood pallets was
proven to perform satisfactorily. A relative measure of
lateral collapse potential was determined by the Hmax/V
ratio. Based on limited field data, if the H /V ratio is max in the range zero to O. 60, the pallet design is in a high
risk category, between 0.60 and 1.00 it is in a medium risk
category,
category.
and from 1. 00 to infinity it is in low risk
Those factors that influence the LCP are:
1) Stringer Aspect Ratio (w./d.) 1 1
increased the collapse risk is-decreased.
As this ratio is
An increase of this
property will increase the lateral collapse resistance up to
a point where no deckboard bending occurs and beyond this
point, LCP remains constant.
84

85
3) Joint Characteristics The LCP of a pallet will
decrease as the maximum moment and rotation modulus of the
joints in the pallet are increased.
4) Unit Load As the unit load on the pallet is
increased, the risk for lateral collapse increases.

LITERATURE CITED
1. American Society for Testing Standard Methods of Testing Small Timber. ASTM Designation Dl43-52. Standards, Vol. 4.09, pp. 61-62.
Materials. 1983. Clear Specimens of Annual Book of ASTM
2. Antonides, C.E., M.D. Vanderbilt, and J.R. Goodman. 1980. Interlayer Gap Effect on Nailed Joint Stiffness. Wood Science 13(1): 4-46.
3. Bleckley, D.I. Design and Safety.
1980. The Nature of Structural John Wiley and Sons, New York.
4. Bodig, J. and B.A. Jayne. 1982. Mechanics of Wood and Composites. Van Nostrand Reinhold Co. Inc. , New York. p 252.
5. Dunmire, D.E. 1966. Effects of Initial Moisture Content on Performance of Hardwood Pallets. USDA Forest Service Research Paper NC 4, June.
6. Goehring, C.B. and W.B. Wallin. A Survey of Loads, Loading Conditions for Wooden Pallets. Unpublished. Northeastern For. Expt. Station. Princeton, W.V.
7. Gregory, M. S. 1967. Elastic Instability. -F.N. Spon Limited, London. p 1-33.
E. and
8. Hoyle, R.J.Jr. 1978. Wood Technology in the Design of Structures. Mountain Press Publishing Co., Montana. p 31.
9. Johnston, B.G. Criteria for Metal New York. p 18-80.
1976. Guide Structures.
to Stability Design John Wiley and Sons,
10. Kyokong, B. 1979. The Development of a Model of the Mechanical Behavior of Pallets. Thesis. Va. Tech, Blacksburg, Va.
11. Langhaar, H.L. and A.P. Boresi. 1959. Engineering Mechanics. McGraw-Hill Book Co., Inc. Pa.
86
87
12. Loferski, J.R. Literature Review Procedures for Wooden Pallets. Unpublished. Blacksburg, Va.
Design Va. Tech,
13. Mack, J.J. 1966. The Strength and Stiffness of Nailed Joints Under Short Duration Loading. Tech. Paper No. 40. Div. of For. Prod., C.S.I.R.O., Melborne, Australia.
14. Mack, J.J. 1975. Contribution of Behavior of Deckboard-Stringer Joints to Pallet Performance. Wd. Res. and Wd. Construction Lab. Bull. No. 136, Va. Tech, Blacksburg, Va.
15. McCurdy, D.R. and D.W. Wildermuth. 1981. The Pallet Industry in the United States 1980. Dept. of Forestry. So. Ill. Univ. 1981.
16. Meriam, J.L. 1978. Engineering Mechanics: Statics and Dynamics. John Wiley and Sons, New York. p 190.
17. Mulheren, K. 1982. SPACEPAL. Computer program. Va. Tech, Blacksburg, Va.
18. National Forest Products Association. 1982. National Design Specifications for Wood Construction. N.F.P.A., Washington, D.C.
19. N.W.P.C.A. 1962. Specifications and Grades for Warehouse, Permanent or Returnable Pallets of West Coast Woods. N.W.P.C.A., Washington, D.C.
20. Padla, D. P. 1983. Relationships Between MIBANT Bend Angles and Selected Material Properties of Pallet Fasteners. Thesis. Va. Tech, Blacksburg, Va.
21. Percival, P.H. 1981. Portable E-tester for Selecting Structural Component Lumber. Forest Products Journal 3(2): 39-42.
22. Protective Packaging Group. 1976. Reusable Wood Pallets: Selection and Proper Design. E. For. Prod. Lab. Ottawa, Canada. For. Tech. Report 11.
23. Pugsley, A.G. 1966. The Safety of Structures. Edward Arnold (Publishers) LTD., London. p 1-53.
88
24. Randall, F.A.Jr. 1973. Historical Notes on Structural Safety. A.C.I. Journal Oct. p 669.
25. Stern, G.E. 1970. The MIBANT Quality Control Tool for Nails. Wd. Res. and Wd. Construction Lab. Bull. No. 100, Va. Tech, Blacksburg, Va.
26. Wallin, W.B. and E.G. Stern. 1974. Design of Pallet Joints from Different Species. N.E. For. Expt. Station.
27. Wallin, W.B. and E.G. Stern. 1974. Tentative Performance Standards for Warehouse and Exchange Pallets. For. Prod. Mkting. Lab., Princeton, W.V.
28. Wallin, W.B., E.G. Stern, and J.A. Johnson. 1976. Determination of Flexural Behavior of Stringer-type Pallets and Skids. Wd. Res. and Wd. Construction Lab. Bull. No. 146, Va. Tech, Blacksburg, Va.
29. Wallin, W.B., K.R. Whitenack. 1982. Durability Analysis for Wooden Pallets and Related Structures. N.E. Forest Experimentation Station. Princeton, WV. p 23-26.
30. West, H.H. 1980. Analysis of Structures. Wiley and Sons, New York. p 27-29.
31. White, M.S. 1983. Personal Communications. Tech, Blacksburg, Va.
32. U.S.D.A. For. Serv. Prod. Lab. Agri. Handbook.
1974. Wood No. 72.
Handbook,
John
Va.
For.
Al - Machine Drawings
A2 - Machine Wiring
A3 - Machine Operation
APPENDIX A
A3.l - Pre Test Calibration Procedures
A3.2 - Typical Test Procedures
89

90
Al - Machine Drawings
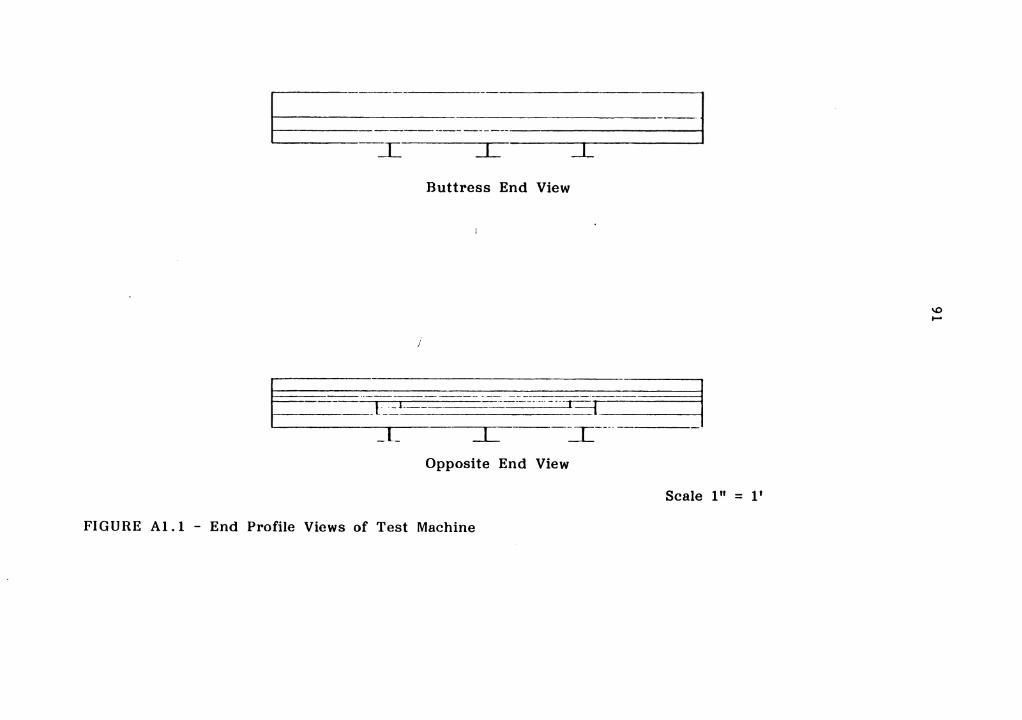
~
-------- ----l I ...L .I
E_?-
_L
j
Buttress End View
-----------1:=:r= ____ _. I i---
Opposite End View
Scale 1" = 1'
FIGURE Al.1 - End Profile Views of Test Machine
\0 I-'

---....... __ HYD~ALIC. (.YLINDE~ LO~D C~LL
0
0 () 0 0
0
n--.-----------r---,
0 I, ,r:::--:=1
Scale 1/4 11 = 111
FIGURE A 1. 2 - Plan and Profile Views of Buttress- Load Head Connection
'° N

r~J - . --· ---·-. .:=J J I I ~11
FIGURE Al. 3 - Details of LVDT Bracket
] ~
'° w

94
A2 - Machine Wiring
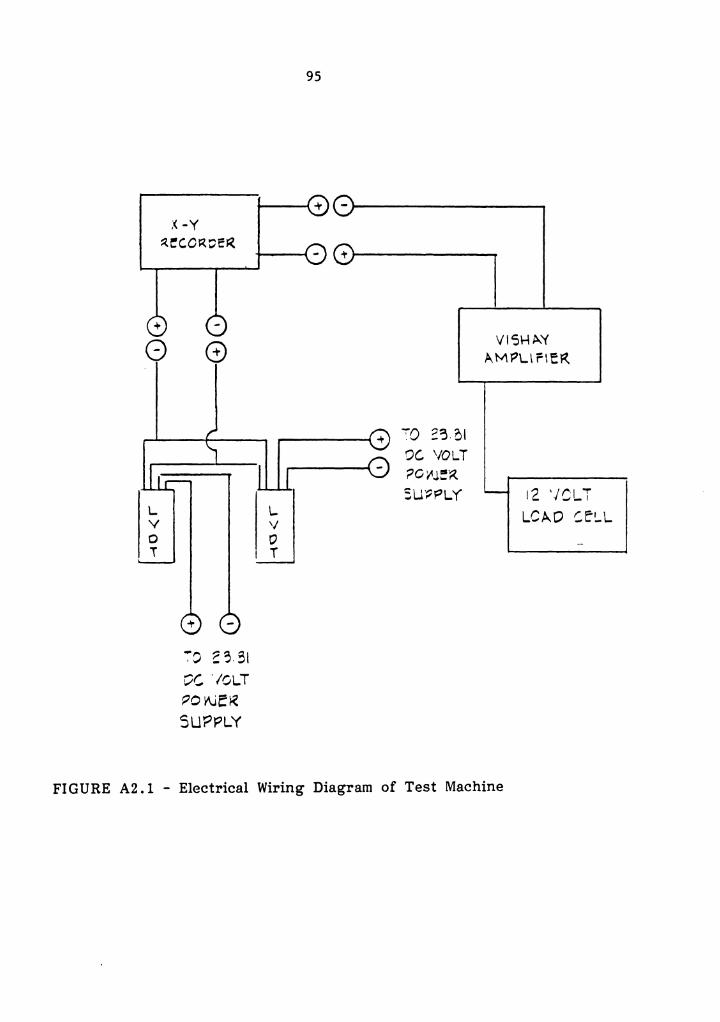
95
--- - 81---------......... _____ ..........
+
G 8
,.........,.. __ 4-- _____ ------'"" ~ ~o :::~ 01
L y 0 T
"'."? ~3.31 OC. '/OLT ~o r\JE~ SUPPLY
l~l w ?C. 'IOLT ;:,o~J~·~ su·~PLY
V1'5H~'( ~MPL\flf~
t2 '/CL T LCA.O ~E'~L
FIGURE A2 .1 - Electrical Wiring Diagram of Test Machine

96
A3 - Machine Operation

97
A3.1 - Pre Test Calibration Procedures
1) Calibrate 10;000 lb BLH load cell according to procedures outlined in its specifications manual. Install load cell on machine.
2) Turn on VISHAY amplifier, Hewlet-Packard X-Y recorder and the two LVDT p9wer supplies for a 10 minute warm-up.
3) Check LVDT power supplies for a 23.81 volt output.
4) Check bridge voltage of channel 4 which sould be 12.00 volts. Adjustment is made with "BRIDGE EXCIT."
5) With "EXCIT" switch off, balance lights on VISHAY with the "AMP BALANCE."
6) Turn "EXCIT" switch on. "BALANCE" knob.
Balance VISHAY lights with
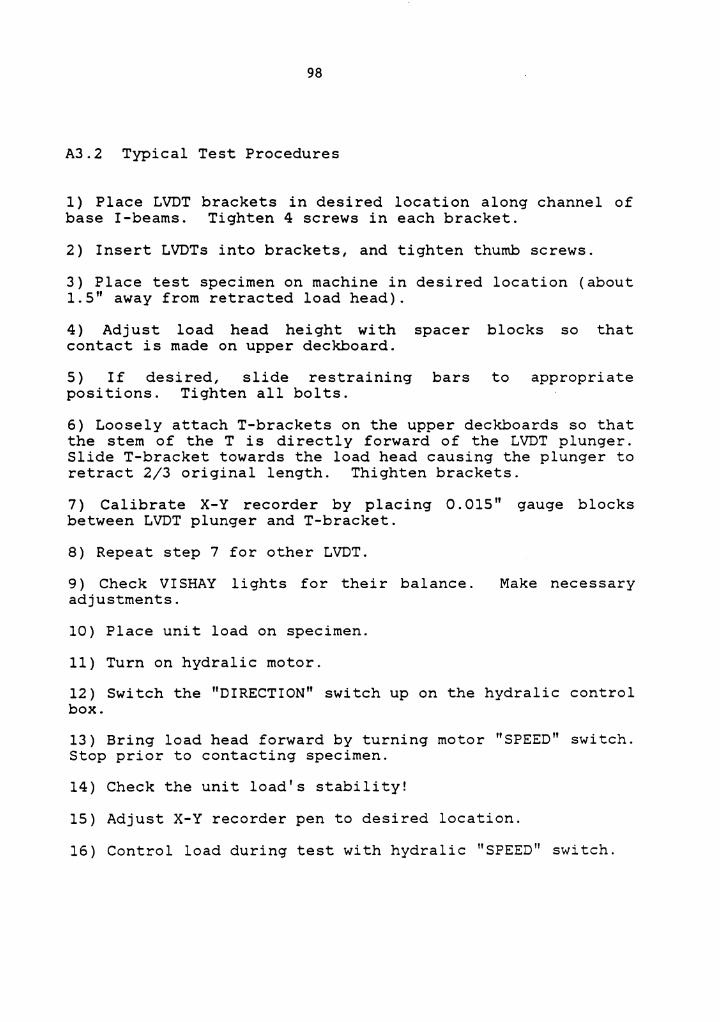
98
A3.2 Typical Test Procedures
1) Place LVDT brackets in desired location along channel of base I-beams. Tighten 4 screws in each bracket.
2) Insert LVDTs into brackets, and tighten thumb screws.
3) Place test specimen on machine in desired location (about 1.5" away from retracted load head).
4) Adjust load head height with spacer blocks so that contact is made on upper deckboard.
5) If desired, slide restraining bars to appropriate positions. Tighten all bolts.
6) Loosely attach T-brackets on the upper deckboards so that the stem of the Tis directly forward of the LVDT plunger. Slide T-bracket towards the load head causing the plunger to retract 2/3 original length. Thighten brackets.
7) Calibrate X-Y recorder by placing O. 015" gauge blocks between LVDT plunger and T-bracket.
8) Repeat step 7 for other LVDT.
9) Check VISHAY lights for their balance. adjustments.
10) Place unit load on specimen.
11) Turn on hydralic motor.
Make necessary
12) Switch the "DIRECTION" switch up on the hydralic control box.
13) Bring load head forward by turning motor "SPEED" switch. Stop prior to contacting specimen.
14) Check the unit load's stability!
15) Adjust X-Y recorder pen to desired location.
16) Control load during test with hydralic "SPEED'' switch.

99
17) Once the X-Y recorder indicates maximum horizontal load, turn the "SPEED" switch to zero.
18) Move "DIRECTION" switch to the down position until load head is fully retracted.
19) Turn off hydralic motor.
APPENIX B
Bl - Listing of LCAN Program
B2 - Analog Models
B3 - Pallet Designs for Computer
B3.l - Three Stringer, Double-Faced Pallets Designed for K-Factor Development
B3.2 - Four Stringer, Double-Faced Pallets Designed for K-Factor Development
B3.3 - Three Stringer, Single-Faced Pallets Designed for K-Factor Development
B3.4 - Four Stringer, Single-Faced Pallets Designed for K-Factor Development
100

101
Bl - Listing of LCAN Program
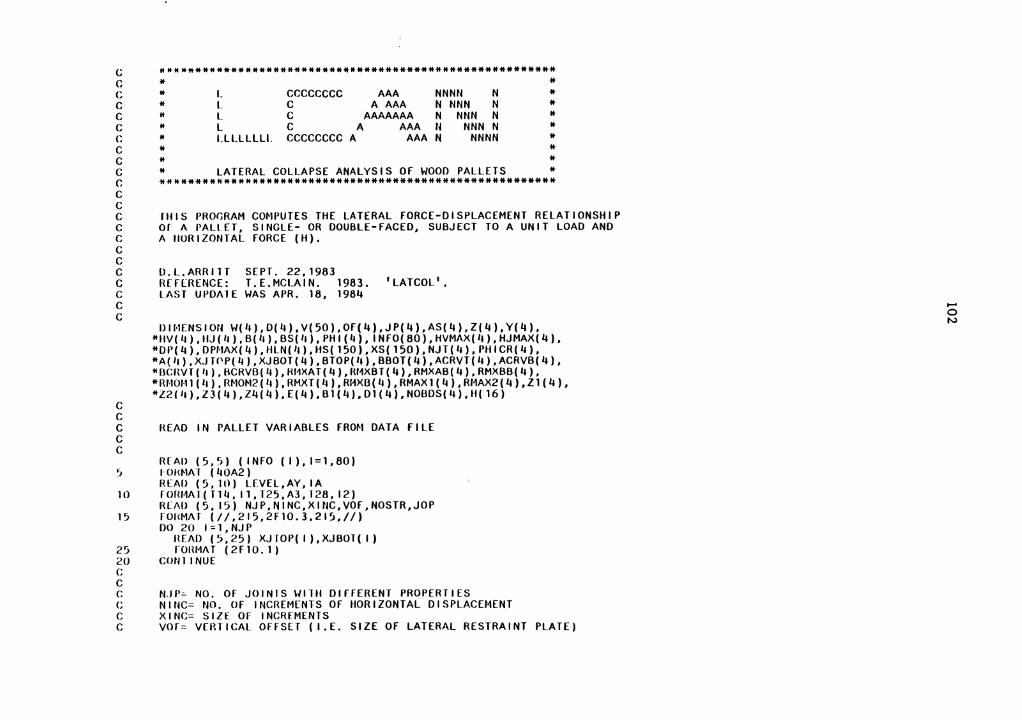
C ******************************************************** C * * C C C C C C C C C C C C C C C C C C C C C
C C
* L cccccccc AAA NNNN N * * l. C A AAA N NNN N * * L C AAAAAAA N NNN N * * L C A AAA N NNN N * * I.LLLLLLI. CCCCCCCC A AAA N NNNN * * * * * * LATERAL COLLAPSE ANALYSIS OF WOOD PALLETS * ********************************************************
fHIS PROGRAM COMPUTES THE LATERAL FORCE-DISPLACEMENT RELATIONSHIP 01 A PALLET, SINGLE- OR DOUBLE-FACED, SUBJECT TO A UNIT LOAD AND A IIUR I ZONlAL FORCE ( H),
O.L.ARRITT SEPT. 22,1983 RfflHENCE: LE.MCLAIN. 1983. 'LATCOL'. LAST UPDA l E WAS APR. 18, 1984
DIMENSION W(4),D(4),V(50),0F(4),JP(4),AS(4),Z(4),Y(4), *IIV( 11), IIJ ( 11), B(ll). BS( 11), PH I ( 4). INFO( 80). HVMAX(II). HJ MAX( 4), *DP( 4), DPMAX( 4). HLN(II). HS( 150). XS( 150). NJT( 4). PH I CR( 4). *A(4),XJT0P(4),XJBOT(4),BTOP(4),BBOT(4),ACRVT(4),ACRVB(4), l<OCRVT( 11), BCRVO( 11). HMXAT( 4) ,IIMXBT( 4), RMXAB( 4), RMXBB( 4), *RMOM1(4),RMOM2(4),RMXT(4),RMXB(4),RMAX1(4),RMAX2(4),Z1(4), *Z2( 11) ,Z3( 4 ).Z4( 4). E( 4). Bl ( 4), D1 ( 4). NOBDS( 4). H( 16)
C HEAD IN PALLET VARIABLES FROM DATA FILE C C
REAi> (5,~>) (INFO (l).1=1,80) 5 tOHMAl (40A2)
REAi> (5, Ill) L[VEL,AY, IA 10 fORMAl(Tl4,ll,T25,A3,128,12)
R[AI> (5, 15) NJP,NINC,XINC,VOF,NOSTR,JOP 15 fOl<MAT (//,215,2F10.3,21!",,//)
DO 20 I = 1 , NJ P HEAD (5,25) XJlOP(l).XJBOT(I)
25 fOHMAT (2F10.1) 20 CON 1 I NUE C C C NJI'=- NO. OF JOI NI S HI 111 DIFFERENT PROPER Tl ES C NINC= NO. OF INCREMENTS OF HORIZONTAL DISPLACEMENT C XINC= SIZE Of INCREMENTS C vor: VERTICAL OFFSET ( I.E. SIZE OF LATERAL RESTRAINT PLATE)
.... 0 N

C ZERO FOR OOUDL[-FACED PALLETS C NOSTR= NO, Of S1RINGERS C JOP= TYPE OF PALLET 1) SINGLE-fACED=l C 2) D0UBLE-FACED=2 C C XJIOP1&2= # OF JOINTS ALONG TIIE TOP OF EA. STR.(I) WITH JOINT C PROP. (I) C: X.JBOl1&2= U OF JOINIS ALONG TIIE BOTTOM OF EACH STR,(I) WITH C JOINT PROP,( I) C C
30
35
1,0
50 L15
55
60 C C C C C C C C C C C C C C C C C C
lf(LEVEL.[Q.3)GO TO 70 \-/HITE (6 30) rDRMAT ( 11 1 ,'INPUf DATA',/) WRllE (6,35) ( INFO( I), 1=1,80) roHMAT (40A2/40A2) WR I r E ( 6, IIO ) FOHMAT(//, 18, 'NJTOP( I ) 1 , T42, 'NJBOT( I)') DO 115 I= 1, NJ P
WHITE (6,50)XJTOP( I ),XJBOT( I) FORM/\ T ( 1X,T3,f10. 1, T3 7, F 10, 1 )
Cotl f I NU[ WHITE(6,55) FOHMAT(//,f8, 1 NJP',T19,'NINC 1 ,T31, 1 XINC',T43,'VOF',T54,'NOSTR',
*1611, 'JOP') Hf<I rE (6,60)N.JP,NINC,XINC,VOF,NOSTR,JOP ru1<MAT ( lX, 15, 15, l17, 15, T26,f10.3, T37,f10.3, T52, 15, T61, 15)
RE/\0 IN PALLET VARIABLES FROM DATA FILE
W( 1),0( I)= WIDTH AND HEIGHT Of EACH STRINGER V( I)= VERTICAL FORCE ONTOP OF EACH STRINGER JP( I)= JOINT PROPERTY NO. OF EACH STRINGER
0 INDICATES 2 DIFFERENT JOINTS ALONG STR.( I) 1 II 1 II II II 11 11
2 11 1 " 11 11 11 (OTliERTHANI) J II 2 II II 11 11 ( 11 II 11)
or( I)= flNAL OFFSET Of EACH STRINGER= DISTANCE FROM EDGE
HRI i;
TIIAT VERTICAL FORCE VECTOR ACTS AFTER SOME DEFORMATION 1111 S DOES NOT AFFECT THE SH I FT I NG OF THE OFFSET WHICH CHANGES WITH INCREASING X.
65 IOHl·i,'. .... , 10, 'WIDTII', T211, 'DEPTH', T34, 'J.P. 1 )
70 CON I I NUL HE/\D ( 5, 75)
75 IOHMAT(//) DO 80 I= 1, NOSrn
.... 0 w
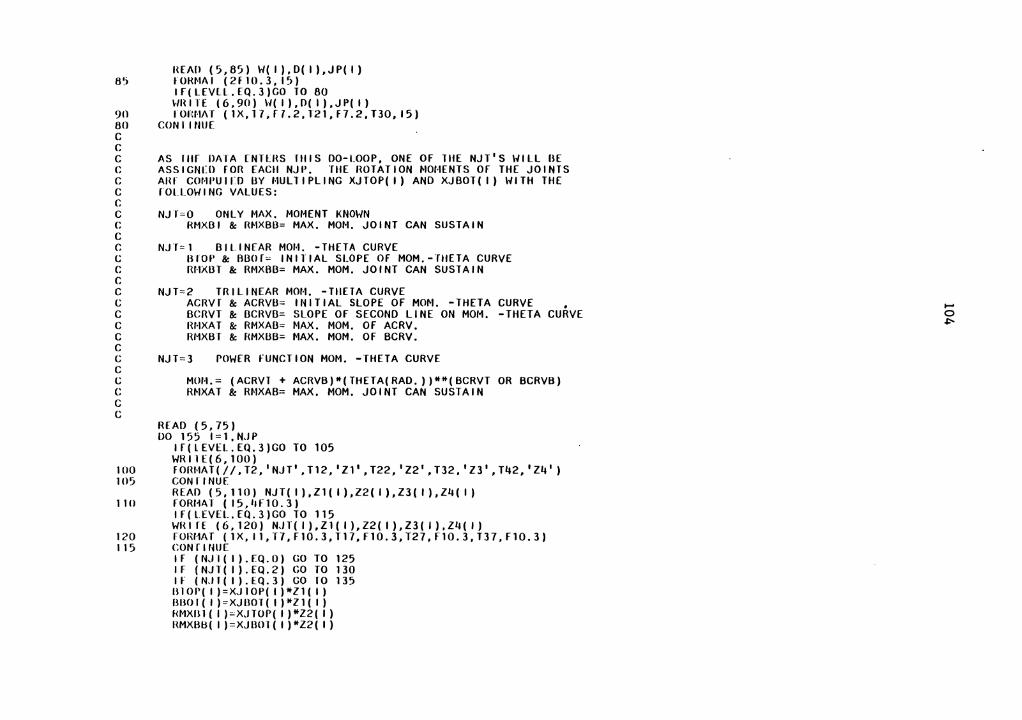
8'j
90 80 C C C C C C C C C C C C C C C C C C C C C C C C C C
ll[All (5,85) W( I ).0( I ),JP( I) IOHMA I ( 2 F IO. 3 , I 5 ) lf(L[VLL.[Q.J)GO TO 80 HH I IE ( 6, 90) \/( I ). ()( I ) , JP( I ) IOl':l·IA T ( 1 X, l 7 , f 1 • 2 , 12 1 , F7 . 2 , T3 0 , I 5 )
CON I I till[
AS llff DATA CNHHS HIIS 00-LOOP, ONE OF lit[ NJT'S WILL BE ASSIGN[() fOR EACII NJI'. TUE ROTATION MOMENTS OF THE JOINTS Allr COMl'Ulrn BY MULTIPLING XJTOP( I) AND XJBOT( I) 1-/ITH HIE fOLLOWING VALUES:
NJf=O ONLY MAX. MOMENT KNOWN RMXBI & RMXBB= MAX. MOM. JOINT CAN SUSTAIN
NJT=l BlllNfAR MOM. -THETA CURVE BIOP & BBOf= INlllAL SLOPE OF MOM.-fllETA CURVE RHXBT & RMXBB= MAX. MOM. JOINT CAN SUSTAIN
NJT=2 TRILINEAR MOM. -THETA CURVE ACRVf & ACRVB= INITIAL SLOPE OF MOM. -THETA CURVE • BCRVT & BCRVB= SLOPE Of SECOND LINE ON MOM. -THETA CURVE RMXAT & RMXAB= MAX. MOM. Of ACRV. RMXBT & f<MXBB= MAX. MOM. OF BCRV.
NJT=3 POW[R FUNCTION MOM. -THETA CURVE
MOM.= (ACRVT + ACRVB)*(THETA(RAD. ))**(BCRVT OR BCRVB) RMXAT & RMXAB= MAX. MOM. JOINT CAN SUSTAIN
READ (5,75) 00 1 5 5 I = 1 , N.J P
lf(LEVEL.EQ.J)GO TO 105 WR 11 E ( 6, 100)
100 FORMAT(//, T2, 1NJT', T12, 'Zl', T22, 1Z2', T32, 1Z31, T42, 'Z4 1 ) 1 o•; CON 11 NUE
READ (5,110) NJT( I ),Zl( I ),Z2( I ),ZJ( I l,Z4( I) 1 10 fORMA T ( I 5, 11 F 10. 3 )
IF(LEVEL.EQ.3)GO TO 115 WH I r E ( 6, 120) N.J T ( I ). Z 1 ( I ) , Z2 ( I ). Z 3 ( I ) , Z4 ( I )
120 FORMAT (lX, 11,T7,F10.3,T17,f10.3,T27,f10.3,T37,f10.3) 115 CUNTIIHJE
IF (N,ll( I ).[Q.0) GO TO 125 I f ( NJ T ( I ) . EQ. 2) GO TO 130 IF ( NJ I ( I). EQ. 3) GO lO 135 II l O I' ( I ) = XJ 1 0 P ( I ) * Z 1 ( I ) BBOI( I )=XJBOl( I )l+Zl( I) HMXBl ( I )ccX,JTOP( I )*Z2( I) HMX8B( I )=XJBOl( l)*Z2( I)
.... 0 ~
111 •,
1 !JO 11,0
130
165
170
175
160
C
IF(lEVEL.[Q.])CO TO 140 WH I 1 [ ( 6, 1'15 ) I ORMAI ( 1 X, T 10, 'IITOP', 126, 'BBOT', T42, 'RMXT', T58, 'RMXB' ) HRITl(6, P:,U) ( I ).OTOP( I ).BOOT( I ).RMXBT( I ).RMXBO( I) I OHl·lfd ( 1 X, I 2, T7, F 10. 3, T 2 3, F 10. 3, 139, F 10. 3, 155, F 10. 3 ) CON I I NU£ CO TO 155 ACIWI (I)~ XJ IOP( I )*Zl (I) ACHVl3( I)= XJOOT( I )*Zl (I) BCHVT( I)= XJTOP( I )*Z2( I) 13CRVD( I)= XJBOT( l)*Z2( I) HMXAT( I)= XJlOP( I )*ZJ( I) HMX/\13( I)= XJBOT( I )*Z3( I) l<MXlll( I)= XJTOI'( I )*Zl1( I) HM><Ll13( I)= XJBOT( I )*Z4( I) lf(l£VEL.EQ.3)GO 10 160 HRIH(6, 165) roHHAT(lX, 1 ( 1) 1 ,T10, 1 ACRVT',T25,'BCRVT',T40,'RMXAT 1 ,T55,'RMXBT') WRI 1[(6, 170)( I ).ACRVT( I ).BCRVT( I ).RMXAr( I ).RMXBT( I) FORMAT(lX, 11,T8,F10.3,T23,F10.3,T38,f10.3,T53,F10.3) WH I f E ( 6, 175) FOHMAl(1X,T10, 1 ACRVB 1 ,T25,'BCRVB',T40, 'RMXAB',T55,'RMXBB') WH1lf(6, 170)( I ).ACRVB( I ).BCRVB( I ).RMXAB( I ).RMXBB( I) CONTINUE GO ro 155
135 ACRVT(I)= XJTOP(l)*Zl(I) ACHV13( I)= X,JBOT( I )*Zl (I) 13CHV1 (I)= Z2( I)
180 *
* 185
*
12~
190
195 C 155 C
BCRVB( I)= Z2( I) RMX/,T( I)= XJ TOP( I )*Z3( I) HMXAl3( I)= X.JBOT( I )*Z3( I) lf(IEVEL.EQ.3)GO TO 155 WRIH(6, 180) FORMAl(lX, 1 ( l) 1 ,T8, 1 ACRVT 1 ,T21, 1 BCRVT',T31,'RMXAT',T42,'ACRVB',T 4, 1 BCRVB 1 ,T66,'RMXAB 1 )
HRIH (6, 185)( I ),ACRVT( I ),BCRVT( I ),RMXAT( I ).ACRVB( I ).BCRVB( I), HMXf.13( I ) FOHl1Al ( IX, 11, Tl1, flO. 3, T16, FlO. 3, T27, FlO. 3, T38, FIO. 3,149, FlO. 3, 162,Fl0.3) GO lO 155 HMXIJ I ( I )=XJTOP( I )*Z2( I) HMXBB( I )=XJBOI ( I )*Z2( I) IF (LlVE.L.EQ.3) GO TO 155 WH I I f ( 6 , 190 ) I OHMA I ( 1 X, I 10, ' HMXT 1 , I 20, 1 RMXB' ) HIU ll(6, 195)( I ).RMXBT( I ).RMXBB( I) I OHMA J ( 1 X, I 2, f 7, Fl O. 3, T 17, F 10 • 3 )
CONf IIHJE
,.... 0 V,
C C: READ IN lllf NUMBEH AtlD DIMENSIONS OF TII[ UPPER DECKBOAROS C ·10 COMPUrE "IIIE AVERAGE MOE ANO TOTAL MOMENT OF INERTIA C C
HEAD (5,200) NOOKBD 200 rottMAl ( T30, 12) C
LYc:2 I.P= I IL=I [AVG=O.O [IOT-=0.0 lfRI IA=O.O 101 Dl<S=O. 0 IF(l.£VfL.fQ.3)GO TO 205 WR I H ( 6, 210 )
210 IORMAT(// 114,'MOE',T20, 1 BASE',T30,'DEPTH',T45,'# OF BDS',T63 *, I ltlfRTIA )
205 CONTIHUE C
READ (5,75) 00 215 1=1,NODKBD
READ (5,220)£( I ).81( I ),DI( I ).NOBDS( I) 220 fOHMAT ( T4, FIO. I, T32, F5. 3, T50, F5. 3, T70, 12)
f.RT IA=O. 0 £RT I A= ( (BI ( I ) *( DI ( I )**3) )/ 12 )*FLOAT( NOBDS( I ) ) T[RTIA=[RTIA+TERTIA ETOl=E( I )*FLOAT( NOBDS( I) )+ETOT TOrDKS=TOTOKS+FLOAT( NOBDS( I)) IF(L[VEL.EQ.3)GO TO 215 WRIH (6,225) [( I ),Bl( I ),DI( I ).NOBDS( I ),ERTIA
225 FORMAT (1X,F10.1,T20,F5.3,T30,F5.3,T49, 12,T61,F10.5) 215 emir I NU[ C
fAVG=ETOT/TOTDKS lf(LEVEL.EQ.3)GO TO 230 WHIH(6,235) EAVG,TERTIA
235 rorMATl//,'AVG. MOE= 1 ,T11,F10.1,T22,'PSl 1 ,T30,'TOT. MOMENT OF INE *Hl"IA'-' 1 ,FI0.5,T67, 1 1N**31 )
230 COIHINU[ C C C C flff FOLLOWING HOUTINE BREAKS DOWN THE UNIT LOAD INTO CERTAIN C PIHCENTAG[S, ACCORDING TO THE NUMBER Of STRINGERS, AND ALLOCATES C lll[M TO A S1R1NG£R C C
HIM> (5,2110)NOllNIT ;>110 n>HMAT ( //, 17X, 12, //)
.... 0 (1\
lf(LEV£l.EQ.3)GO TO 245 Wltl TE ( 6, 2~,o) NOUN I T
2~0 FOm1AT(1X,1 # Of LOAD CASES= ',T18, 12) 2115 CotlT I NlJE C C C llllS DO-LOOP COMPUTES THE ltMAX FOR VARIOUS UNIT LOADS C C
260
270 C
00 255 IN=l,NOUNIT IIMAX=O.O XM=O.O 1-ILN( IN)=O.O Z( IN)=O.O Y(IN)=O.O HMOMl( IN)=O.O RMOM2( IN)=O.O HMAXl( IN)=O.O UMAX2( IN)=O.O HMXT( IN)=U.O / RMXB( IN)=O.O JCT=O READ (5,260) UNIT,SPACE,DKL,OltG fOHMA T (11 F IO. 2 ) / lf(LEVEL.EQ.3)GO TO 265 WRITE(6,270)1N,UNIT fORMAT(//,'LOAD CASE# = 1 ,T14, 12,T30, 1 UNIT LOAD= ',T42,F10.3)
WHITE( 6,275 )SPACE, Dl<L, OIIG 275 f0RMA1(1X, 1 SPAC1NG = 1 ,T11,F5.2,T20,'DECK LENGTH =',T33,F5.2,
* 145,'0VERHANG =',T55,F5.2) 265 CONTINUE C C C COMPUfE THE AMOUNT OF UNIT LOAD DISTRIBUTED TO EACH STRINGER C C
Ml= 0 M= 0 IF (NOSTR.EQ.3) GO TO 280 IF (NOSTR.EQ.2) GO TO 285 PUl=O.O 1'82=0.0 PB3=0.0 PBll"O.O l'Bl°'SPACE/DKL PB2= 1'131 Pl33=((DKL-2*SPAC£)/2)/0KL PBll=PB3 M J ,= NOSlR/4 M,-Mt
... 0 ......
290
295
300
305
280
315
320
325
C
l>O 290 I= 1 , M V( I);= UNll*PBl
CONTINUE Ml=-M+l MsM+Ml l>O 29,; l=MI ,M
V( I ) 0,UHIT*PB3 CON 11 NlJE Ml:cM+l MccM+Ml DO 300 l=Ml,M
V( I )=UNI T*PBlt CONllNUE Ml:ccM+l M=M+Ml DO 305 I =Ml ,M
V( I )c:UN1l*PB2 CONTINUE GO TO 310 Ml=NOSTR/3 M=:Ml 00 315 I= 1,M
V( I )=UNIT*0.25 CONJINUE Ml=M+l M=M+Ml l>O 320 l=Ml,M
V( I )=UNIT*0.5 CONI I NUE Mlc=M+l M=M+Ml 00 325 l=-MI ,M
V( I )=UN I T*O. 25 CONTINUE GO lO 310
285 DO 330 1=1,2 V( I )=0.5*UNIT
330 CONTINUE C 310 CONTINUE C
IF(LEVEL.EQ.3)GO TO 335 WHIH(6,31tO)UKL
340 roRMAT(//.'O[CKBOARD(S) LENGTH= 1,F4.1,T28, 1 IN. 1 ) WHIH (6,345)
311'> l"OIIMAl( lX., 1 S1HINGE.R 1, T25, 1APPLIED LOAD') DO JJ'j 1=1,NOSTR
WR I Tl (6,350) I, V( I ) 3~0 fORMAT(1X,T4,12,T26,F10.3) B5 CONIINUE
.... 0 00
C C C VARIABLES FOR K-fACTOR REGRESSION EQUATIONS C C
C 355
C C C
XlccO.O X5:c0.0 X6=0.0 X7=0.0 X8=0.0 XlO=O.O IF (NOSTR.EQ.~) GO 10 355 Xl=UNIT XO=SPACE**3 X7=TEHT I A*EAVG X~=(W(l)+W(2)+W(3))/3. X6=D( 1 ) co 10 360
Xl=UNIT XB=((OKL-SPACE)/2)**3 XlO=-TERTIA*EAVG X6=U( 1 ) X7=(W( 1 )+W(2)+W(3)+W(4))/4.
C fSIAULISII INITIAL PARAMETERS .. INCLUDING FRICTION RESISTANCE FOR C SINGLE-FACED PALLETS IN 'IIINIT' C C 360 CONTINUE
C
rrucT= o.55 ttlOl= 0. 00 11 l.AG= 0 IIINIT= 0.00
II (JOP.EQ.1) GO TO 365 OIJ 370 1=1,NOSTH
IIINll= IIINIT + V( I)*~/( I )/(2.0*D( I)) 3 70 CIJIH I NUE
GO TO 375 365 DO 380 I= 1, NOS fR
IIINIT'-= IIINIT + V(l)*W(l)/(2.0*D(I)) 380 CONl INUE C
no 385 l=l,NOS1R IIINI r= IIINIT + FRICT*V( I )*VOF/(D( I )-VOF)
385 CONTINUE C 3/5 CONTINUE
..-0 \C
C C C C C C
39~ *
,,ou *
It 15
405 425
,, 10 430
1,20
11 llll
IJ35
1150 4115
1160
1165
11'>5 C C C C C C
IIIIS SfCllON PHODUCES A PICTURE Of THE PALLET DESIGN WITH 111[ UN IT LOAD AND 111 NIT APPLIED
Ir (LEVFl .• Gl.O) GO TO 390 WRllE (6,395) UNIT FORMAT (/"150,'UNIT LOAD = 1 ,1X,f10.2,1X,'LBS'/T45,32(1Hl)/T45,32( IIIV 11
WH I 1 E ( 6, 1100) Ii IN IT H)HMAT \/ 11 tNlllAL IIOHZ. FORCE = 1 ,1X,f7.1,1X,'LBS 1 ,T37, 7(111-). ) ,Tl15,32(11l*)) It (NOSIR.EQ.4) GO IO 405 1F(N0STR.fQ.2)GO TO 410 HH I TE ( 6, 1115 ) FOHMAl (Tl15, 1 * 1 , T61, 1* 1 ,T76, '*') WHlll::(6,415) WH I TE ( 6 , 1115 ) GO TO 1t20 HHIH(6,l125l fOHMAl(ll15, 1*', 155, '*', T66, '*', T76, '*') WR I lE ( 6,1125) WR 11 E ( 6, 1125) GO 10 1120 CONllHUf FOHMAl ( 145, '*', 176, '*') \/RI l E ( 6,430) \ml IE (6,IJ30) IF (JOP,[Q. l)GO TO 435 WR 11£( 6, l1l10) tORMAl(T45,32(1H*)) GO TO 11115 IF (NOSfR.EQ.4) GO TO 450 IF(NOSlR.EQ.2) GO TO 455 WH I lE ( 6 , 111 5 ) GO TO 390 HHllf (6,1125) lf(NOS1R.EQ.3) GO TO 390 WHITE (6,460) IOHMAT( f55,' I', l66,' I') WHIH (6,l165)SPACE l"ORMAl(T55,'SPACING = ',F5.2,T71, 1 1N.') GO 10 390 WIii IE(6,l130)
COMPUTE VALUES Al EACH INCREMENT
..... ..... 0
390 X·-= 0.0 PS1cc0,0 lllUA = 0.0 IIIE1A2cc0. 0 ALPIIA=O.O ALl'IIA2=0.0 PS12==U.O MNUM=O NJPMccQ [lflCl'T=O.O
C C C IN l111S DO-LOOP HTOT IS COMPUTED AT EACH XINC C C
C C C C C
1185
1180
1,90
DO 1170 J=l,NINC X= X+ XINC IITOT= 0.0
IN TIIIS DO-LOOP H IS COMPUTED FOR EACH STRINGER AT EACH XINC
DO IH5 k=l,NOSTR Rl=O.O R2=0.0 YMocQ, Q PSI =(ATAN(D(K)/W(K)))*57.296 IILN(K)=SQRT(D(K)**2+W(K)**2) Z(K)ccW(K)-X YM=SQHl(HLN(K)**2-Z(K)**2) ALPIIA=(AHSIN(YM/HLN(K)))*57.296 TII ET A=AL PHA-PS I PS12=90.0-PSI ALPHA2=90.0-ALPIIA TII[ J A2=c PS I 2-ALPHA2 TN=O.O TN~W(K)-VOF*TAN(THETA2/57.296) If (X.G[.TN)GO TO 485 GO 10 1180 Z(K)=W(l<)-X Yl1c:SqHT(IILN(K)**2-Z(K)**2) Al PIIA=90.0+90.0-((ARS1N(YM/HLN(K)))*57.296) l 11£T A~ALl'IIA-PS I 111 ll A2= TIIU A ALPIIA2=0.0 lf(JP(l<).NE.O) GO TO 490 MNlJM=l NJl'Mcc2 lf(JP(K).NE.1) GO TO 495 MNlJM=0 1
...... ...... ......
NJ PM"' 1 IJ95 lf(JP(K).NE.2) GO TO 500
MNUM=2 NJPM=2
500 lf(JP(K).NE.3) GO TO 505 MNUM=3 tlJ PM=lt
( ' ·' C C IN TIIIS DO-LOOP TIIE TOTAL ROTATION MODULUS FOR THE TOP MID C BO rroH JO I NT ALONG A SIR INGER Is COMPUTED C C 505
520
515 525
51,5
~110
5:i'.>
530
* *
*
DO 510 M=MNUM,NJPM TIHCRl=O. 0 TII fCR2=0. 0 fNlCPT=O.O lll[ICR=O.O lf(ttJT(M).EQ.l)GO TO 515 If (NJT(M).[Q.3)GO TO 520 TIITCH 1 =( RMXAT( M) +RMXAB( M) )*57. 296/ ( ACRVT( M) +ACRVB( M)) ENTCPT=(RMXAT(M)+RMXAB(M))/((BCRVT(M)+BCRVB(M))* ( TlllCRl/57. 296)) lltlCH2=5 7. 296*( ( RMXBT ( M )+RMXBB( M) )-ENTCPT) / ( BCRVT ( M) +BCHVB(M)) GO JO 525 TllllCR=( (HMXAT(M)+RMXAB(M) )/(ACRVT(M)+ACRVB(M))) **( 1.0/( BCRVT(M)) )*57 .296 GO TO 525 Tiff I CR= ( RMXBT ( M )+RMXBB( M) )*57. 296/ ( BTOP( M )+BBOT( M)) If (NJT(M).EQ.3)GO TO 530 IF (NJT(M).EQ.l)GO TO 535 IF (TIIETA.LE.THTCRl)GO TO 540 IF (1HETA.LE.THTCR2)GO TO 545 RMOMl(M)=RMXBT(M) RMUM2(M)=RMXB8(M) GO ro 550 RMrn11(M)=(UCRVT(M)*THETA/57.296)+ENTCPT RMOl 12( M )= ( BCHVB( M) *TIIET A/5 7. 296) +ENTCPT GO 10 ~,50 RMOl11 ( M) =ACRVT ( M) *TllET A/5 7. 296 RMOM2(M)=ACHVB(M)*TIIETA/57.296 GO 10 550 RMOMl ( M )=BTOP( M) *TIIET A/57, 296 HMOl12 ( M) =BBO f ( M) * f llEl A/5 7. 296 I F ( lllllA. GE. TIIEfCR) RMOMl ( M )=RMXBT ( M) I Fl mu A. GE. TIIETCR )RMOM2( M )=RMXBB( M) co ro 5'>0 HMOM1(M)=ACRVT(M)*(TllETA/57.296)**BCRVT(M) RMOf.12( M )=ACHVB( M) *( HIET A/5 7. 296) 11*BCRVB( MI If (lHLIA.GE.THETCR)RMOMl(M)=RMXAT(M)
.... .... N
C C 550
5~5 510 C C
C
')6'j
570 C 560
C C C C C
*
C C C C C 580
*
C C C C C ')75
Ir( I II[ rA. GE. THETCR )RMOM2( M )=RMXAB( M)
RlccRJ+RMOMl(M) H2°H2+RMOM2(M) IF(LEVEL.Gf.O) GO TO 510 WHl1E(6,555)R1,H2,(M) 101lMAf(1X,2f10.3,T30, 11)
COIIT I tlUE
HM/\Xl(K)=Hl RMAX2(K)=R2
lf(l[VEL.Gr.o) GO TO 560 HRI IT (6,565)ALPHA,ALPIIA2, PSl2, YM,Z( K), THTCRl FOP.I-I/II ( lX, 6F13. 6) HHIH (6,565) THETCR,PSI, TllETA, THETA2,ENCPT, THTCR2 WH 11 f (6,570) RMAX 1 ( K), RMAX2 ( K) FOHMAT(1X,2F15.3)
Ck=O.O CRccQ.O If (HOSTR.EQ.2) GO TO 575 If (NOSTR.EQ.3) GO TO 580
FOUR SlRINGFR REGRESSION EQUATION
CA=O. 13057599-0.00001176*Xl+0.04938176*X10/X8-0.056H9698*X7/X6-0.00002484*(RMXBT(l)+RMXBB(1)) GO 10 585
rlll<EE S TR I HGER REGHESS I ON EQUATION
CA~0.89561928+0.0003172*Xl+0.00130390*X7/X6-1.60039455*X5/X6 +.00006912*(RMXBB(l)+RMXBT(1)) GO 10 585
lWO STRINGER EQUATIONS
nv~o.o nw,o.o HY'-'((11Nll/(Sl'ACE+2*011G))*(SPAC[«*3))/(24*EAVG*TERTIA) R\1-' ( ( IHI I I/ ( SPACE+2*011G)) *OHG**2*SPACE) /( l1*EAVG*TERT I A) ALPllA0 ALPIIA/57. 296
.... .... l.,.J
C C 585
C C
Cl\=( Al l'IIA-RY+RW)/ALl'IIA CH=(Al.PIIA+RY-HW)/ALPIIA IF (K.EQ.1) CUR=CA If (K.EQ.2) CUR=CR I F (CUR, GT, 1 , 0) CUR= 1 , 0 IF (CUR.LE.0.0) CUR=O.O lllOT~111 Ol+( (VIK)*( TN-X) )+CUR*RMAX 1 ( K )+RMAX2( K )-( . 55*V( K )*VOF
* ))/(YM-VOF)
*
GO 10 475
If (CA.GT. 1.0) CA=l.O If (CA.LE.O.O) CA=O.O IHOl =IITOT+( ( V( K) *( lN-X) )+CA*( RMAX1 ( K) +RMAX2( K) )-( , 55*V( K )*VO ))/( YM-VOF)
IF(LEVEL.GT.O) GO TO 475 WRITE(6,590)X,K,HTOT
590 FORMAT(1X,f6.4, lll,f21.3) ,15 CONTINUE C C C ltl rnr NEXT 18 LINES HMAX, AND THE CORRESPONDING ROTATION MODULI C ANO XINC ARE FILED C C
IIS(J)= HTOT XS(J)= X 1r (HTOT.LE.HMAX) GO TO 593 IIMAX= HTOT XM-= X 00 600 L=l, NOSTR
HMXT(L)=RMAX1(L) RHXB(L)=RMAX2(L)
600 CONflNUE co 10 1,10
593 JCT= JCT+l If (JCl.EQ.20) GO TO 595
C C ,10 COtlflNUE C C C COMPUIE H/V RATIO C C 595 I HJ-· I). 0
Vll'-'ll.O IIIJ~IIMAX/UNIT
C
--~
C C C C C
605 *
610 *
625
615 630
620 635
627
6110
650
665
6'>'j 6l0
660 6 /'j
680
(,fl 'i 611'.> 6')(1
69'>
/1)() C C C
lll IS SECT I ON PHODUCfS A PICTURE WI TH THE UN IT LOAD ON A DISPLACED PAILET. ALSO, THE H/V RATIO
lf(I.EVfL.EQ.3)GO 10 255 . WHI If (6,6051 UNIT IOHMAl(/Tlll, UNIT LOAD =',1X,f10.2,1X, 1 LBS 1 /l39,32(1Hl)/T39,32(1 IIV I ) ~/H I I E ( 6, 6 10 ) IIMAX fORMAT (/,T5,'HMAX =',1X,f7.1,1X,'LBS',5X,10(1H-), 1 ) 1 ,T39,32(1H* I I IF (NOSTR.EQ.4) GO TO 615 IF (NOSTR.EQ.2) GO TO 620
\.IIUH (6,6251 FOHMAT (T36, 1*',T52,'*',T68,'*') 1;0 ro 627 1 WHITE (6,6301 IOHMAT ( 136, 1 *', T46, '*', T58, '*', T68, '*') GO fO 627 HHITE(6,635) fORMAT( lX, T36, '*', T68, '*') GO TO 627 If (JOP.[Q. 1) GO TO 650 WR I TE ( 6, 6110) FOHMAT (T33,33(1H*)) GO lO 6115 If (NOSTR.EQ.4) GO TO 655 IF (NOSfR.EQ.2)GO TO 660 WHITE (6,6651 roRMAl ( T33, *', T49, '*', T65, '*') GO TO 645 WRI If (6,6701 fORMAT ( T33, '*', T43, 1 * 1 , T55, '*', T65, '*') GO lO 61t5 WfUl£(6,675) FOHMAl( lX, T33, '*', T65, '*') lf(NOSTR.HE.4) GO TO 645 WHITE( 6,680) roHMAT( 1x, 1116,' I', T58,' I') WR1lf(6,685/SPACE IOHMAI( IIJ6, SPACING=' ,f5.2, T71, 1 IN') ~/HITE (6,690, roHMAT (165, l'.T70,'I') ~/Ill H ( 6, 695 l XM IOHMAT (T67, XM = 1 ,1X,f5.3,1X,'IN 1 )
HHI IE (6, 700)11U fUHMAT ( IX, 1 IIMAX/IJN IT = 1 , T14, F8. 5)
OIJIPIJT MOMfNIS GENERATED ALONG EACH STRINGER
,-,-V,

C C
{O'j
715
710 1?.5
n'> 730
7?0
7'>0 71,5 7110 C C C C C C
HH 11 f( 6, 70'i) fORMAl(//,'VALU[S or MOMENTS AT XMAX') If (JOP.fQ.2) GO TO 710 WU H ( 6 , 715 ) FORMAT ( lX,15,'STRINGER #',T25,'TOP MOMENT') c;o 10 120 1/H IT [ ( 6, 7't!.~>) •ow-1111 ( IX, T5, 'STRINGER#', T25, 'TOP MOMENT', T45, 'BOTTOM MOMENT') DO 130 1=1,NOSlR
\-/H I H ( 6, 7 3 5 ) ( I ). RMAX 1 ( I ). RMAX2 ( I ) fOHMAl ( IX, TlO, 11, T25, flO. 3, T45, FlO. 3)
CONJ I NUE GO TO 740 00 745 1=1,NOSTR
WHllE (6,150) ( l),RMXT(I) ronMAT (1X,T10,11,T25,f10.3)
CONTINUE CONTINUE
CALCULATION OF WORK UP TO HHAX. WORK IS THE AREA UNDER THE X-HTOT CURVE
HRITE(6,755) 755 fORMAT(//,'VALUES Of WORK TOTAL UP TO XMAX')
WRITE(6,760) 760 FORMAl( lX, T2, 1 XINC1 , T23, 'WORK')
XMAXN=O.O
C
XR=O.O AREAlccO.O AREA2=0.0 XHl=O.O ARl=O.O AH't!.=0.0 AH3"-'0.0 tlMAX=(XM/XINC)+l XH=IIS( 1 )-HINIT AHEAl=(XR*XINC)/2 AREA2=HINIT*XINC AH3=AHEA1+AHEA2
DO 765 1=2,NMAX XHl=IIS( I )-IIS( 1-1) ARl=(XRJMXINC)/2 AR2=11S( 1-1 ) *XI NC AH3=AH1+AR2+AR3 HHI fE (6,'/70)XS( I ),AR3
7/0 FOHMAT (1X,f10.5,f20.3)
.... .... 0\

765 CONTINUE C 2~>5 CONT I NUE C C
sror IJE.IIIJG UNIT(6),SUBCHK,SUBTRACE [NI)
.... ....
.......

118
B2 - Analog Models

.i.51
.-, t
a=, • ... _, '
,-, ·.:--:·
. .. _. _:_ ,~..;;,· - fc,.,."
I
119
1>I I
- ----- ·-- _______ J
<'-I 1...\ I I
I ~-__ [", -
-\I)
·~ Lill
-I
I
--- ------- I ---- .
-. N ;:::i
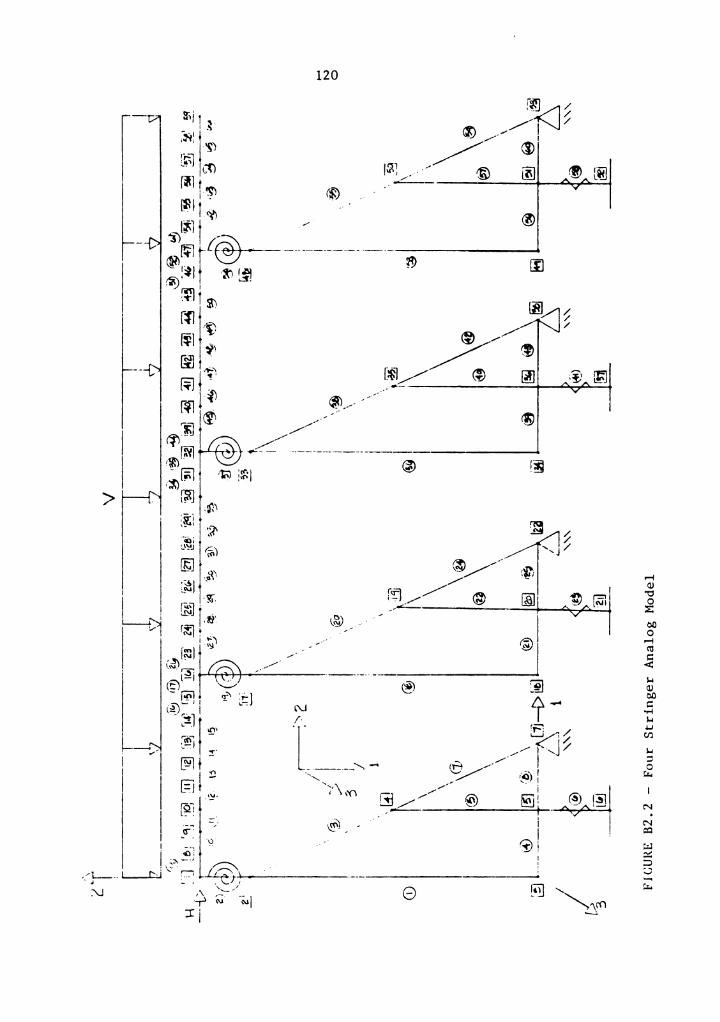
120
/ // 1'
[Y (;) ~
®
>
N .
8

121
B3 - Pallet Designs for Computer

122
Table B3.1. Three Stringer, Double-Faced Pallets Designed for K-Factor Developement
EI/L 3 Stringer Joint Aspect Ratio Characteristics 1
(lb./in.) (in./in.) M R max
1675.0 0.27 100 1000 167.9 0.27 100 1000
9.9 0.27 100 1000 1675.0 0.43 100 1000
167.9 0.43 100 1000 9.9 0.43 100 1000
1675.0 0.58 100 1000 167.9 0.58 100 1000
9.9 0.58 100 1000 1675.0 0.27 250 5500
167.9 0.27 250 5500 9.9 0.27 250 5500
1675.0 0.43 250 5500 167.9 0.43 250 5500
9.9 0.43 250 5500 1675.0 0.58 250 5500
167.9 0.58 250 5500 9.9 0.58 250 5500
1675.0 0.27 400 10000 167.9 0.27 400 10000
9.9 0.27 400 10000 1675.0 0.43 400 10000
167.9 0.43 400 10000 9.9 0.43 400 10000
1675.0 0.58 400 10000 167.9 0.58 400 10000
9.9 0.58 400 10000
1Characteristics given are 1. M (in. - lb. ) max 2. R (in.-lb./radian)

123
Table B3.2. Four Stringer, Double-Faced Pallets Designed for K-Factor Developement
EI/L 3 Stringer Joint Aspect Ratio Characteristics 1
( lb./in.) (in./in.) M R max
631.0 0.27 100 1000 85.9 0.27 100 1000
6.6 0.27 100 1000 631.0 0.43 100 1000
85.9 0.43 100 1000 6.6 0.43 100 1000
631.0 0.58 100 1000 85.9 0.58 100 1000
6.6 0.58 100 1000 631.0 0.27 250 5500
85.9 0.27 250 5500 6.6 0.27 250 5500
631.0 0.43 250 5500 85.9 0.43 250 5500
6.6 0.43 250 5500 631. 0 0.58 250 5500
85.9 0.58 250 5500 6.6 0.58 250 5500
631. 0 0.27 400 10000 85.9 0.27 400 10000
6.6 0.27 400 10000 631. 0 0.43 400 10000
85.9 0.43 400 10000 6.6 0.43 400 10000
631.0 0.58 400 10000 85.9 0.58 400 10000
6.6 0.58 400 10000
1 Characteristics given are 1. M (in. -lb. ) max 2. R (in.-lb./radian)
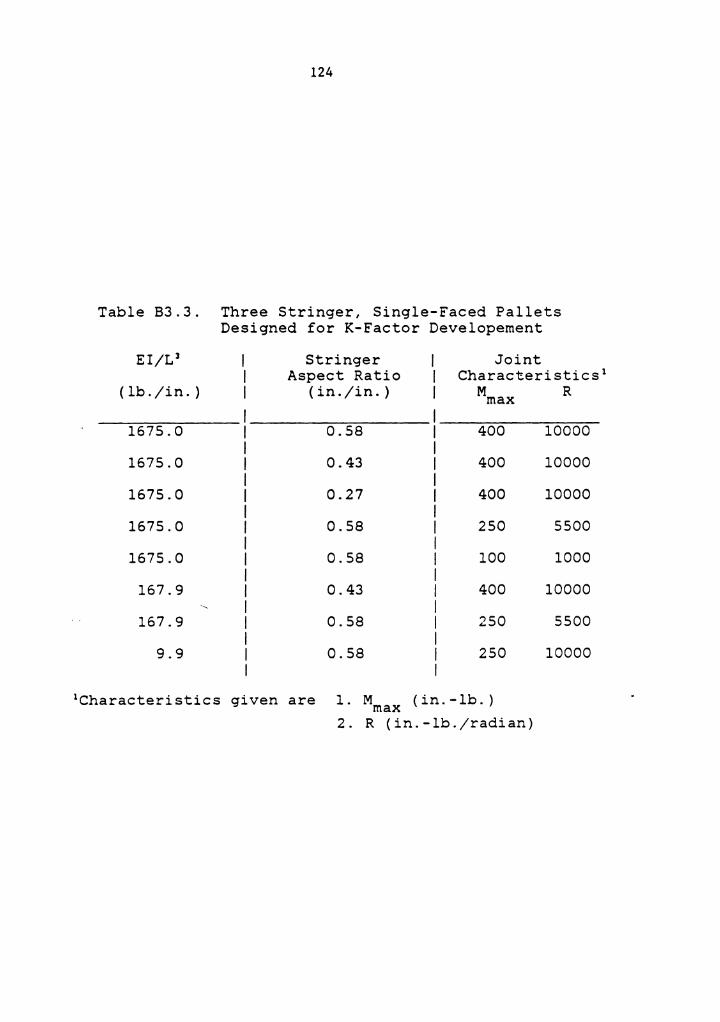
124
Table B3.3. Three Stringer, Single-Faced Pallets Designed for K-Factor Developernent
EI/L 3 Stringer I Joint Aspect Ratio I Characteristics 1
(lb. /in. } (in./in.} I M R max I
1675.0 0.58 I 400 10000 I
1675.0 0.43 I 400 10000 I
1675.0 0.27 I 400 10000 I
1675.0 0.58 I 250 5500 I
1675.0 0.58 I 100 1000 I
167.9 0.43 I 400 10000 I
167.9 0.58 I 250 5500 I
9.9 0.58 I 250 10000 I
1Characteristics given are 1. M (in. - lb. ) max 2. R (in.-lb./radian)

125
Table B3.4. Four Stringer, Single-Faced Pallets Designed for K-Factor Developement
EI/L 3 Stringer Joint Aspect Ratio Characteristics 1
( lb./in.) (in./in.) M R max
631. 0 0.58 400 10000
631.0 0.43 400 10000
631.0 0.27 400 10000
631.0 0.58 250 5500
631.0 0.58 100 1000
8.6 0.43 400 10000
8.6 0.58 250 5500
6.6 0.58 250 10000
1Characteristics given are 1. M (in.-lb.) max 2. R (in.-lb./radian)

APPENDIX C
Cl - Fastener Patterns
C2 - Construction Specifications and Unit Load for Type I Pallets
C3 - Construction Specifications for Joint Rotation Samples
C3.l - Specification of Joint Rotation Samples Fastened with Nails
C3.2 - Specification of Joint Rotation Samples Fastened with Staples
C3.3 - Specification of Joint Rotation Samples for Rate of Loading Study
C4 - Upper Deckboard MOE by Pallet
CS - Construction Specifications and Unit Load for Type II Pallets
C6 - Construction Specifications and Unit Load for Field Pallets
126

127
Cl - Fastener Patterns
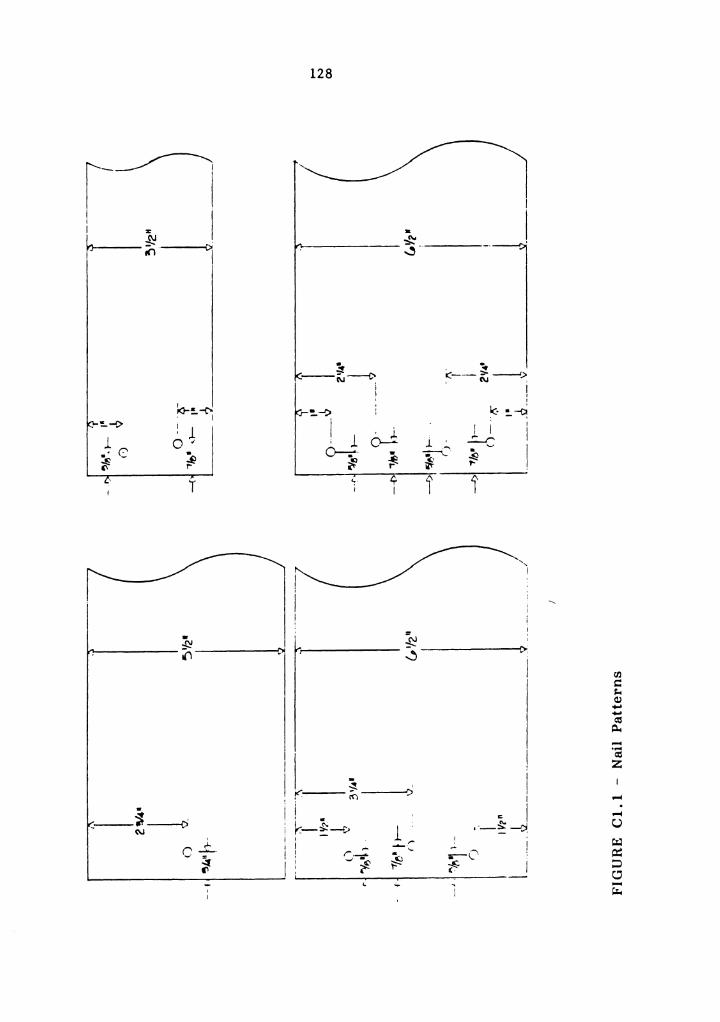
kr-·~ - I '!.-'> i l l 0 ,I
C . ~ .s " r-
r
; --~---{) , N
-' I
I
I
128
. ~ ~------~ ----
• • ,:::---> ---'> ' l\l '
I : ~-'> I( •• ~
! l . - '
' .l. I I I
~ .l. ..::...c ~· ~ .
i ~ , ,, ,. ~
': ~ i' l' I I
~ ~
rn i:: ~ Q) --a:s ~ -.....
I a:s z - I
~ I !"' ~ I -' i .. I -'
k-!-> 1 ··-~-:!. u ,.. ~ - '- ;_C' ~ ,.~ .I() ~f t=" -t- :;:)
c::, C ' -i ~
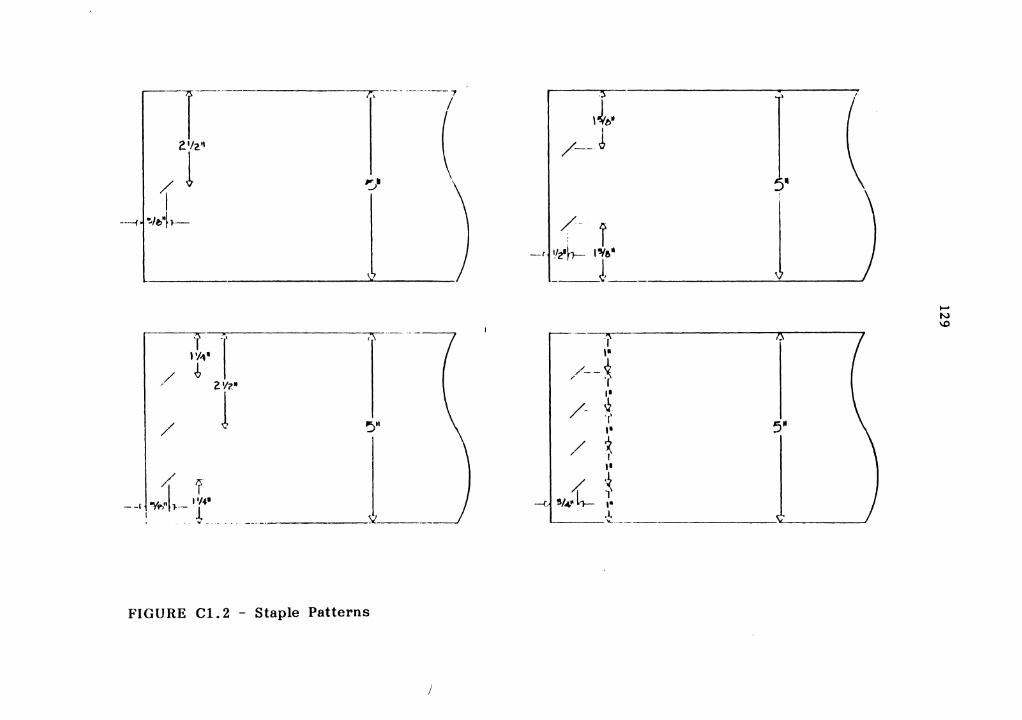
~r--··---2·12~
/ l I
----{,j ~,e,•f }-
-T -· l'/41
/ ~ / 2 'h'"
/ l /. 7
. "'Yt .1 , ., •• --Ii I"> }- t ... -----
---- - ------7
~ ( --;-,;;-- - -
'5"
~ J FIGURE Cl. 2 - Staple Patterns
it• I
/--J
•
{- i j -rl'/z'~ 'J'•
·, ,. /--{
/ ·, 1•
/- ~-·,· •• 5"
/ * ••
{±_* - .[ ___
.... N \0
130
C2 - Construction Specifications and Unit Load for Type I Pallets

Table C2. Construction Specificatons and Unit Loads Applied During Type I Testing
Pa I let I Size I Deckboards I Stringers I fasteners I Unit No. I I I I I Load
I I '--( 1 ) I I # I II I I Top I Bot. I Width Thickness # I Width Height Type II/Joint ( I bs) __ , __ , --' 1 12 X 40 1 1 I 6.5 0.5 3 1. 5 3.5 Na i 3 400
2 12 X 40 1 1 I 6.5 0.5 3 1. 5 3.5 Na I 3 400 3 12 X 40 1 1 I 6.5 0.5 3 1. 5 3.5 Nai 4 400 .... w 4 12 X 40 1 1 I 6.5 0.5 3 1. 5 3.5 Na I 4 400 .... 5 24 X 40 3 0 I 6.5 0.5 3 1. 5 3.5 Na i 4 300 6 24 X 40 3 0 I 6.5 0.5 3 1.5 3.5 Nai 4 2000 7 24 X 110 3 2 I 6.5 0.5 3 1. 5 3.5 Na i 3 700 8 24 X 40 3 2 I 6.5 0.5 3 1. 5 3.5 Na i 3 750 9 24 X 40 3 2 I 6.5 0.5 I, 3 1. 5 3.5 Nai 4 1000
10 211 X 40 3 2 I 6.5 0.5 I 3 1. 5 3.5 Nai 4 1000 11 40 X 40 3 3 I 6.5 0.5 I 3 1. 5 3.5 Na I 3 2000 12 110 X 40 3 3 I 6.5 0.5 I 3 1. 5 3.5 Na i 4 2000 13 110 X 48 9 0 I 6.5 0.5 I 3 1. 5 3.5 Na i 4 5000
( 1) All dimension in inches

132
CJ - Construction Specifications for Joint Rotation Samples
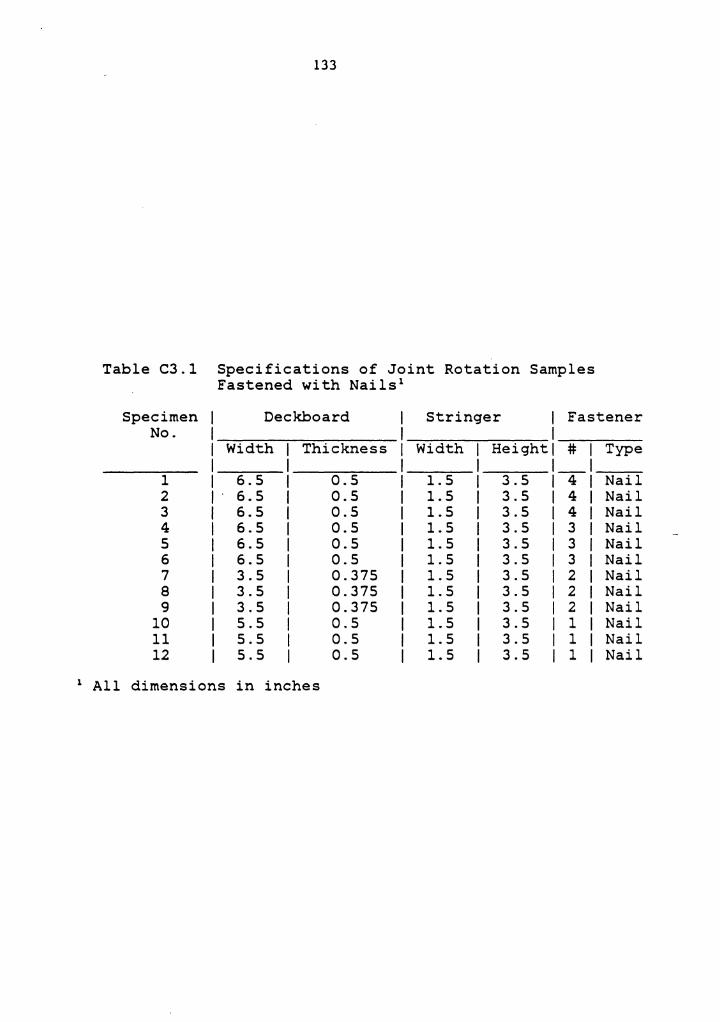
133
Table C3.l Specifications of Joint Rotation Samples Fastened with Nails 1
Specimen Deckboard Stringer Fastener No.
Width Thickness Width Height # Type
1 6.5 0.5 1. 5 3.5 4 Nail 2 6.5 0.5 1.5 3.5 4 Nail 3 6.5 0.5 1.5 3.5 4 Nail 4 6.5 0.5 1. 5 3.5 3 Nail 5 6.5 0.5 1. 5 3.5 3 Nail 6 6.5 0.5 1. 5 3.5 3 Nail 7 3.5 0.375 1. 5 3.5 2 Nail 8 3.5 0.375 1. 5 3.5 2 Nail 9 3.5 0.375 1. 5 3.5 2 Nail
10 5.5 0.5 1.5 3.5 1 Nail 11 5.5 0.5 1. 5 3.5 1 Nail 12 5.5 0.5 1.5 3.5 1 Nail
1 All dimensions in inches
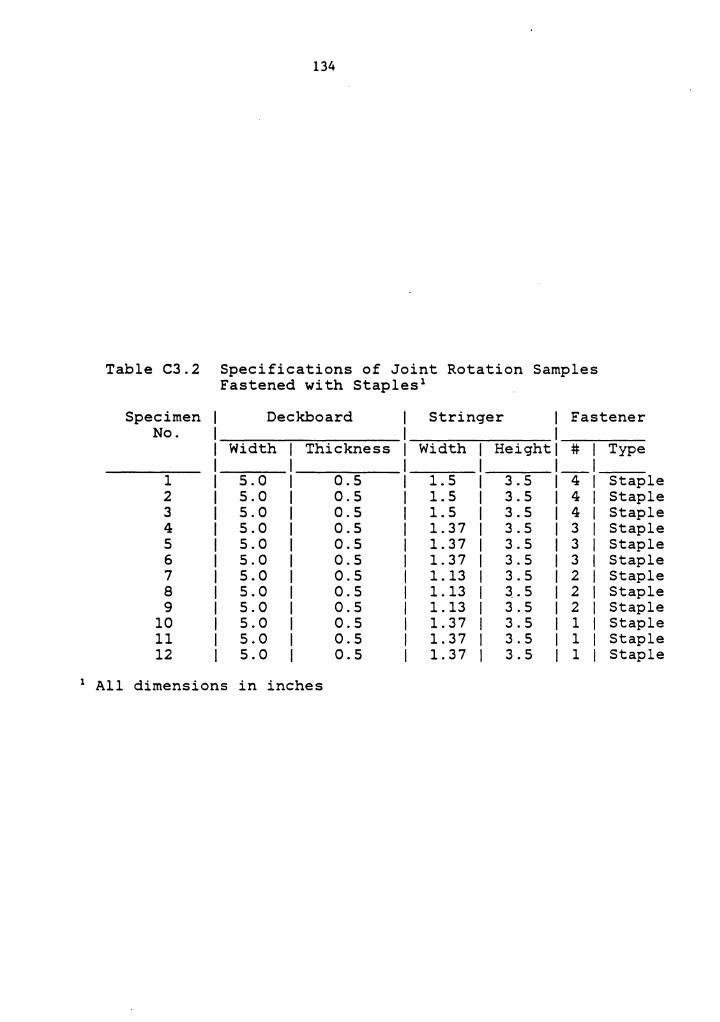
134
Table C3.2 Specifications of Joint Rotation Samples Fastened with Staples 1
Specimen Deckboard Stringer Fastener No.
Width Thickness Width Height # I Type _I
1 5.0 0.5 1. 5 3.5 4 I Staple 2 5.0 0.5 1.5 3.5 4 I Staple 3 5.0 0.5 1.5 3.5 4 I Staple 4 5.0 0.5 1.37 3.5 3 I Staple 5 5.0 0.5 1. 37 3.5 3 I Staple 6 5.0 0.5 1. 37 3.5 3 I Staple 7 5.0 0.5 1.13 3.5 2 I Staple 8 5.0 0.5 1.13 3.5 2 I Staple 9 5.0 0.5 1.13 3.5 2 I Staple
10 5.0 0.5 1. 37 3.5 1 I Staple 11 5.0 0.5 1. 37 3.5 1 I Staple 12 5.0 0.5 1. 37 3.5 1 I Staple
1 All dimensions in inches
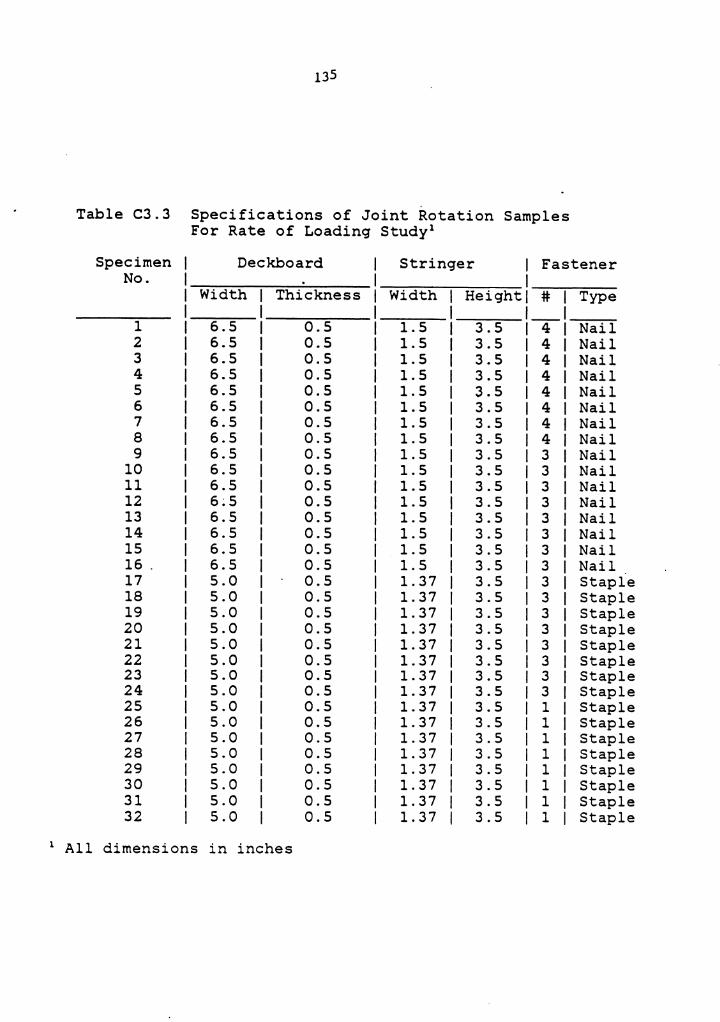
135
Table C3.3 Specifications of Joint Rotation Samples For Rate of Loading Study 1
Specimen Deckboard Stringer I Fastener No. I
Width Thickness Width Height! # Type
'-1 6.5 0.5 1.5 3.5 4 Nail 2 6.5 0.5 1.5 3.5 4 Nail 3 6.5 0.5 1.5 3.5 4 Nail 4 6.5 0.5 1.5 3.5 4 Nail 5 6.5 0.5 1.5 3.5 4 Nail 6 6.5 0.5 1.5 3.5 4 Nail 7 6.5 0.5 1.5 3.5 4 Nail 8 6.5 0.5 1.5 3.5 4 Nail 9 6.5 0.5 1.5 3.5 3 Nail
10 6.5 0.5 1.5 3.5 3 Nail 11 6.5 0.5 1.5 3.5 3 Nail 12 6~5 0.5 1.5 3.5 3 Nail 13 6.5 0.5 1.5 3.5 3 Nail 14 6.5 0.5 1.5 3.5 3 Nail 15 6.5 0.5 1.5 3.5 3 Nail 16. 6.5 0.5 1. 5 3.5 3 Nail 17 5.0 0.5 1.37 3.5 3 Staple 18 5.0 0.5 1.37 3.5 3 Staple 19 5.0 0.5 1.37 3.5 3 Staple 20 5.0 0.5 1.37 3.5 3 Staple 21 5.0 0.5 1.37 3.5 3 Staple 22 5.0 0.5 1.37 3.5 3 Staple 23 5.0 0.5 1.37 3.5 3 Staple 24 5.0 0.5 1.37 3.5 3 Staple 25 5.0 0.5 1.37 3.5 1 Staple 26 5.0 0.5 1.37 3.5 1 Staple 27 5.0 0.5 1.37 3.5 1 Staple 28 5.0 0.5 1.37 3.5 1 Staple 29 5.0 0.5 1.37 3.5 1 Staple 30 5.0 0.5 1. 37 3.5 1 Staple 31 5.0 0.5 1. 37 3.5 1 Staple 32 5.0 0.5 1.37 3.5 1 Staple
1 All dimensions in inches
136
C4 - Upper Deckboard MOE by Pallet

137
Table C4. Upper Deckboard MOE by Pallet
Pallet No. Species MOE Average MOE PSixlO' PSixlO'
1 Aspen 1.10 1.17 1.14
·· 1.1s 1.18 1.16 1.28
2 Aspen 1.34 1. 33 1.30 1.30 1.32 1.33 1.33 1.40
3 Aspen 1.16 1.18 1.16 1.17 1.18 1.18 1.22
4 Aspen 1.20 1.23 1.23 1.30 1.22
5 Aspen 1.13 1.09 1.05 0.98 0.99 1.10 1.10 1.04 1.35
6 Aspen 0.98 0.99 0.99 0.98 0.99
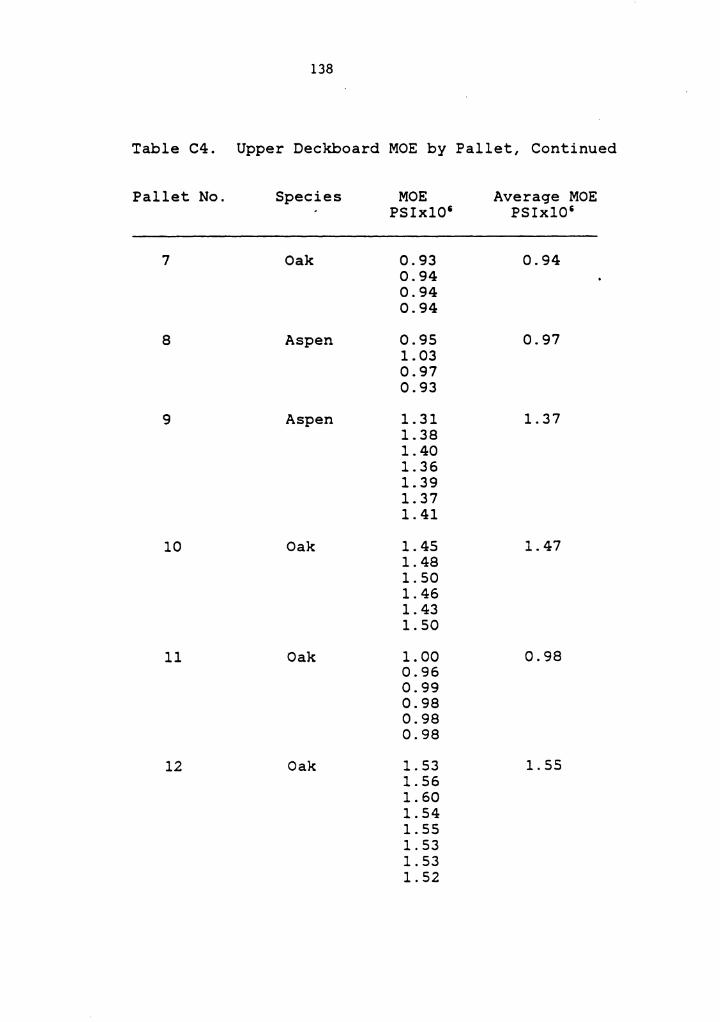
138
Table C4. Upper Deckboard MOE by Pallet, Continued
Pallet No. Species MOE Average MOE PSixl0 1 PSixlO'
7 Oak 0.93 0.94 0.94 0.94 0.94
8 Aspen 0.95 0.97 1.03 0.97 0.93
9 Aspen 1.31 1.37 1.38 1.40 1.36 1.39 1.37 1.41
10 Oak 1.45 1. 47 1.48 1. 50 1.46 1.43 1. so
11 Oak 1.00 0.98 0.96 0.99 0.98 0.98 0.98
12 Oak 1. 53 1. 55 1. 56 1.60 1.54 1.55 1. 53 1. 53 1. 52

139
Table C4. Upper Deckboard MOE by Pallet, Continued
Pallet No. Species . MOE Average MOE PSixlO' PSixlO'
13 Oak 1.58 1.48 1.41 1.48 1. so 1.41 1. 49
14 Aspen 1.23 1.26 1.28 1.18 1.31 1.26 1.29
15 Oak 1.40 1.39 1.41 1.37 1.39 1.37 1.39
16 Oak 1.36 1.38 1.40 1.38 1. 33 1.33 1.31 1.41 1.51
17 Oak 1.06 1.10 1.10 1.07 1.10 1.15
18 Oak 1.20 1.24 1.25 1.24 1.23 1.27
140
CS - Construction Specifications and Unit Load for Type II Pallets
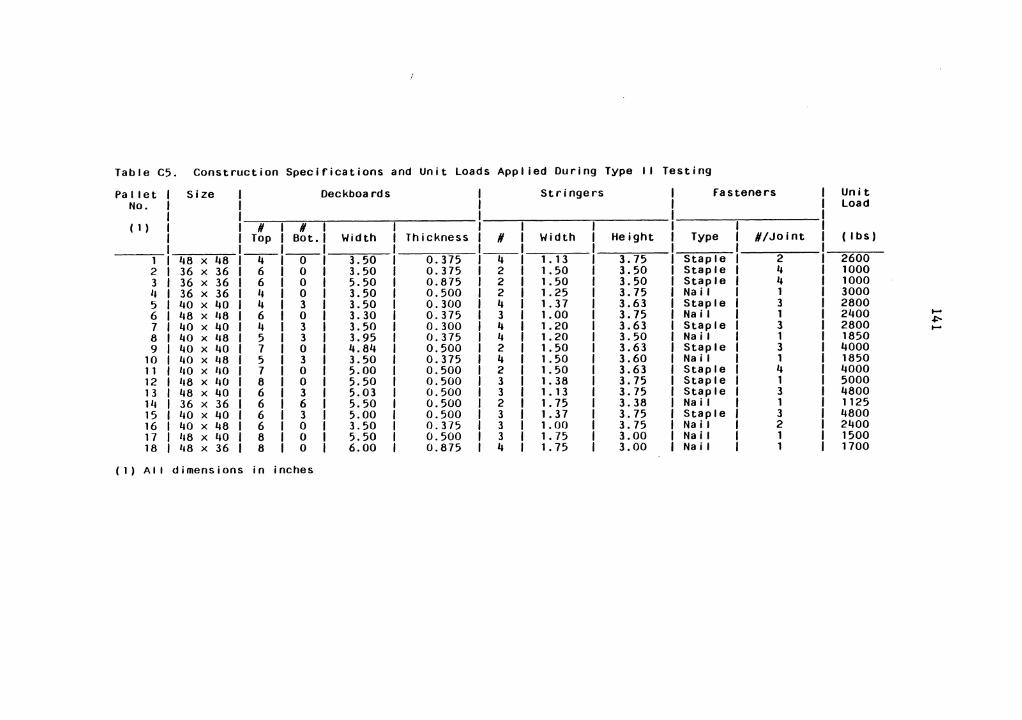
Table C5. Construction Specifications and Unit Loads Applied During Type II Testing
Pa I let I Size I Deckboards I Stringers I fasteners I Unit No. I I I I I Load
I I I __ ( 1 ) I I N I N I I
· Top I Bot. I Width Thickness N I Width Height Type #/Joint ( I bs) __ I __ I __ I
1 I 48 x 48 4 0 3.50 0.375 4 1. 13 3.75 Staple 2 2600 2 I 36 x 36 6 0 3.50 0.375 2 1. 50 3.50 Staple 4 1000 3 I 36 x 36 6 0 5.50 0.875 2 1. 50 3.50 Staple 4 1000 11 I 36 x 36 11 0 3.50 0.500 2 1. 25 3.75 Na i I 1 3000 5 I 40 x 40 4 3 3.50 0.300 4 1. 37 3.63 Staple 3 2800 6 I 48 x 118 6 0 3.30 0.375 3 1.00 3. 75 Na i I 1 2400 .... 7 I 40 x 40 4 3 3.50 0.300 4 1. 20 3.63 Staple 3 2800 .s:,. .... 8 I IJO x 118 5 3 3.95 0.375 4 1. 20 3.50 Na i I 1 1850 9 I IJO x 40 7 0 4.84 0.500 2 1. 50 3.63 Staple 3 4000
10 I 110 x 48 5 3 3.50 0.375 4 1. 50 3.60 Na i I 1 1850 11 I 110 X 110 7 0 5.00 0.500 2 1. 50 3.63 Staple 4 4000 12 I 118 x 110 8 0 5.50 0.500 3 1. 38 3.75 Staple 1 5000 13 I IJ8 x 40 6 3 5.03 0.500 3 1. 13 3.75 Staple 3 4800 14 I 36 x 36 6 6 5.50 0.500 2 1. 75 3.38 Na i I 1 1125 15 I 1,0 x !JO 6 3 5.00 0.500 3 1. 37 3. 75 Staple 3 4800 16 I IJO x IJ8 6 0 3.50 0.375 3 1. 00 3.75 Na i I 2 21JOO 17 I 118 x 110 8 0 5.50 0.500 3 1. 75 3.00 Na 11 1 1500 18 I 118 x 36 8 0 6.00 0.875 4 1. 75 3.00 Na i I 1 1700
(1) Al I dimensions in inches

142
C6 - Construction Specifications and Unit Load for Field Pallets
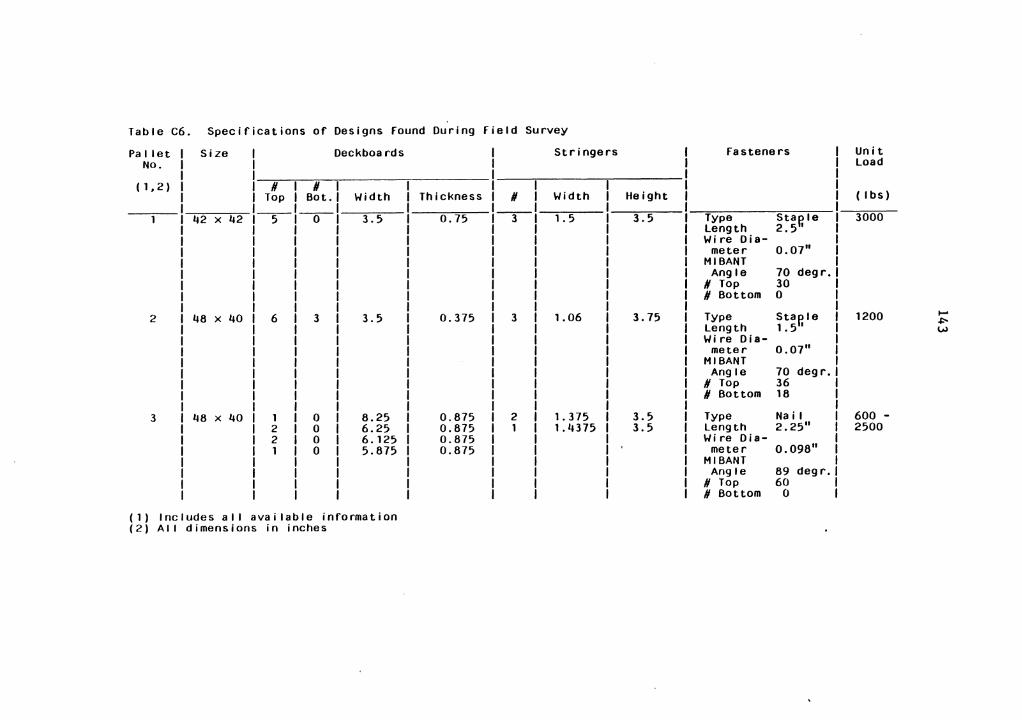
Table C6. Specifications of Designs found During field Survey
Pallet I Size I Deckboa rds I Stringers I fasteners I Unit No. I I I I I Load
I I I ( 1 , 2) I I # I II I I I
I Top I Bot. I Width I Thickness I # I Width I Height I I ( I bs) I __ I __ I I I __ I I I I
42 x 42 I 5 I 0 I 3.5 I 0.75 I 3 I 1. 5 ! 3.5 ! Type Star,le I 3000 Length 2.5 I
Wire Dia-meter 0.07 11
MIBANT Angle 70 degr.
# Top 30 # Bottom 0
I 2 I 48 x 40 I 6 I 3 I 3.5 I 0. 375 I 3 I 1. 06 I 3. 75 I Type Star,le I 1200 .....
.i:-, Length 1. 5 I I w Wire Dia-
meter 0.07 11
MIBANT Angle 70 deg r.
# Top 36 II Bottom 18
I 3 I 48 x 40 I 1 I 0 I 8.25 I 0.875 I 2 I 1. 375 I 3.5 I Type Na i I I 600 -
2 I 0 I 6.25 I 0.875 I 1 I 1.4375 I 3.5 I Length 2.25 11 I 2500 2 I 0 I 6. 125 I 0.875 I I I I Wire Di a-1 I 0 I 5.875 I 0.875 I I I I meter 0.098"
MIBANT Angle 89 degr.
# Top 60 # Bottom 0
( 1 ) Includes al I available information (2) All dimensions in inches
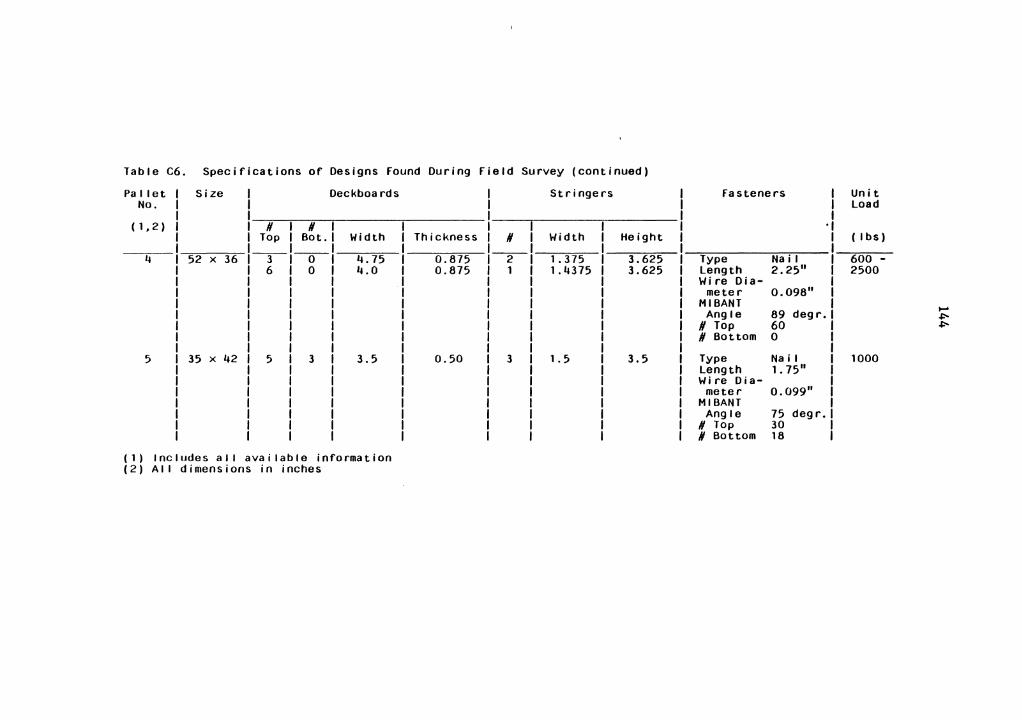
Table C6. Specifications of Designs Found During Field Survey (continued)
Pa I let I Size I Deckboa rds No. I I
I I ( 1 , 2) I I H I H I
· Top I Bot.I Width __ I __ I
4 I 52 x 36 I 3 I 0 I 4.75 6 I 0 I 4.0
5 I 35 x 42 I 5 I 3 I 3.5
(1) Includes all available information (2) Al I dimensions in inches
I Stringers
I Thickness I H I Width I Height I I __ I I I 0.875 I 2 I 1.375 I 3.625 I 0.875 I 1 I 1.4375 I 3.625
I 0.50 I 3 I 1. 5 I 3.5
I Fasteners Unit Load
( I bs)
I Type Na i I I Length 2.25 11
600 -2500
Wire Dia-meter 0.098 11
MIBANT Angle 89 degr. I-'
~ # Top 60 ~
# Bottom 0
I Type Na i I Length 1.75"
1000
Wire Di a-meter 0.099 11
MIBANT Angle 75 degr.
# Top 30 # Bottom 18

APPENDIX D
Dl - Result of Joint Rotation Tests
Dl.1 - Test Results of Joint Rotation Samples for Nails
Dl.2 - Test Results of Joint Rotation Samples for Staples
Dl.3 - Test Results of Joint Rotation Samples for Rate of Loading Study
D2 - Regress'ion Equations for Individual Joints
D2.1 -
D2.2 -
D2.3 -
D2.4 -
K-factor R-Square Pallets
K-factor R-Square Pallets
K-factor R-Square Pallets
K-factor R-Square Pallets
Regression Equations and Corresponding Values for 3 Stringer Single-faced
Regression Equations and Corresponding Values for 3 Stringer Double-faced
Regression Equations and Corresponding Values for 4 Stringer Single-faced
Regression Equations and Corresponding Values for 4 ,Stringer Double-faced'
145
146
Dl - Result of Joint Rotation Tests

Table 01.1 Test Results of Joint Rotation Samples for Nalls
Joint No. I Deckboa rd Stringer Rotation Mmax Mmax Modulus Actual Predicted
MC G MC G (%) (%) ( in-lb/radian) ( In- I b) ( in- I b)
1 31 .71 31 .69 4650 660 643 2 28 .69 30 .66 5575 785 543 3 30 .65 30 .63 4775 655 543 4 31 .63 32 .64 4870 555 350 5 30 .63 29 .61 5210 630 350 6 30 .62 33 .65 4920 765 420 ....
~ 7 33 .69 34 .63 9870 343 378 ..... 8 36 . 63 35 .62 11210 515 295 9 34 .64 34 .64 8900 342 284
10 32 .64 30 .60 4995 175 260 11 32 .67 37 .65 6210 248 247 12 35 .66 36 .66 5295 327 263
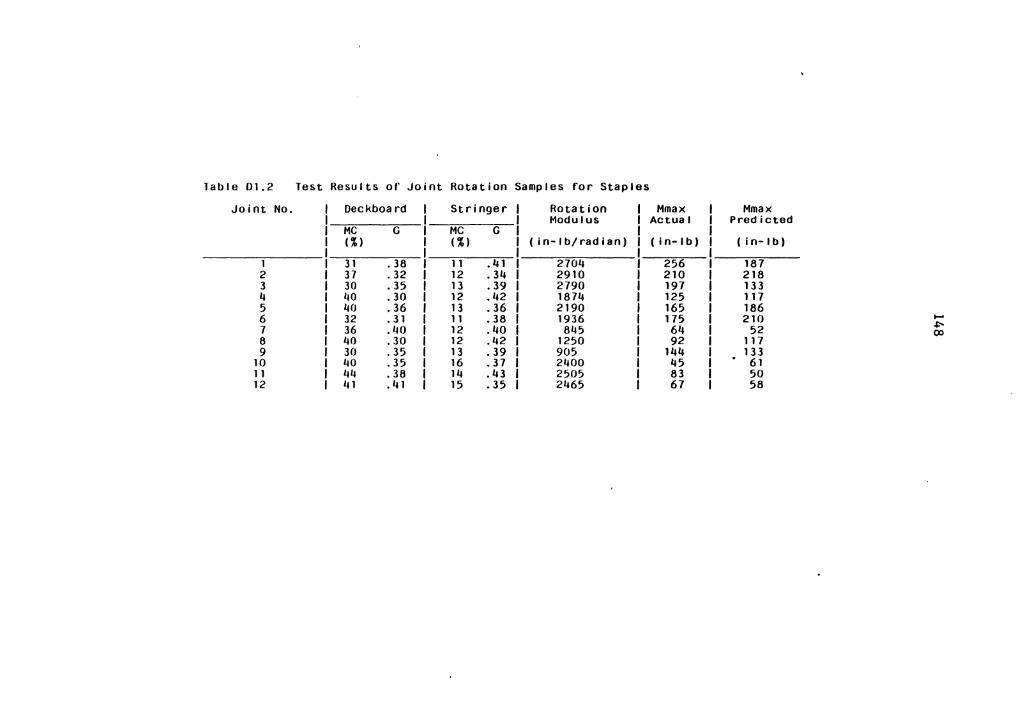
Table 01.2 Test Results of Joint Rotation Samples for Staples
Joint No. I Deckboa rd Stringer Rotation Mmax Mmax Modulus Actual Predicted
MC G MC G (%) (%) ( in-lb/radian) ( in-lb) ( in- I b)
1 31 .38 11 . 41 2704 256 187 2 37 .32 12 .34 2910 210 218 3 30 .35 13 .39 2790 197 133 4 110 .30 12 .42 1874 125 117 5 40 .36 13 .36 2190 165 186 6 32 . 31 11 .38 1936 175 210 .... 7 36 .40 12 .40 845 64 52 ~
00 8 40 .30 12 .42 1250 92 117 9 30 .35 13 .39 905 144 133
10 40 .35 16 .37 2400 45 . 61 11 44 .38 14 .43 2505 83 50 12 41 .41 15 .35 2465 67 58
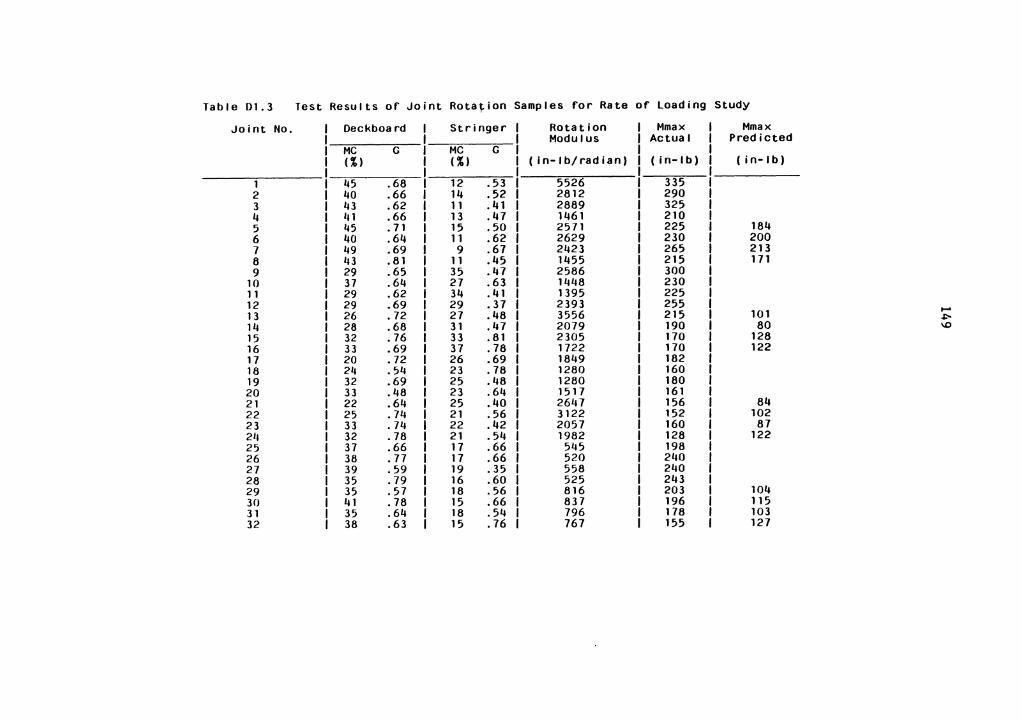
Table D1.3 Test Results of Joint Rota~ion Samples for Rate of Loading Study
Joint No. I Deckboa rd Stringer Rotation Mmax I Mmax Modulus Actual I Predicted
MC G MC G I ( % ) ( % ) ( In-lb/radian) ( in- I b) I ( in- I b)
1 45 .68 12 .53 5526 335 2 40 .66 14 .52 2812 290 3 43 .62 11 .41 2889 325 4 111 .66 13 .47 1461 210 5 ll5 . 71 15 .50 2571 225 I 184 6 40 .64 11 .62 2629 230 I 200 7 49 .69 9 .67 2423 265 I 213 8 43 . 81 11 .45 1455 215 I 171 9 29 .65 35 .47 2586 300
10 37 .64 27 .63 1448 230 11 29 .62 34 . 41 1395 225 12 29 .69 29 .37 2393 255 i 13 26 . 72 27 .48 3556 215 101 .....
.fl-14 28 .68 31 .47 2079 190 I 80 '° 15 32 .76 33 . 81 2305 170 I 128 16 33 .69 37 .78 1722 170 I 122 17 20 • 72 26 .69 1849 182 18 24 .54 23 .78 1280 160 19 32 .69 25 .48 I 1280 180 20 33 .48 23 .64 1517 161 21 22 .64 25 .40 2647 156 I 84 22 25 .74 21 .56 3122 152 I 102 23 33 . 74 22 .42 2057 160 I 87 211 32 .78 21 .54 1982 128 I 122 25 37 .66 17 .66 545 198 26 38 • 77 17 .66 520 240 27 39 .59 19 .35 558 240 28 35 .79 16 .60 525 243 29 35 .57 18 .56 816 203 I 104 30 41 .78 15 .66 837 196 I 115 31 35 .64 18 .54 796 178 I 103 32 38 .63 15 .76 767 155 I 127

150
D2 - Regression Equations for Individual Joints

TABLE 02.1. K-factor Regression Equations and Corresponding R-Square Values for 3 Stringer Single-faced Pa I lets
Ks31
K-factor Equations (1)
5.68635132 - 0.00002889(V) - 0.00009837(L5) - 0.00000072([) + 0.17502467( I) - 0.39947025(W) - 0.79014411(0) - 0.00018179(H)
Ks32 = 5.666695011 - 0.00002389(V) - 0.00010992(L5) - 0.00000067([) - 0.41079192(W) - 0.77619802(0) - 0.00014175(H)
Ks33 = 250.7705817 - 0.0008093(V) + 0.0000383([) - 16.4948666( I) - 55.7927888(W) - 58.8150714(D) - 0.0065595(H)
(1) Symbol Definition:
L = clear span distance between stringers V = un i L I oa d E = MOE of top deckboards I = moment of inertia of top deckboards combined W = average width of stringers D = stringer height H = average total Mmax along one stringer
R-Square
o. 738
0.848
0.762
.... V1 ....

TABLE D2.2. K-factor Regression Equations and Corresponding R-Square Values for 3 Stringer Double-Faced Pallets
K-factor Equations (1)
Ks31 = 2.43228515 - 0.00006528(L 5 ) - 0.0000011(E)+ 0.7814489( I) - 0.21001454(W) - 0.00004962(M)
Ks32 = 61.24254207 + 0.00172063(V) - 0.00067536(~) - 0.0000115(E) + 1.37425331(1) - 11.73232568(W) - 9.31846199(0) + 0.00115825(M)
Ks33 = 4.07106448 - 0.00008382(L 9 ) - 0.00000046(E) + 0.33723721( I) - 0.89071147(W) - 0.29950822(D) - 0.00005554(M)
Ks31J = -5.93345235 + 0.00001408(V) + 0.00009903(L!) + 0.00000148(E) - 1.06035888(1) + 1.06580506(W) + 0.40450276(0) + 0.00009852(M)
Ks35 = 197.9453275 - 0.0011024(V) - 0.0005403(L!) - 0.0000144(E) + 14.4007571( I) - 19.5586775(W) -39.9635269(0) - 0.0031941(M)
Ks36 = -2.61288313 + 0.00004959(L5) + 0.00000035(E) - 0.26715823( I)+ 0.5579279(W) + 0.19528509(0) + 0.00004583(M)
(1) Symbol Definition:
L = clear span distance between stringers V = unit load E = MOE of top deckboards I = moment of inertia of top deckboards combined W = average width of stringers o = stringer height M = average total Mmax along one stringer
R-Square
0.783
0.702
0.212
0.656
0.693
0.060
.... VI N

TABLE 02.3. K-factor Regression Equations and Corresponding R-Square Values for 4 Stringer Single-faced Pa I lets ·
K-factor Equations (1)
Ks41 = 5.0032253 - 1.20504034(0) - 0.52384469(W) - 0.00196144(La) + 0.00000022(E)( I) - 0.00035932(H)
Ks42 = 15.10242161 - 3.14771579(0) - 2.50884051(W) + 0.00184796(~) - 0.00000036([)( I) - 0.00042289(H)
Ks43 = 10.5117218 - 2.32754501(0) - 1.20354758(W) + 0.00167631(L5) + 0.00000022(E)( I) - 0.00058701(H)
Ks44 = -80.50777616 + 14.71527213(0) + 22.43734744(W) + 0.00105292(~) - 0.00000017(E)(I) - 0.0013589(H)
(1) Symbol Definition:
L = clear span distance between the outer and its adjacent stringer V = unit load E = MOE of top deckboards I = moment of inertia of top deckboards combined W = average width of stringers D = stringer height M = average total Mmax along one stringer
R-'§°quare
0.953
0.904
0.935
0.748
.... VI w
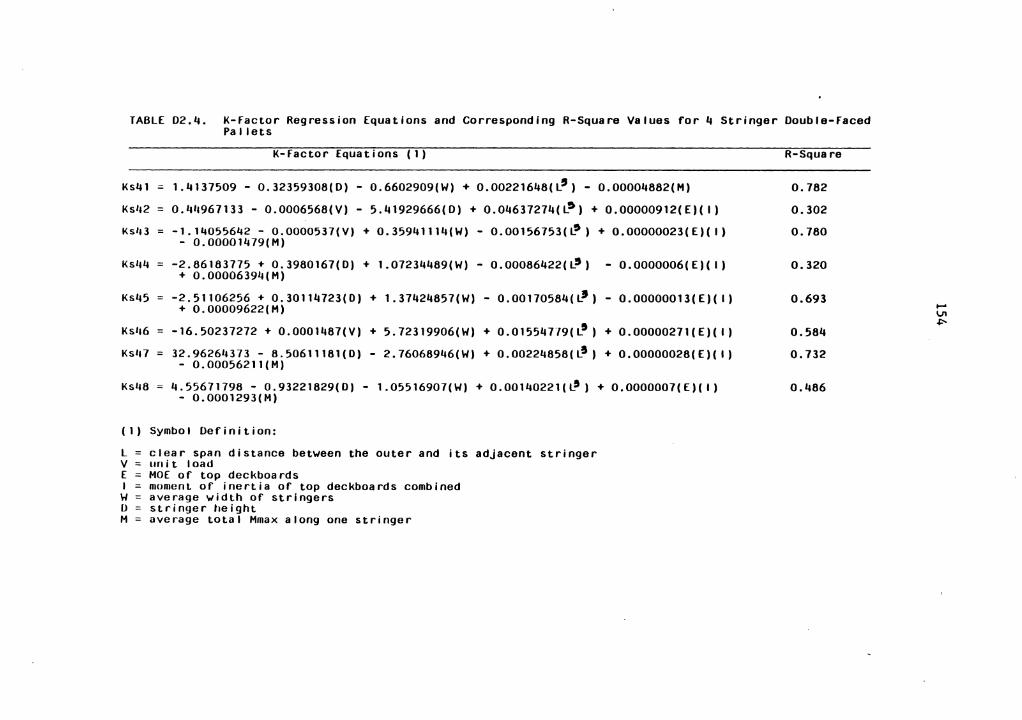
TABLE 02.4. K-factor Regression Equations and Corresponding R-Square Values for 4 Stringer Double-faced Pa I lets
K-factor Equations (1)
Ks41 = 1.4137509 - 0.32359308(0) - 0.6602909(W) + 0.00221648(L') - 0.00004882(H)
Ks1,2 = 0.411967133 - 0.0006568(V) - 5.41929666( 0) + 0.04637274( l~) + 0.00000912( E)( I)
Ks43 = -1.14055642 - 0.0000537(V) + 0.35941114(W) - 0.00156753(~) + 0.00000023(E)( I) - 0.00001479(M)
Ksl14 = -2.86183775 + 0.3980167(0) + 1.07234489(W) - 0.00086422(L9) - 0.0000006(E)( I) + 0.00006394(M)
Ks45 = -2.51106256 + 0.30114723(0) + 1.37424857(W) - 0.00170584(~) - 0.00000013(E)( I) + 0.00009622(M)
Ks46 = -16.50237272 + 0.0001487(V) + 5.72319906(W) + 0.01554779(~) + 0.00000271(E)( I)
Ks47 = 32.96264373 - 8.50611181(0) - 2.76068946(W) + 0.00224858(~) + 0.00000028(E)( I) - 0.0005621l(H)
Ks48 = 4.55671798 - 0.93221829(0) - 1.05516907(W) + 0.00140221(~) + 0.0000007(E)( I) - 0.0001293(M)
(1) Symbol Definition:
L = clear span distance between the outer and its adjacent stringer V = unit load E = MOE of top deckboards I = moment of inertia of top deckboards combined W = average width of stringers D = stringer height M = average total Mmax along one stringer
R-Squa re
0.782
0.302
0.780
0.320
0.693
0.584
0.732
0.486
..... V1
"'

The vita has been removed from the scanned document