lateral variation in the production and fate of
TRANSCRIPT

Vol. 32: 149-160, 1986 MARINE ECOLOGY - PROGRESS SERIES Mar. Ecol. Prog. Ser. Published September 18
Lateral variation in the production and fate of phytoplankton in a partially stratified estuary
'Horn Point Laboratories, University of Maryland Center for Environmental and Estuarine Studies. Box 775. Cambridge, Maryland 21613. USA
'Chesapeake Biological Laboratory, University of Maryland Center for Environmental and Estuarine Studies. Box 38, Solomons, Maryland 20688, USA
3Biology Department. George Mason University, Fairfax, Virginia 22030, USA
ABSTRACT: It is generally believed that the high productivity of many estuaries is a consequence of both allochthonous nutrient inputs and autochthonous recycling of nutrients among producers and decomposers of organic matter. However, the mechanisms by which nutrients are recycled between sources and sinks are not clear We have documented time-dependent variations in density structure along a transect normal to the main axis of Chesapeake Bay which may be important in this regard. These variations influenced lateral distributions of dissolved inorganic nutrients, oxygen, chlorophyll a, and bacterioplankton and appeared to be responsible for high phytoplankton production over the flanks of the main channel relative to production over the channel. Vertical and seasonal variations in bacterial abundance were correlated with phytoplankton biomass, and increases in bacterial abun- dance were related to the development of phytoplankton bloon~s with lags of 0 to 6 d. Bacterial biomass and production were high throughout the study period, averaging 20 O/O to over 50 O/O of phytoplankton biomass and production, respectively. Absolute levels of bacterial abundance were among the highest reported and suggest that bacteria are responsible for a large function of the carbon flux in Chesapeake Bay. Relations among phytoplankton production, bacterial abundance and sediment trap collections indicate that variations in density structure reflect a transverse circulation which may explain how nutrients regenerated below the pycnocline are rapidly recycled into the euphotic zone above. This could be an important mechanism by which river-borne nutrient inputs during spring are coupled to high phytoplankton production during summer.
INTRODUCTION
The high productivity characteristic of many estuaries has been attributed to the supply and recycl- ing of nutrients (Nixon 1981, Boynton et al. 1982). Estuaries appear to be particularly responsive to increases in nutrient supply due to the process of biochemical circulation (Redfield 1955, Ketchum 1967) which enhances the retention and recycling of nu- trients in estuarine systems. Inputs of nutrients to many of these systems have increased rapidly during the last 30 to 40 yr due to anthropogenic nutrient loading (e.g. Walsh et al. 1981, Nixon & Pilson 1983). The produc- tion of particulate organic matter by phytoplankton and heterotrophic bacterioplankton has been shown to increase in response to such inputs on annual and
UMCEES Contribution No. 1718
O Inter-Research/Printed in F. R. Germany
semiannual time scales (Boynton et al. 1982, Bird & Kalff 1984, Hobbie & Cole 1984). However, the quan- titative effects of nutrient loading on estuarine produc- tion are poorly understood, partly as a consequence of temporal and spatial variations in the relations among nutrient input and the processes of organic production and nutrient regeneration.
Many estuaries exhibit lags between inputs of nu- trients and increases in phytoplankton production (Boynton et al. 1982). For example, in Chesapeake Bay and its major tributaries (Kemp & Boynton 1984), river- borne inputs of inorganic nitrogen and phosphorus are assimilated near the head of the salt-intruded reach several kilometers upstream of the productivity max- imum which occurs at intermediate salinities (5 to 15 %o). Likewise, while most of the annual input of nu- trients occurs during late winter and early spring as a consequence of high freshwater run-off, maximum

150 Mar. Ecol. Prog. Ser. 32: 149-160, 1986
phytoplankton production occurs during summer when freshwater run-off and associated nutrient inputs are low (Taft et al. 1980). Benthic nutrient regeneration rates parallel the spatial and temporal patterns of phy- toplankton production and are high enough to support over 50 % of phytoplankton production (Kemp & Boyn- ton 1981, 1984, Boynton & Kemp 1985). These observa- tions suggest a conceptual model that relates summer phytoplankton production to nutrient inputs during winter-spring via organic deposition and temperature- dependent benthic decomposition and nutrient regen- eration (Kemp & Boynton 1984). An apparent short- coming of the model is that the flux of regenerated nutrients into the surface layer must be hghest during the summer when pycnocline stabihty is strongest (Taft et al. 1980, Officer et al. 1984, Selinger et al. 1985).
In Chesapeake Bay, as in most estuaries, inferences concerning the spatial and temporal relations between nutrient inputs and the production and fate of phyto-
plankton biomass have been based on measurements along the longitudinal axis of the main channel. Such analyses assume that lateral variabihty normal to the main axis of the system is unimportant and that bottom water below the pycnocline is effectively isolated from surface water (e.g. Taft et al. 1980, Officer et al. 1984, Seliger et al. 1985). However, lateral variation may significantly influence the biochemical circulation and productivity of estuaries, especially in systems such as Chesapeake Bay where the main channel (>9 m deep) occupies 35 O/O of the Bay's area compared to the shallow flanks of the channel ((6 m deep) that account for 50 O/O of the Bay's area (Pritchard 1952).
Lateral variation in water column depth is likely to influence phytoplankton production. Maximum poten- tial production in a mixed water column is inversely related to depth, as a consequence of both light attenu- ation (Takahashi & Parsons 1972, Bannister 1974, Wofsy 1983) and nutrient recycling (Fee 1979, Nixon 1981, Boynton et al. 1982). In addition, depending on the continuity and orientation of the pycnocline normal to the axis of the channel, the potential exists for lateral transport of nutrients onto the shallow flanks. Our goal here is to determine the extent to which lateral varia- tions occur and to evaluate these variations in terms of their potential as a mechanism for coupling regenera- tion below the pycnocline to phytoplankton production in the surface layer.
METHODS
Five stations were occupied at 3 to 4 d intervals along an east-west transect of Chesapeake Bay at 38" 33.5' N from 16 July through 27 October, 1984 (Fig. 1). Two additional transects 10 km to the north along 38" 41.0' N and 10 km to the south along 38" 28.0' N were occupied at weekly intervals beginning on 21 August. Our report WIU focus on the middle transect where we have the longest time-series and the greatest temporal resolution.
Water samples were collected with a diaphragm pump and a 2.5 cm diameter hose. Temperature, sahn- ity, and dissolved oxygen were measured at 1 m inter- vals using a YSI model 57 DO meter and YSI model 33 sahnity meter. Particulate organic carbon and nitrogen were determined with a Perkin-Elmer model 240B elemental analyser, chlorophyll a with a Turner Designs fluororneter following extraction with 90 O/O
acetone, and dssolved inorganic nutrients by col- orimetry with a Technicon autoanalyser following f i l - tration.
Phytoplankton production was estimated by the 14C technique from 24 h ship-board incubations under natural light (Malone 1982). Total dissolved inorganic

Malone et al.: Lateral variati.ons in estuarine phytoplankton
carbon was measured with a Beckman model 864 infrared analyser after acidification. Samples were col- lected from a depth of 1 m and incubated at surface water temperature under light levels of 100, 50, 20, 8 and 1 % of surface irradiance. I4C activity was mea- sured in Ready-Solv with a Packard Tri-Carb model 461 liquid scintillation counter. GF/F glass fiber filters were used for all filtrations (pre-combusted for organic carbon and nitrogen). The 1 % light depth ranged in depth from 3 to 6 m and was confined to the surface layer above the pycnocline throughout the study. Given the difficulties of collecting samples from pre- cise light percent depths in such shallow euphotic zones, estimates of in situ primary production at the above light levels were calculated as the product of chlorophyll specific production measured at each light level and chlorophyll concentration at the correspond- ing light depth. Where necessary, chlorophyll concen- tration was estimated by interpolation. Euphotic zone primary production was then calculated by integrating between the surface and 1 % light depth. As discussed by Malone (1982), 24 h incubations provide reasonable estimates of net particulate organic production under nutrient-rich estuarine conditions.
Bacterial cell density was estimated from direct counts made with epifluorescence microscopy of samp- les dyed with acridine orange on black 0.2 pm Nu- cleopore filters (Hobbie et al. 1977, Ducklow 1982).
J U L Y A U G I S E P T I O C T
O I n /
S T A T I O N S
Fig. 2. Time-series of salinity (ppt), sigma-t, and dissolved oxygen (mg 1-') at Stn 3. (---) 1 % light depth
Bacterial production estimates were based on the incorporation of 3H-thyn1idine into cold TCA insoluble precipitates of the particulate matter collected on 0.45 pm Millipore filters (Fuhrman & Azam 1980, Ducklow & Hill 1985b). 3H activity was measured by liquid scintillation in Aquasol 2. Production was estimated using a conversion factor of 2 X 10¹⁸ cells produced per mole of 3~- thymid ine incorporated (Fuhrman & Azam 1982)
Deposition of particulate organic matter into the bottom layer was estimated from sediment trap collec- tions. Sediment traps were moored for 5 consecutive 6 to 8 d intervals beginning 23 July and ending 30 August. Cylindrical PVC traps were mounted in pairs on a rigid frame which was attached with a swivel to a verbcal stainless steel cable at depths of 4, 8 and 14 m. Only data from the 8 m trap are reported here. A fin on the frame caused the traps to maintain a constant orientation into the current. These traps, measuring 7.6 cm in diameter and 76 cm in height, conformed to specifications recommended by Bloesch & Burns (1980) and by Blomquist & Hakanson (1981).
RESULTS AND DISCUSSION
Hydrographic conditions
The time-series of salinity and density at Station 3 in the main channel (Fig. 2) can be divided into 2 hydro- graphic seasons based on vertical structure; a stratified perlod during July-August when vertical gradients were well developed, and a mixed period during Sep- tember-October wheh vertical gradients were weak. This seasonal pattern of stratification reflected a decrease in the freshwater flow of the Susquehanna River from a mean of 83 X 106 m3 d-' during July- August to 21 X 106 m3 d-' during September-October. Surface cooling and increased wind mixing also contn- buted to the decline in vertical stratification during September-October.
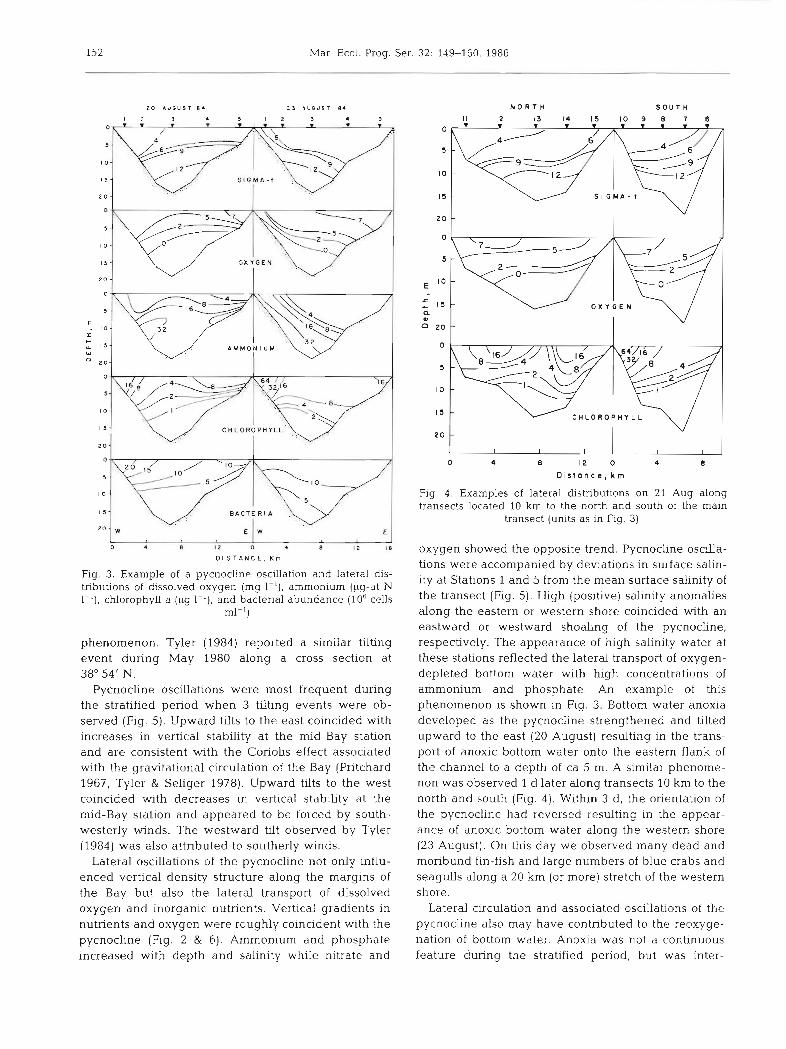
Laterally, vertical density gradients tended to weaken with decreasing depth due to tidal mixing so that the eastern- and westemmost stations were verti- cally mixed under most conditions during both hydro- graphic periods. However, large and often rapid lateral oscdlations of the pycnocline were observed along the east-west transect which occassionally resulted in the developnlent of vertical density structure at the shallow, near-shore stations. For example, the pycno- cline tilted upward to the east on 20 August and up- ward to the west on 23 August (Fig. 3). The pycnocline along transects 10 km to the north and south of this transect also exhibited an upward tilt to the east on 21 August (Fig. 4), suggesting that this was not a local
152 Mar Ecol. Prog. Ser. 32: 149-160, 1986
0
I S E A C T E R I A
m W E I W I I l
1 n I Z o 4 a 12 11
D I S T A N C E . K m
Fig. 3. Example of a pycnocline oscillation and lateral dis- tributions of dissolved oxygen (mg I-') , ammonium (pg-at N 1-'), chlorophyll a (pg I - ' ) , and bacterial abundance (106 cells
ml-')
phenomenon. Tyler (1984) reported a similar tilting event during May 1980 along a cross section at 38" 54' N.
Pycnocline oscillations were most frequent during the stratified period when 3 tilting events were ob- served (Fig. 5) . Upward tilts to the east coincided with increases in vertical stability at the mid-Bay station and are consistent with the Coriolis effect associated with the gravitational circulation of the Bay (Pritchard 1967, Tyler & Seliger 1978). Upward tilts to the west coincided with decreases in vertical stabhty at the mid-Bay station and appeared to be forced by south- westerly winds. The westward tdt observed by Tyler (1984) was also attributed to southerly winds.
Lateral oscdlations of the pycnocline not only influ- enced vertical density structure along the margins of the Bay but also the lateral transport of dissolved oxygen and inorganic nutrients. Vertical gradients in nutrients and oxygen were roughly coincident with the pycnocline (Fig. 2 & 6). Ammonium and phosphate increased with depth and salinity while nitrate and
N O R T H S O U T H
C H L O R O P H Y L L
20 - l I I l I I I
0 4 B 12 0 4 8
D i s t a n c e , k m
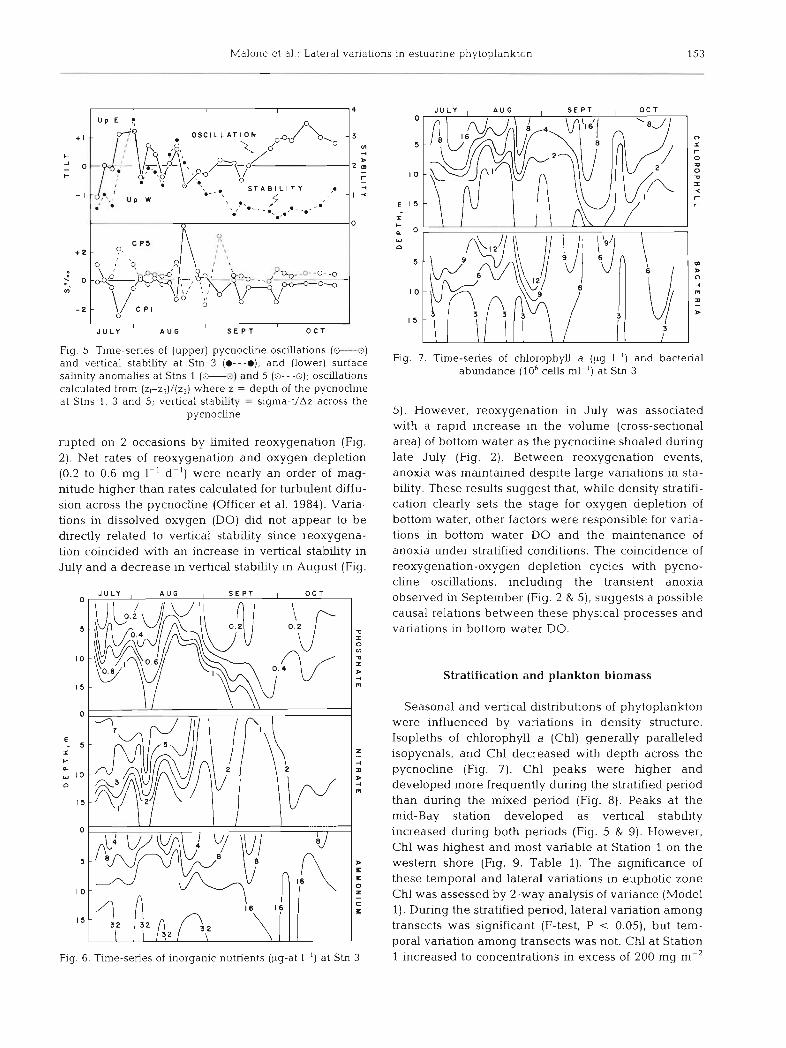
Fig. 4. Examples of lateral hstributions on 21 Aug along transects located 10 km to the north and south of the main
transect (units as in Fig. 3)
oxygen showed the opposite trend. Pycnocline oscilla- tions were accompanied by deviations in surface salin- ity at Stations 1 and 5 from the mean surface salinity of the transect (Fig. 5). High (positive) salinity anomalies along the eastern or western shore coincided with an eastward or westward shoaling of the pycnocline, respectively. The appearance of high salinity water at these stations reflected the lateral transport of oxygen- depleted bottom water with high concentrations of ammonium and phosphate. An example of this phenomenon is shown in Fig. 3. Bottom water anoxia developed as the pycnocline strengthened and tilted upward to the east (20 August) resulting in the trans- port of anoxic bottom water onto the eastern flank of the channel to a depth of ca 5 m. A similar phenome- non was observed 1 d later along transects 10 km to the north and south (Fig. 4). Wlthin 3 d, the orientation of the pycnocline had reversed resulting in the appear- ance of anoxic bottom water along the western shore (23 August). On this day we observed many dead and moribund fin-fish and large numbers of blue crabs and seagulls along a 20 km (or more) stretch of the western shore.
Lateral circulation and associated osciIlations of the pycnocline also may have contributed to the reoxyge- nation of bottom water. Anoxia was not a continuous feature during the stratified period, but was inter-
Malone et a1 - Lateral variations in estuarine phytoplankton 153
I I J U L Y A U G S E P T O C T
Fig 5 Time-senes of (upper) pycnocllne oscillations (M) and vertical stabihty at Stn 3 ( e - - - e ) , and (lower) surface sahnity anomalies at Stns 1 (*L] and 5 (0---o), oscillations calculated from (zl-z,)/(z,) where z = depth of the pycnocline at Stns 1 3 and 5, vertical s tabhty = sigma-t/Az across the
pycnochne
rupted on 2 occasions by limited reoxygenation (Fig. 2). Net rates of reoxygenation and oxygen depletion (0.2 to 0.6 mg 1-' d-l) were nearly an order of mag- rutude higher than rates calculated for turbulent diffu- sion across the pycnocline (Officer et al. 1984). Varia- tions in dssolved oxygen (DO) did not appear to be directly related to vertical stabhty since reoxygena- tion coincided with an increase in vertical stabhty in July and a decrease in vertical stabhty in August (Fig.
Fig. 6. Time-series of inorganic nutrients (pg-at I - ' ) at Stn 3
Fig. 7. Time-senes of chlorophyll a (ug I-') and bacterial abundance (106 cells ml- ') at Stn 3
5) . However, reoxygenation in July was associated with a rapid increase in the volume (cross-sectional area) of bottom water as the pycnocline shoaled during late July (Fig. 2). Between reoxygenation events, anoxia was maintained despite large variations in sta- bh ty . These results suggest that, while density stratifi- cation clearly sets the stage for oxygen depletion of bottom water, other factors were responsible for vana- tions in bottom water DO and the maintenance of anoxia under stratified conditions. The coincidence of reoxygenation-oxygen depletion cycles with pycno- cline oscillations, including the transient anoxia observed in September (Fig. 2 & 5) , suggests a possible causal relations between these physical processes and variations in bottom water DO.
Stratification and plankton biomass
Seasonal and vertical distributions of phytoplankton were influenced by variations in density structure. Isopleths of chlorophyll a (Chl) generally paralleled isopycnals, and Chl decreased with depth across the pycnocline (Fig. 7). Chl peaks were hlgher and developed more frequently during the stratified period than during the mixed period (Fig. 8). Peaks at the mid-Bay station developed as vertical stability increased during both periods (Fig. 5 & 9). However, Chl was highest and most variable at Station 1 on the western shore (Fig. 9, Table 1). The significance of these temporal and lateral variations in euphotic zone Chl was assessed by 2-way analysis of variance (Model 1). During the stratified period, lateral variation among transects was significant (F-test, P < 0.05), but tem- poral variation among transects was not. CM at Station 1 increased to concentrations in excess of 200 mg m-'

Mar Ecol. Prog. Ser. 32: 14!&160. 1986
C H L O R O P H Y L L
1 2 0
4 0
2 0
m 0 0 - - 2 0 B A C T E R I A
-
U
0 I I I
J U L Y A U G S E P T O C T
Fig. 8. Time-series of mean euphotic zone chlorophyll a and bacterial abundance. Vertical bars: range for each transect
mean
on 3 occasions at ca 15 d intervals (Fig. 9). Increases in Chl at similar intervals occurred at Stations 2 and 3 but were smaller in magnitude (Fig. 9, Table 1). East of the channel, Chl concentration was lower, less variable and unrelated to Chl variations to the west. In contrast, lateral variation was not significant during the mixed period but temporal variation was (P < 0.05). Thus, temporal variations in Chl at each station were more closely correlated during the mixed period than during the stratified period.
Bacterial abundance did not exhibit significant lateral variation but temporal variation was significant
I O O C E A S T , C P I I
J U L Y A U O S E P T O C T
Fig. 9. Chlorophyll a and bacterial content of euphotic zone
density in the euphotic was generally high, especially during the stratified period when cell density usually exceeded 10' ml-' (Fig. 8). Bacterial abundance (AODC, 106 cells ml-l) was significantly correlated (P < 0.05) with Chl (pg l-l) during each period by the least square regressions:
(1) (Jul-Aug): log AODC = 6.52 + 0.45 log Chl (n V 160,r = 0.91)
(2) (Sep-Oct): log AODC = 6.64 + 0.23 log Chl (n = 158, r = 0.65).
(2-way ANOVA, F-test, P < 0.05) during both periods. The intercepts of both regressions reflect the high Increases in bacterial abundance were associated with bacterial cell densities (>106 cells ml-l) which were Chl peaks with lags of 0 to 6 d (Fig. 7 & 9). Mean cell sustained along the transect throughout the study
Table 1. Euphotic zone chlorophyll a (Chl, mg m-') and phytoplankton producbon (P, mg C m-2 d-') during the stratified and mixed period (CV = coefficient of variation, r = correlation coefficient relating variations at Stns 2 to 5 to variations at Stn 1)
Season Station Chl P Mean CV r Mean CV
Stratified 1 140 99 % 1.67 69 % (Jul-Aug) 2 66 39 O/O 0.57d -
3 58 52 '10 0.41 1.56 76 % 4 56 28 % 0.00 - 5 4 9 30 % 0.04 2.28 43 O h
Mixed 1 4 0 60 % 0.79 62 O/O
(SepOctl 2 4 4 63 9b 0.80h p - 3 42 57 % 0.79'' 1.35 80 O/O
4 3 9 4 0 '10 0.58" - - 5 26 64 % 0.20 0.99 100 "/n
" Significant at 0.05 level Significant at 0.01 level

Malone et al.: Lateral variations in estuarine phytoplankton 155
period. These are high densities compared to most other estuaries and coastal environments (Ferguson & Palumbo 1979, Fuhrman et al. 1980, Ducklow 1982, Linly et al. 1983, Wright & Coffin 1984, Azam et al. 1984), and the persistence of such high densities on a seasonal time scale has not been previously documented. This may indicate that Chesapeake Bay is among the more eutrophic systems studied to date (cf. Bird & Kalff 1984). The slopes of the regression equations indicate that variations in bacteria were damped relative to Chl, as would be expected if phyto- plankton production was the major source of organic substrates for bacterial growth or if bacterial produc- tion and bactivory were closely coupled (Ducklow 1983). Based on the correlation coefficients, variations in bacteria and phytoplankton were more closely cou- pled during the stratified period, possibly as a conse- quence of greater turbulence during the mixed period. As found in other systems (e.g. Fuhrman et al. 1980, Joint & Morris 1982, Ducklow 1983, hnley et al. 1983, Bird & Kalff 1984, Hobbie & Cole 1984), these results suggest that high bacterial cell densities in Ches- apeake Bay are related to phytoplankton production in the surface layer rather than to organic decomposition in the bottom layer.
The trophic status of the Bay (cf. Bird & Kalff 1984) and the importance of bacteria in carbon flow of the plankton community (cf. Newell & Linley 1984) can be demonstrated by a rough comparison of phytoplankton and bacterial biomass. The carbon content of bacterial
cells is probably in the range of 8 to 50 fg (Ducklow 1982, Bratbak & Dundas 1984), and C/Chl ratios of summer phytoplankton are typically in the range of 50 to 100 (Chervin et al. 1981, Malone 1982). Assuming ratios of 20 fg C cell-' and 70 pg C (pg Ch1)-l, bacterial biomass in the euphotic zone fluctuated around 23 O/O
of phytoplankton biomass (transect mean) throughout most of the stratified period and increased to 58 % at the end of August. Bacterial biomass during the mixed period averaged 39 O/O of phytoplankton biomass. Bac- terioplankton clearly were important members of the heterotrophic community.
Phytoplankton and bacterial production
Phytoplankton production varied by nearly 2 orders of magnitude from 80 to 5300 mg C m-2 d-' and was correlated with euphotic zone Chl depending on loca- tion (Fig. 10). Productivity and Chl were significantly (P < 0.01) correlated on the eastern and western sides of the transect but not at the mid-Bay station. Chl specific production (slope of the regression line) was higher on the eastern shore than on the western shore by a factor of 3. As a consequence, phytoplankton production was usually higher on the eastern shore even though Chl was generally higher on the western shore (Fig. 11, Table 1). Assuming that Chl specific production is a reasonable index of carbon specific growth rate in nutrient-saturated environments
Fig. 10. Relations between phyto- plankton production (P) and chlorophyll a (Chl) content of the euphotic zone at Stns l , 3 and 5 (rZ = 0.94 for Stn 1 and 0.97 for Stn 5 when Chl was less than 125 mg
m -2)
E a s t P: - 733 + 63.2 (C h l )
A C h a n n e l . M i d - B a y
0 W e s t P = - 21 + 2 0 . 4 ( C h l )

156 Mar. Ecol. Prog. Ser.
- 4 1 - .
J U L Y A U G S E P T O C T
Fig. 11. Temporal variations in the difference between phyto- plankton production (A) and chlorophyll a (B) a t Stn 5 (east) and Stn 1 (west) normalized to the transect mean ([east-west]/
mean)
(Malone 1982), these results indicate that phytoplank- ton biomass was turning over 3 times faster on the eastern than on the western shore and that variations in phytoplankton growth rate were relatively small at each location. Apparently, variations in phytoplankton biomass over the eastern and western flanks of the channel were largely a consequence of the effects of circulation and grazing. Low growth rate and high and variable biornass along the western shore suggest that the accumulation and dissipation of biomass were primanly physically driven. High growth rate and low biomass along the eastern shore are indicative of graz- ing control which would account for the low variance in phytoplankton biomass.
Oscillations of the pycnocline may be important in this regard. Large accumulations of Chl on the western side of the Bay appear to be related to the 3 tilting events which occurred during the stratified period (Fig 5 & 9). Shoaling of the pycnocline upward to the west coincided with periods of low or increasing Chl at the western station. Although variations in Chl were much smaller on the eastern side, a similar relation between shoaling and low Chl was observed there. Times of low bacterial abundance were also coincident with lateral shoaling of the pycnocline. Since bottom water of the mid-Bay had low concentrations of Chl and bacteria, it appears that the sequence of phytoplankton blooms and subsequent increases in bacterial abundance were initiated by lateral advection and upwehng of bottom water rich in ammonium and phosphate (as indicated by increased salinity). Shoreward advection of bottom water associated with an upward tilting pycnocline initially diluted the phytoplankton crop. On the west- e m side, dilution was followed by a large increase in phytoplankton biomass. On the eastern side, the effects of pycnocline oscillations were manifested in high productivity rather than pulses in biomass.
Verhcal and temporal variations in the biomass of
phytoplankton and bacteria discussed in the previous section suggest a dependence of bacterial growth on phytoplankton production. Bacterial production was estimated during September to November 1984 and again during March to July 1985. Specific growth rates were estimated from the ratio of production (cells 1-' d-l) to abundance (cells 1-'). As water column stratifi- cation decreased during September to November, specific growth rate for the euphobc zone ranged from 0.12 to 0.71 d-' (mean = 0.38 d-l). Bacterial produc- tion ranged from 52 to 680 mg C m-' d-' or about 25 O/O of phytoplankton production during that time. Under stratified conditions in 1985, specific growth rates averaged 1.3 d-' in the euphotic zone and 0.9 d- ' in the bottom layer. Abundances were similar during both years. Euphotic zone growth rates of 0.5 to 2.0 d-' are typical of bacteria growing under a wide range of eutrophic and oligotrophic conditions (Van Es & Meyer-Reill 1982, Ducklow & Hill 1985a, b). Assuming similar summer growth rates in 1984 and 1985 and a cellular carbon content of 20 fg cell-', we estimate that production in the euphotic zone was in the range of 250 to 1000 mg C m-2 d-' and averaged 30 O/O of phyto- plankton production during the stratified period.
These rates are high compared to the range of 5 % to 25 % reported for most pelagic ecosystems (Fuhrman & Azam 1980, 1982, Ducklow & Kuchman 1983, Hobbie & Cole 1984, Ducklow & Hill 1985a). However, we note that bacterial production was calculated using 20 fg C cell-' as an estimate of cell biomass while previous estimates of production used a value of 10 fg C cell-'. Regardless of which conversion factor is used, it is evident that a significant fraction of phytoplankton production was metabolized by bacteria. For example, assuming a growth yield (efficiency) of 50 % (Cole et al. 1982, 1984). the carbon flow through bacteria in the euphotic zone was in excess of 50 '10 of phytoplankton production throughout the study period. These levels of carbon flux suggest that bacterial metabolism was based on dissolved organic substrates that were derived in part from sources other than duect release by viable phytoplankton (Wright & Coffin 1984).
Vertical flux of particulate organic matter
Sediment trap collections at Station 3 provide some clues as to the fate of at least a porhon of the high phytoplankton production which characterized the shallow margins of our study area. Estimates of the downward flux of particulate organic carbon (POC) based on these collections ranged from 0.52 g C m-2 d-' to 1.62 g C m-' d-' (Fig. 12). Allochthonous inputs of POC from terrestrial or freshwater sources were probably an insignificant fraction of t h s flux. Atomic
Malone et al.: Lateral variations in estuarine phytoplankton 157
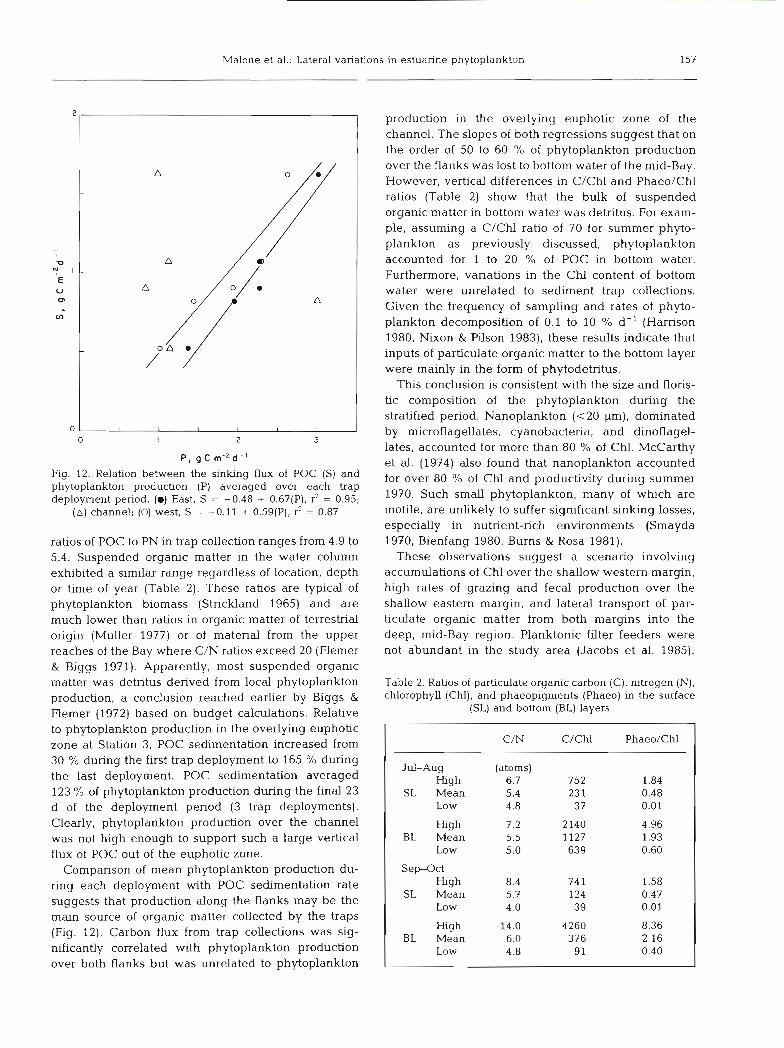
Fig. 12. Relation between the sinlung flux of POC (S) and phytoplankton production (P) averaged over each trap deployment period. (m) East, S = -0.48 + 0.67(P), 9 = 0.95;
(A) channel; (0) west, S = -0.11 + 0.59(P), 3 = 0.87
ratios of POC to PN in trap collection ranges from 4.9 to 5.4. Suspended organic matter in the water column exhibited a similar range regardless of location, depth or time of year (Table 2). These ratios are typical of phytoplankton biomass (Strickland 1965) and are much lower than ratios in organic matter of terrestrial origin (Muller 1977) or of material from the upper reaches of the Bay where C/N ratios exceed 20 (Flemer & Biggs 1971). Apparently, most suspended organic matter was detritus derived from local phytoplankton production, a conclusion reached earlier by Biggs & Flemer (1972) based on budget calculations. Relative to phytoplankton production in the overlying euphotic zone at Station 3, POC sedimentation increased from 30 % during the first trap deployment to 165 % during the last deployment. POC sedimentation averaged 123 % of phytoplankton production during the final 23 d of the deployment period (3 trap deployments). Clearly, phytoplankton production over the channel was not high enough to support such a large vertical flux of POC out of the euphotic zone.
Comparison of mean phytoplankton production du- ring each deployment with POC sedimentation rate suggests that production along the flanks may be the main source of organic matter collected by the traps (Fig. 12). Carbon flux from trap collections was sig- nificantly correlated with phytoplankton production over both flanks but was unrelated to phytoplankton
production in the overlying euphotic zone of the channel. The slopes of both regressions suggest that on the order of 50 to 60 % of phytoplankton production over the flanks was lost to bottom water of the mid-Bay. However, vertical differences in C/Chl and Phaeo/Chl ratios (Table 2) show that the bulk of suspended organic matter in bottom water was detritus. For exam- ple, assuming a C/Chl ratio of 70 for summer phyto- plankton as previously discussed, phytoplankton accounted for 1 to 20 % of POC in bottom water. Furthermore, variations in the Chl content of bottom water were unrelated to sediment trap collections. Given the frequency of sampling and rates of phyto- plankton decomposition of 0.1 to 10 O/O d-' (Harrison 1980, Nixon & Pilson 1983), these results indicate that inputs of particulate organic matter to the bottom layer were mainly in the form of phytodetritus.
This conclusion is consistent with the size and floris- tic composition of the phytoplankton during the stratified period. Nanoplankton (<20 pm), dominated by microflagellates, cyanobacteria, and dinoflagel- lates, accounted for more than 80 % of Chl. McCarthy et al. (1974) also found that nanoplankton accounted for over 80 % of Chl and productivity during summer 1970. Such small phytoplankton, many of which are motile, are unlikely to suffer significant sinking losses, especially in nutrient-rich environments (Smayda 1970, Bienfang 1980, Burns & Rosa 1981).
These observations suggest a scenario involving accumulations of Chl over the shallow western margin, high rates of grazing and fecal production over the shallow eastern margin, and lateral transport of par- ticulate organic matter from both margms into the deep, mid-Bay region. Planktonic filter feeders were not abundant in the study area (Jacobs et al. 1985).
Table 2. Ratios of particulate organic carbon (C), nitrogen (N), chlorophyll (Chl), and phaeopigments (Phaeo) in the surface
(SL) and bottom (BL) layers
C/N C/Chl Phaeo/Chl
Jul-Aug (atoms) Hlgh 6.7 752 1.84
SL Mean 5.4 23 1 0.48 Low 4.8 37 0.01
High 7.2 2140 4.96 BL Mean 5.5 1127 1.93
Low 5.0 639 0.60
S e p O c t High 8.4 74 1 1.58
SL Mean 5.7 124 0.47 Low 4.0 39 0.01
High 14.0 4260 8.36 BL Mean 6.0 376 2.16
Low 4.8 91 0.40

158 Mar. Ecol. Prog. S
However, benthic filter feeding populations consisting mainly of oysters, barnacles, mussels, and clams are present in large numbers, particularly along the east- ern shore where dense aggregation5 of oysters are most common (Kennedy & Breisch 1971, Meritt 1977). Oys- ter bars are capable of processing large volumes of water (Dame et al. 1984) and benthic filter feeding could have been responsible for controlling phyto- plankton biomass along the eastern shore. Cloern (1981) has demonstrated the importance of benthic grazing in South San Francisco Bay, and environmen- tal conditions of much of the Chesapeake Bay meet the criteria discussed by Officer et al. (1982) for benthic control of phytoplankton biomass. This is especially apparent on the eastern side of the Bay where popula- tions of benthic filter feeders reach their greatest density, nutrient inputs are high, and variations in phytoplankton biomass are relatively s m d . The corre- lation between phytoplankton production and sedi- ment trap collections implies that the processes of production and grazing are tightly coupled and that the lateral transport of detritus is rapid.
CONCLUSIONS
Chesapeake Bay exhibited large and systematic lateral variations in phytoplankton biomass and pro- duction. Lateral oscillations of the pycnocline were central in this regard. A transverse type of circulation may have been associated with these oscillations such that tilts up to the east reflect an eastward flow of bottom water and a westward flow of surface water. Tilts up to the west would have the reverse flow pattern. Such a pattern of circulation could provide a mechanism for coupling nutrient regeneration below the pycnocline to phytoplankton production above on time scales of hours to days. Regenerated nutrients are transported onto the flanks where they support large accumulations of phytoplankton biomass or high phy- toplankton production. A large fraction of this produc- tion is grazed, and the resulting phytodetritus and remaining biomass are transported toward the center of the Bay where it sinks lnto the bottom layer, com- pleting the feedback loop.
By virtue of the close relation between phytoplank- ton and bacterial distributions and high bacterial metabolism, bacteria constitute an important Link be- tween the photosynthetic production of organic matter and the fate of this production in the ecosystem. For ex- ample, phytoplankton production was about 67 g C m-2 during the period when sediment traps were deployed. Assuming a growth yleld (efficiency) of 50 O/O (Cole et al. 1982, 1984), on the order of 60 ?h of this production was ultimately metabolized by bacteria in the surface
layer leaving 37 g C m-2 or 0.7 g C m-2 d-' to sediment into the bottom layer. This is in good agree- ment with sediment trap collections (Fig. 12) and rep- resents a significant supply of organic matter for metabolism below the pycnocline. Benthic metabolism in this region of the Bay has been reported to be about 1.2 g C m-2 d-' (Boynton & Kemp 1985). Thus, the verbcal flux of organic matter during the summer could support on the order of 60 O/O of the benthic metabolic demand, a result which is consistent with the hypothesis that a large fraction of benthic regener- ation during summer is related to the decomposition of organic matter produced during the spring bloom (Kemp & Boynton 1984). This vertical and temporal separation of organic production and decomposition on weekly to monthly time scales in association with pycnocline oscillations provides a mechanism for the seasonal coupling of river-borne nutrient input during winter-spring and maximum seasonal production du- ring summer in estuaries such as Chesapeake Bay.
Acknowledgements. Support for this research was provided by the United States EPA. Chesapeake Bay Office; by the University of Maryland Sea Grant Program of NOAA; by the Office of Environmental Programs of the Maryland Depart- ment of Health; and by Horn Point Environmental Laboratories of the University of Maryland Center for Environmental and Estuarine Stu&es. We gratefully acknow- ledge the assistance of Kathy Ashton, Jane Caffrey, David Cargo, Charles Divan, Klaus Drobeck, Cynthia Gilrnour, Sue Hill, Tom Jones, Tom Page, Sherry Rke , Lois Lane, Tom Randall, Daphne Stoner, Marget Weir. Brian Wendler, and Paul Zimba.
LITERATURE CITED
Azarn, F.. Amrnerrnan, J. W., Fuhrman, J. A.. Hagstrom, A. (1984). In: White, H. H. (ed.) Concepts in marine pollution measurements. Maryland Sea Grant College. College Park, p. 431442
Bannister, T. T (1974). A general theory of steady state phytoplankton growth in a nutrient saturated mixed layer. Limnol. Oceanogr. 19: 13-30
Blenfang, P. K. (1980). Phytoplankton sinking rates in ohgo- trophic water off Hawaii, USA. Mar. Biol. 61: 6%77
B~ggs , R. B., Flerner, D. A. (1972). The flux of particulate carbon in an estuary. Mar Biol. 12: 11-17
Bird, D. F., Kalff, J. (1984) Empirical relationships between bacterial abundance and chlorophyll concentration in fresh and marine waters. Can. J. Fish. Aquat. Sci. 41. 1015-1023
Bloesch, J., Burns, N. M. (1980). A critical review of sedimen- tation trap techniques. Schwelz. Z. Hydrol. 42: 15-56
Blomquist. S., Hlkanson, L. (1981). A revlew on sedunent traps in aquatic environments. Arch Hydrobiol. 91: 101-132
Boynton, W. R., Kernp, W. M. (1985). Nutrient regeneration and oxygen consumption by sediments along an estuanne salinity gradient. Mar Ecol. Prog. Ser 23: 45-55
Boynton, W. R., Kernp, W. M, , Keefe, C W. (1982). A compara- tive analysis of nutrients and other factors influencing estuarine phytoplankton production. In: Kennedy, V.S.

Malone et a1 . Lateral variatior IS in estuarine phytoplankton 159
(ed.) Estuarine comparisons. Academic Press, New York, p. 69-90
Bratbak, G., Dundas, I. (1984). Bacterial dry matter content and biomass estimations. Appl. environ. Microbiol. 48: 755-757
Burns, N. M., Rosa, F. (1981). In situ measurement of the settling velocity of organic particles and 10 species of phytoplankton. hmnol. Oceanogr. 25: 855-864
Chervin, M. B., Malone, T C., Neale, P. J. (1981). Interactions between suspended organic matter and copepod grazing in the plume of the Hudson River. Estuar. coast. Mar. Sci. 13: 169-184
Cloern, J . E. (1981). Does the benthos control phytoplankton biomass in South San Francisco Bay? Mar. Ecol. Prog. Ser. 9: 191-202
Cole, J . J. , Likens, G. E., Strayer, D. L. (1982). Photosyntheti- cally produced dissolved organic carbon: an important carbon source for planktonic bacteria. Limnol. Oceanogr. 27: 1080-1090
Cole, J. J. , hkens, G. E., Hobble, J. E. (1984). Decomposition of planktonic algae in an oligotrophic lake. Oikos 42: 257-266
Dame, R. F., Zingmark, R. G., Haskin, E. (1984). Oyster reefs as processors of estuarine materials. J. exp. mar. Biol. Ecol. 83: 239-248
Ducklow, H. W. (1982). Chesapeake Bay nutrient and plank- ton dynamics. I. Bacterial biomass and production during spring tidal destratification in the York River, Virginia, estuary. Limnol. Oceanogr. 27: 651-659
Ducklow, H. W. (1983). The production and fate of bacteria in the oceans. Bioscience 33: 494-501
Ducklow, H. W., Kirchman, D. L. (1983). Bacterial dynamics and distribution during a spring diatom bloom in the Hudson h v e r Plume, USA. J. Plankton Res. 5(3): 333-335
Ducklow, H. W., HLU, S. M. (1985a). The growth of hetero- trophc bacteria in the surface waters of warm core rings. hmnol. Oceanogr. 30: 239-259
Ducklow, H. W., Hill, S. M. (1985b). Tritiated thymidine incorporation and the growth of heterotrophic bacteria in warm core rings. Limnol. Oceanogr. 30: 260-272
Fee, E. J. (1979). A relation between lake morphology and primary productivity and its use in interpreting whole- lake eutrophication experiments. Limnol. Oceanogr. 24: 401-416
Ferguson, R. L., Palumbo, A. V. (1979). Distribution of sus- pended bacteria in neritic waters south of Long Island during stratified conditions. Limnol. Oceanogr. 24: 697-705
Flemer, D. A., Biggs, R. B. (1971). Particulate carbon:nitrogen relations in northern Chesapeake Bay. J. Fish. Res. Bd Can. 28: 911-918
Fuhrman, J. A., Ammerman, J . W., Azam, F. (1980). Bacterio- plankton in the coastal euphotic zone: distribution, activ- ity and possible relationships m t h phytoplankton. Mar Biol. 60: 201-207
Fuhrman, J. A., Azam, F. (1980). Bactenoplankton secondary production estimates for coastal waters of British Colum- bia, Antarctica, and California. Appl. environ. Microbiol. 39: 1085-1095
Fuhrman, J. A., Azam, F. (1982). Thymidine incorporation as a measure of heterotrophic bacterioplankton production in marine surface waters: evaluation and field results. Mar. Biol. 66: 109-120
Harrison, W. G. (1980). Nutrient regeneration and primary production in the sea. In: Falkowski, P. G. (ed.) Primary productivity in the sea. Plenum Press, New York, p. 433-460
Hobbie, J . E., Cole, J. J. (1984). Response of a detrital foodweb to eutrophication. Bull. mar. Sci. 35: 357-363
Hobbie, J . E., Daley, R. J., Jasper, S. (1977). Use of Nuclepore filters for counting bacteria by epifluorescence micros- copy. Appl. environ. Microbiol. 33: 1225-1228
Jacobs, F., Burton, W., Moss, I. (1985). Chesapeake Bay water quality monitoring program mesozooplankton component. Data Report. Office of Environmental Programs, Mary- land. p. 1-65
Joint, I. R., Morris, R. J . (1982). The role of bacteria in the turnover of organic matter in the sea. Oceanogr. mar. Biol. A. Rev. 20: 65-118
Kemp, W. M.. Boynton, W. R. (1981). External and internal factors regulating metabolic rates of an estuarine benthic community. Oecologia (Berl.) 51: 19-27
Kemp, W M., Boynton, W. R. (1984). Spatial and temporal coupling of nutnent inputs to estuarine primary produc- tion: the role of particulate transport and decomposition. Bull. mar. Sci. 35: 242-247
Kennedy, V. S., Breisch, L. L. (1981). Maryland's oysters: research and management. Maryland Sea Grant Publ. No. UM-SG-TS-81-04, p. 1-284
Ketchum, G. H. (1967). Phytoplankton nutrients in estuaries. In: Lauff, G. H. (ed.) Estuaries AAAS Publ. No. 83, Washington, D. C., p. 329-335
hnley, E. A. S., Newell, R. C., Lucas, M. I. (1983). Quantita- tive relationships between phytoplankton, bacteria and heterotrophic microflagellates in shelf waters. Mar. Ecol. Prog. Ser. 12: 77-89
Malone, T. C. (1982). Phytoplankton photosynthesis and car- bon-specific growth: light-saturated rates in a nutrient- rich environment. Lmnol. Oceanogr. 27: 226-235
McCarthy, J. J., Taylor, W. R., Loftus, M. E. (1974). Signifi- cance of nanoplankton in the Chesapeake Bay estuary and problems associated with the measurement of nanoplank- ton productivity. Mar. Biol. 24: 7-16
Merritt, D. W. (1977). Oyster spat set on natural cultch in the Maryland portion of the Chesapeake Bay (1939-1975). University of Maryland CEES Special Report No. 7, p. 1-30
Muller, P. J. (1977). C/N ratios in Pacific deep-sea sediments: effect of inorganic ammonium and organic nitrogen com- pounds sorbed by clays. Geochim. cosmochim. Acta 41: 765-776
Newell, R. C., Linley, E. A. S. (1984). Significance of mi- croheterotrophs in the decomposition of phytoplankton: estimates of carbon and nitrogen flow based on the biomass of plankton communities. Mar. Ecol. Prog. Ser 16: 105-119
Nixon, S. W. (1981). Remineralization and nutrient cycling in coastal marine ecosystems. In: Neilson, B. J., Cronin, L. E. (ed.) Estuanes and nutrients. Humana Press, Clifton, New Jersey, p. 111-138
Nixon, S. W., Pilson, M. G. (1983). Nitrogen in estuarine and coastal marine ecosystems. In: Carpenter, E. J. , Capone, D. G. (ed.) Nitrogen In the marine environment. Academic Press. New York, p. 565648
Officer, C. B.. Biggs, R. B., Taft, J. L., Cronin, L. E., Tyler, M. A., Boynton, W. R. (1984). Chesapeake Bay anoxia: origin, development, and significance. Science 223: 22-27
Officer, C. B., Smayda, T. J., Mann, R. (1982). Benthic filter feeding: a natural eutrophication control. Mar. Ecol. Prog. Ser. 9: 203-210
Pritchard. D. W. (1952). Salinity distribution and circulation in the Chesapeake Bay estuarine system. J. mar. Res. 11: 106-123
Pritchard, D. W. (1967). Observations of circulation in coastal

160 Mar. Ecol. Prog. Ser. 32: 149-160, 1986
plain estuaries. In: Lauff, C. H. (ed.) Estuaries. AAAS Tyler, M. A. (1984). Dye tracing of a subsurface chlorophyll Publ. 83, Washington, D. C., p. 37--44 maximum of a red-tide dinoflagellate to surface frontal
Redfield. A. C. (1955). The hydrography of the Gulf of Ven- regions. Mar. Biol. 78: 285-300 ezuela. Deep Sea Res. 2 (Suppl.): 11S133 Tyler, M. A.. Seliger. H. H. (1978). Annual subsurface trans-
Seliger, H. H., Boggs, J. A., Biggley, W. H. (1985). Catas- port of a red tide dinoflagellate to its bloom area: water trophic anoxla in Chesapeake Bay in 1984. Snence 228: circulaUon patterns and organism distribuhons in the 7&73 Chesapeake Bay. L~mnol. Oceanogr. 23: 227-246
Smayda, T. J. (1970). The suspension and sinking of phyto- Van Es, F. B., Meyer-Reill, L. A. (1982). Biomass and plankton in the sea. Oceanogr. mar. Biol. A. Rev. 8: metabolic activity of heterotrophic marine bacteria. Adv. 353414 microb. Ecol. 6: 11 1-170
Strickland, J. D. H. (1965). Production of organic matter in the Walsh, J. J., Rowe, G. T., Iverson, R. L., McRoy, C. P. (1981). primary stages of the marine food chain. In: Riley, J. P., Biological export of shelf carbon in a sink of the global Skirnow, G. (ed.) Chemical oceanography. Academic CO2 cycle. Nature, Lond. 291: 196201 Press, New York, p. 478-610 Wofsy, S. C. (1983). A simple model to prehct extincition
Taft, J. L., Taylor, W. R., Hartwig, E. D., Loftus, R. (1980). coefficients and phytoplankton biomass in eutrophic Seasonal oxygen depletion in Chesapeake Bay. Estuaries waters. Lmnol. Oceanogr. 28: 1144-1155 3: 242-247 Wright, R. T., Coffin, R. B. (1984). Factors affecting bacteno-
Takahashi, M,, Parsons, T. R. (1972). Maximization of the plankton density and productivity in salt marsh estuaries. standing stock and primary productivity of marine phyto- In: Reddy, C. A., Klug, M. J. (ed.) Current perspectives in plankton under natural conditions. Indian J. mar. Sci. 1: m~crobial ecology. Am. Soc. Microbiol., Washmgton, D.C., 6 1 4 2 p. 485-494
Thls article was presented by Professor S. W. Nixon; it was accepted for printing on June 23, 1986