latex examples - ucla statistical...
TRANSCRIPT

LaTeX Examples
David DiezUCLA Statistical Consulting Center
Contents
1 General 31.1 Header section . . . . . . . . . . . . . . . . . . . . . . . . . . . . . . . . . . 31.2 Outline . . . . . . . . . . . . . . . . . . . . . . . . . . . . . . . . . . . . . . 31.3 Paragraphs . . . . . . . . . . . . . . . . . . . . . . . . . . . . . . . . . . . . 31.4 Spacing . . . . . . . . . . . . . . . . . . . . . . . . . . . . . . . . . . . . . . 41.5 Text . . . . . . . . . . . . . . . . . . . . . . . . . . . . . . . . . . . . . . . . 41.6 Macros . . . . . . . . . . . . . . . . . . . . . . . . . . . . . . . . . . . . . . . 41.7 Lists . . . . . . . . . . . . . . . . . . . . . . . . . . . . . . . . . . . . . . . . 41.8 Special characters . . . . . . . . . . . . . . . . . . . . . . . . . . . . . . . . . 51.9 verbatim . . . . . . . . . . . . . . . . . . . . . . . . . . . . . . . . . . . . . . 5
2 Tabbing 52.1 Basic tabbing . . . . . . . . . . . . . . . . . . . . . . . . . . . . . . . . . . . 52.2 Impromptu tabs . . . . . . . . . . . . . . . . . . . . . . . . . . . . . . . . . 62.3 Tabbing example . . . . . . . . . . . . . . . . . . . . . . . . . . . . . . . . . 6
3 Tables 73.1 Basic tables . . . . . . . . . . . . . . . . . . . . . . . . . . . . . . . . . . . . 73.2 Captions and referencing . . . . . . . . . . . . . . . . . . . . . . . . . . . . . 73.3 array environment . . . . . . . . . . . . . . . . . . . . . . . . . . . . . . . . 83.4 The R package, xtable . . . . . . . . . . . . . . . . . . . . . . . . . . . . . 8
4 Figures 94.1 Basic figures . . . . . . . . . . . . . . . . . . . . . . . . . . . . . . . . . . . . 94.2 Captions and referencing . . . . . . . . . . . . . . . . . . . . . . . . . . . . . 94.3 Keeping organized . . . . . . . . . . . . . . . . . . . . . . . . . . . . . . . . 9
1

5 Math 115.1 Math in text . . . . . . . . . . . . . . . . . . . . . . . . . . . . . . . . . . . 115.2 Equation environment and referencing . . . . . . . . . . . . . . . . . . . . . 125.3 Aligning . . . . . . . . . . . . . . . . . . . . . . . . . . . . . . . . . . . . . . 125.4 Arrays . . . . . . . . . . . . . . . . . . . . . . . . . . . . . . . . . . . . . . . 125.5 Some benefits of the package amsmath . . . . . . . . . . . . . . . . . . . . . 13
6 Practice 136.1 Try it #1 . . . . . . . . . . . . . . . . . . . . . . . . . . . . . . . . . . . . . 136.2 Try it #2 . . . . . . . . . . . . . . . . . . . . . . . . . . . . . . . . . . . . . 136.3 Try it #3 . . . . . . . . . . . . . . . . . . . . . . . . . . . . . . . . . . . . . 14
2

It is assumed the reader is viewing both the document latexTemp.tex and latexTemp.pdfsimultaneously to become familiar with how to control the text. Also reviewing the ac-companying presentation is highly recommended.
1 General
1.1 Header section
Often times this part of the LaTeX document can be ignored, with the exception of the\title, \author, and \date. Always update the title, author, and possibly also thedate, otherwise comment out the \maketitle command. See the presentation slides foradditional details.
1.2 Outline
The section and subsection commands are used to make the sections and headers. Forexample, “General” is a section, and “Header section” and “Outline” are subsections.
1.3 Paragraphs
A new paragraphs can be created simply by creating two blank lines between betweenthe text. For instance, this paragraph is ended by hitting “enter” twice (see the .texdocument)... This is not a new paragraph...
But this is a new paragraph. If an extra space is desired between paragraphs, use thedouble-backslash command and hit “enter” twice...
The PDF will now insert a space between the last paragraph and this one.
To make a particular paragraph have no indentation, use the command \noindent, as inthis paragraph.
Generally, lots of extra spaces won’t affect the output text in the PDF. A new pagecan be created using the command \pagebreak.
3

1.4 Spacing
Horizontal text can be inserted in text using the \hspace{0.3cm} command. Theargument in the command can be changed, of course, to be larger or smaller, i.e. itcan be 0.1cm, 2.5cm, 1.3in, etc. The command \vspace{1.1cm}
works in a similar way. LaTeX will accept specified lengths in cm, mm, in, among a fewother options.
1.5 Text
Text can also be manipulated using commands. For example, use the command \emph toemphasize (italicize) text. There are a few ways to italicize text. {Braces} are often usedto capture what the command acts on. Similar to italicizing, text can also be bolded inmultiple ways or text can be colored. You can even create your own colors... this is“myRed”. You can also type like a typewriter.
Using the shift-apostrophe key to get ”double quotes” doesn’t look very pretty in La-TeX. Instead, double the apostrophe up by the “1 key” for the “left quote and use thedouble quotes” for the right quote.
Text can also be made tiny, scriptsize, footnotesize, small, large, Large, LARGE, etc.
1.6 Macros
In general, the commands used in this section can be found using the Macros. For example,to get the font size that you want in TeXShop, go to Macros > Text Styles > size. Also,try out quotations (Macros > Insertions > quotation:
This could be a very long quotation that you would not normally like toinclude in a paragraph. So instead you want it to stand alone and have asmaller width than a normal paragraph. This particular text was could easilybe italicized using \em at the start of the quotation, if desired.
1.7 Lists
The three preceding subsections are...
• Spacing
4

• Text
• Macros
Lists use the itemize environment or, if you want things numbered, enumerate:
1. Spacing
2. Text
3. Macros
But the numbers should match the subsection names and there are options to do that,too...
1.4 Spacing
1.5 Text
1.6 Macros
1.8 Special characters
LaTeX code uses a lot of special characters, which means if you want to put these charactersin your text, you must escape the characters from their usual purpose. For instance, eachof the following commands requires a backslash to precede them to show up: #, $, {, },&, %, . \ and ∼ take a little more fussing. Greek letters and symbols will be introducedin Section 5.
1.9 verbatim
When you really need to put text out explicitly, use verbatim:
All this stuff looks just like it \emph{would} ifyou looked in the LaTeX file. % and comments don’t work in verbatim...
2 Tabbing
2.1 Basic tabbing
Text can be indented using the indent command:This is indented text.
More importantly, custom tabbing can be created. For example
5

First tab Second tab There is no extra space between tabs by default.1 2 3 4one three four
Cells can be blank, like in the 3rd row, 2nd column.
Using the command \hspace{0.2cm} to make a little more space...
First tab Second tab Now there is extra space between tabs.1 2 3 4one three four
2.2 Impromptu tabs
New tabs can also be created partway in...
First tab Second tab Now there is extra space between tabs.1 2 3 4 4.5one three fourwhere does this start?
That didn’t work out so well. Correcting using \hspace...
First tab Second tab Now there is extra space between tabs.
1 2 3 4 4.5one three four where does this start?
2.3 Tabbing example
Tabbing is an interesting environment to play in. A more serious tabbing creation (itgets a bit messy in LaTeX)... note that \hspace can take a negative argument, otherwisecomponents of this example would not be permitted.
Test Name Description Total number of trials
Fixed Size Upon collection of the data, nf (α, β, δ, σ2)if |Zk| ≥ 1.96 stop, reject H0
otherwise stop, DNR H0.
Pocock After group k = 1, ...,K − 1 nfRP (K,α, β)if |Zk| ≥ CP (K,α) stop, reject H0
otherwise continue testing,after group K (the last group)
if |ZK | ≥ CP (K,α) stop, reject H0
otherwise stop, DNR H0.
6

3 Tables
3.1 Basic tables
A basic table...
Left Center Right1 2 3
To center a table, create a centered environment around the table:
Estimate Std. Error t value Pr(>|t|)(Intercept) -0.2852 0.8434 -0.34 0.7452x 0.4192 0.1499 2.80 0.0266
Maybe you also want to add a vertical dividers (many more could be added, if desired)...
Estimate Std. Error t value Pr(>|t|)(Intercept) -0.2852 0.8434 -0.34 0.7452x 0.4192 0.1499 2.80 0.0266
Another table...
Left Will be left-justified. Right1 If the text becomes long in a column, then
use \p{7.5cm} or something of the equivalentinstead of l, c, or r for alignment permitsparagraphs to be written in the table in anice format. This is also handy if you wantcareful control of your column widths.
3
3.2 Captions and referencing
Want captions on your table? Use a table environment. These are called floating tables...they “float” around your page if you don’t control them carefully, and sometimes still doeven if you try to control them.
Estimate Std. Error t value Pr(>|t|)(Intercept) -0.2852 0.8434 -0.34 0.7452x 0.4192 0.1499 2.80 0.0266
Table 1: This is a caption.
7

You can also automatically build in references to tables (and figures, as shown later).For instance, the table below is Table 2. If it’s table number were to change, the tablenumber would update automatically after compiling the .tex document twice.
Why twice? LaTeX reads its references in when it compiles (from one of those filesthat is produced when you compile... the ones we all ignore), however, the file it reads wasmade from the previous compile. Thus, if you only compile once, the file you are readingmight not be up-to-date. (Got it?)
See latexTemp.tex for additional comments on references.
Estimate Std. Error t value Pr(>|t|)(Intercept) -0.5758 1.4528 -0.40 0.7056
x 0.3775 0.1971 1.92 0.1039z 1.4042 1.7357 0.81 0.4494
Table 2: Neither x nor z were found to be statistically significant.
3.3 array environment
As we’ll see in Section 5, the array environment is very similar to the tabular environment,except that it is typically used for equations.
3.4 The R package, xtable
For R users who want to put R output into LaTeX, the package xtable is very useful:
> library(xtable) # to download the package, use install.packages(’xtable’)> x <- 1:9> z <- rnorm(9)> y <- x/7 + z*2 + rnorm(9)> xtable(summary(lm(y ~ x+z)))[... a bunch of output that can be copied/pasted into LaTeX ...]
The resulting table, directly copied/pasted from R: This can also be used for matrices,
Estimate Std. Error t value Pr(>|t|)(Intercept) -0.1563 0.6243 -0.25 0.8107
x 0.1094 0.1145 0.96 0.3760z 2.6170 0.4308 6.08 0.0009
data frames, and some other R objects.
8
4 Figures
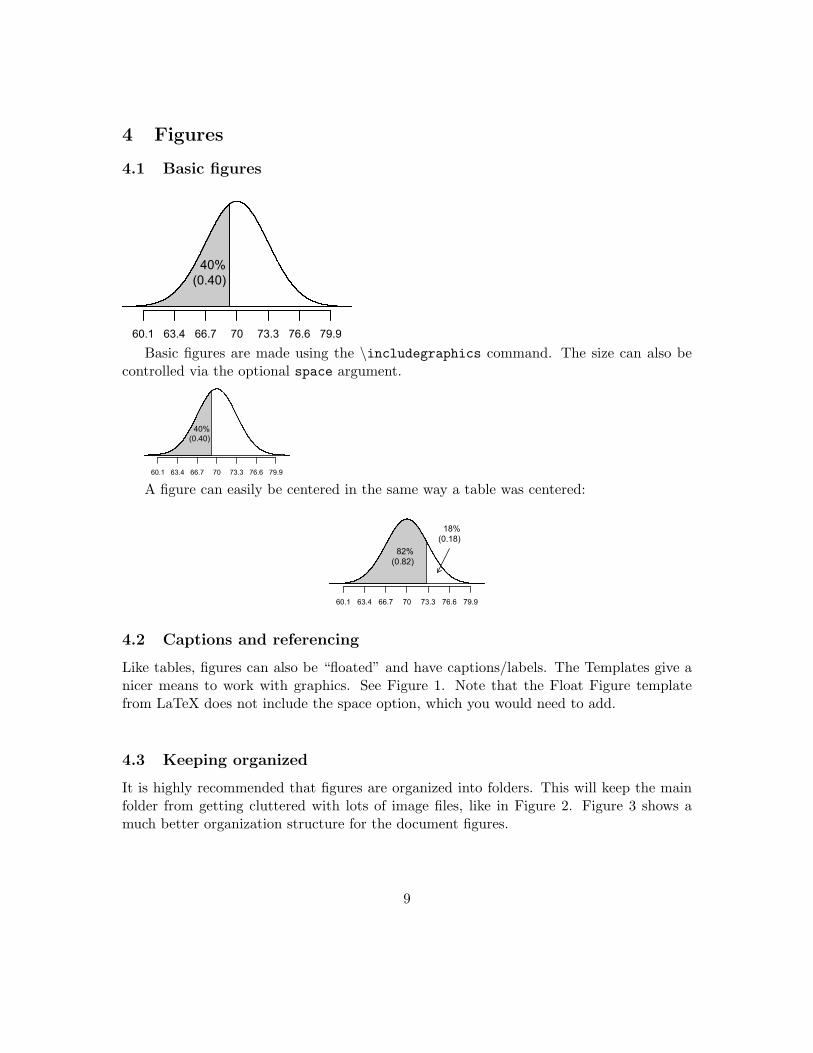
4.1 Basic figures
60.1 63.4 66.7 70 73.3 76.6 79.9
40%(0.40)
Basic figures are made using the \includegraphics command. The size can also becontrolled via the optional space argument.
60.1 63.4 66.7 70 73.3 76.6 79.9
40%(0.40)
A figure can easily be centered in the same way a table was centered:
60.1 63.4 66.7 70 73.3 76.6 79.9
82%(0.82)
18%(0.18)
4.2 Captions and referencing
Like tables, figures can also be “floated” and have captions/labels. The Templates give anicer means to work with graphics. See Figure 1. Note that the Float Figure templatefrom LaTeX does not include the space option, which you would need to add.
4.3 Keeping organized
It is highly recommended that figures are organized into folders. This will keep the mainfolder from getting cluttered with lots of image files, like in Figure 2. Figure 3 shows amuch better organization structure for the document figures.
9

Figure 1: Where to find your figure template.
Figure 2: Don’t do this. And name your files more carefully than this... “slideshow” is notspecific.
10

Figure 3: Organize your files more like this.
5 Math
5.1 Math in text
LaTeX makes it easy to add Greek letters like α, ζ, µ, etc. into text. In the same way,equations can be added easily as well: y = x3,
∑zj , x1 + · · ·+ xn.
Greek letters and math expressions such as α, ζ, y =√x log(x) can be inserted easily
using two dollar signs; it’s just a matter of remembering what the commands are for eachmath expression or symbol. For example, α is created using $\alpha$. Based on how αwas created, how would you think to create β?
The LaTeX and Matrix Panels have a large number of common symbols, letters, etc.and can be accessed by either alt-command-[dash/underscore key] or alt-command-[+/=key] in TeXShop or by navigating to them in the menu (see the “Window” menu inTeXShop). Some letters/symbols/etc that you can create...
~ı`<=∅∞∂∇4∀∃@>⊥†‡∑∏∫ ∮ ⋂
∩⋃∪⊎⊕⊗⊙
aaa
αβγδεεζηθικλµνξπ$%σςτυφϕχψω
The number of available symbols is enormous. If you want the symbol, it probablyexists in LaTeX.
11

There are a huge number of ways to construct expressions...
√2,
52 + 3
= 1,(
52 + 3
), 210 6= 210 = 1024, x1 = 3
x, 3 ≥ x, limx→0
(sin(x)x
)→ 1,
sin(x)x
x→0→ 1
5.2 Equation environment and referencing
Equations can also be put on their own line using the equation environment:
Abik =k∑l=1
i∑j=1
γαbjl (1)
Just like tables and figures, equations can also be referenced, such as Equation 1.
If you do not want a number assigned to your equation, use the eqnarray∗ environment:
Abik =k∑l=1
i∑j=1
γαbjl
One more example below in Equation 2...∞∑k=0
0.5k =1
1− 0.5= 2 (2)
5.3 Aligning
If there is a multiline equation, then use two amperstands (&) if any alignment is desired:
y = (x− b)2 + a
= x2 − 2bx+ b2 + a
If you don’t use this, the alignment is usually poor.
5.4 Arrays
Arrays are easily constructed using the Matrix Panel: σ21 σ1,2 σ1,3
σ2,1 σ22 σ2,3
σ3,1 σ3,2 σ23
Array construction is essentally identical to tables, except now it is easy to insert mathe-matics.
12

5.5 Some benefits of the package amsmath
The package amsmath is not in the LaTeX template, however, it can be very handy. If youhave a longer equation and only want a number for one line, then use \notag:
Cov((X
(k1)A − X(k1)
B
)√Ik1 ,
(X
(k2)A − X(k2)
B
)√Ik2
)= Cov
(X
(k1)A − X(k1)
B , X(k2)A − X(k2)
B
)√Ik1Ik2
= Cov(X
(k1)A − X(k1)
B , X(k2)A − X(k2)
B
)√Ik1Ik2 (3)
The package amsmath is required to use this command. This package is also required iftext is added to an equation using \text:
x =n∑i=1
xi and σ =
√√√√ 1n− 1
n∑i=1
(xi − x)2
Another example of eqnarray∗ with \text:
estimated time =distance of travelspeed of the car
+ any delays
6 Practice
Create a new document and produce the 3 items below. Be sure to update the \title and\author in your new document.
6.1 Try it #1
Make the output shown in Figure 4 using the tabular environment.
Figure 4: Try it #1.
6.2 Try it #2
Make the following image 0.8 inches tall, center it, add a caption, and add a reference. Writea sentence referencing the figure (using \ref) as well and compile your LaTeX document
13

twice so the reference works. (If you use the Float Figure Template be sure to add theheight option... alternatively, you might use an earlier LaTeX example as a template.)
60.1 63.4 66.7 70 73.3 76.6 79.9
82%(0.82)
18%(0.18)
6.3 Try it #3
Produce the equation in Figure 5 using the eqnarray∗ environment.
Figure 5: Try it #3.
14