latin america: highlights from the implementation of the ... · gonzalo pastor and lisbeth rivas...
TRANSCRIPT
WP/08/239
Latin America: Highlights from the Implementation of the System of National
Accounts 1993 (1993 SNA)
Roberto Olinto Ramos, Gonzalo Pastor, and Lisbeth Rivas


© 2008 International Monetary Fund WP/08/239 IMF Working Paper Statistics Department
Latin America: Highlights from the Implementation of the System of National Accounts 1993 (1993 SNA)
Prepared by Roberto Olinto Ramos, Gonzalo Pastor, and Lisbeth Rivas1
Authorized for distribution by Kimberly Zieschang
October 2008
Abstract
This Working Paper should not be reported as representing the views of the IMF. The views expressed in this Working Paper are those of the author(s) and do not necessarily represent those of the IMF or IMF policy. Working Papers describe research in progress by the author(s) and are published to elicit comments and to further debate.
This paper reviews the Latin American experience with the implementation of 1993 SNA and the updating of the national accounts’ base year. It also makes a preliminary assessment of the possible estimation biases in nominal GDP estimates stemming from the use of outdated national accounts base years, downwards biases with household final consumption estimates, and an overestimation of gross fixed capital formation in construction activities. JEL Classification Numbers: E01, B41, C82 Keywords: 1993 SNA implementation, Data Module of the ROSCs, GDP estimation biases Authors’ E-Mail Address: [email protected]; [email protected] ; [email protected]
1 Roberto Olinto Ramos is Division Chief for National Accounts at the Instituto Brasileiro de Geografia e Estatística (IBGE). Gonzalo Pastor and Lisbeth Rivas are Deputy Division Chief and Senior Economist, respectively, at the Real Sector Division of the IMF Statistics Department. The authors would like to thank Rob Edwards, Jesus Gonzalez-Garcia, Alfredo Leone, Roberto Rosales, and Kim Zieschang (all from the IMF Statistics Department), Vikram Haksar (IMF Western Hemisphere Department), and Ricardo Moraes Monte and Rebeca Palis (from IBGE) for their valuable comments and insights. All remaining errors are the authors’. Thanks are also due to Ms. Ione Marshall from the Caribbean Regional Technical Assistance Center (CARTAC), as well as to Messrs. Marconi, Ortuzar and Perez from the UN Economic Commission for Latin America and the Caribbean (ECLAC) on the provision of selected national accounts data for a number of countries in the region.
2
Contents Page
I. Introduction ............................................................................................................................4
II. Background ...........................................................................................................................5
III. Key Methodological and Data Source Upgrades.................................................................9
IV. Updating National Accounts in Latin America: A Preliminary Assessment ....................13 A. Quality Gaps vis-à-vis Best Practices .....................................................................14 B. Economic Dimensions of the Data Revisions .........................................................17 C. Remaining Data Puzzles..........................................................................................25
V. Estimation Bias in the Compilation of Nominal GDP Figures: A First Approximation ...37 A. Nominal GDP Under-estimation due to Outdated Base year and Lagging 1993 SNA Implementation............................................................................40 B. Under-estimation of Household Final Consumption Expenditure..........................41 C. Over-estimation of Gross Fixed Capital Formation in Construction ......................41
VI. Concluding Remarks .........................................................................................................44
VII. Selected Bibliography ......................................................................................................46 Figures 1. Median changes in Base year Nominal GDP: Expenditure Approach……………....19 2. Median changes in Base year Nominal GDP: Production Approach………..............19 3. Average Real GDP Per-capita Growth Rates Under Alternative NA Series………...21 4. Selected Countries: Share of Compensation to Employees in Total Nominal GDP...24 5. Brazil: Changes in Real Consumption Growth Rates Resulting from Comparing Old and New NationalAccounts……………………………..…………………………………...29 6. Latin America: Average Changes in Inventories, 2000-2005…………………..…...35 7. Latin America: Peak Value of Changes in Inventories, 2000-2005………………....36 8. Caribbean Region: Average Changes in Inventories, 2000-2005………….………...36 9. Caribbean Region: Peak Value of Changes in Inventories, 2000-2005………….…..37 Tables 1. Latin America and the Caribbean: Data ROSC: Summary of Results—National Accounts…………………………………………..………………………..………………..16 2. G8 Countries: Data ROSC: Summary of Results—National Accounts………………….17 3. Latin America: Difference in Real GDP Growth Rates Under New and Old National Accounts Statistics ……………………..……………………………………………………20 4. Latin America: Changes in GDP Structure due to Changes in National Accounts Statistics ……………………..……………………………………………………………...23 5. Changes in the Composition of Aggregate Demand Under New National Accounts Statistics ………………………………………………………………………………….….28
3
6. LAC Region: Simple Correlation Between Gross Fixed Capital Formation in Machinery and Equipment and Imports of Capital Goods…………………………………………........32 7. LAC Region: Gross Fixed capital Formation Ratios to GDP and Alternative ICOR Estimates………………………………………………………………….……….................33 8. LAC Region: Biases in Nominal GDPCalculations...........................................................39 9. Latin America: Sensitivity Analysis Under Alternative GDP Ratios of Gross Fixed Capital Formation in Construction, 1995-2005……………………………………..……….43 Boxes 1. Changing the Base Year: What does it Imply?..............................................................6 2. Latin America: Impact on Nominal GDP Levels from Changes in Base Year and Implementation of 1993 SNA………………………………………………...……………….8 3. 1993 SNA Main Methodological Changes from 1968 SNA.........................................11 4. Reconciliation of Household Survey and National Accounts Households Final Consumption Expenditure Data ……………………………………………………………..30 5. Issues with the Calculation of Gross Fixed Capital Formation in Construction Activities……………………………………………………………………………………..34 6. Latin America: Status of 1993 SNA Implementation—Replies to IBGE’s Questionnaires………………………………………………………………………………..38 Appendix Tables 1. Latin America and the Caribbean: Inclusion of Selected Variables in the National Accounts Statistics and Consumer Price Index (CPI) ………………………….………...….49 2. Latin America and the Caribbean1993 SNA Implementation Status and National Accounts Statistics Vintage Base Year ..…………………………………………………….50 3. Latin America: Change in Base Year Nominal GDP Estimates………………………….51

4
I. INTRODUCTION
Evidence-based policy design and execution has become a key topic of discussion in international forums in recent years. There is broad consensus about the consequences (in terms of economic and financial costs) that tend to occur when policy makers either do not have reliable evidence on which to base and assess the outcomes of their decisions, or do not take full advantage of the available data when making policy. For all countries, employing evidence-based economic policy designs helps identify factors and/or sectors of production where they may have comparative advantage in a globalizing world economy. For middle-and low-income countries, evidence-based policymaking also has gained momentum in improving the governance of democratic regimes by making incumbent administrations more accountable to the public, and in advancing governments’ efforts to assess and address the poverty indicators measuring national achievement relative to the UN Millennium Development Goals (MDGs). Statisticians and economists of domestic and international financial institutions have responded to the need for reliable and comprehensive economic data by launching data compilation efforts that provide the evidence for these new policy regimes. At the same time, the effort to produce more comprehensive, robust, and methodologically-sound statistics to make policy choices has been complemented by invigorated data dissemination programs to instill a culture among analysts, policymakers, and the public to make more effective use of the available information. Addressing the latter issue is an ongoing challenge for data compilers and governments of advanced as well as developing countries. Indeed, the evidence for the United States, for example, suggests that some important economic decisions have been made without a full assessment of the available facts.2 The search for more and better evidence about how national economies work has brought to the fore the need to produce reliable national accounts statistics, particularly the production and income accounts. The best known statistic from these accounts is the Gross Domestic Product (GDP), which is the key metric in the statistical system for measuring economic performance. For Latin America, the recent emphasis on implementing evidence-based policy has coincided with a period of high growth and macroeconomic stability.This has given scope within fiscal budgets to support multiyear programs aimed at significantly improving the national accounts. These statistical development programs have produced consistent annual and quarterly national accounts data that incorporate best international statistical practices—as recommended in the United Nations’ System of National Accounts 1993 (henceforth 1993 SNA)—and which are now regularly used for policy making and economic debate. This paper reviews the evidence from the recent revisions to national accounts series in Latin America in the context of the 1993 SNA implementation and the governments’ efforts to produce more comprehensive and robust national accounts. Section II provides background on the implementation of the 1993 SNA in Latin America, while emphasizing the evidence 2 See Blinder and Krueger (2004).
5
for those countries that have simultaneously implemented 1993 SNA and changed the base year in the compilation of their national accounts. Section III describes the main methodological upgrades and improved source/basic data collection efforts undertaken by host countries in the context of revising their national accounts data. Section IV elaborates on the countries’ gains from the compilation of new national accounts in terms of (i) convergence towards best international accounting practices and (ii) the measurement of key macroeconomic aggregates and economic indicators. Section V looks forward. It reviews the remaining source data limitations facing countries in the broad Latin America and the Caribbean (LAC) region 3 and concludes that pending updates in the national accounts base year (particularly improvements in the coverage of services and informal activities) and efforts to fully implement the 1993 SNA methodology could yield a median increase of 8.8 percent in nominal GDP figures for countries in the region (i.e., some 6.5 percent increase on a GDP-weighted average basis). Other measurement errors stemming from (i) downwards estimation biases of household final consumption expenditure and (ii) a possible over-estimation of gross fixed capital formation in construction activities are smaller than those due to pending updates in national accounts statistics base years, although they should affect the composition of GDP from the expenditure side. Finally, the value of changes in inventories is yet another variable subject to important estimation errors in the national accounts statistics in some countries in the region, although its impact on the accuracy of GDP estimates is difficult to assess.
To address the referred compilation/estimation weaknesses, LACs could develop a time-bound action plan for countries to implement common statistical norms—covering basic data definitions, classifications, source data coverage, and compilation and dissemination practices—harmonizing the national accounts of Latin American countries. The experience by Eurostat with the harmonization of national accounts statistics within the European Union may be a useful reference in this regard. Section VI sums up the main findings from our cross-country analysis.
II. BACKGROUND
Since the 1940s, countries in Latin America have been engaged in compiling integrated systems of national accounts consistent with the methodological manuals produced by the United Nations (UN). Economic diagnosis and policy design in the region has focused on key macroeconomic variables such as GDP, total final consumption, investment (gross capital formation) and saving aggregates. These national accounts aggregates have become critical indicators of policy effectiveness as countries implemented a variety of economic development programs to raise living standards and address poverty. Best practices on the compilation of national accounts have changed over the years to respond to the transformation of the world economy. An extensive expert consultation process during the 1980s led to the revision of the 1968 System of National Accounts manual
3 Comprising a total of 33 countries, including Cuba (see Appendices Tables 1 and 2).

6
(1968 SNA) and the issuing of the 1993 SNA. The voluminous 1993 SNA manual sought to add conceptual and methodological clarity to the earlier manual, while pursuing leadership and harmonization with statistical manuals in the areas of government finance, monetary and financial statistics, and balance of payments. On the latter, the publication of the Fifth Edition of the Balance of Payments Manual (BPM5) by the IMF in 1993 was an important complement to the UN methodological work on national accounts by the Inter-Secretariat Working Group on National Accounts (UN, IMF, OECD, Eurostat, and the World Bank). For the countries, the task from 1993 onwards has been to design and implement working plans to upgrade their national accounts and balance of payments statistics in line with the 1993 SNA’s and BPM5’s recommendations, respectively. To date, as many as 23 countries in Latin America and the Caribbean have, to various degrees, implemented these methodological guidelines (Appendix Table 3). Yet, a narrower set of countries has implemented the system’s guidelines along and changed in the accounts’ base year (Box 1).
Box 1. Changing the Base Year: What does it imply? In many Latin American countries, the core of the national accounts is the size and composition of GDP calculated from the production approach. GDP of the various activities and sectors of the economy is commonly calculated on the basis of censuses, administrative records, and surveys. Regularly conducting a comprehensive census of all registered companies and establishments would allow the authorities to keep good track of changes in the size and structure of the economy. However, because of the high cost and complexity of the exercise, comprehensive censuses are only carried out for certain “base years.” The results of annual surveys completed for a representative sample of enterprises and establishments are used to compile the national accounts for the following years. Base year estimates tend to become obsolete with the passage of time. The appearance of new economic activities and the termination of others due, inter alia, to technological and institutional developments lead to changes in values and relative prices of goods and services. Updating the base year thus become imperative. This include revisions of the national accounts’ coverage, structure, and relative prices. The 1993 SNA recommends updating the base year every five years. Main criteria for the selection of a new base year are the following. It should be a year with a “reasonably normal” behavior of relative prices, as the estimates at constant prices for the subsequent years will reflect the structure of prices of the base year. It should be a normal year in terms of price stability, economic growth, and the absence of major economic shocks (e.g., natural disasters, financial crises, undue high inflation and/or price controls, launching of major price, trade and/or financial liberalization). It should be a period in which comprehensive censuses or an updated business directory/register and other economic surveys are available; the objective is to have/use the greater amount of basic information as far as production structures, costs, prices and levels of the real and financial transactions of the economy. It should be a recent year so as to capture the current characteristics of the economy.
7
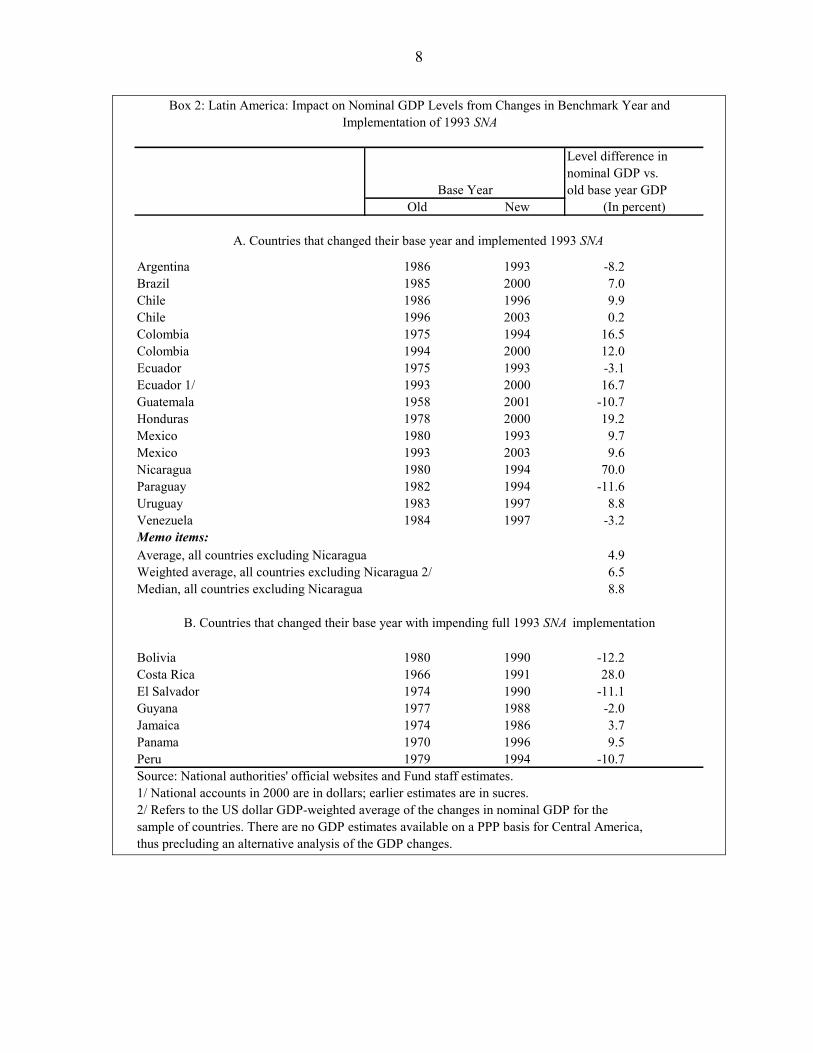
The financial and human resources allocated to the production of the new national accounts statistics have been substantial and have included multi-year efforts by a number of public and private institutions—including technical and financial support from bilateral and International Financial Institutions—working together towards the compilation of the new data.4 On average, it has taken about 5 or 6 years for the country authorities to complete a national accounts revision project and issue new time series. The IMF has contributed to this work by fielding of technical assistance and multisector missions, training, and assessments of macroeconomic statistics under the Data Module of the Report on the Observance of Standards and Codes (data ROSC).5 The data ROSCs have been structured according to the IMF Data Quality Assessment Framework (DQAF) covering six data quality dimensions: (i) prerequisites of data quality, including legal and institutional environment, and resources that are commensurate with the needs of statistical programs; (ii) assurances of integrity, including professionalism, transparency, ethical standards; (iii) methodological soundness, including data concepts and definitions, scope, classification/sectorization, and basis for recording; (iv) accuracy and reliability, including source data, assessment of source data, statistical techniques, assessment and validation of intermediate data and statistical outputs, and revision studies; (v) serviceability, including periodicity and timeliness, consistency, revision policy and practice; and (vi) accessibility, including data and metadata accessibility, and assistance to data users. Overall, the data ROSC, by comprehensively assessing the economic statistical system, have reportedly invigorated local efforts to stir and focus this complex multi-year data collection exercise. Other international financial institutions like, for example, ECLAC have also hosted active forums for discussion, training, and monitoring of the 1993 SNA implementation program in the region. Countries in the region have undertaken work in two main areas since 1993. First, they have used more comprehensive and robust source data for compiling new national accounts’ base years. Second, there have been changes/improvements in the national accounts’ compilation methodology following the 1993 SNA recommendations and technical advice stemming from IMF technical assistance and multisector missions, as well as the data ROSC. According to the evidence, the combined implementation of changes in the national accounts’ base year and 1993 SNA statistical methodologies (which includes 16 country cases to date; see Box 2) has generally resulted in increases in nominal GDP levels (for the base year assessed under the old and new methodology) with a median increase of 8.8 percent
4 Financial institutions supporting local efforts to upgrade national accounts statistics have included, among others, the InterAmerican Development Bank, the World Bank, the Economic Commission for Latin America and the Caribbean (ECLAC), the International Monetary Fund (IMF), the US Agency for International Development (USAID), the Center for Latin American Monetary Studies (CEMLA), and the Executive Secretariat of the Central American Monetary Council (SECMCA).
5 In recent years, Latin America has received an average of 5.1 person years per year in technical assistance provided by the IMF Statistics department.
8
Level difference innominal GDP vs.old base year GDP
Old New
Argentina 1986 1993 -8.2Brazil 1985 2000 7.0Chile 1986 1996 9.9Chile 1996 2003 0.2Colombia 1975 1994 16.5Colombia 1994 2000 12.0Ecuador 1975 1993 -3.1Ecuador 1/ 1993 2000 16.7Guatemala 1958 2001 -10.7Honduras 1978 2000 19.2Mexico 1980 1993 9.7Mexico 1993 2003 9.6Nicaragua 1980 1994 70.0Paraguay 1982 1994 -11.6Uruguay 1983 1997 8.8Venezuela 1984 1997 -3.2Memo items:Average, all countries excluding Nicaragua 4.9Weighted average, all countries excluding Nicaragua 2/ 6.5Median, all countries excluding Nicaragua 8.8
Bolivia 1980 1990 -12.2Costa Rica 1966 1991 28.0El Salvador 1974 1990 -11.1Guyana 1977 1988 -2.0Jamaica 1974 1986 3.7Panama 1970 1996 9.5Peru 1979 1994 -10.7Source: National authorities' official websites and Fund staff estimates.1/ National accounts in 2000 are in dollars; earlier estimates are in sucres.2/ Refers to the US dollar GDP-weighted average of the changes in nominal GDP for the sample of countries. There are no GDP estimates available on a PPP basis for Central America,thus precluding an alternative analysis of the GDP changes.
Box 2: Latin America: Impact on Nominal GDP Levels from Changes in Benchmark Year and Implementation of 1993 SNA
A. Countries that changed their base year and implemented 1993 SNA
B. Countries that changed their base year with impending full 1993 SNA implementation
Base Year(In percent)
9
(i.e., a 6.5 percent increase on a GDP-weighted average basis).6 Reductions in nominal GDP levels from the simultaneous implementation of 1993 SNA and the rebasing of the national accounts happened in less than 31 percent of the cases (5 country cases out of a total of 16 cases). In all cases, analysts and policymakers have welcomed incorporation of new source data and updating of base years, as the old national accounts and their corresponding base years—usually dating from the 1980s or some 15 years old—were considered outdated to adequately capture the changes in sectoral values of production, volumes, and prices that had taken place in the domestic economy. The revised national accounts data also have strengthened the production of robust high-frequency economic indicators such as production, price, and employment series.
III. KEY METHODOLOGICAL AND DATA SOURCE UPGRADES
Methodological upgrades The 1993 SNA includes a number of methodological recommendations and tables that have been implemented on a case-by-case basis depending on the economic and institutional characteristics of the various countries in the region and the available resources to conduct additional surveys and censuses (Box 3). Notably, significant detail has been added to trace not only the production of goods and services, but also its mirror image (i.e., sequence of accounts) in terms of income generation/distribution/redistribution/use, the accumulation of capital, the financing, and the country’s stocks of assets and liabilities at a given point in time. This set of integrated accounts has been devised for all key institutional sectors, such as households, the financial and non-financial corporations, the general government, the nonprofit institutions serving households, and the rest of the world. The thrust of the analysis has been to center the compilation efforts with the decision-making economic units, which are the institutional sectors noted above. In addition, the 1993 SNA includes a number of consistency-check tools, such as the Supply and Use tables to ensure the elementary balance between supply and demand of goods and services in the economy at current and constant prices, and fill in data gaps. On the latter, in particular, the 1993 SNA recommends that, if the objective is to measure the actual movement of volumes from period to period, indices of supply and use of goods and services should be compiled only between consecutive time periods. Changes in volumes between periods that are separated in time are then obtained by cumulating the short-term movements; i.e., by linking the indices between consecutive periods together to form “chain indices.” Chain indices better reflect the changing patterns of relative prices over time as the volume weights are updated every year along with the observed volumes that are demanded and/or
6 The extreme case of Nicaragua’s March 2003 revision of the national accounts, which raised the level of nominal GDP of 2000 by 70 percent, is excluded from this calculation. Revisions to the national accounts statistics addressed major deficiencies in the coverage of economic activities and an outdated base year.

10
produced in the economy. They significantly improve the relevance of national accounts price and volume data.7 Other analytical tools from the 1993 SNA include methodological tables to reconcile the system’s rest of the world accounts with the balance of payments (flows) and the country’s international investment position (stocks). Two underlying accounting principles included in the 1993 SNA are the double-entry rule for the recording of all transactions and the accrual accounting principle—rather than cash—for recording transactions among economic agents, all valued at market prices. Data source upgrades Data demands for a simultaneous change in national accounts’ base year and a thorough implementation of the 1993 SNA methodological recommendations have been quite significant, involving economists, statisticians, and data collectors working together. Main areas of action to improve national accounts data have included, inter alia:
(i) launching new household income and budget expenditure surveys to update households’ representative consumption levels and structures, as well as to collect data on household employment matrices and on household productive activities, in particular on informal activities;
(ii) updating the business registry (with emphasis on the non-recorded formal
enterprises; enterprise births and deaths (i.e., businesses’ demography); and small enterprises operating in the informal sector) to support data collection surveys, selecting representative statistical samples on output values, volumes, cost structures, incomes and expenditures, and balance sheet data based on the enhanced registry information;
(iii) improving the survey methods for financial and non-financial public
corporations, as well as for the budgetary and extra-budgetary institutions of the central, regional, and local governments, the social security system, and nonprofit public institutions;
(iv) using tax declarations of financial and nonfinancial corporations to improve
national accounts estimates;
7 Brazil and Guatemala use chain indices in their revised national accounts.

11
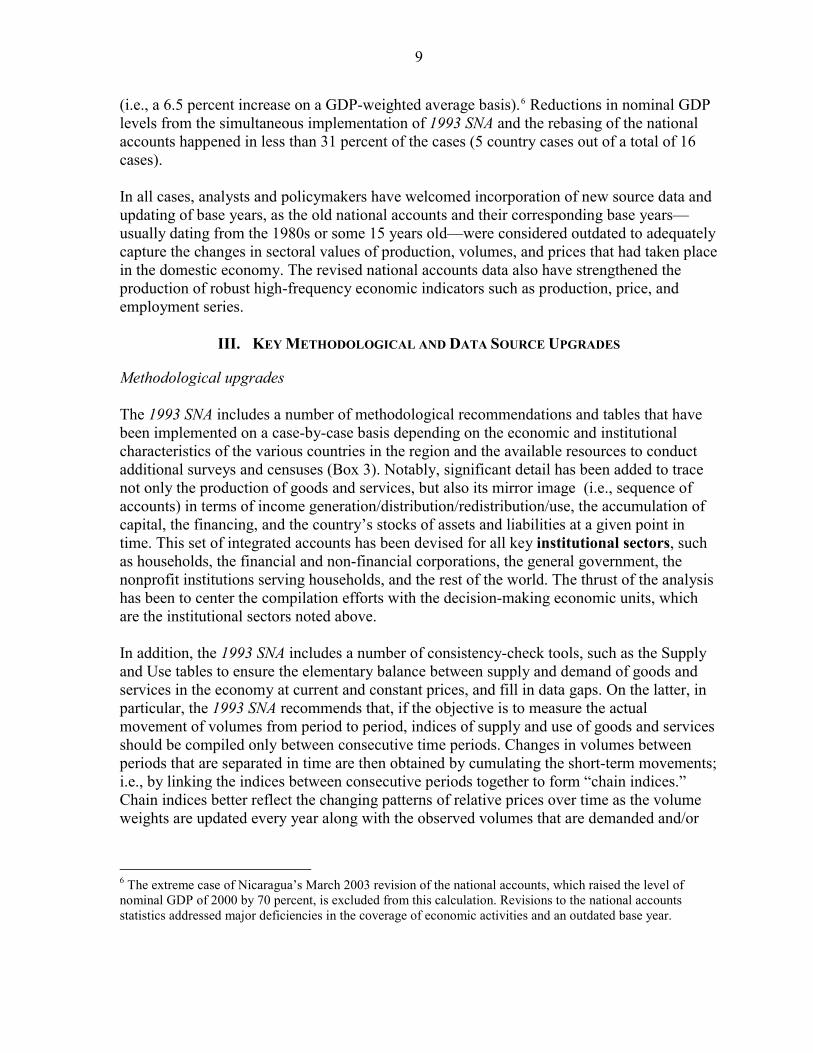
Box 3: 1993 SNA Main Methodological Changes from 1968 SNA8
1993 SNA 1968 SNA Valuation of output and value added is done at basic prices, thus excluding taxes on products and subsidies..
Valuation of output and value added included all taxes on products and subsidies, net of invoiced value added tax.
The 1993 SNA classifies output depending on whether production is traded or not in the market. Market output is output sold at prices that economically significant or otherwise disposed of on the market. Output produced for own final use are goods and services that are retained for the own final use by the owners of the enterprises in which they were produced. Other non-market output are goods and services produced by non-profit institutions serving households or governments that are supplied free, or at prices that are not economically significant, to other institutional units.
The 1993 SNA distinction between market producers, producers for own final use and other non-market producers replaced the distinction in the 1968 SNA between “industries” and “other producers.”
The 1993 SNA recommends the inclusion of work-in-progress in the measurement of agricultural, forestry and livestock production. Work in progress is valued at producer costs plus a notional profit markup. On the demand side, it is allocated either as inventories or gross capital formation depending on the type of product.
The 1968 SNA registered agricultural, forestry and livestock production only at the time of the harvest, felling, and/or commercialization. Producers for own final use which were included in the 1968 SNA under “industries” are distinguished as a separate category in 1993 SNA.
The 1993 SNA introduced new concepts in the compilation of the primary distribution and use of income accounts. Mixed income is defined as the operating surplus generated by unincorporated enterprises owned by households. Household actual final consumption is the consumption of goods and services by individual households by expenditure or through social transfers in kind received from the government or non-profit institutions serving households.
The 1968 SNA had a wider concept of final consumption expenditure of households than the 1993 SNA, as it included not only what households actually paid, but also health and other expenditures paid or reimbursed by government for services that households are free to select or not. The 1968 SNA did not include the concept of mixed income.
The 1993 SNA makes it clear that the illegality of a productive activity or transaction is not a reason for excluding it from the System. Illegal production could be: (i) production of goods or services that is forbidden by law and (ii) activities which are usually legal but which become illegal when carried out by unauthorized producers. Concealed production and the underground economy are also addressed by the 1993 SNA.
The 1968 SNA did not give clear guidance on the coverage of illegal activities in the system of national accounts.
8 Sources: Annex I to 1993 SNA and Harrison (1990). An update of 1993 SNA is currently underway covering a total of 44 analytical methodological issues which are being thoroughly discussed by national accounts’ experts.
12
Box 3: 1993 SNA Main Methodological Changes from 1968 SNA (Concluded)
1993 SNA 1968 SNA The 1993 SNA broadens the definition of gross fixed capital formation to include expenditure on (i) mineral exploration, (ii) computer software and entertainment, (iii) literary or artistic originals, and (iv) military expenses in fixed assets that could be used continuously and repeatedly in production (e.g., airports, roads, docks, other buildings and dwellings); expenses in the form of destructive weapons are excluded from the definition of fixed assets. Like the 1968 SNA, the 1993 SNA continues to treat expenditures on research and development as intermediate consumption, not gross fixed capital formation.
Expenditures on mineral exploration were treated as intermediate consumption. All purchased software other than pre-installed software supplied with hardware was registered as intermediate consumption. Pre-installed software supplied with hardware was considered capital formation (machinery). The production of entertainment, literary and artistic originals was not considered as production. Almost all military expenditures, except those on construction or alteration of family dwellings for personnel of the armed forces, were excluded from gross fixed capital formation.
The 1993 SNA calculates the output of financial intermediation services indirectly measured (FISIM) as the total property income receivable by financial intermediaries minus their total interest payable, excluding any property income receivable from the investment of their own funds. In principle, the total output of FISIM is to be allocated between users—who could be lenders or borrowers—treating the allocated amounts either intermediate consumption of by enterprises or as final consumption or exports.. The 1993 SNA recognizes that, in practice, it may be difficult to find a method of allocating the total output among different users; some flexibility in implementation is therefore accepted.
The 1968 SNA used the term “ bank services charges” when referring to FISIM. The 1968 SNA and 1993 SNA estimate the FISIM concept in the same manner. However, under the 1968 SNA, the whole value of “bank service charges” was allocated to intermediate consumption of a notional industry.
Under the 1993 SNA, the measurement of financial intermediation services provided by central banks is sought along the same lines as FISIM. Central banks’ financial intermediation output is to be valued as the difference between total income receivable and total interest payable, excluding any income receivable from the management of the country’s international reserves. The 1993 SNA recommends flexibility with the implementation of this recommendation, as the estimated output could be small or even negative for some cases. In those circumstances, a solution could be to assess central banks’ output by their operational costs (see SNA News & Notes No3, Jan. 1996).
The 1968 SNA measured financial intermediation services provided by central banks along the same lines of “bank service charges” applicable to other financial intermediaries.
The measurement of insurance services includes the income accruing from the investment of insurance companies’ technical reserves in the calculation of the services provided to the policyholders.
The output of non-life insurance services did not include revenues from corporations’ investments of insurance technical reserves.
The 1993 SNA recommends the valuation of imports of goods on fob basis in the Rest of the World Account.
Imports of merchandise were recorded on cif basis in the Rest of the World Account.
13
(v) developing new deflators to assess national accounts at constant prices (i.e., in volume terms), which has generally involved a simultaneous update of the base year households’ consumption levels and structures, and the issuing of a revised Consumer Price Index (CPI). Producer price indices (PPIs) to deflate the output of financial and non-financial corporations have also been revised in the context of rebasing the national accounts and developing production volume indices. Volume and value indices for exports and imports of goods and services (and their respective unit value indices) have also been produced/upgraded;
(vi) reassessing the coverage, recording and classification of balance of payments
transactions; and (vii) producing high-frequency indicators supporting the compilation of a robust
system of national accounts consisting of quarterly and annual GDP and income series. Dissemination practices of the national accounts and source data have also improved in the context of 1993 SNA implementation. The use of the internet and the gradual establishment of “contact points” at the national statistics departments/institutes to service data users have been instrumental in sustaining the governments’ efforts to produce quality macro data.
IV. UPDATING NATIONAL ACCOUNTS IN LATIN AMERICA: A PRELIMINARY ASSESSMENT
This section elaborates on the main results achieved by updating the national accounts’ base year and implementing the 1993 SNA in Latin American countries. It stresses the gains achieved in terms of applying best international accounting practices and discusses the implications of these data revisions for economic analysis. On the latter, it assesses the impact of the national accounts revisions on nominal GDP levels, real GDP growth rates, and the composition of GDP on the production, expenditure, and income approaches. The section concludes with an overview of the remaining data puzzles stemming from the re-basing of the national accounts, which include a reported coexistence of higher economic growth and an important reduction in total consumption as a share of GDP in the majority of the countries that revised their national accounts estimates. Also, the ratios of gross capital formation and their implicit incremental capital output ratios (ICORs) have remained somewhat high by international standards (at an average value of 5.6), suggesting relatively low productivity of capital.9
9 The incremental Capital-Output Ratio (ICOR) is the ratio of the share of investment in nominal GDP to the economy’s real growth rate. In the standard Harrod-Domar economic growth model the ICOR equals to 1 divided by the marginal productivity of capital. The higher the ICOR, the lower would be the productivity of capital. The ICOR can be thought of as a measure of the inefficiency with which capital is used. In most industrialized countries the ICOR is in the neighborhood of 3-3.5. The World Bank Statistical Manual (available in the internet) as well as Wikipedia, the Free Encyclopedia (http://en.wikipedia.org/wiki/Incremental_Capital-Output_Ratio) provide a basic description of the ICOR concept.
14
A. Quality Gaps vis-à-vis Best Practices
As noted above, the IMF staff, in the context of the data ROSC conducted on the basis of the DQAFs has sought to identify strengths and weaknesses in six data quality dimensions (e.g., prerequisites of quality, assurances of integrity, methodological soundness, accuracy and reliability, serviceability, and accessibility by users) for five data sets: national accounts, price, balance of payments, government finance, and monetary and financial statistics. To date, some 114 data ROSC (including updates) have been conducted by the IMF staff, including for ten out of the thirteen Latin American countries that have changed their national accounts base year along with the 1993 SNA implementation. Data Module of the ROSC missions in Latin America have generally taken place before or while the new national accounts were still under preparation, with the missions’ results and recommendations supporting host countries’ efforts to improve the quality of the national accounts statistics. In assessing the relevance of these issues the IMF staff has used as benchmarks the methodological recommendations included in the 1993 SNA, as well as information/practices from countries around the world in the national accounts compilation.10 The latter, in particular, has allowed the staff to qualify whether an existing practice falls within or below the international standard. Categories applied for the ranking of activities have been fourth fold depending on whether a practice is observed (O), meaning that the statistical routine meets international best practices; practice is largely observed (LO); practice is largely not observed (LNO); or practice is not observed (NO) (see Table 1). The data quality assessments/ratings granted to Latin American countries could be further analyzed by comparing them against those granted to the six G-8 countries that have participated in the Data Module of the ROSC. The following observations emerge from this comparative analysis (Table 2): • Latin American countries lagged in all six data quality dimensions assessed, although
the gaps varied significantly across them.
• In terms of prerequisites of quality (DQAF 0) and assurances of integrity (DQAF 1), the Latin American countries compared relatively well on account of strong and growing inter-institutional coordination among data producers and compilers. The ROSC assessments also suggest adequate emphasis by data producers regarding the production of “quality” statistics, although a pending challenge refers to the allocation of commensurate resources to run the statistical programs (i.e., adequate funding of staff training and physical capital upgrades, updating of business directories, launching of regular data collection surveys and censuses, use of the International Standard Industrial Classification of All Economic Activities (ISIC) Revision 3 and the Central Product Classification (CPC) for purposes of national accounts’
10 See also Rivas (2007a) for an analysis of the data ROSC in Latin America.
15
Honduras,
compilation, and change in national accounts’ base year every five years, as recommended by 1993 SNA).
• By contrast, data dimensions regarding accuracy and reliability (DQAF 3) and methodological soundness (DQAF 2) show the highest needs for improvement.
• Latin American countries show relatively poor source data (DQAF 3.1), as well as weaknesses in the statistical techniques employed (DQAF 3.3) and the assessment of intermediate data results (DQAF 3.4). On statistical techniques, countries tend to use Supply and Use Tables with outdated fixed technical coefficients and lack data revision policies to track data reliability overtime. In this context, a recurrent recommendation from the data ROSC has been the need to implement more comprehensive source data collection programs for rapidly-growing industries in the manufacturing and services sectors, as well as to improve estimates for the non-observed and informal sectors of the economy. The revision of fixed technical coefficients used in the countries’ input-output tables has been another avenue for prospective data quality improvement.
• Metadata accessibility to users (DQAF 5.2) and assistance to data users (DQAF 5.3) are quality dimensions that also need further improvement in Latin American countries.
Overall, the data ROSCs conducted in Latin America appear to have been opportune, pointing at critical areas for data quality improvements that gained importance as the countries revised their official macroeconomic statistics. The updated national accounts series—finalized and published years after the conduct of the respective data ROSC—suggest progress in addressing data quality weaknesses in terms of their methodological soundness (DQAF 2) and accuracy and reliability (DQAF 3). For example, in the case of Colombia, the Statistics Bureau (Departamento Administrativo Nacional de Estadística, DANE) estimates that more than 86 percent of the level increase in nominal GDP for the year 2000 using a revised base year is due to improvements in source data, with the remainder being explained by changes in the national accounts’ methodology.11 Similarly, for
11 Colombia, Departamento Administrativo Nacional de Estadística (2007b), www.dane.gov.co. Along the 1993 SNA recommendations, Colombia’s national accounts cover the growth and production of illicit products such as marihuana, cocaine, and other drugs and drug derivates. Bolivia’s national accounts also cover the production of coca leaf and its derivates.

Colom_ Costa Ecua_ Guate_ El Salva_ Hon_ Nicara_ Pana_ Para_ Rep.DQAF data quality dimensions Bolivia 1/ Chile 2/ 3/ bia 2/ Rica 1/ dor 2/ mala 2/ dor 1/ duras 2/ Mexico 2/ gua 2/ ma 2/ guay 2/ Peru 1/ Dom. 2/0. Prerequisites of quality0.1 Legal and institutional environment LO LO LO LO LO LO LO LO LO LO LO LO LO LO0.2 Resources LO O LNO O LO LO LNO LO O O LO LNO LNO LO0.3 Relevance LO LO LO LO O LO LO LO O LO O LO LO LO0.4 Other quality management O O O LO O LO … LO O LO LO O LO O1. Assurances of integrity1.1 Professionalism O O O O O LO O O O O O O O O1.2 Transparency LO O O LO O LO LO LO O O LO O LNO LO1.3 Ethical standards O O O O O O O O O O O O O O2. Methodological soundness2.1 Concepts and definitions LO O O O O LNO LO LNO O O O O LO O2.2 Scope LO LO LO O O LNO LNO LO O O O LO LO O2.3 Classification/sectorization LO LO O LO LO LNO LNO LNO LO O O LO LO LO2.4 Basis for recording O LO O O LO LO LO LO O LO LO LO LO O3. Accuracy and reliability3.1 Source data LNO LO LO LNO LO LNO LNO LO LO LO LO LO LNO LNO3.2 Assessment of source data LO LO O O LNO LNO LO O O LO O LNO LO3.3 Statistical techniques LNO LO LO LNO O LNO LO LNO LNO LO LNO LNO LNO LNO3.4 Assessment and validation of intermediate dataand statistical outputs O LO LO LO O LNO O LO LO O LO O LO O3.5 Revision studies LO O NO LNO LO LNO LO LNO LO LNO LNO LO LO LNO4. Serviceability4.1 Periodicity and timeliness O O LO O O O O O O O O LO LO O4.2 Consistency LO O O LO O LNO LO LO O O LO LO LO LO4.3 Revision policy and practice LO O LO LO LO LNO LO LO O LO LO LO LO LO5. Accessibility5.1 Data accessibility LO LO O O O LO O LNO O LO LO LO O LO5.2 Metadata accessibility O O O LNO LO LNO LO LNO O LO O LO LO LNO5.3 Assistance to users O O O LO O LO LO LO O O LO LO O LOSource: Data ROSC reports; www.imf.org.1/ Refers to countries that undertook and published Data Module of the ROSC, but either did not change their base year and/or implement SNA93 .2/ Refers to countries that have implemented SNA93 along with a change in their national accounts' (NA) base year, and publishedthe Data ROSC.3/ Data ROSC update conducted in April/May 2007.
Table 1. Latin America and the Caribbean: Data ROSC: Summary of Results--National Accounts
16

17
DQAF data quality dimensions Canada Germany Japan Italy France Russia0. Prerequisites of quality0.1 Legal and institutional environment O O O O O LNO0.2 Resources O O LNO LO LO LNO0.3 Relevance O O O O O LO0.4 Other quality management O O O O O O1. Assurances of integrity1.1 Professionalism O O O O O O1.2 Transparency O O O O O O1.3 Ethical standards O O O O O O2. Methodological soundness2.1 Concepts and definitions O O O O O O2.2 Scope O O O O O O2.3 Classification/sectorization O O O O O LNO2.4 Basis for recording LO O O O O O3. Accuracy and reliability3.1 Source data O LO LO O O LO3.2 Assessment of source data O O LO O LO LO3.3 Statistical techniques O O O LO O O3.4 Assessment and validation of intermediate dataand statistical outputs O O O O O O3.5 Revision studies O O LNO O O O4. Serviceability4.1 Periodicity and timeliness O O O O O O4.2 Consistency O O O O O O4.3 Revision policy and practice O O O O LO O5. Accessibility5.1 Data accessibility O O O O O LO5.2 Metadata accessibility O O O O O LO5.3 Assistance to users O O O O O OSource: Data ROSC reports; www.imf.org.
Table 2. G8 Countries: Data ROSC: Summary of Results--National Accounts
its Central Bank has reported that 60 percent of the level increase in nominal GDP for the year 2000 under the new time series is due to improvements in source data and improved sectoral coverage, while the other 40 percent reflects the implementation of new statistical methodologies recommended under the 1993 SNA. Most likely, an update of the Data Module of the ROSC should significantly improve the ratings granted to Honduras before the recent national accounts data revisions.
B. Economic Dimensions of the Data Revisions
The updating of national accounts statistics has generally led to revisions of income per-capita and real GDP growth rates, and changes in the composition of the supply and demand (uses) side of the economy and the primary distribution of income. Higher nominal and real GDP estimates National accounts revisions in Latin American countries have generally resulted in level-changes in nominal GDP values within a range of -8.2 to 19.2 percent (excluding Nicaragua)

18
with an unweighted median increase of 8.8 percent compared with the old base year estimates.12 From the GDP expenditure approach, there were significant increases, albeit with variances across countries, in gross fixed capital formation, although total final consumption was also adjusted upwards in the context of the national accounts revisions. From the GDP production approach, there was a notable decline in the estimated value added of agriculture, hunting, forestry, and fishing, while nominal value added estimates for other sectors, including, in particular, construction and services, were revised upwards (Figures 1-2 and Appendix Table 3). The resulting data revisions have led to changes in the ratios to GDP of economic variables, such as the fiscal deficit, the current account balance, external debt, and tax revenues, which are widely used in financial programming and policy decision making. National accounts statistics revisions have resulted in changes in GDP per-capita ratios which, at times, resulted in reassessments of the relative ranking of countries within the region and of the administrative classifications of countries such as the lists of Low-Income Member Countries and Heavily Indebted Poor Countries (HIPC). Real economic growth rates were also revised as a result of the updating of national accounts statistics, with real GDP growth rates being on average 0.2 percentage points higher than with the old national accounts base year, albeit with significant variations across countries (Table 3). On a real GDP per-capita basis, the revisions to the national accounts statistics have generally emphasized a much better (or less negative) economic growth performance than previously assessed (Figure 3).
12 The GDP-weighted average of the changes in nominal GDP for the sample of countries is 6.5 percent (see Box 2).

19
Figure 1. Median Changes in Base Year Nominal GDP Levels: Expenditure Approach (In Percent)
-10
-5
0
5
10
15
20
Total Consumption Gross Fixed CapitalFormation
Change in inventories Exports G & S Imports G & S GDP
Figure 2: Median Changes in Base Year Nominal GDP Levels: Production Approach (In Percent)
-15
-10
-5
0
5
10
15
20
25
30
Agriculture, hunting,forestry, & fishing
Mining & quarrying Manufacturing Electricity, gas &water supply
Construction Services GDP

20
Average increase in real
Old New T + 1 T + 2 T + 3 First 2 yrs. First 3 yrs.
Argentina 1986 1993 -2.2 1.2 0.75 -0.5 -0.1Brazil 1985 2000 0.0 0.8 0.6 0.4 0.5Chile 1986 1996 -0.8 -0.7 0.3 -0.8 -0.4Chile 1996 2003 -0.2 -0.6 … -0.4 -0.4Colombia 1975 1994 -0.6 … … -0.6 -0.6Colombia 1994 2000 0.7 … … 0.7 0.7Ecuador 1993 2000 -0.3 -0.6 … -0.5 -0.5Guatemala 1958 2001 1.7 0.4 0.5 1.1 0.9Honduras 1978 2000 0.1 0.9 1 0.5 0.7Mexico 1980 1993 0.8 … … 0.8 0.8Mexico 1993 2003 -0.2 0.4 0.0 0.1 0.1Nicaragua 1980 1994 1.6 1.5 -1.1 1.6 0.7Paraguay 1982 1994 0.7 -0.9 0.4 -0.1 0.1Uruguay 3/ 1983 1997 -0.04 … … 0.0 0.0Venezuela 1984 1997 0.4 … … 0.4 0.4
Memorandum items:Average all countries 2/ 0.1 0.2 0.3 0.2 0.2Median all countries 0.0 0.4 0.5 0.1 0.1Source: Country authorities' official websites.1/ For the period after the new benchmark year (e.g. ,T + 3 refers to 3 years after new base year). In general, countries produced national accounts with the old and new methodology for an overlapping period of three years.2/ Unweighted average.3/ Data refer to 1997.
Base Year GDP growth rates 2/
Table 3. Latin America: Difference in Real GDP Growth Rates under New and Old National Accounts Statistics 1/
Increase in real GDPgrowth rates during
The split between nominal and volume changes in GDP in the context of national accounts revisions hints at a number of pending challenges for compilers. As noted above, the sizeable changes in nominal GDP figures (in a range of -8.2 to 19.2 percent, excluding Nicaragua) mirror current-price data reclassifications along 1993 SNA and significant improvements in source information stemming from more regular data collection surveys of key sectors in the economy. Yet, the authors’ view is that much remains to be done in terms of the development of robust volume and price indices—especially for output produced for own final use (see Box 3 above), illegal and informal sector activities, and the growing telecom, financial, and other services sectors—that meet analytical/theoretical requirements and compensate for data limitations facing the national accounts compilers.13
13 See chapter 16 in the 1993 SNA manual for a discussion of index numbers theory in the context of national accounts compilation.

21
Figure 3: Average Real GDP Per-Capita Growth Rates Under Alternative NA Series (In percent)
-3.00
-2.00
-1.00
0.00
1.00
2.00
3.00
4.00
5.00
6.00
Arge
ntin
a (19
94-9
6)Ch
ile (1
997-
99)
Chile
(200
4-05
)Co
lombi
a (19
91-9
5)Co
lombi
a (20
00-0
1)Br
azil
(200
1-05
)Ec
uado
r (19
90-9
2)Ec
uado
r (19
98-2
002)
Guate
mala
(200
2-05
)Ho
ndur
as (2
001-
06)
Mex
ico (1
992-
94)
Mex
ico (2
004-
06)
Nica
ragu
a (19
86-9
9)Pa
ragu
ay (1
994-
2003
)Ur
ugua
y (19
96-9
7)Ve
nezu
ela (1
997)
Old NA stat. New NA stat.
To date, for example, the 1993 SNA recommendation to compile Supply and Use Tables at current and constant prices at the same time, and balanced simultaneously, is gradually being implemented among Latin American countries.14 Yet, as noted by Sake de Boer et. al (1999), while the simultaneous balancing at current and constant prices has many advantages, an important weakness is the possible neglect of the difference between deflated data (derived by compilers using current price information and available price indices) and actually measured (independently collected) volume data. Best practice is to validate the deflated data of the Supply and Use Table with independent quantity data. A main reason for checking the data of the supply and use table with independent quantity data is the quality of the price data used in the deflation process. Notably, most data that underlie the national accounts are in current prices. These data are transformed into volume information either (i) by extrapolating the data from the base year by volume indices, which is equivalent to applying fixed input-output ratios, or (ii) by deflating the value data with price indices. The first procedure implies the assumption that production technology and cost 14 Brazil, for example, has been a leader in the production of Supply and Use Tables at constant prices (i.e., at prices of the previous year) since the late 1990s. Brazil does not publish chained volume indices for GDP for non-consecutive years, although “chained volume indices” are published for the quarterly national accounts series. For consistency purposes, the chained volume indices per-quarter are benchmarked to the annual volume changes.

22
structures do not change in the short and medium terms, which do not usually hold nowadays with the rapid technological innovation and for countries with high inflation. As the base year becomes farther from the current period, it is increasingly unrepresentative of the current economic structure and relative prices of the economy. This could pose a risk for policymakers since the national accounts might not reflect the country’s reality, thus affecting their policy decisions, and hence the behavior of economic sectors and their economic transactions. The second procedure assumes that prices are representatively measured. A statistically correct sample of enterprises or persons should have been surveyed to obtain information on the prices of a set of goods or services that experience the same price changes as the product group(s) in the supply and use tables. In cases where the measurement of prices is inexact, these prices have a significant impact on the GDP volume estimates. Actual quantity information (even for not completely homogeneous products) can be a valuable check. Another main methodological weakness in assessing volume growth of GDP series is the lack of new source data in a times series format. Revisions of national accounts statistics, including changes in the base year, often use new source data that are only available for the base year; i.e., countries support revisions on one-off censuses and surveys, which are not followed up with continuous new statistics. Although such revisions may improve the estimates of the levels of GDP in current prices they are not likely to produce improved quarterly or annual volume growth estimates.
Changes in countries’ recorded economic structures Revisions to the national accounts have also led to changes in the statistics on the countries’ underlying economic structure (Table 4). On the one hand, in Central America, the share of agriculture and forestry, as well as that of services, declined while the share of civil construction, and manufacturing increased. The increase in the share of manufacturing reflects changes in the accounting of the activities of national and multinational companies operating in the Central American textile sector (maquila) in the context of free trade agreements with the US. The declining share of services reflects mainly the 1968 SNA (rather than 1993 SNA) treatment of FISIM in Honduras’ new national accounts (allocated to intermediate consumption of a notional industry) and a reassessment of value added for trade, transportation, and financial intermediation activities in Guatemala. On the other hand, for the rest of the Latin American countries, and in line with international trends, an increase in the share of services—particularly modern services such as information, communication, and informal services provided by unincorporated enterprises owned by households—has been accompanied by a simultaneous decline in the share of agriculture, hunting, forestry, and fishery in total value added. A singular decline in the share of manufacturing value added for these countries largely reflects the expanded coverage and the reclassification of oil-related activities into a separate petroleum sector (included as part of mining and quarrying in Table 4) for Venezuela. Excluding Ecuador, Mexico, and Venezuela the share of manufacturing in total GDP increases for the sample of countries.
23
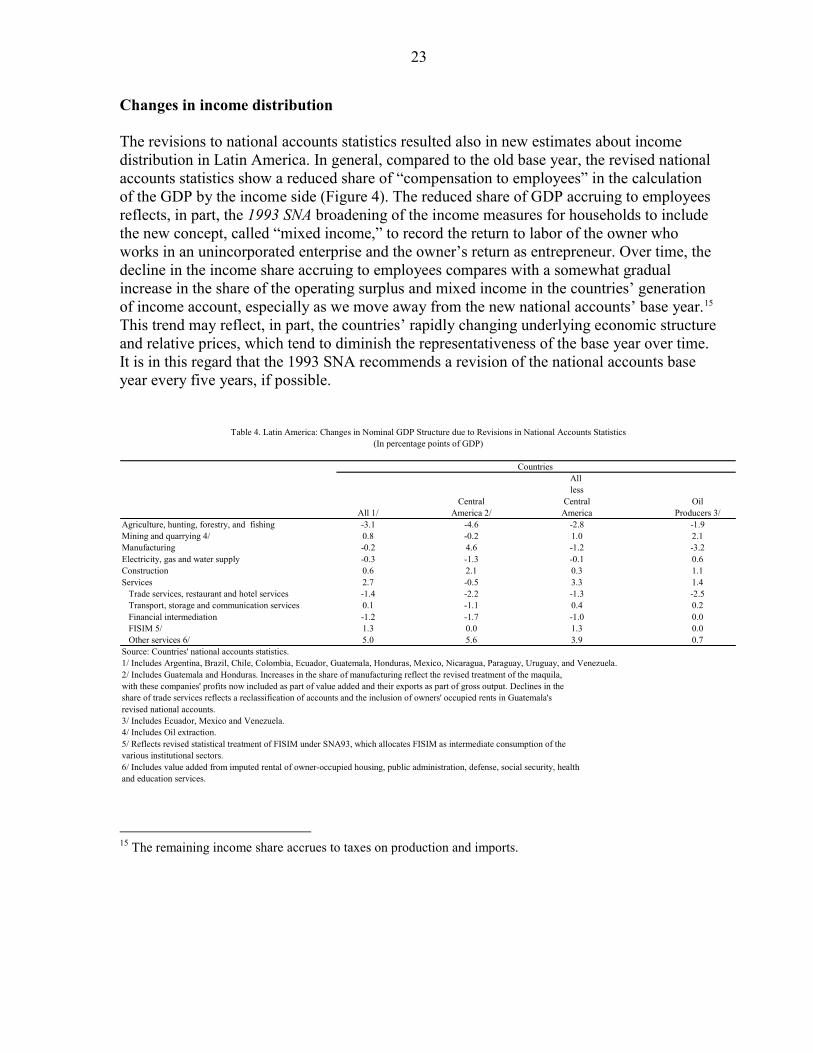
Changes in income distribution The revisions to national accounts statistics resulted also in new estimates about income distribution in Latin America. In general, compared to the old base year, the revised national accounts statistics show a reduced share of “compensation to employees” in the calculation of the GDP by the income side (Figure 4). The reduced share of GDP accruing to employees reflects, in part, the 1993 SNA broadening of the income measures for households to include the new concept, called “mixed income,” to record the return to labor of the owner who works in an unincorporated enterprise and the owner’s return as entrepreneur. Over time, the decline in the income share accruing to employees compares with a somewhat gradual increase in the share of the operating surplus and mixed income in the countries’ generation of income account, especially as we move away from the new national accounts’ base year.15 This trend may reflect, in part, the countries’ rapidly changing underlying economic structure and relative prices, which tend to diminish the representativeness of the base year over time. It is in this regard that the 1993 SNA recommends a revision of the national accounts base year every five years, if possible.
All less
Central Central OilAll 1/ America 2/ America Producers 3/
Agriculture, hunting, forestry, and fishing -3.1 -4.6 -2.8 -1.9Mining and quarrying 4/ 0.8 -0.2 1.0 2.1Manufacturing -0.2 4.6 -1.2 -3.2Electricity, gas and water supply -0.3 -1.3 -0.1 0.6Construction 0.6 2.1 0.3 1.1Services 2.7 -0.5 3.3 1.4 Trade services, restaurant and hotel services -1.4 -2.2 -1.3 -2.5 Transport, storage and communication services 0.1 -1.1 0.4 0.2 Financial intermediation -1.2 -1.7 -1.0 0.0 FISIM 5/ 1.3 0.0 1.3 0.0 Other services 6/ 5.0 5.6 3.9 0.7Source: Countries' national accounts statistics.1/ Includes Argentina, Brazil, Chile, Colombia, Ecuador, Guatemala, Honduras, Mexico, Nicaragua, Paraguay, Uruguay, and Venezuela. 2/ Includes Guatemala and Honduras. Increases in the share of manufacturing reflect the revised treatment of the maquila,with these companies' profits now included as part of value added and their exports as part of gross output. Declines in theshare of trade services reflects a reclassification of accounts and the inclusion of owners' occupied rents in Guatemala'srevised national accounts.3/ Includes Ecuador, Mexico and Venezuela.4/ Includes Oil extraction.5/ Reflects revised statistical treatment of FISIM under SNA93, which allocates FISIM as intermediate consumption of the various institutional sectors.6/ Includes value added from imputed rental of owner-occupied housing, public administration, defense, social security, health and education services.
Table 4. Latin America: Changes in Nominal GDP Structure due to Revisions in National Accounts Statistics(In percentage points of GDP)
Countries
15 The remaining income share accrues to taxes on production and imports.
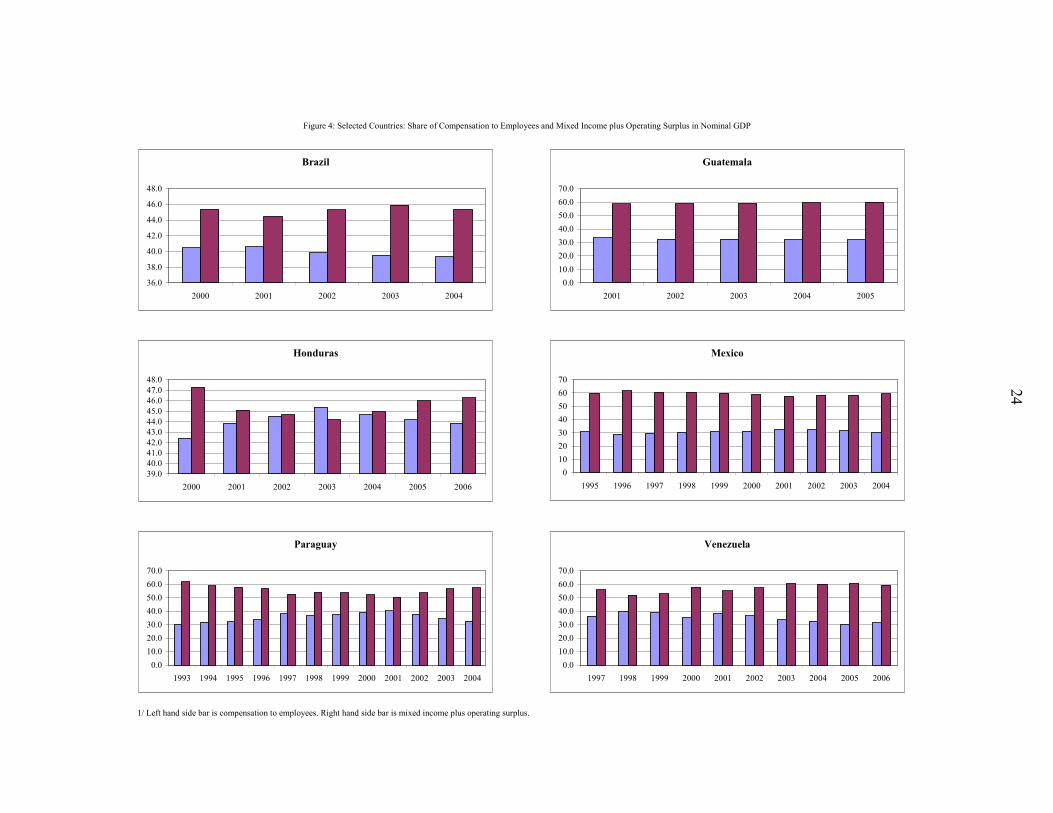
1/ Left hand side bar is compensation to employees. Right hand side bar is mixed income plus operating surplus.
Figure 4: Selected Countries: Share of Compensation to Employees and Mixed Income plus Operating Surplus in Nominal GDP
Brazil
36.0
38.0
40.0
42.0
44.0
46.0
48.0
2000 2001 2002 2003 2004
Guatemala
0.010.020.030.040.050.060.070.0
2001 2002 2003 2004 2005
Honduras
39.040.041.042.043.044.045.046.047.048.0
2000 2001 2002 2003 2004 2005 2006
Mexico
010203040506070
1995 1996 1997 1998 1999 2000 2001 2002 2003 2004
Paraguay
0.010.020.030.040.050.060.070.0
1993 1994 1995 1996 1997 1998 1999 2000 2001 2002 2003 2004
Venezuela
0.010.020.030.040.050.060.070.0
1997 1998 1999 2000 2001 2002 2003 2004 2005 2006
24

25
C. Remaining Data Puzzles
As noted above, an important analytical tool recommended by the 1993 SNA is the development of supply and use tables to secure the basic balance between supply and demand of production by checking the consistency of estimates and filling data gaps. At the same time, Latin American statistical agencies have been moving away from indirect estimates of key source national accounts data (that include mainly volume and price extrapolations from base years) to the use of direct sampling processes founded on regular household consumption surveys and surveys of main industries. Information from these surveys is usually scrutinized by applying supply and use tables at detailed product level for the various institutional sectors (households, businesses, and government) and using intermediate indicators and/or data validation routines such as, for example, standard ratios of household consumption spending by income thresholds, as well as information derived from income tax and other tax declarations by enterprises, when assessing overall production and uses (e.g.., consumption, gross fixed capital formation, net exports) levels and trends. Lower consumption/GDP ratios Despite the referred methodological advances, a notable feature contained in the national accounts data revisions is that the new GDP series, including their upward revisions in real GDP growth rates, has coincided with a decline in the unweighted average share of total consumption in nominal GDP (Table 5). Relatively large countries like Brazil (base year 2000), Mexico (base year 1993), and Colombia (base year 2000)—with rather good source data according to the assessments under the data ROSC—show a positive correlation between higher nominal GDP values, stronger economic growth, and a rising share of total consumption in GDP in the context of national accounts revisions.16 17 Brazil’s increase in the ratio of final consumption/GDP, in the context of the recent re-basing of its national accounts, confirmed earlier econometric analysis pointing at a possible underestimation of the growth rate of households’ real income, although the data revisions reflected data coverage issues (i.e., activities carried out by household unincorporated enterprises and self-employed workers) rather than problems with the measurement of inflation as it had been assumed by the econometricians.18 Brazil’s revisions in its
(continued…)
16 The economic debate on the measurement problems of output growth for high-tech goods and services, and their impact on measures of final demand, such as consumption, has been extensively discussed and studied for the case of the US economy; see for example, Fischer (1992) and Darby (1992 and 2001).
17 For Ecuador, the reported increase in the total consumption share in GDP may merit a further analysis, as the new base year for the national accounts (2000) coincided with the country’s official decision to adopt the US dollar as the country’s legal tender and a subsequent drastic disinflation process and change in relative prices. Also, according to the April 2002 Data ROSC for Ecuador (available in www.imf.org), the lack of source data series denominated in US dollars rested methodological soundness to the new national accounts statistics. These source data limitations (in US dollars) have been overcome in recent years.
18 See Carvalho Filho and Chamon (2006) who use household survey data for Brazil to estimate Engel curves capturing the statistical correlation between households’ real income and the share of food expenditure in the households’ consumption basket. The authors assume, a priori, that nominal income in Brazil’s national
26
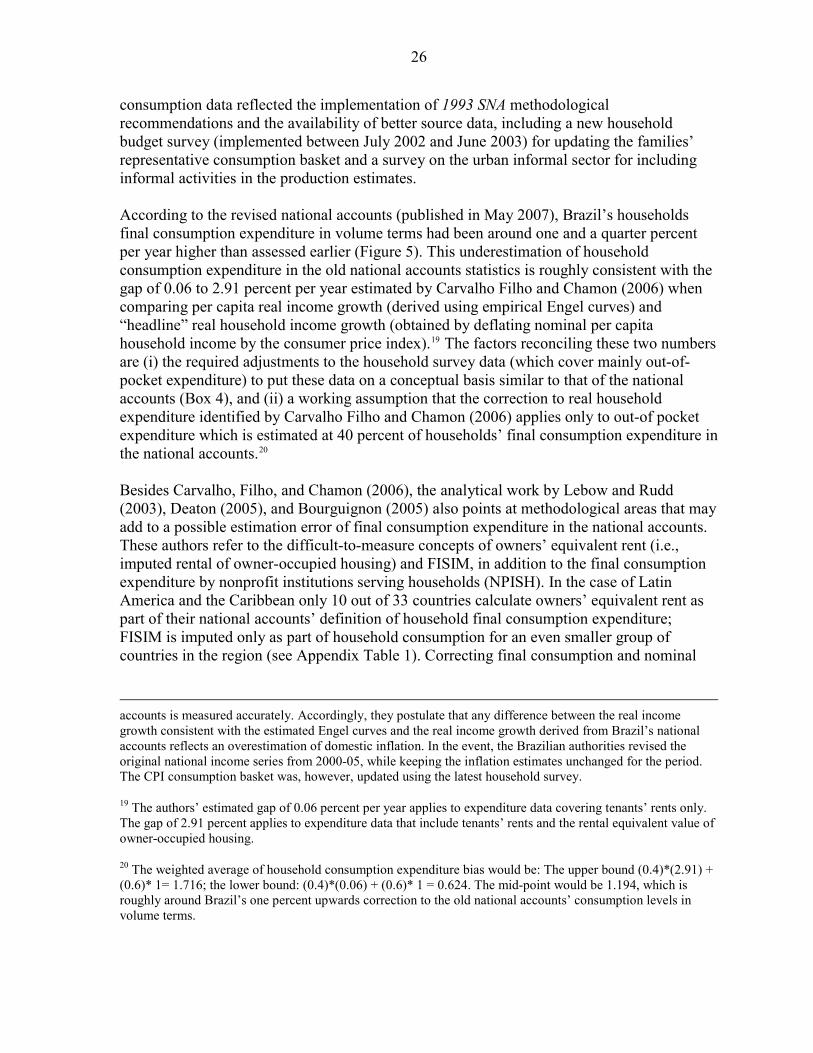
consumption data reflected the implementation of 1993 SNA methodological recommendations and the availability of better source data, including a new household budget survey (implemented between July 2002 and June 2003) for updating the families’ representative consumption basket and a survey on the urban informal sector for including informal activities in the production estimates. According to the revised national accounts (published in May 2007), Brazil’s households final consumption expenditure in volume terms had been around one and a quarter percent per year higher than assessed earlier (Figure 5). This underestimation of household consumption expenditure in the old national accounts statistics is roughly consistent with the gap of 0.06 to 2.91 percent per year estimated by Carvalho Filho and Chamon (2006) when comparing per capita real income growth (derived using empirical Engel curves) and “headline” real household income growth (obtained by deflating nominal per capita household income by the consumer price index).19 The factors reconciling these two numbers are (i) the required adjustments to the household survey data (which cover mainly out-of-pocket expenditure) to put these data on a conceptual basis similar to that of the national accounts (Box 4), and (ii) a working assumption that the correction to real household expenditure identified by Carvalho Filho and Chamon (2006) applies only to out-of pocket expenditure which is estimated at 40 percent of households’ final consumption expenditure in the national accounts.20 Besides Carvalho, Filho, and Chamon (2006), the analytical work by Lebow and Rudd (2003), Deaton (2005), and Bourguignon (2005) also points at methodological areas that may add to a possible estimation error of final consumption expenditure in the national accounts. These authors refer to the difficult-to-measure concepts of owners’ equivalent rent (i.e., imputed rental of owner-occupied housing) and FISIM, in addition to the final consumption expenditure by nonprofit institutions serving households (NPISH). In the case of Latin America and the Caribbean only 10 out of 33 countries calculate owners’ equivalent rent as part of their national accounts’ definition of household final consumption expenditure; FISIM is imputed only as part of household consumption for an even smaller group of countries in the region (see Appendix Table 1). Correcting final consumption and nominal
accounts is measured accurately. Accordingly, they postulate that any difference between the real income growth consistent with the estimated Engel curves and the real income growth derived from Brazil’s national accounts reflects an overestimation of domestic inflation. In the event, the Brazilian authorities revised the original national income series from 2000-05, while keeping the inflation estimates unchanged for the period. The CPI consumption basket was, however, updated using the latest household survey.
19 The authors’ estimated gap of 0.06 percent per year applies to expenditure data covering tenants’ rents only. The gap of 2.91 percent applies to expenditure data that include tenants’ rents and the rental equivalent value of owner-occupied housing.
20 The weighted average of household consumption expenditure bias would be: The upper bound (0.4)*(2.91) + (0.6)* 1= 1.716; the lower bound: (0.4)*(0.06) + (0.6)* 1 = 0.624. The mid-point would be 1.194, which is roughly around Brazil’s one percent upwards correction to the old national accounts’ consumption levels in volume terms.

27
GDP figures for these amounts should be an important step towards improving the calculation of the consumption level of households in line with 1993 SNA methodology. A further downward estimation bias in a number of countries in Latin America and the Caribbean arises from estimating household consumption as a residual using the commodity flow method. Starting from an estimate of domestic production for each commodity, net exports and government consumption are deducted, as are the amounts used in gross fixed capital formation and intermediate consumption, with the residual attributed to household (and NPISH) consumption when data for changes in inventories are available or estimates on changes in inventories are prepared, if not, private final consumption expenditures includes changes in inventories. Many of these calculations are done in physical volumes, so that estimation of household consumption in currency units requires the use of prices and/or price indices. As noted by Deaton (2005), there are many opportunities for errors along this chain of calculations, with the added complication of assessing intermediate consumption using technical coefficients from outdated Input-Output tables.
Change in Gross Capital Trade Old New Consumption GFKF inventories Formation 3/ balance Old data New data
(In percentage points of GDP)Brazil 1985 2000 4.3 -2.8 -1.0 -3.8 -0.6 9.6 6.1Chile 1986 1996 -0.7 1.2 -0.9 0.2 0.5 5.0 6.1Chile 1996 2003 0.8 -1.2 0.4 -0.9 0.1 4.3 3.4Colombia 1975 1994 -0.4 3.1 -0.1 2.9 -2.5 3.5 4.6Colombia 1994 2000 1.5 0.5 1.6 2.1 -3.7 4.6 5.5Ecuador 1993 2000 1.5 0.3 1.5 1.8 -3.2 6.5 6.7Guatemala 1958 2001 0.3 3.6 -2.3 1.3 -1.6 5.3 5.5Honduras 1978 2000 -4.9 0.0 2.4 2.4 2.4 7.0 4.7Mexico 1980 1993 1.6 -1.3 -0.6 -1.9 -0.2 7.3 6.9Mexico 1993 2003 -2.8 0.3 2.4 2.7 0.1 5.3 5.2Nicaragua 1980 1994 -15.1 -3.7 2.9 -0.8 17.6 6.0 6.7Paraguay 1982 1994 -5.3 -1.1 1.9 0.8 4.4 7.1 5.8Uruguay 1983 1997 -2.7 2.3 0.2 2.6 -0.1 2.3 2.7Venezuela 1984 1997 -8.0 8.1 0.0 8.1 -0.1 2.0 1.6
Memorandum items:Average all countries -2.1 0.7 0.6 1.3 0.9 5.4 5.1Median all countries -0.6 0.3 0.3 1.5 -0.1 5.3 5.5
Average all countries excluding Nicaragua -1.1 1.0 0.4 1.4 -0.3 5.4 5.0Median all countries excluding Nicaragua -0.4 0.3 0.2 1.8 -0.1 5.3 5.5Source: National authorities' official websites.1/ Data for Argentina are not presented in this table as changes in inventories are included in final consumption in the official argentine data.2/ Incremental Capital Output ratio (ICOR) is defined as the ratio of (GFKF/GDP) to the real GDP growth rate. Where GFKF is gross fixed capital formation and GDP is nominal GDP.3/ Defined to include GFKF plus change in inventories.
Table 5: Latin America: Changes in the Composition of Aggregate Demand under New National Accounts Statistics 1/
Base YearICOR 2/
Overtime Impact of Revision on GDP Shares
28
29
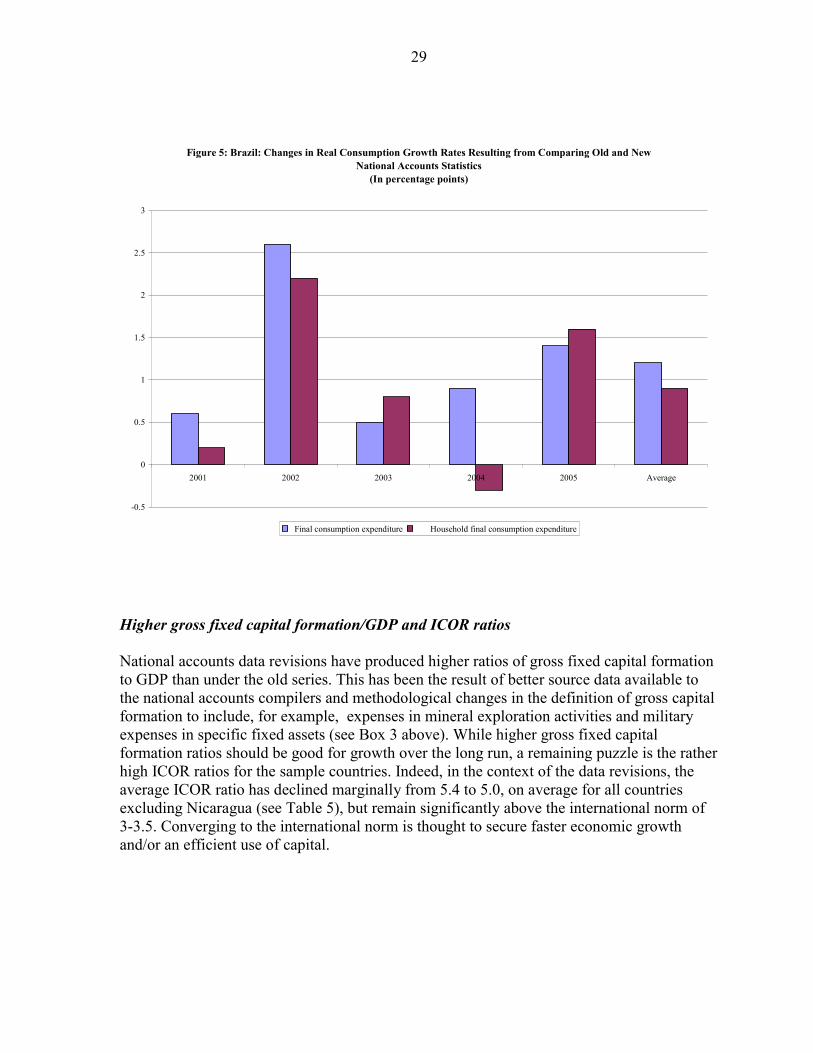
Figure 5: Brazil: Changes in Real Consumption Growth Rates Resulting from Comparing Old and New National Accounts Statistics
(In percentage points)
-0.5
0
0.5
1
1.5
2
2.5
3
2001 2002 2003 2004 2005 Average
Final consumption expenditure Household final consumption expenditure
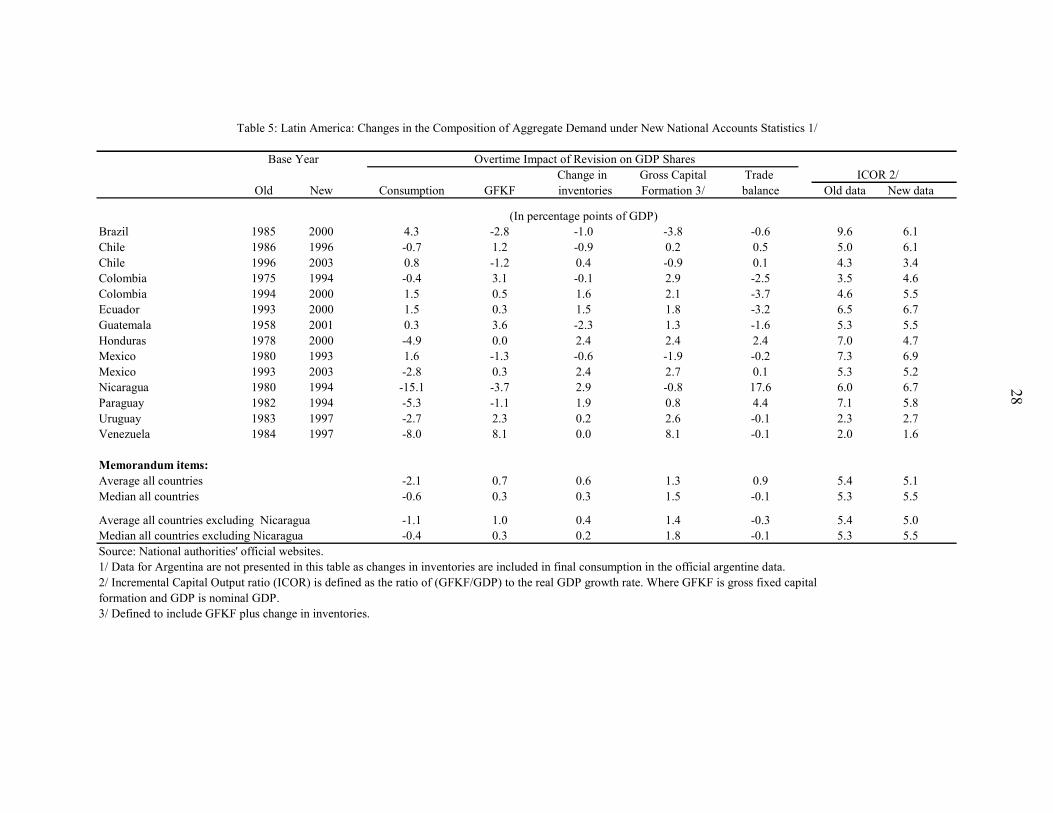
Higher gross fixed capital formation/GDP and ICOR ratios National accounts data revisions have produced higher ratios of gross fixed capital formation to GDP than under the old series. This has been the result of better source data available to the national accounts compilers and methodological changes in the definition of gross capital formation to include, for example, expenses in mineral exploration activities and military expenses in specific fixed assets (see Box 3 above). While higher gross fixed capital formation ratios should be good for growth over the long run, a remaining puzzle is the rather high ICOR ratios for the sample countries. Indeed, in the context of the data revisions, the average ICOR ratio has declined marginally from 5.4 to 5.0, on average for all countries excluding Nicaragua (see Table 5), but remain significantly above the international norm of 3-3.5. Converging to the international norm is thought to secure faster economic growth and/or an efficient use of capital.
30
Box 4. Reconciliation of Household Survey and National Accounts
Households Final Consumption Expenditure Data A number of adjustments are made to construct national accounts data on household final consumption that are consistent with data from household budget surveys. Most importantly, the survey data covers mainly out-of-pocket expenditure by households, whereas the national accounts data have considerably broader scope, representing all goods and services purchased by individuals and nonprofit institutions that serve them. For example, the national accounts data include all expenditures on medical care whether paid by households, employers or governments, whereas the survey data only cover the portion of expenditures paid by households out their own pockets. In the United States, roughly one quarter of the personal consumption expenditure bundle in the national accounts is outside the scope of the households’ budget survey data.21 The most common adjustments made to households survey data for national accounts compilation purposes are the following: Goods: Include food produced and consumed on farms and food furnished to employees (including military), fuel produced and consumed on farms, and apparel provided to military personnel. Exclude monetary and in-kind transfers among households (to avoid double counting within the household institutional sector). Exclude taxes on products. Medical Care: Add government transfers to persons for medical care, employer contributions for employees’ health insurance and workers’ compensation. Adjust medical care plans to include both: the plan’s premium paid by affiliates and the expenses incurred by the plans on the provision of medical care. Only the insurance service should be included in consumption expenditure; that is, premiums minus claims plus premium supplements. Education services: Include foundations and nonprofit research organizations. Other services: Include owners’ equivalent rent (i.e., imputed rental of owner-occupied housing), rental value of farm housing, domestic services provided to families, imputed financial service charges, expenses for handling life insurance. In cases like Brazil, for example, estimates of tenants’ rents are produced using information from regular surveys on income of dwellings (Pesquisa Nacional por Amostra de Domicilios (PNAD)) conducted every year in the month of September, rather from data collected by the less-frequent household budget surveys.22
21 See Lebow and Rudd (2003).
22 See website of Instituto Brasileiro de Geografia e Estatística (www.ibge.gov.br).

31
A review of the data ROSCs conducted for countries in the region, as well as of the data sources and analysis by ECLAC (2007) and by international experts (Easterly and Kraay (2000) and Winters and Martins (2004)), points at a number of factors that may help explain the recorded average levels of gross fixed capital formation (and ICOR) in the LAC region: • Source data on gross fixed capital formation in construction activities have
serious limitations. The review of the evidence indicates that gross fixed capital formation in construction (representing about 50-55 percent of gross capital formation across countries) is subject to statistical estimation errors that are more pronounced than for machinery and equipment. Statistical agencies tend to lack either direct sampling techniques for construction activities and/or access to tax records of the various institutional sectors (households and corporations) from which to derive robust estimates of these type of expenditures (Box 5). For example, data and methodological weaknesses stressed in the Data Module of the ROSC for Peru (dated October 2003), refer to limited source data on private sector construction activities and the lack of robust sample frameworks that could be used to assess the coverage of the sample and determine reliable grossing up factors for estimating aggregates for total activity. In Peru, construction is mainly estimated on the basis of cement production.
• By contrast, estimates of gross fixed capital formation in machinery and equipment have tended to be more robust, largely reflecting a very high correlation of these data with those of imports of capital goods used in the compilation of balance of payments statistics (Table 6). The consistency of the balance of payments statistics with the national accounts is a data quality dimension assessed in the Data Module of the ROSC (DQAF 4.2.3); the consistency between these two data frameworks has been confirmed by the data ROSC conducted in Latin America.

32
• Investment to GDP ratios are substantially higher in small countries (with populations of less than a million people like the Caribbean countries) than larger countries (Table 7); this is an international cross-country regularity that holds independently on whether or not the national accounts statistics are measured along the 1968 SNA or 1993 SNA methodological guidelines.23 The data for the LAC region confirm this regularity, with the larger countries in the region showing some convergence to international ICOR levels of 3-3.5.
1 Argentina 0.912 Barbados 0.783 Bolivia 0.584 Brazil 0.885 Chile 0.956 Colombia 1.007 Costa Rica 0.978 Ecuador 0.969 Guatemala 0.93
10 Mexico 0.9611 Nicaragua 0.7412 Panama 0.8513 Paraguay 0.6514 Peru 0.8815 Trinidad & Tobago 0.8316 Uruguay 0.9917 Venezuela 0.80
Average 0.86
Table 6. LAC Region: Simple Correlation Between Gross FixedCapital Formation in Machinery and Equipment and
Imports of Capital Goods, 1995-2005
Source: ECLAC database and authors' estimates.
23 See Easterly and Kraay (2000) for a comparison of macroeconomic data and performance in small states and larger ones around the world.
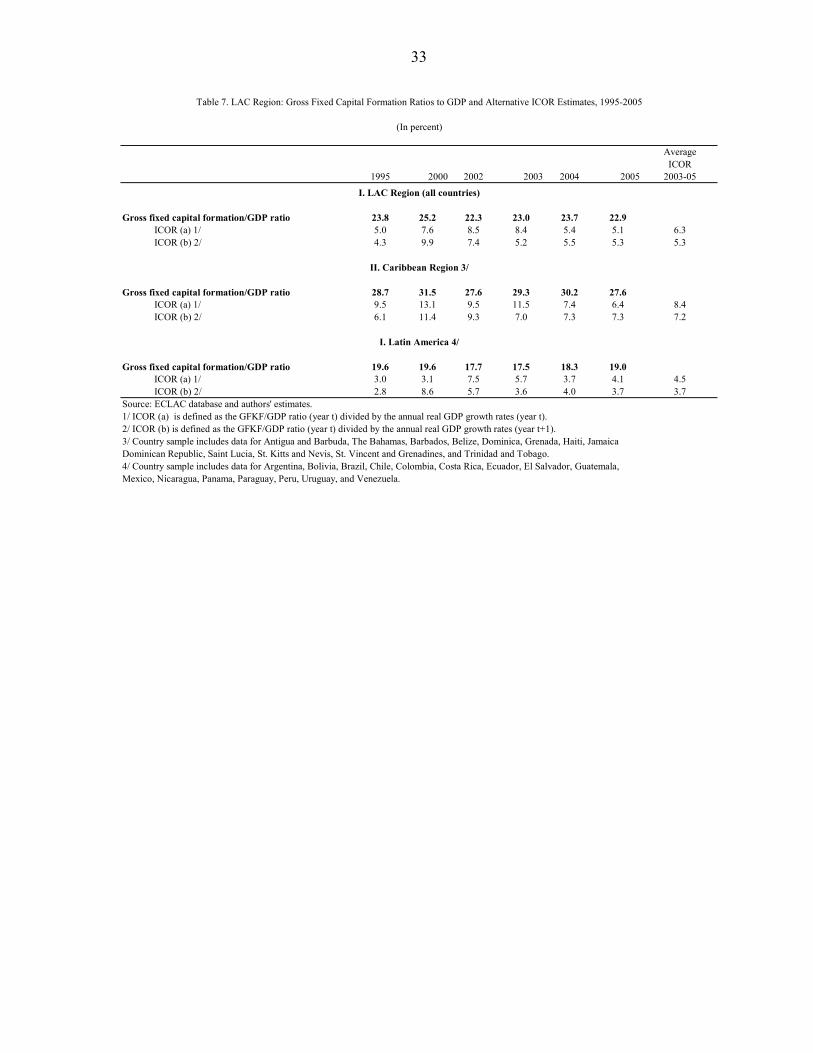
33
AverageICOR
1995 2000 2002 2003 2004 2005 2003-05
Gross fixed capital formation/GDP ratio 23.8 25.2 22.3 23.0 23.7 22.9ICOR (a) 1/ 5.0 7.6 8.5 8.4 5.4 5.1 6.3ICOR (b) 2/ 4.3 9.9 7.4 5.2 5.5 5.3 5.3
Gross fixed capital formation/GDP ratio 28.7 31.5 27.6 29.3 30.2 27.6ICOR (a) 1/ 9.5 13.1 9.5 11.5 7.4 6.4 8.4ICOR (b) 2/ 6.1 11.4 9.3 7.0 7.3 7.3 7.2
Gross fixed capital formation/GDP ratio 19.6 19.6 17.7 17.5 18.3 19.0ICOR (a) 1/ 3.0 3.1 7.5 5.7 3.7 4.1 4.5ICOR (b) 2/ 2.8 8.6 5.7 3.6 4.0 3.7 3.7
Source: ECLAC database and authors' estimates.1/ ICOR (a) is defined as the GFKF/GDP ratio (year t) divided by the annual real GDP growth rates (year t).2/ ICOR (b) is defined as the GFKF/GDP ratio (year t) divided by the annual real GDP growth rates (year t+1).3/ Country sample includes data for Antigua and Barbuda, The Bahamas, Barbados, Belize, Dominica, Grenada, Haiti, Jamaica Dominican Republic, Saint Lucia, St. Kitts and Nevis, St. Vincent and Grenadines, and Trinidad and Tobago.4/ Country sample includes data for Argentina, Bolivia, Brazil, Chile, Colombia, Costa Rica, Ecuador, El Salvador, Guatemala,Mexico, Nicaragua, Panama, Paraguay, Peru, Uruguay, and Venezuela.
I. Latin America 4/
Table 7. LAC Region: Gross Fixed Capital Formation Ratios to GDP and Alternative ICOR Estimates, 1995-2005
(In percent)
I. LAC Region (all countries)
II. Caribbean Region 3/

34
Box 5. Issues with the Calculation of Gross Fixed Capital Formation in Construction Activities
A main compilation challenge is the assessment of construction activities undertaken by households for purpose of their own gross fixed capital formation, and construction activities undertaken in the informal sector of the economy. Household construction activities for own final use The 1993 SNA recommends that goods or services produced for own final use be valued at the basic prices of similar products sold in the market or by their costs of production, if no suitable basic price is available. Yet, the implementation of such a recommendation is strained at times by the multiple qualities and their corresponding cost structures (and technology) of the dwellings produced by households for their own final use. As in the case of agricultural production, the issue of work in progress also applies to those dwellings and buildings whose completion periods are longer than one year. In the case of construction, indirect estimates of gross output and intermediate consumption tend to rely on partial or minimum information on the supply or sales of construction’s main inputs, and employment and average labor remuneration of households undertaking production activities for their own use. Also, compilers usually lack access to reliable timelines to monitor/time the start up and completion of construction projects. The 1993 SNA (paragraph 6.46), recognizes that a wide range of construction activities may be undertaken for the purpose of own gross fixed capital formation in rural areas in some countries, including communal construction activities undertaken by groups of households. Serious compilation efforts are warranted in these cases. Construction activities in the informal sector Over the years, national statistical institutes in Latin America have developed substantive surveys to quantify activities undertaken in the informal sector of the economy. Critical in those surveys is the quantification of the supply and demand of labor, with construction being a sheer employment activity. Traditional estimation methods In general countries lack direct estimates of prices and volumes of construction activities in the formal and informal sectors, as well as household construction activities for their own final use. There are three ways to approximate construction activities in current prices and volume terms: (i) by extrapolation of volume and price indices; (ii) through surveys gathering sectoral input data (e.g., number of construction licenses, supply and sales of cement, iron) at current prices and updating volume indices; and (iii) through surveys collecting data at current prices, progress of works in terms of square meters built, and data on prices.

35
Estimation issues with changes in inventories The value of changes in inventories, which is equivalent to a high of 3.5 to 7.0 percentage points of GDP in some countries in the LAC region—depending if we use an average or peak value of the series; see Figures 6 to 9—increased as a share of GDP in the context of the recent national accounts revisions. This regularity is at odds with the worldwide trend toward economizing on inventories in the context of real-time inventory management. In general, there seems to be an overestimation of this variable for some countries as the sum of total changes in inventories and total private final consumption expenditures (including final consumption expenditures of non-profit institutions serving households) is usually assessed as a residual between the GDP calculated by the production approach and the sum of the other components of domestic expenditure and the trade balance. Estimates on household final consumption expenditures and changes in inventories are often separated by using population and wages data and the CPI developments—a method that departs from best practices. Other factors affecting the calculation of changes in inventories include country-specific accounting (or lack of accounting) of work in progress—such as for example, growing crops, standing timber, stocks of fish, large construction projects—which should be recorded as inventories according to 1993 SNA. Furthermore, for some countries, the reported steady increase of changes in inventories for many consecutive years warrants some caution as it would seem unduly costly for enterprises to operate in such a manner.
Figure 6. Latin America: Average Changes in Inventories, 2000-2005 (In Percent of GDP)
Bolivia
Brazil
Chile
Colombia
Costa Rica
Ecuador
Guatemala
Honduras
Mexico
Nicaragua
Panama
Paraguay
Peru
Uruguay
Venezuela
0.0
0.5
1.0
1.5
2.0
2.5
3.0
3.5
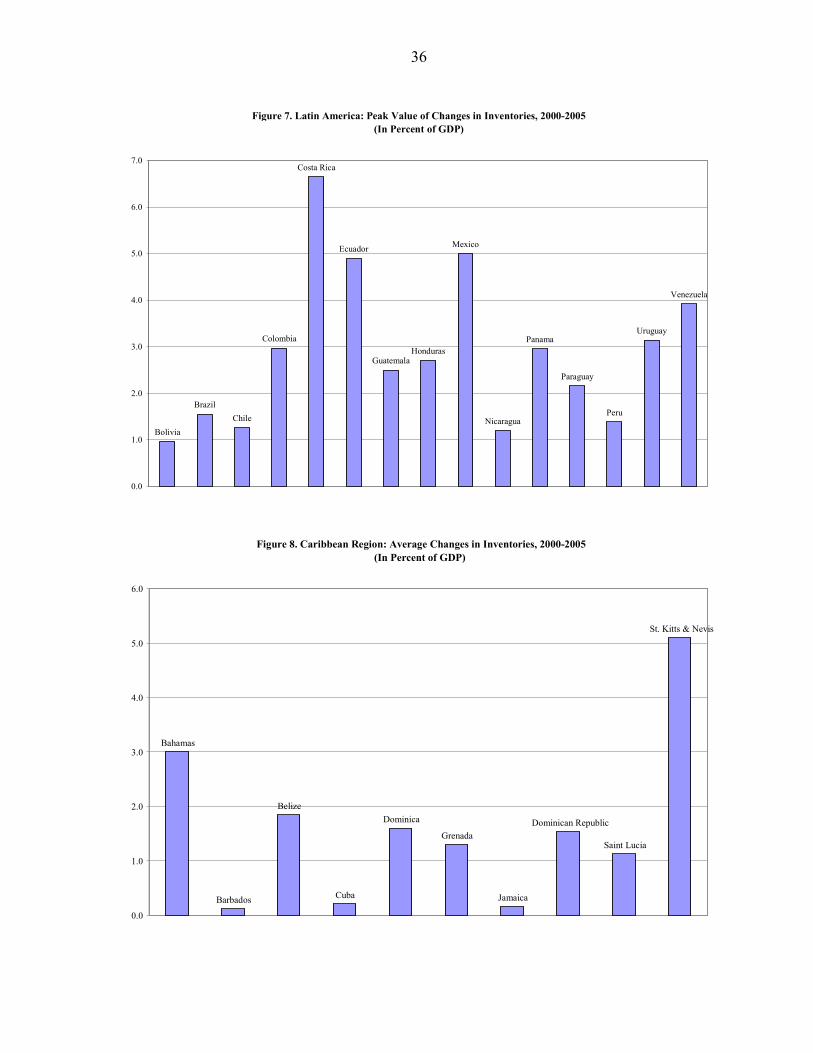
36
Figure 7. Latin America: Peak Value of Changes in Inventories, 2000-2005 (In Percent of GDP)
Bolivia
BrazilChile
Colombia
Costa Rica
Ecuador
GuatemalaHonduras
Mexico
Nicaragua
Panama
Paraguay
Peru
Uruguay
Venezuela
0.0
1.0
2.0
3.0
4.0
5.0
6.0
7.0
Figure 8. Caribbean Region: Average Changes in Inventories, 2000-2005 (In Percent of GDP)
6.0
5.0
4.0
3.0
2.0
1.0
0.0
St. Kitts & Nevis
Saint Lucia Dominican Republic
Jamaica
Grenada
Dominica
Cuba
Belize
Barbados
Bahamas
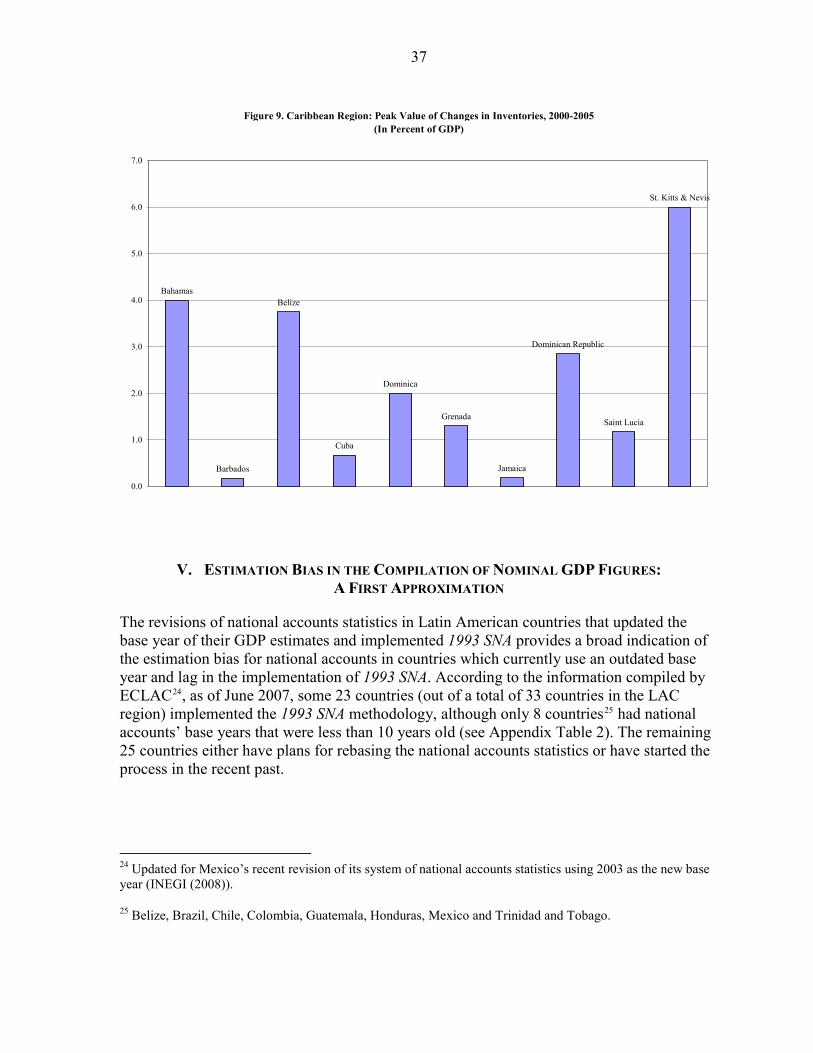
37
Figure 9. Caribbean Region: Peak Value of Changes in Inventories, 2000-2005 (In Percent of GDP)
Bahamas
Barbados
Belize
Cuba
Dominica
Grenada
Jamaica
Dominican Republic
Saint Lucia
St. Kitts & Nevis
0.0
1.0
2.0
3.0
4.0
5.0
6.0
7.0
V. ESTIMATION BIAS IN THE COMPILATION OF NOMINAL GDP FIGURES: A FIRST APPROXIMATION
The revisions of national accounts statistics in Latin American countries that updated the base year of their GDP estimates and implemented 1993 SNA provides a broad indication of the estimation bias for national accounts in countries which currently use an outdated base year and lag in the implementation of 1993 SNA. According to the information compiled by ECLAC24, as of June 2007, some 23 countries (out of a total of 33 countries in the LAC region) implemented the 1993 SNA methodology, although only 8 countries25 had national accounts’ base years that were less than 10 years old (see Appendix Table 2). The remaining 25 countries either have plans for rebasing the national accounts statistics or have started the process in the recent past.
24 Updated for Mexico’s recent revision of its system of national accounts statistics using 2003 as the new base year (INEGI (2008)).
25 Belize, Brazil, Chile, Colombia, Guatemala, Honduras, Mexico and Trinidad and Tobago.

38
Box 6. Latin America: Status of 1993 SNA Implementation—Replies to IBGE’s Questionnaires In late-2007, the Working Group on National Accounts (WGNA) of the UN Statistical Conference of the Americas prepared a report on the source data gaps affecting the implementation of 1993 SNA in Latin America.26 The report summarized replies by country representatives from 15 Latin American countries to an extensive questionnaire on source data needs that was developed at a national accounts statistics seminar organized by the IBGE and the IMF in Rio de Janeiro in early-June 2007. According to the WGNA’s report, priority areas for a successful implementation of 1993 SNA included the following:
(1) Preparation of country-specific special studies/surveys; (2) Preparation and/or updating of business directories; (3) Preparation of livestock census; (4) Development of administrative registries for small manufacturing enterprises; (5) Better estimates of gross fixed capital formation and depreciation using administrative
registries and/or enterprises’ balance sheet data; (6) Development of price indices for exports and imports; (7) Data improvements on cost-structures for input-output analysis; (8) Data improvements on profit margins and commercialization channels for input-output
analysis; and (9) Better information on non-profit institutions serving households.
Countries’ concerns about the preparation of special studies/surveys (point (1) above) were in three main business sectors: (i) agriculture, including fisheries and forestry; (ii) construction activities, including, notably, those undertaken in the informal sector; and (iii) services, including transportation, hotel businesses, and restaurants in the formal and informal sector. Special studies on personal services supplied to enterprises are also considered important for 1993 SNA implementation. Areas that were not considered priorities for effective implementation of the 1993 SNA—possibly due to already-existing compilation practices—included accounting frameworks and source data needs on: • Natural monopolies, including electricity, water, and telecommunications; • Oil and mining activities, and textile manufacturing (maquila); • Financial services (accounting frameworks and reporting); • Public administration data (consumption and infrastructure works); • Records for export and import values; • Consumer price index data; and • Employment matrices and sequence of accounts for the whole economy.27 26 See IBGE (2007a). The seminar hosted delegations from Argentina, Bolivia, Brazil, Chile, Colombia, Costa Rica, Cuba, Dominican Republic, El Salvador, Guatemala, Honduras, Mexico, Nicaragua, Panama, Paraguay, Peru, Uruguay, and Venezuela. The WGNA’s report did not include any replies from country delegations of the Dominican Republic, Guatemala, and Panama.
27 Although these two sets of statistics are compiled by very few countries, the issues on the compilation of the production and income accounts have currently priority over the development of these matrices and accounts.
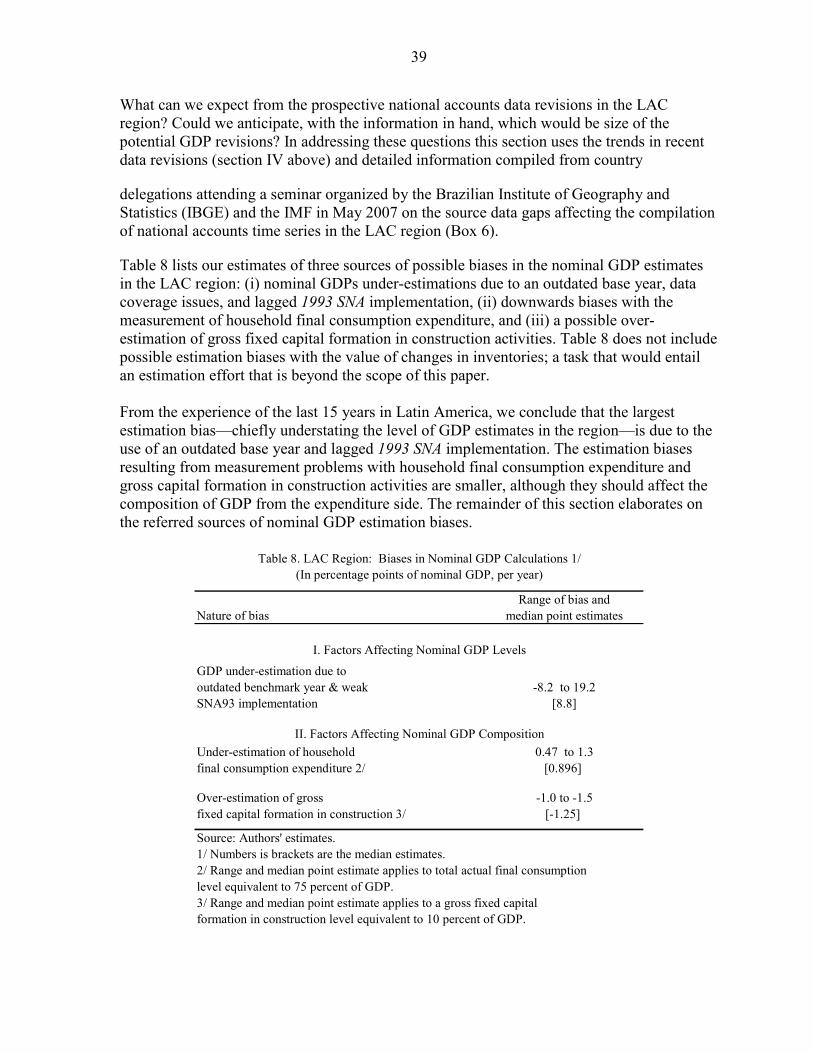
39
What can we expect from the prospective national accounts data revisions in the LAC region? Could we anticipate, with the information in hand, which would be size of the potential GDP revisions? In addressing these questions this section uses the trends in recent data revisions (section IV above) and detailed information compiled from country
delegations attending a seminar organized by the Brazilian Institute of Geography and Statistics (IBGE) and the IMF in May 2007 on the source data gaps affecting the compilation of national accounts time series in the LAC region (Box 6).
Table 8 lists our estimates of three sources of possible biases in the nominal GDP estimates in the LAC region: (i) nominal GDPs under-estimations due to an outdated base year, data coverage issues, and lagged 1993 SNA implementation, (ii) downwards biases with the measurement of household final consumption expenditure, and (iii) a possible over-estimation of gross fixed capital formation in construction activities. Table 8 does not include possible estimation biases with the value of changes in inventories; a task that would entail an estimation effort that is beyond the scope of this paper. From the experience of the last 15 years in Latin America, we conclude that the largest estimation bias—chiefly understating the level of GDP estimates in the region—is due to the use of an outdated base year and lagged 1993 SNA implementation. The estimation biases resulting from measurement problems with household final consumption expenditure and gross capital formation in construction activities are smaller, although they should affect the composition of GDP from the expenditure side. The remainder of this section elaborates on the referred sources of nominal GDP estimation biases.
Range of bias andNature of bias median point estimates
GDP under-estimation due tooutdated benchmark year & weak -8.2 to 19.2SNA93 implementation [8.8]
Under-estimation of household 0.47 to 1.3final consumption expenditure 2/ [0.896]
Over-estimation of gross -1.0 to -1.5fixed capital formation in construction 3/ [-1.25]
Source: Authors' estimates.1/ Numbers is brackets are the median estimates.2/ Range and median point estimate applies to total actual final consumption level equivalent to 75 percent of GDP.
Table 8. LAC Region: Biases in Nominal GDP Calculations 1/(In percentage points of nominal GDP, per year)
I. Factors Affecting Nominal GDP Levels
II. Factors Affecting Nominal GDP Composition
3/ Range and median point estimate applies to a gross fixed capitalformation in construction level equivalent to 10 percent of GDP.

40
A. Nominal GDP Under-estimation due to Outdated Base year and Lagging 1993 SNA Implementation
The experience in Latin America shows that, in general, a change in the national accounts’ base year along with the implementation of the 1993 System of National Accounts leads to increases in nominal GDP levels, although there have also been cases in which the revisions led to lower GDP figures (Box 2 above) owing to an obsolete previous base year and a generalized use of fixed technical ratios in extrapolations at an aggregate level. Specifically, the changes for nominal GDP levels have been within a range of -8.2 to 19.2 percent (excluding Nicaragua) with a median point estimate of +8.8 percent (i.e., a 6.5 percent increase on a GDP-weighted average basis), as most of the national accounts revisions led to increases in nominal GDP levels against earlier estimates. The experience to date is likely to replicate in the future as countries update their national accounts base years and implement the 1993 SNA methodology. Except for Chile and Mexico, whose national accounts base years date from 2003, base years in the other 31 countries in the LAC region are much older than the 5-year maximum lapse for updating recommended by the 1993 SNA (Appendix Table 2).28 Also, country delegations attending the Rio de Janeiro’s 1993 SNA seminar confirmed that main national accounts source data improvements should include updates of business directories/registers and agriculture and livestock censuses to improve coverage and statistical sampling techniques in the context of revising the national accounts’ base year. Information gaps in the services sector are likely to remain a challenge given the importance of small- and medium-size enterprises in this sector that are not usually captured in the economic surveys, as well as the relevance of informal service activities which are not investigated and recorded in official statistics. Further, there is a need to improve source data on hotel and restaurant businesses in the formal and informal sectors, as well as to perfect accounting of informal activities in the transportation and construction sectors. Better source data in these business areas should complement the countries’ reported adequate source data on strategic economic sectors (such as oil, minerals, textile industries, and financial intermediaries), government operations, and natural monopolies (i.e., water, electricity, communications). Subsequent discussions to the Rio de Janeiro’s 1993 SNA seminar have further defined ways to secure a timely implementation of 1993 SNA and revision of outdated national accounts’ base years across the LAC region. In this regard, an option under discussion in international forums29 has been to ascertain a time-bound action plan to implement common statistical norms along the 1993 SNA—addressing basic data definitions, classifications, coverage, and compilation and dissemination methodologies—with a view to harmonize the national 28 Main countries (in terms of relative GDP size) in the LAC region pending a rebasing of their national accounts and a thorough implementation of 1993 SNA include Argentina, Dominican Republic, Ecuador, Peru, Venezuela, which together represent some 25 percent of LAC’s nominal GDP. In all cases the current national accounts base year dates from the mid-1990 and it is unlikely to represent the countries’ current economic structure and relative price spectrum.
29 See for example, Frigolett, Hernán (2007) and Rivas (2007b).
41
accounts statistics and facilitate the intercountry comparability of macroeconomic indicators in the LAC region over the near- and medium-term. The experience by Eurostat with the harmonization of national accounts statistics within the European Union, as well as the development of regional national accounts statistics/indicators, is considered a useful reference in this regard.
B. Under-estimation of Household Final Consumption Expenditure
As noted above, when national accounts are rebased, the new data tend to show a lower share of final consumption in GDP. However, this is not always the case as large Latin American countries—particularly those with relatively robust source data such as Brazil, Chile, and Colombia, for example—have reported higher ratios of final consumption expenditure to GDP in the context of updating their national accounts and implementing the 1993 SNA. While only a detailed analysis could possibly identify the measurement of consumption bias in the GDP calculations, a number of factors warrant some reservations over the reported lower share of total consumption in GDP. These factors include: (i) downward biases from the pending inclusion of imputed rental of owner-occupied housing, FISIM, and consumption of NPISH in total final consumption expenditure figures, and (ii) inconsistencies with Engel curve econometric estimations confirming strong economic growth and changing households’ spending patterns (e.g., Carvalho Filho and Chamon (2006) estimates for Brazil, and Dávila and Levy (2003) and INEGI (2000) for a review of Mexican’s consumption patterns), as well as reduced poverty rates, low inflation, expanding credit and gradual trade liberalization reported in the LAC region.30 Estimation of national accounts consumption as a residual using the commodity flow methods adds yet another source of potential error in the computation of household final consumption expenditure. All in all, our assessment of the downward nominal consumption bias is within a range of 0.624 to 1.764 percent per year (see footnote 20 above for the detailed calculation). Assuming that consumption represents around 75 percent of GDP, the median point estimate would be about 0.896 percent per year.
C. Over-estimation of Gross Fixed Capital Formation in Construction
We approximate the estimation bias in the measurement of gross fixed capital formation in construction activities by inferring/deducting the level of this type of spending that would yield ICOR levels about the international norm of 3-3.5. Our sensitivity analysis indicates that a 10 to 15 percent reduction in fixed gross capital formation in construction per-year would significantly approximate average ICOR levels in Latin America to the international norm (see Table 9 below, center and bottom panels). With average ratios of gross fixed capital formation in construction activities to GDP equivalent to about 10 percent, a 10-15 percent reduction in these ratios would be equivalent to a 1-1.5 percentage points of GDP reduction.
30 As reported in Anoop Singh et. al. (2005), Dominique Desruelle and Alfred Schipke (2007), and Keith Dannemiller (2007), for example.

42
Our assessment is that, except for a few leading Latin American countries in terms of 1993 SNA implementation, a 10 to 15 percent potential overstatement in gross fixed capital formation in construction is a realistic assessment under the current source data shortages facing many national statistical institutes in the LAC region. Leading countries like, Colombia, for example, have invested significant human and financial resources to address these statistical challenges, especially when measuring construction activities undertaken by households for purpose of their own gross capital formation and/or in the informal sector of the economy.31 A main effort by the Colombian authorities has been to assess new production, stalled production, production in course, quality of the dwellings, amount of type of manpower used in construction activities, and the market value per square meter of those dwellings that sold in the market. These efforts have complemented the more traditional censuses of finalized dwellings offered to the market, i.e., construction activities that are usually undertaken by corporations rather than households for their own final use. Brazil and Venezuela are yet other examples of significant statistical efforts to produce robust estimates of gross capital formation in construction.32 The experience of Brazil, Colombia, and Venezuela, however, are considered notable exceptions to the more general statistical weakness facing national accounts compilers when assessing construction activities in the formal and informal sectors of the economy, as well as household construction activities for own final use.33
31 See, Colombia, Departamento Administrativo Nacional de Estadística (2007).
32 See, IBGE (2007b) and Central Bank of Venezuela (2003).
33 Frigolett, Hernán (2007), Annex 3.5, for example, discusses the variability of the ratio of housing services to GDP in a selected group of Latin American countries, noting that this variance reflects measurement problems with the flow of services (i.e., including or excluding owners’ occupied rents, for example) and the size and quality of the dwelling itself, especially whenever household construction activities for own final use are significant.
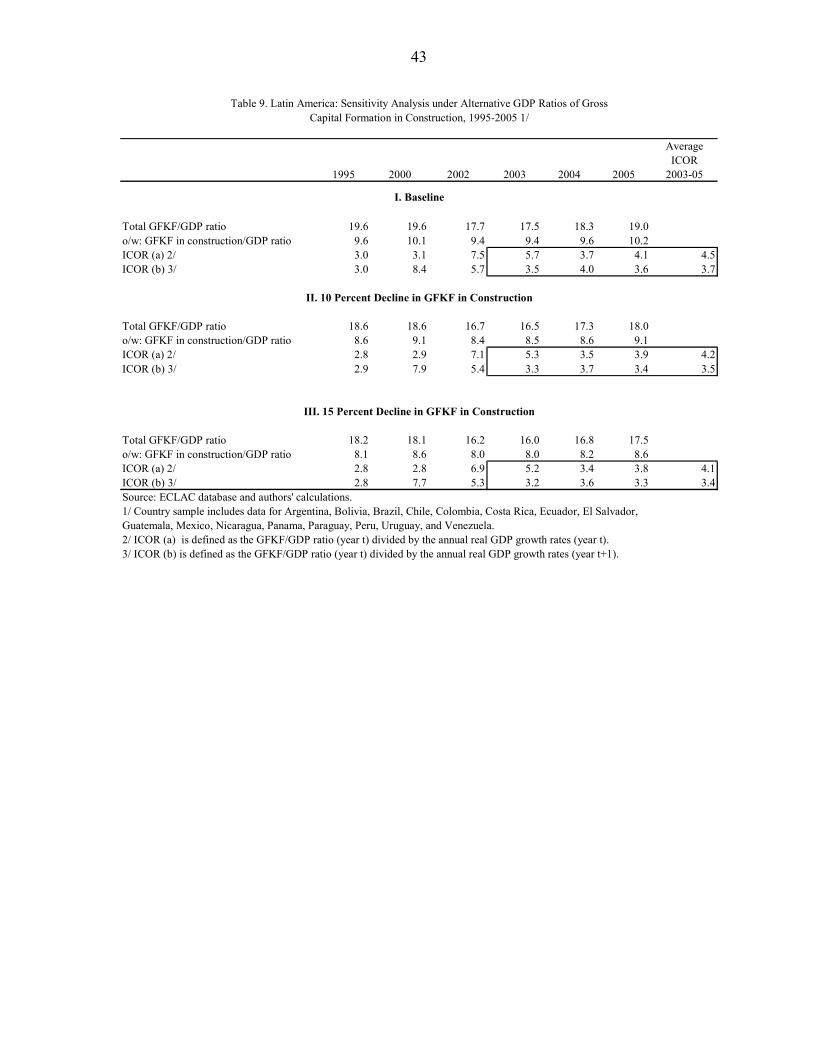
43
AverageICOR
1995 2000 2002 2003 2004 2005 2003-05
Total GFKF/GDP ratio 19.6 19.6 17.7 17.5 18.3 19.0o/w: GFKF in construction/GDP ratio 9.6 10.1 9.4 9.4 9.6 10.2ICOR (a) 2/ 3.0 3.1 7.5 5.7 3.7 4.1 4.5ICOR (b) 3/ 3.0 8.4 5.7 3.5 4.0 3.6 3.7
Total GFKF/GDP ratio 18.6 18.6 16.7 16.5 17.3 18.0o/w: GFKF in construction/GDP ratio 8.6 9.1 8.4 8.5 8.6 9.1ICOR (a) 2/ 2.8 2.9 7.1 5.3 3.5 3.9 4.2ICOR (b) 3/ 2.9 7.9 5.4 3.3 3.7 3.4 3.5
Total GFKF/GDP ratio 18.2 18.1 16.2 16.0 16.8 17.5o/w: GFKF in construction/GDP ratio 8.1 8.6 8.0 8.0 8.2 8.6ICOR (a) 2/ 2.8 2.8 6.9 5.2 3.4 3.8 4.1ICOR (b) 3/ 2.8 7.7 5.3 3.2 3.6 3.3 3.4Source: ECLAC database and authors' calculations.1/ Country sample includes data for Argentina, Bolivia, Brazil, Chile, Colombia, Costa Rica, Ecuador, El Salvador,Guatemala, Mexico, Nicaragua, Panama, Paraguay, Peru, Uruguay, and Venezuela.2/ ICOR (a) is defined as the GFKF/GDP ratio (year t) divided by the annual real GDP growth rates (year t).3/ ICOR (b) is defined as the GFKF/GDP ratio (year t) divided by the annual real GDP growth rates (year t+1).
I. Baseline
II. 10 Percent Decline in GFKF in Construction
III. 15 Percent Decline in GFKF in Construction
Table 9. Latin America: Sensitivity Analysis under Alternative GDP Ratios of GrossCapital Formation in Construction, 1995-2005 1/
44
VI. CONCLUDING REMARKS
This paper has reviewed the Latin American experience with the implementation of 1993 SNA and the update of the national accounts’ base year. It also made a preliminary assessment of the possible bias in nominal GDP estimates for the Latin American and the Caribbean region. Our analysis points at a number of preliminary conclusions: • Data revisions stemming from 1993 SNA implementation and the update of the
national accounts base year have been multi-institutional projects implemented over a span of about 5-6 years. The IMF contribution toward this endeavor has been the fielding of technical assistance and multisector missions, as well as data ROSCs that have supported local efforts for improved collection of basic data and the implementation of best international practices for the compilation of national accounts, in particular production and income accounts. Policymakers have generally agreed that the implementation of national development strategies requires basic knowledge about the size and structure of the underlying economy. This is also consistent with evidence-based policymaking, which has been a key topic of discussion in international forums in recent years.
• Data ROSCs in Latin America have pointed at a number of data quality issues. Common weaknesses/challenges across countries include the need to allocate commensurate human and financial resources to run statistical programs, improve the collection of basic source data for national accounts compilation (especially better data collection routines for the service sectors, output produced for own final use, and informal sector activities), and foster stronger inter-institutional coordination among data producers and compilers in countries all across the region.
• Revisions to national accounts data in the context of implementing the 1993 SNA and rebasing the accounts have led to changes for nominal GDP levels within a range of -8.2 to 19.2 percent (excluding Nicaragua) with a median point estimate of 8.8 percent, as most of the national accounts revisions led to higher nominal GDP levels against earlier estimates.
• Revisions to national accounts statistics have led to reassessments of countries’ per-capita incomes, leading sectors in the local economy, and the underlying primary distribution of income. On the latter, Latin American countries have shown higher income shares accruing to corporations and unincorporated enterprises owned by households (mixed income in the 1993 SNA taxonomy) at the expense of the income share accruing to employees.
• Revisions have also yielded estimates of real GDP growth rates that are somewhat higher for a number of consecutive years than those assessed under the old national accounts series. While the jury is still out assessing the underlying split between increases in price and volume indices, the experts’ wisdom is that the price-quantity
45
split warrants some caution as, in the absence of robust source data, compilers may tend to exaggerate the stability of volume trends at the expense of added variability to price indices. Also, a number of Latin American statistical agencies are lagging behind in the compilation of producer price indices and the simultaneous construction of Supply and Use Tables at current and constant prices which are very useful to fill data gaps, assess the consistency of (value, volume, and price) estimates, and meet a number of analytical requirements for price and volume index numbers recommended by the 1993 SNA.
• Policymakers and the public in general have welcomed revisions to national accounts statistics initiatives, although a number of data puzzles remain. In particular, higher economic growth estimates have coincided with lower total consumption as a share of GDP in the majority of the countries that revised their national accounts statistics. Also, gross fixed capital formation to GDP ratios and their implied incremental capital output ratios (ICORs) have remained high by international standards. Our analysis suggests that the referred data puzzles reflect a likely under-estimation of household final consumption and over-estimation of gross fixed capital formation in construction activities, especially in countries with significantly outdated national accounts base years and/or limited funding of statistical offices to address the measurement problem with construction activities for own final use and those in the informal sector. Estimation issues with the value of changes in inventories were also considered a remaining challenge for statistical agencies in the region.
• All in all, a tentative conclusion from the paper is that nominal GDP figures for the LAC region may be under-estimated typically by about 8.8 percent due to pending updates in the national accounts’ base year, including improvements in the coverage of services and informal activities, and efforts to fully implement the 1993 SNA methodology. To date, there are only two countries in the whole LAC region whose national accounts base years are within the 1993 SNA recommended 5-year lapse for updating, while important source data shortfalls in the compilation of national accounts statistics remain in place. The total estimation biases stemming from measurement problems with household final consumption and gross fixed capital formation in construction activities are smaller than those resulting from pending updates in base years, although they should affect the composition of GDP from the expenditure side.
• In terms of specific actions to address the referred estimation biases, an option would be to ascertain a time-bound action plan for countries to implement common statistical norms—covering basic data definitions, classifications, source data coverage, and compilation and dissemination methodologies—with a view to harmonize the national accounts of Latin American countries. The experience by Eurostat with the harmonization of national accounts statistics within the European Union may be a useful reference in this regard.

46
VII. SELECTED BIBLIOGRAPHY
Blinder Alan S. and Alan B. Krueger (2004), “What Does the Public Know about Economic Policy, and How Does it Know It?” NBER Working Paper No. 10787, September.
Boer, Sake de, Wim van Nunspeet, and Taeke Takema (1999), “Supply and Use Tables in
Current and Constant prices for the Netherlands: an Experience of Fifteen Years,” Statistics Netherlands, Division Presentation and Integration Sector National Accounts, NA-092, Voorburg/Heerlen, 41 pages.
Bourguignon, François (2005), “Comment on Measuring Poverty in a Growing World (or
Measuring Growth in a Poor World) by Angus Deaton,” The Review of Economics and Statistics, vol. LXXXVII, pp. 20-22, February.
Carvalho Filho, Irineu de and Marcos Chamon (2006), “The Myth of Post-Reform Income
Stagnation in Brazil,” IMF Working Paper, WP/06/275, December. Colombia, Departamento Administrativo Nacional de Estadística (2007a), “Censo de
Edificaciones,” DANE, Premio Regional a la Innovación Estadística, Dirección de Metodología y Producción Estadística – DIMPE, December, 14 pages, mimeo.
Colombia, Departamento Administrativo Nacional de Estadística (2007b), Boletin de Prensa,
Bogota, D.C., 29 de diciembre de 2006—Oficina de Prensa DANE, 24 pp., in www.dane.gov.co.
Commission of the European Communities (1993), System of National Accounts 1993,
Prepared under the auspices of the Inter-Secretariat Working Group on National Accounts, Commission of the European Communities—Eurostat, International Monetary Fund, Organization of Economic Co-operation and Development, United Nations and the World Bank, Brussels/Luxembourg, New York, Paris, Washington D.C., xix + 718 pp.
Dannemiller, Keith (2007), “Latin America’s Middle Class: Adiós to Poverty, Hola to
Consumption,” The Economist print edition, August 16, available in the internet. Darby, Michael R. (1992), “Causes of Declining Growth,” in Policies for Long-Run Growth,
A Symposium sponsored by the Federal Reserve Bank of Kansas City, August 27-29, 1992, available in the internet.
Darby, Michael R. (2001), “The U.S. Productivity Slowdown: A Case of Statistical Myopia,”
American Economic Review, pp. 301-322. Dávila, Enrique and Santiago Levy (2003), “Taxing for Equity: A Proposal to reform
Mexico’s Value-Added Tax,” in José Antonio González et. al. (2003), pp. 327-356.

47
Deaton, Angus (2005), “Measuring Poverty in a Growing World (or Measuring Growth in a Poor World),” The Review of Economics and Statistics, vol. LXXXVII, pp.1-19, February.
Desruelle, Dominique and Alfred Schipke, editors, (2007), Economic Growth and Integration
in Central America, Occasional Paper 257, International Monetary Fund, Washington DC, 2007, viii + 104 pp.
Easterly, William and Aart Kraay (2000), “Small States, Small Problems? Income, Growth,
and Volatility in Small States,” World Development, Vol. 28, No. 11, pp.2013-2027. Economic Commission for Latin America and the Caribbean, ECLAC, (2007), “Economic
Survey of Latin America and the Caribbean 2005-2006”, Statistical Appendix. Fischer, Stanley (1992), “Overview: The Conventional Wisdom and the New Growth
Theory,” in Policies for Long-Run Growth, A Symposium sponsored by the Federal Reserve Bank of Kansas City, August 27-29, 1992, available in the internet.
Frigolett, Hernán (2007), “Presentación de una Agenda Temática para Avanzar en el Proceso
de Armonización de las Cuentas Nacionales en América Latina”, power point presentation at the LatinAmerican Seminar on National Accounts, ECLAC, Santiago, Chile, 24-26 of October.
González, José Antonio, Vittorio Corbo, Anne O. Krueger and Aaron Tornell, editors,
(2003), Latin America Macroeconomic Reform: The Second Stage, University of Chicago Press, xii + 443 pp.
Harrison, Anne (1990), “Major Changes Proposed for the Next SNA: An Overview,” Review
of Income and Wealth, Series 36, No.4, December, pp. 335-352. IBGE (2007a), “Estagio de Desenvolvimento das Contas Nacionais na América Latina:
Analise das Respostas aos Questionários,” Coordenação de Contas Nacionais, Rio de Janeiro, Julho de 2007, versão preliminar-para avaliação.
IBGE (2007b), “Atividade Construção Civil,” Nota Metodológica no 15, Diretoria de
Pesquisas- DPE, Coordenação de Contas Nacionais – CONAC, Sistema de Contas Nacionais – Brasil, Referencia 2000, available via internet at http://www.ibge.gov.br/home/estatistica/economia/contasnacionais/referencia2000/2005/default_SCN.shtm.
INEGI (2000), Encuesta Nacional de Ingresos y Gastos de los Hogares de 1998, Mexico. INEGI (2008), “Actualización del Sistema de Cuentas Nacionales de México 2003,” Instituto
Nacional de Estadística, Geografía e Informática, Mexico, April, 38 pp.

48
Lebow David E. and Jeremy B. Rudd (2003), “Measurement Error in the Consumer Price Index: Where do We Stand?, Journal of Economic Literature, vol. XLI, March, pp. 159-201.
Rivas, Lisbeth (2007a), “Informe de la Observancia de Códigos y Normas (IOCN) Módulo
de Datos: Resultados en América Latina,” Seminario sobre el Estado de Desarrollo de las Cuentas Nacionales en América Latina, IBGE, power point presentation, 5 y 6 de Junio.
Rivas, Lisbeth (2007b), “El Estado de las Cuentas Nacionales y de las Fuentes Estadísticas
para Elaborarlas en los Países de América Latina,” Seminario Latinoamericano de Cuentas Nacionales, Comisión Económica para América Latina y el Caribe, Fondo Monetario Internacional, power point presentation, 24 al 26 de Octubre.
Singh, Anoop, Agnès Belaisch, Charles Collyns, Paula De Masi, Reva Krieger, Guy
Meredith, and Robert Rennhack (2005), Stabilization and Reform in Latin America: A Macroeconomic Perspective on the Experience Since the Early 1990s, Occasional paper 238, International Monetary Fund, Washington DC., xx + 116 pp.
Venezuela, Central Bank (2003), “Sistema de Cuentas Nacionales de Venezuela: Año Base
1997,” Programa de Actualización de las Estimaciones Macroeconómicas (PRACEM), available in the central bank website, vii + 146 pp.
Winters L. Alan and Pedro M.G. Martins (2004), Beautiful but Costly: Business Costs in
Small Remote Economies, Economic Paper 67, Commonwealth Secretariat, x + 184 pp.
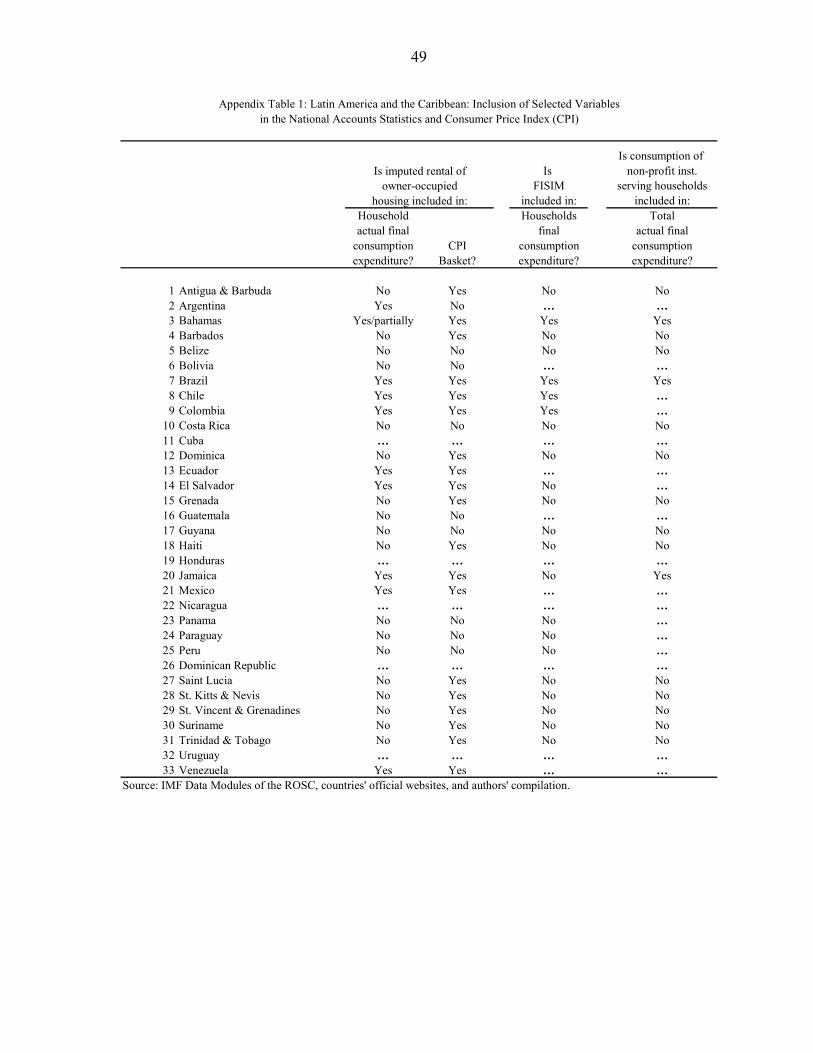
49
Is consumption of Is non-profit inst.
FISIM serving householdsincluded in: included in:
Household Households Totalactual final final actual final
consumption CPI consumption consumptionexpenditure? Basket? expenditure? expenditure?
1 Antigua & Barbuda No Yes No No2 Argentina Yes No … …3 Bahamas Yes/partially Yes Yes Yes4 Barbados No Yes No No5 Belize No No No No6 Bolivia No No … …7 Brazil Yes Yes Yes Yes8 Chile Yes Yes Yes …9 Colombia Yes Yes Yes …
10 Costa Rica No No No No11 Cuba … … … …12 Dominica No Yes No No13 Ecuador Yes Yes … …14 El Salvador Yes Yes No …15 Grenada No Yes No No16 Guatemala No No … …17 Guyana No No No No18 Haiti No Yes No No19 Honduras … … … …20 Jamaica Yes Yes No Yes21 Mexico Yes Yes … …22 Nicaragua … … … …23 Panama No No No …24 Paraguay No No No …25 Peru No No No …26 Dominican Republic … … … …27 Saint Lucia No Yes No No28 St. Kitts & Nevis No Yes No No29 St. Vincent & Grenadines No Yes No No30 Suriname No Yes No No31 Trinidad & Tobago No Yes No No32 Uruguay … … … …33 Venezuela Yes Yes … …
Source: IMF Data Modules of the ROSC, countries' official websites, and authors' compilation.
Is imputed rental ofowner-occupied
housing included in:
Appendix Table 1: Latin America and the Caribbean: Inclusion of Selected Variablesin the National Accounts Statistics and Consumer Price Index (CPI)

50
IsSNA93 in Baseplace? 1/ 15 years old 2/ 10 years old 2/ 5 years old 2/ Year
1 Antigua & Barbuda 0 0 0 0 19902 Argentina 1 1 0 0 19933 Bahamas 1 0 0 0 19914 Barbados 0 0 0 0 19745 Belize 1 0 1 0 20006 Bolivia 0 0 0 0 19907 Brazil 1 1 1 0 20008 Chile 1 1 1 1 20039 Colombia 1 1 1 0 2000
10 Costa Rica 1 0 0 0 199111 Cuba 1 0 0 0 199712 Dominica 1 0 0 0 199013 Ecuador 1 1 0 0 199314 El Salvador 0 0 0 0 199015 Grenada 0 0 0 0 199016 Guatemala 1 1 1 0 200117 Guyana 0 0 0 0 198818 Haiti 0 0 0 0 1986/8719 Honduras 1 1 1 0 200020 Jamaica 0 0 0 0 199621 Mexico 1 1 1 1 200322 Nicaragua 1 1 0 0 199423 Panama 1 0 0 0 199624 Paraguay 1 1 0 0 199425 Peru 1 0 0 0 199426 Dominican Republic 1 0 0 0 199127 Saint Lucia 0 0 0 0 199028 St. Kitts & Nevis 1 0 0 0 199029 St. Vincent & Grenadines 0 0 0 0 199030 Suriname 1 0 0 0 199031 Trinidad & Tobago 1 0 1 0 200032 Uruguay 1 1 0 0 199733 Venezuela 1 1 0 0 1997
Total 23 12 8 2Source: ECLAC , International Financial Statistics (IFS), and national authorities' official websites.1/ scorecard: 0 = if SNA93 is not in place; 1 = if SNA93 is in place.2/ Yes = 1; No = 0.
is less than
Appendix Table 2: Latin America and the Caribbean--SNA93 Implementation Status andNational Accounts Statistics Vintage Base Year
National accounts' benchmark year
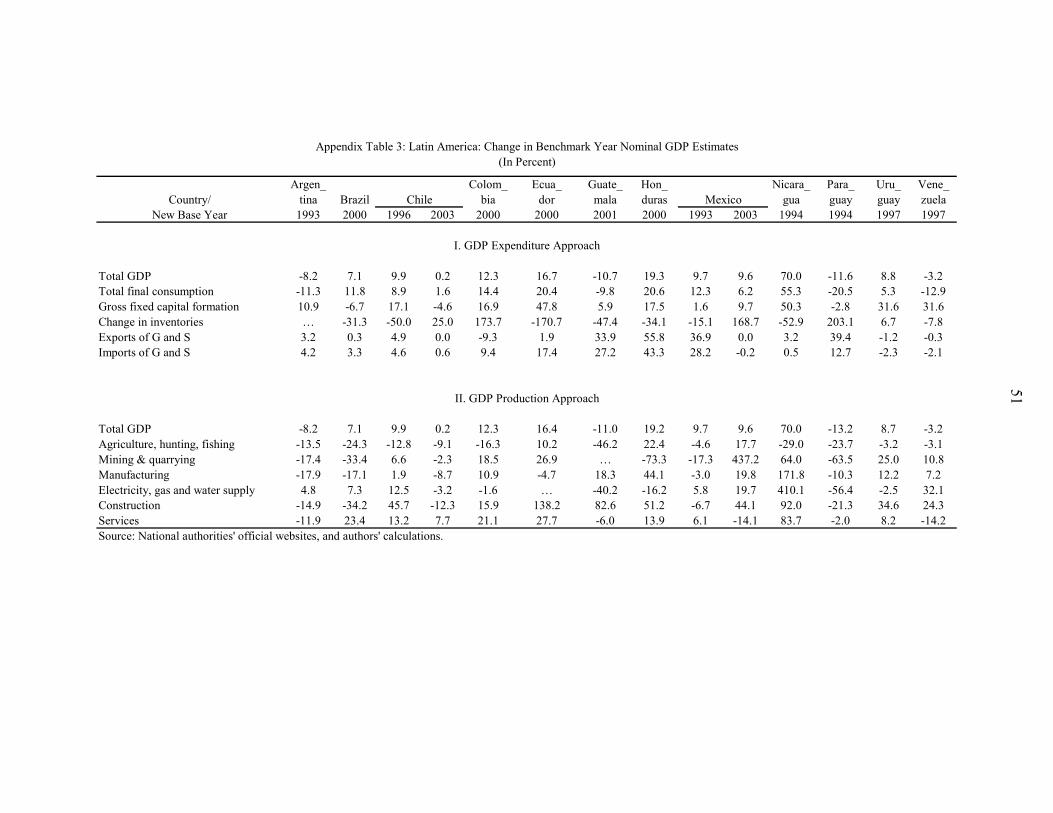
Argen_ Colom_ Ecua_ Guate_ Hon_ Nicara_ Para_ Uru_ Vene_Country/ tina Brazil bia dor mala duras gua guay guay zuela
New Base Year 1993 2000 1996 2003 2000 2000 2001 2000 1993 2003 1994 1994 1997 1997
Total GDP -8.2 7.1 9.9 0.2 12.3 16.7 -10.7 19.3 9.7 9.6 70.0 -11.6 8.8 -3.2Total final consumption -11.3 11.8 8.9 1.6 14.4 20.4 -9.8 20.6 12.3 6.2 55.3 -20.5 5.3 -12.9Gross fixed capital formation 10.9 -6.7 17.1 -4.6 16.9 47.8 5.9 17.5 1.6 9.7 50.3 -2.8 31.6 31.6Change in inventories … -31.3 -50.0 25.0 173.7 -170.7 -47.4 -34.1 -15.1 168.7 -52.9 203.1 6.7 -7.8Exports of G and S 3.2 0.3 4.9 0.0 -9.3 1.9 33.9 55.8 36.9 0.0 3.2 39.4 -1.2 -0.3Imports of G and S 4.2 3.3 4.6 0.6 9.4 17.4 27.2 43.3 28.2 -0.2 0.5 12.7 -2.3 -2.1
Total GDP -8.2 7.1 9.9 0.2 12.3 16.4 -11.0 19.2 9.7 9.6 70.0 -13.2 8.7 -3.2Agriculture, hunting, fishing -13.5 -24.3 -12.8 -9.1 -16.3 10.2 -46.2 22.4 -4.6 17.7 -29.0 -23.7 -3.2 -3.1Mining & quarrying -17.4 -33.4 6.6 -2.3 18.5 26.9 … -73.3 -17.3 437.2 64.0 -63.5 25.0 10.8Manufacturing -17.9 -17.1 1.9 -8.7 10.9 -4.7 18.3 44.1 -3.0 19.8 171.8 -10.3 12.2 7.2Electricity, gas and water supply 4.8 7.3 12.5 -3.2 -1.6 … -40.2 -16.2 5.8 19.7 410.1 -56.4 -2.5 32.1Construction -14.9 -34.2 45.7 -12.3 15.9 138.2 82.6 51.2 -6.7 44.1 92.0 -21.3 34.6 24.3Services -11.9 23.4 13.2 7.7 21.1 27.7 -6.0 13.9 6.1 -14.1 83.7 -2.0 8.2 -14.2Source: National authorities' official websites, and authors' calculations.
Appendix Table 3: Latin America: Change in Benchmark Year Nominal GDP Estimates(In Percent)
II. GDP Production Approach
Chile Mexico
I. GDP Expenditure Approach
51