latino-owned businesses shining a light on national trends · latino business owners tend to rely...
TRANSCRIPT

A
LATINO-OWNED BUSINESSES
Shining a Light on National Trends

B
PUBLISHEDNovember 2018
AUTHORSClaire Kramer Mills, Ph.D. AVP, Federal Reserve Bank of New York
Jessica Battisto Senior Analyst, Federal Reserve Bank of New York
Scott Lieberman Senior Analyst, Federal Reserve Bank of New York
Marlene Orozco Lead Research Analyst, Stanford Latino Entrepreneurship Initiative
Iliana Perez, Ph.D. Research Analyst, Stanford Latino Entrepreneurship Initiative
Nancy S. Lee, Ph.D. Senior Manager, Research and Evaluation, Interise
The views and opinions expressed here are solely those of the authors and do not necessarily reflect those of the Federal Reserve Bank of New York or Federal Reserve System.

i
TABLE OF CONTENTS
TABLE OF CONTENTS
GLOSSARY AND DATA SOURCES iiGlossary of Terms iiData Sources and Focus on Employer Firms ii
EXECUTIVE SUMMARY ivKey Findings iv
INTRODUCTION vii
1 LATINO DEMOGRAPHICS 1
2 NATIONAL SMALL BUSINESS TRENDS 4Growth and Importance of Latino-owned Businesses 6Performance of Latino-owned Businesses 6Financial Challenges: Persistent Operating Expense and Credit Availability Issues 9
3 TOP TEN LATINO METROPOLITAN AREAS BY POPULATION 22Overview 22Latino Entrepreneurship Score 23Key Findings 24Discussion 34
4 CASE STUDIES 35Overview 35Case Study Method 35Themes Among Scaled Firms 38Themes Among Unscaled Firms 38Overview of Cases 39
5 BEST PRACTICES FOR SCALING 46
6 KEY FINDINGS AND FUTURE RESEARCH 48Future Research 49
7 APPENDICES 52Appendix A: Survey Methodologies 52Appendix B: Top Ten Metro Area Characteristics 53Appendix C: About the Collaborating Organizations 56

ii
GLOSSARY AND DATA SOURCES
Glossary of Terms This report uses several terms repeatedly. In order to clarify the specific meanings used in this report, we define these terms below.
� Employer firm: A firm with part-time or full-time employees on payroll. These firms are poised to have the greatest impact on the economy and job creation compared to nonemployer firms.
� General chamber of commerce: A general chamber of commerce refers to any state, local, regional, or national business chamber of commerce that is not identity-specific (e.g. Hispanic chambers of commerce, black chambers of commerce, LGBT chambers of commerce).
� Metropolitan Statistical Area (MSA): A geographic region with a population density typically centered around a single, large city but expanding across a large region. MSAs are used by the Census Bureau and other agencies for statistical purposes and are defined by the U.S. Office of Management and Budget.
� Microbusiness: A business generating less than $100,000 in annual revenue.
� Nonemployer firm: A firm with no paid employees, annual business receipts of $1,000 or more ($1 or more in the construction industry), and subject to federal income taxes. These firms make up three-quarters of all U.S. businesses but account for only about three percent of business receipts, according to the Small Business Administration.
� Scale/scaling/scaled: A firm that is generating at least $1,000,000 in annual revenue.
� Unscaled: A firm that is not yet generating $1,000,000 in annual revenue.
Data Sources and Focus on Employer FirmsThis report draws on a variety of data sources, both quantitative and qualitative. A short descrip-tion of the range of sources referenced in this report, from Census data to surveys to detailed interviews with entrepreneurs, is found in the following paragraphs.
Timely and detailed data about small business growth potential, including the ability to access financing, is scarce. For national and state trends, researchers have relied heavily on two datasets from the U.S. Census Bureau: the Survey of Business Owners (SBO) and Annual Survey of Entre-preneurs (ASE). The SBO surveys both employer and nonemployer businesses and is conducted every five years (in years ending in two and seven), but contains limited financing questions. The ASE, which commenced in 2014, provides more frequent data (the first survey was released in 2016 and has been updated annually) but examines only employer firms. Beginning in 2017, the Census Bureau initiated a new survey called the Annual Business Survey (ABS) to replace the ASE and the SBO. The ABS will only survey employer firms and will contain more detailed questions on financing and credit market experiences, but limits public access to tabulations that provide sum-

iii
Glossary and data sources
mary statistics of business sales and receipts; annual payroll; employment broken out by firm size, age, and industry; and owner characteristics such as gender, race, ethnicity, and veteran status.1,2
While the ABS will be a critical source of small business information, data gaps remain, including detailed and accessible information on the performance and financing experiences of particular segments of firms (for example, the growing share of minority-owned firms). The Stanford Graduate School of Business’ Latino Entrepreneurship Initiative (SLEI) and the Federal Reserve Banks have launched surveys to help address these gaps: the SLEI Survey of U.S. Latino Business Owners and the Federal Reserve Banks’ Small Business Credit Survey (SBCS). The SLEI survey focuses exclusively on Latino-owned businesses,3 while the Fed’s survey draws upon a broader sample of business owners, including Latino-owned businesses, enabling comparisons between minority- and white-owned firms.4,5 To construct a more complete picture about the growth opportunities and challenges facing Latino-owned businesses, this report draws upon evidence from the Census Bureau, SLEI, Interise, and the Federal Reserve Banks.
The Federal Reserve Banks’ Small Business Credit Survey was developed as a complement to existing surveys in the wake of the Financial Crisis, with a specific emphasis on the financing needs and outcomes of small businesses nationwide. The survey dives far beyond demographics, including detailed questions about debt holdings, credit applications and outcomes, and financial challenges facing small businesses. These questions provide a unique lens to track the individual experiences of businesses that are not captured in aggregate demographic statistics.
Relatedly, the SLEI Survey of U.S. Latino Business Owners provides important information on the state and growth of Latino-owned businesses by asking in-depth questions about the business (e.g. regulatory impacts on profitability, export markets, operations, capital types, etc.) and the business owner’s characteristics (e.g. motivations, family history, year of immigration, etc.). Other similar data are often regional in nature and/or limited to small sample sizes. As a result, the implications are often limited to singular geographies and the data cannot be cut to look at specif-ic patterns by industry, gender, revenue, immigrant status, and region to better understand the heterogeneous experiences of Latino business owners.
In this report, we focus specifically on employer firms—those with part- or full-time employees on payroll in addition to the business owner—unless otherwise specified. Though these firms com-prise approximately 23.8 percent of small business establishments,6 they are responsible for a disproportionate share of revenue and job growth within the small business sector.7 Among Latinos, employer firms make up about nine percent of the business ecosystem.8
1 https://www.census.gov/programs-surveys/abs/about.html2 Additional sources of information include the U.S. Census Bureau’s County Business Patterns/Zipcode Business Patterns
(CBP/ZBP) and Nonemployer Statistics series. Both of these are available at the U.S. and state levels. Nonemployer Statistics are available for the 50 most populous MSAs. CBP/ZBP contains further geographic detail. However, both exclude detailed statistics by the race, ethnicity, and gender of owner. Statistics of U.S. Businesses is also available at the US, state, MSA, and county levels, but with minimal demographic information.
3 The SLEI survey defines Latino interchangeably with the ethnicity “Hispanic or Latino” reported on Census Bureau surveys. Non-Latino refers to the “Not Hispanic or Latino” ethnicity.
4 For detailed information about survey methodologies, please see Appendix A.5 The SBCS considers a business more than 50% owned by Hispanic or Latino owners as a Hispanic/Latino-owned business,
regardless of race. White-owned firms are firms where at least half of the business is owned by non-Hispanic white owners.6 Authors’ calculations based on County Business Patterns & Nonemployer Statistics. See also https://www.census.gov/library/
stories/2018/09/three-fourths-nations-businesses-do-not-have-paid-employees.html7 Mishel, L. and Wolfe, J. (2018). “Nonemployer establishments grew in 2016 but their real revenues were stable: This confirms other
data on self employment showing more activity, but little impact.” Economic Policy Institute. Available: https://www.epi.org/blog/ nonemployer-establishments-grew-in-2016-but-their-real-revenues-were-stable-confirming-other-data-on-self-employment- showing-more-activity-but-little-economic-impact/
8 Orozco, M., Oyer, P., & Porras, J. (2017). State of Latino Entrepreneurship 2017. Stanford Latino Entrepreneurship Initiative. Available: https://www.gsb.stanford.edu/sites/gsb/files/publication-pdf/report-slei-state-latino-entrepreneurship-2017.pdf

iviv
EXECUTIVE SUMMARY
9 U.S. Hispanic Chamber of Commerce10 Haltiwanger, J.C., Jarmin, R.S., & Miranda, J. (2012.) “Who Creates Jobs? Small vs. Large vs. Young.” NBER Working Paper No. 16300.
Available: https://www.nber.org/papers/w1630011 Ibid (8)12 Fairlie, R.; Morelix, A.; Reedy, E.J.; and Russell, J. (2015). “The Kauffman Index: Startup Activity, National Trends.” Ewing Marion
Kauffman Foundation.13 Haltiwanger, J.C., Jarmin, R.S., & Miranda, J. (2012.) “Who Creates Jobs? Small vs. Large vs. Young.” NBER Working Paper No. 16300.
Available: https://www.nber.org/papers/w16300; Alvarez, Sarah. (2017). Unleashing Latino-owned Business Potential: A Report of the Aspen Institute Forum on Latino Business Growth. The Aspen Institute Latinos & Society Program.
Latino-owned businesses are growing in number and importance to the American economy. Contributing more than $700 billion in sales to the economy annually,9 they are also an important source of employment as sole proprietors and as firms with employees on payroll. The 2012 U.S. Census Survey of Business Owners estimated that Latino-owned firms have 2.3 million employees on payroll, a number that by several counts has grown since the survey’s release. One in four new businesses, traditionally key sources of new jobs,10 is now Latino-owned. Quite simply, small business growth is tied to the fortunes of Latino-owned businesses.
Yet, research also shows that Latino-owned firms face significant growth barriers. Estimates from the Stanford Latino Entrepreneurship Initiative (SLEI) highlight that only three percent of Latino- owned businesses grow to $1,000,000 or more in annual revenues, compared to six percent of white-owned businesses.11 In short, despite impressive numbers of startups, Latino-owned firms tend to stay small.12
This report builds on earlier work from SLEI and the Aspen Institute13 to probe firm-level and environmental-level growth factors that influence Latino business performance. By comparing Latino-owned firms to non-Latino white-owned firms, unscaled Latino-owned firms to scaled firms, and metro areas of relatively strong Latino entrepreneurship to those with smaller shares of Latino-owned businesses, we are able to discern the most acute challenges and begin to highlight remedies to these challenges. This report’s goal is to focus attention on potential investments at the firm- and community-level that will advance Latino business growth. It draws on analysis of U.S. Census Bureau data, surveys from SLEI and the Federal Reserve Banks, interviews with the owners of scaled and unscaled Latino-owned firms as part of a research collaboration between Stanford Graduate School of Business, the Federal Reserve Bank of New York, and Interise.
Key Findings1. Latino business owners tend to rely on informal financing and are frequently averse
to taking on debt.
� Latino business owners tend to depend on personal savings and seed funding from friends and family to start their businesses.
� Latino entrepreneurs state they are averse to amassing debt to support the business, and that such financing is often not available at acceptable terms.

v
Executive summary
� Reliance on personal funds and loans from family/friends can cause a deterioration of personal credit and inhibit scaling.
2. Latino business owners bear greater personal financial risk, related to lower credit scores and limited credit histories.
� Latino business owners are more likely than non-Latino white business owners to use credit cards, factoring, and merchant cash advances—products that require less collateral and are associated with higher average interest rates.
� Latino-owned firms are also much more likely to use personal guarantees than business assets to secure financing (47 percent compared to 34 percent).
� Latino-owned businesses report being medium or high credit risk at higher rates than non-Latino white-owned firms: 49 percent compared to 29 percent. These patterns are consistent with the fact that a higher proportion of Latino-owned businesses are startups, but also suggest a limited ability to secure affordable growth capital.
3. Latino business owners face significant financial challenges compared to white business owners.
� Despite reporting comparable patterns of revenue growth, employment growth, and profitability as non-Latino white-owned businesses, Latino-owned businesses report acute operating expense and credit availability issues.
� These challenges are equally common among unscaled and scaled Latino-owned busi-nesses, with 44 percent of scaled firms stating that they have difficulties paying operating expenses and 35 percent reporting credit availability issues. In fact, scaled Latino-owned businesses are more likely to report credit availability issues than unscaled non-Latino white-owned businesses.
� Latino-owned businesses applied for financing in 2017 at slightly higher rates than non- Latino white-owned businesses—47 percent compared to 40 percent—but were much more likely to experience funding shortfalls: 28 percent received full funding, compared to 49 percent of non-Latino white-owned businesses. What’s more, the funding gaps are especially acute for the large share—97 percent—of Latino-owned businesses with $1,000,000 or less in annual revenues: 40 percent of loan and line of credit applicants received none of the financing applied for, compared to only 23 percent of non-Latino white-owned businesses.
4. Operational challenges differ for scaled and unscaled Latino-owned businesses.
� Scaled firms are facing talent shortages, citing smaller pools of skilled workers. These firms are considering ways to develop talent and create unique value propositions in order to set themselves apart.
� Unscaled firms cite difficulty accessing credit to help manage cash flow and to fund startup costs related to expansion and procurement.

vi
Executive summary
5. Metro areas with the highest concentrations of Latinos do not necessarily have the densest shares of Latino entrepreneurs.
� The external funding network (including availability of alternative lenders, e.g. CDFIs), local economic development that favors certain industries (e.g. construction), property values, state minimum wage laws, and local and state tax rates all play critical roles in supporting Latino entrepreneurs.
� Among areas with the densest Latino populations, only Miami and Chicago have commensurate entrepreneurship rates.
6. Latino-owned businesses have more success with relationship banking.
� The most common forms of capital that Latino-owned small businesses need are lines of credit, loans, and cash advances, like many small businesses.
� Latino business owners have more success working with small, local banks than large or national banks. Latino business owners in areas like Chicago and Houston use local banks at ten times and six times the rate of national banks, respectively.
� At small banks, there is greater opportunity for developing personal relationships with bankers and getting advice.
7. Latino-owned firms have opportunities to diversify and expand their revenue sources, including B2B and government sales.
� A majority of Latino-owned firms (64 percent) sell to individuals.
� Forty-two percent of Latino-owned businesses sell to other businesses, compared to 47 percent of non-Latino white-owned businesses.
� Despite incentives in state, local, and federal government procurement, only 16 percent of Latino-owned firms sell to state/local government and only 11 percent sell to the federal government. These percentages are identical to those of non-Latino white-owned businesses.
8. Density of existing business networks makes certain geographies more hospitable to Latino business growth, as do mentorship and capacity building programs.
� Latino business owners in the San Diego area participate in trade associations at nearly twice the rate of trade association participation among Latinos nationally (23 percent compared to 12 percent). There is also high trade association participation in Miami at 19 percent.
� Latino business owners in the Phoenix area participate in Hispanic chambers of commerce at nearly three times the rate of the national participation among Latinos (28 percent compared to ten percent).
� Experienced mentors help Latino business owners overcome business and environmental hurdles and can serve as models for success. Multiple business owners cited engaging mentors and participating in business organizations and executive education programs as ways to obtain information on new opportunities and further business support.

vii
INTRODUCTION
14 Passel J., Cohn D., & Lopez M. (2011). “Hispanics Account for More than Half of Nation’s Growth in Past Decade.” Pew Research Center. Available: http://www.pewhispanic.org/2011/03/24/hispanics-account-for-more-than-half-of-nations-growth-in-past-decade/
15 Alonzo, F. (2018). “Hispanic Heritage Month.” US Census Bureau https://www.census.gov/newsroom/facts-for-features/2018/hispanic-heritage-month.html
16 (2016). “Business Employment Dynamics: Entrepreneurship and the U.S. Economy.” US Bureau of Labor Statistics. https://www.bls.gov/bdm/entrepreneurship/entrepreneurship.htm
17 Pekkala Kerr, S. and W.R. Kerr. (2016). “Immigrants Play a Disproportionate Role in American Entrepreneurship.” Harvard Business Review. Available: https://hbr.org/2016/10/immigrants-play-a-disproportionate-role-in-american-entrepreneurship
18 US Census Bureau, Annual Survey of Entrepreneurs 2014, 2016.19 The collaboration began at a conference of the Aspen Institute’s Latinos & Society Program in June 2017.
Our thanks to Monica Lozano and Abigail Golden-Vazquez for their leadership in convening the group.
The Latino population in the United States has grown rapidly, accounting for more than half of the nation’s population growth from 2000 to 2010.14 As of 2017, Latinos comprised 18 percent of the total U.S. population and population projections suggest that figure will climb to 28 percent by 2060,15 which means one of every four residents in the U.S. will be Latino. Amid lagging business startup rates,16 immigrant and Latino business growth has bolstered the small business sector. One study found that, although immigrants constitute 15 percent of the U.S. workforce, they account for one quarter of U.S. entrepreneurs, and that share has grown over time.17 The growth of Latino-owned businesses has outpaced that of other demographic groups; specifically, the number of majority Latino-owned employer businesses increased more than 13 percent between 2014 and 2016, compared to less than three percent growth for non-Latino-owned businesses. In the same time period, employment among Latino-owned employer businesses increased by over 14 percent, more than twice the employment growth of non-Latino-owned businesses.18
Despite this rapid growth, the share of Latino employer firms relative to the Latino population remains low, a trend that the Stanford Latino Entrepreneurship Initiative (SLEI) calls the “Latino Entrepreneurship Gap.” As a share of the population, non-Latinos own employer firms at nearly three times the rate of Latinos. What are the circumstances that make it harder for Latinos to start businesses and for Latino-owned firms to thrive and scale? How are Latino entrepreneurs navigat-ing the complex task of running a business, and how might their experiences differ from other en-trepreneurs? This report, the result of collaboration between SLEI, Interise, and the New York Fed,19 aims to illuminate the challenges and opportunities facing Latino entrepreneurs. We utilize unique data assets, including the Federal Reserve Banks’ Small Business Credit Survey, SLEI’s Survey of U.S. Latino Business Owners, and interviews with Latino business owners conducted by SLEI and Interise to highlight opportunities for unleashing the potential of Latino-owned firms and creating a more equitable and successful business climate.

11
LATINO DEMOGRAPHICS
Census data, specifically the Annual Survey of Entrepreneurs (ASE), offer a unique look at the demographics of Latino-owned employer firms and entrepreneurs, compared to the rest of the U.S. business population. Overall, Latino-owned firms are smaller, younger, have younger manage-ment, and are slightly more concentrated in a few industry categories including transportation, construction, leisure & hospitality, and administrative services.
The following industry figure compares the types of businesses owned by Latinos and non-Latinos using the North American Industrial Classification System (NAICS). High concentrations of Latino- owned businesses are found in the Transportation and warehousing (NAICS 51) and Construction (NAICS 23) sectors, which are contained in the “Non-manufacturing goods production & associated services” category; these represent one in four Latino-owned firms. Latino-owned businesses are also more concentrated in the Leisure & hospitality category, specifically in the Accommodation & food services industries (NAICS 72), than non-Latino-owned businesses. There is also a large concen tration of Latino-owned businesses in the industry of Administrative and support and waste management and remediation services (NAICS 56) relative to non-Latino-owned businesses. In contrast, Latino-owned businesses are underrepresented in the Professional, scientific, and techni-cal services sector (NAICS 54).
1
FIGURE 1
Non-manufacturing goods production & associated services
Professional services, information, real estate & management of companies
Administrative support, waste management, and other services
Manufacturing
Retail trade
Leisure & hospitality
Finance & insurance
Education & healthcare
Latino-owned Non-Latino-
owned
INDUSTRY
Source: Annual Survey of Entrepreneurs, 2016.
22%26%
4%4%
12%11%
11%14%
4%3%
12%11%
22%15%
13%17%

2
Latino demographics
A second notable difference between Latino- and non-Latino-owned employer firms is the age of businesses. Nearly half of Latino-owned businesses were started less than six years ago, compared to 33 percent of non-Latino-owned firms. In the following figures, we compare the age distribution of firms with Latino ownership to those with non-Latino or equally Latino/non-Latino ownership. Latino-owned businesses tend to be younger, in aggregate, than non-Latino firms; only 19 percent of Latino-owned businesses are at least 16 years old, compared to 34 percent of non-Latino-owned businesses. While there is a dynamism to young firms, financial challenges are common, including the ability to secure loan financing, which often requires a minimum of two years of tax receipts.
Latino-owned businesses also tend to be a bit smaller, on average, than non-Latino-owned businesses. Non-Latino-owned businesses are nearly twice as likely to have 100 or more employ-ees compared to Latino-owned businesses, and more than twice as likely to have 500 or more employees. Latino-owned businesses are more likely to report having one to four employees than non-Latino-owned businesses.
AGE OF FIRM (Years in Business)
16 or more 11–15 6–10 4–5 2–3 Less than 2
Latino- owned
Non-Latino-owned
19%
13%
22%
13%
19%
14%
34%
14%
19%
10%
14%
9%
Source: Annual Survey of Entrepreneurs, 2016.
Latino- owned
Non-Latino-owned
NUMBER OF EMPLOYEES
50 or more 20–49 10–19 5–9 1–4 0
Source: Annual Survey of Entrepreneurs, 2016.
2%5%
11%
17%
55%
11%
3%
7%
11%
18%
52%
10%
FIGURE 2 FIGURE 3

3
Latino demographics
Demographically, the Latino population in the U.S. is younger than the non-Latino population— in 2017, the median age of the Latino population was 29, compared to the median age for the entire U.S. population of 38.20 Similarly, Latino business owners tend to be younger than non-Latino business owners—33 percent of Latino entrepreneurs are younger than 45, compared to just 22 percent of non-Latino entrepreneurs.
Finally, we look at the share of business owners born in the U.S., since immigrants are more likely to start businesses than non-immigrants. Among employer firms, fifty-one percent of Latino busi-ness owners were not born citizens of the U.S., compared with only fourteen percent of non-Latino business owners. This may be a factor in Latino business starts among employer firms, but it may also present challenges as immigrant business owners may lack established credit histories or financial and business networks that can help to accelerate growth.
20 US Census Bureau, 1-year American Community Survey, 2017.
AGE OF OWNER
65 or over 55–64 45–54 35–44 Under 35
Latino Non-Latino
10%
23%
34%
24%
9%
20%
31%
27%
16%
6%
Source: Annual Survey of Entrepreneurs, 2016.
FIGURE 4

4
NATIONAL SMALL BUSINESS TRENDS
21 A firm is classified as “Latino-owned” if more than half of the business is owned by a person/persons who is/are Hispanic.22 Battisto, J., deZeeuw, M., Kramer Mills, C., Lieberman, S., and Wiersch, A.M.(2017). Small Business Credit Survey: Report on Employer
Firms, Federal Reserve Banks. Available: https://www.fedsmallbusiness.org/medialibrary/fedsmallbusiness/files/2018/sbcs- employer-firms-report.pdf
23 Ibid (15)24 Ibid (10)25 Ibid (10)26 Rodriguez, N. (2017). 8 Facts about Latino-Owned Businesses. Stanford Latino Entrepreneurship Initiative. Available:
https://www.gsb.stanford.edu/sites/gsb/files/publication-pdf/academic-publication-slei-8-facts-latino-businesses.pdf27 Ibid (8)
This section describes how the business performance of Latino-owned small employer firms21 (in this section, referred to as “Latino-owned businesses”), their key financial challenges, and their financing experiences compare to those of non-Latino white-owned small employer firms (hereafter, referred to as “white-owned businesses”).
The economy for small business in the U.S. is strong and improving, but revenue and startup statistics alone do not tell the full story. In 2017, most small businesses exhibited growth, with 57 percent of small employer firms reporting profitability and 53 percent reporting increased revenue in the Federal Reserve Banks’ 2017 Small Business Credit Survey (SBCS).22 Expectations for future growth reflect a strong economic environment, with 72 percent of employer firms expecting that revenue will increase in the next year and 48 percent expecting to hire more employees in that same timeframe.23
Although small business revenues and profits are growing, firms are not reporting increased demand for new financing. In fact, the trends reflect the opposite. Forty percent of respondents to the 2017 SBCS reported applying for financing in the last year, down from 45 percent in 2016.24 Meanwhile, 64 percent of firms reported financial challenges for their business in the past year, with operating expenses (60 percent of respondents), credit availability (30 percent), and debt payments (25 percent) as the top three challenges. Most firms (67 percent) used personal funds to overcome these financing problems.25
The small business climate varies across demographic lines, including ethnicity, race, income, and gender. Between 2007 and 2012, the number of Latino-owned businesses increased by 47 percent, while the number of non-Latino-owned businesses decreased by two percent.26 Post-recession, the growth rate of Latino-owned businesses continues to outpace that of any other demographic group.27 However, the factors leading to business creation, challenges to growth, and performance of Latino-owned firms differ from their white and non-Latino counterparts.
Latino and black business owners may be more likely to begin their businesses out of necessity (referred to as necessity entrepreneurship) than non-Latino white and Asian business owners. The Kauffman Foundation defines necessity entrepreneurs as those who are unemployed before starting their business, possibly reflecting the higher unemployment rate of Latinos and black Americans (5.4 percent for Latinos and 8.4 percent for blacks as compared to 4.9 percent overall
2

5
National small business trends
in 2016).28 It should be noted that in addition to the motivations being racially and ethnically dis-tinct, patterns may also be gendered. Data from SLEI’s most recent survey show Latinas report more necessity-driven reasons for starting a business, such as greater work-life balance and flexible work arrangements, compared to men.29
The Kauffman Foundation study reports that non-Latino white and Asian business owners are more likely to begin their businesses out of opportunity (opportunity entrepreneurship).30 Revealing an emerging trend, SLEI’s most recent data show that opportunity-driven motivations are also primary drivers for Latino entrepreneurship overall. As such, differences in motivation do not suffi-ciently explain differences in outcomes.
Moreover, there is a disparity between Latinos and non-Latinos in access to financial capital from financial institutions. According to research compiled by SLEI, 69 percent of Latino-owned business-es use personal savings for financial capital, compared to 62 percent of non-Latinos. Furthermore, 12 percent of Latinos get financing from friends, as compared to only three percent of non-Latinos. Only six percent of Latinos access funding through commercial banks, compared to 11 percent of non-Latinos.31
The racial and ethnic wealth gap in the U.S. presents an added challenge for Latino entrepreneurs: Latinos have a median wealth of $13,730, which is about ten percent of the median wealth of white Americans.32 The pool of available financial capital for a group that largely draws from personal and friends’ savings is significantly smaller than groups that are more likely to draw from financial institutions. According to the Kauffman Foundation, small businesses with $5,000 or less in startup capital are 23 percent more likely to fail than those with $100,000 or more33 and $100,000 is more than seven times the average wealth of an American Latino. Access to capital presents a troubling challenge to specific demographics of business owners.
The wealth gap, along with access to education and family background, presents more challenges to the average Latino or black business owner than to the average white or Asian business owner in the U.S. For example, Asian and white Americans are more likely to have college degrees (50 percent and 29 percent, respectively) than black and Latino Americans (18 percent and 13 percent, respectively). However, it should be noted that these trends look different among the business owner population. For example, Latino business owners hold a college degree at more than twice the rate of the general Latino population.34 Still, entrepreneurs with college diplomas are more likely to have revenue over $100,000 and paid employees than those without.35
Evidence also suggests that people who know entrepreneurs are more likely to be successful entrepreneurs themselves.36 Presently, Latinos demonstrate a family history of entrepreneurship with 51 percent of entrepreneurs reporting a family history of entrepreneurship with a close family member currently or previously owning a business.37 However, because Latino-owned
28 Quittner, J. (2016) “It’s Hard to Tell Who’s Driving the Uptick in Minority Entrepreneurship.” Fortune. Available: http://fortune.com/ 2016/08/05/whos-driving-minority-entrepreneurship/
29 SLEI forthcoming report. 30 Fetsch, E. (2016). “Including People of Color in the Promise of Entrepreneurship.” Entrepreneurship Policy Digest. Kauffman Foundation.
Available: https://www.kauffman.org/what-we-do/resources/entrepreneurship-policy-digest/including-people-of-color-in-the-prom-ise-of-entrepreneurship
31 Ibid (18)32 Ibid (15)33 Ibid (15)34 Ibid (8)35 Ibid (15)36 Ibid (15)37 Ibid (8)

6
National small business trends
businesses tend to start small and stay small, the role modeling effect may not be as consequen-tial as previously thought, especially if the benefit of family entrepreneurship comes in the form of resource provision.
Despite the growth in number of Latino-owned businesses, ethnic and racial disparities are not necessarily lessening. There is still work to do to improve the small business climate for all types of entrepreneurs and business owners. The following section describes the business performance of Latino-owned employer firms, their key financial challenges, and their financing experiences compared to those of white-owned firms.
Growth and Importance of Latino-owned BusinessesTwo key facts underscore the economic importance of Latinos and Latino-owned businesses: 1) Latinos own an increasing number and share of businesses and 2) Latinos start approximately one in four new businesses in the U.S.—a critical source of new jobs in the economy.38
� Based upon Census data, Latinos owned 12 percent of all businesses in 2012, up from eight percent in 2007.39 Between 2007 and 2012, the number of total Latino-owned businesses grew by 46 percent compared a 0.2 percent decline in the number of non- Latino-owned businesses.40
� Between 1996 and 2016, the Latino share of new entrepreneurs rose from ten percent to 24 percent, consistent with longer-term rising rates of Latino entrepreneurship and their growing share of the U.S. population.41 During this same time period, the white share dropped from 77 percent to 56 percent.
Performance of Latino-owned Businesses
Concentration of Smaller FirmsGiven the growth in number and share of Latino-owned businesses, their performance and future growth is of increasing significance to the national economy and to the vitality of local communi-ties. Previous studies42 have examined various measures of performance, including the percentage of firms growing to scale—or having generated at least $1,000,000 in annual revenues. As detailed below from the 2017 SBCS data,43 Latino-owned businesses are generally smaller than white-owned businesses: 21 percent of Latino-owned employer firms reported revenues greater than $1,000,000 compared to 32 percent of white-owned employer firms. What’s more, Latino-owned employer firms are twice as likely as white-owned employer firms to be microenterprises, or firms with $100,000 or less in annual revenues (34 percent compared to 17 percent, respectively).
38 Haltiwanger, J., R.S. Jarmin, and J. Miranda. (2013). “Who Creates Jobs? Small Versus Large Versus Young.” The Review of Economics and Statistics 95, No. 2.
39 Bernstein, R. (2016). “Hispanic-Owned Businesses on the Upswing.” U.S. Census Bureau. Available: https://www.census.gov/ newsroom/blogs/random-samplings/2016/12/hispanic-owned_busin.html
40 Authors’ calculations from Survey of Business Owners.41 Morelix, A. Fairlie, R. and Tareque, I. (2017). Kaufman Index of Startup Activity. Ewing Marion Kauffman Foundation.42 Ibid (41)43 References to the Small Business Credit Survey refer to small businesses, defined as businesses with fewer than 500 employees.

7
National small business trends
Strong Revenue and Employment GrowthWhile Latino-owned employer firms may be smaller on average and the sector may have signifi-cant concentrations of microbusinesses, overall Latino-owned businesses reported comparable revenue and employment growth patterns to white-owned businesses. Data from the 2017 SBCS show nearly identical shares of growing firms as measured by changes in revenues and payroll additions of part- or full-time employees.
FIGURE 5
Categories have been simplified for readability. Actual categories are: $100K or less, $100,001-$1M, $1,000,001-$10M, More than $10M.Source: 2017 Small Business Credit Survey, Federal Reserve Banks
Latino-owned (N=502)
Non-Latino white-owned (N=6,332)
$100K or less $100K–$1M $1M–$10M More than $10M
17%
34%
51%45%
27%
18%
3% 5%
REVENUE SIZE OF FIRM
% of employer firms
FIGURE 6 FIGURE 7
Latino-owned (N=520) Non-Latino white-owned (N=6,446)
REVENUE CHANGE, Prior 12 Months
% of employer firms
Increased54%
52%
No change21%
23%
Decreased25%
25%
Source: 2017 Small Business Credit Survey, Federal Reserve Banks
Latino-owned (N=472) Non-Latino white-owned (N=6,254)
Source: 2017 Small Business Credit Survey, Federal Reserve Banks
EMPLOYMENT CHANGE, Prior 12 Months
% of employer firms
Increased34%
36%
No change50%
50%
Decreased16%
14%

8
National small business trends
Additionally, firms may be able to capitalize on this growth in a few ways. First, a sizeable share (50 percent) of Latino-owned businesses reports being certified minority-owned, which may help them access opportunities in corporate and government procurement. Second, diversifying sales targets by expanding into different revenue streams can provide additional growth opportunities. The 2017 SBCS indicated that Latino-owned businesses drew revenue from similar sources as white-owned businesses, with individuals being the most common source of revenue. Still, notable shares of Latino-owned firms sell to government entities, pointing to varied revenue streams.
Profitability According to the 2016 ASE, Latino-owned employer firms overall are also similar to white-owned businesses in profitability, with only slightly smaller shares of profitable firms, another key measure of economic success.
Latino-owned
White-owned
Reflects all employer firms. Other figures in this section (using the 2017 SBCS) reflect small employer firms.Source: U.S. Census Bureau, Annual Survey of Entrepreneurs, 2016.
Business had losses
Business broke even
Business had profits
Individuals Other businesses State/local government Federal government
Latino-owned (N=481)
Non-Latino white-owned (N=6,011)
10+% of revenue refers to a firm receiving at least 10 percent of its annual revenue from the source.Respondents could select multiple options.Source: 2017 Small Business Credit Survey, Federal Reserve Banks
FIGURE 8
SOURCE(S) OF 10+% OF REVENUE
% of employer firms
67%64%
47%42%
16%16%11%11%
FIGURE 9
PROFITABILITY
% of employer firms
65%17%18%
59%22%19%

9
National small business trends
Financial Challenges: Persistent Operating Expense and Credit Availability Issues Despite positive indicators of growth and bottom line performance, financial challenges are com-mon among small businesses, and even more common among Latino-owned businesses. The 2017 SBCS asked respondents whether they experienced a series of financial challenges during the 12 months prior to survey completion.44 First, Latino-owned businesses were more likely to state that they had financial difficulties—71 percent compared to 62 percent of white-owned businesses—and higher shares of Latino-owned businesses experienced each of the specific challenges than white-owned businesses. Second, difficulties paying operating expenses are a pervasive problem for small firms and are consistently reported as a top financial challenge. For Latino-owned businesses, credit availability challenges are equally acute as issues paying operating expenses. These credit-related issues are much more pronounced among Latino- owned businesses than white-owned businesses (41 percent versus 28 percent).
44 Approximately Q4 2016 through Q4 2017.
FIGURE 10
FINANCIAL CHALLENGES, Prior 12 Months
% of employer firms
Paying operating expenses
Credit availability
Making payments on debt
Purchasing inventory or supplies to fulfill contracts
Other financial challenge
Did not experience any financial challenges
Latino-owned (N=526)
Non-Latino white-owned (N=6,541)
40%41%
28%41%
24%29%
16%26%
12%10%
38%29%
Respondents could select multiple options.Prior 12 Months is approximately Q4 2016 through Q4 2017.Source: 2017 Small Business Credit Survey, Federal Reserve Banks.

10
Furthermore, challenges with paying operating expenses and credit availability are persistent, even among Latino-owned businesses that have grown to scale. Whereas scaled white-owned busi-nesses were much less likely to report difficulties meeting operating expenses than smaller firms (29 percent compared to 44 percent), these challenges are equally common among smaller and larger revenue Latino-owned businesses. In fact, almost half (44 percent) of scaled Latino-owned businesses reported operating expense issues.
Credit availability differences between Latino-owned businesses and white-owned businesses are also striking. Latino-owned businesses, both small and large, were much more likely to report ac-cess to credit issues than white-owned businesses. Notably, scaled Latino-owned businesses were slightly more likely to report credit availability challenges than non-scaled white-owned businesses.
National small business trends
Respondents could select multiple options.Source: 2017 Small Business Credit Survey, Federal Reserve Banks
44%
29%
42%44%
31%
22%
43%
35%
Latino-owned, >$1M (N=168)
Latino-owned, ≤$1M (N=333)
Non-Latino white-owned, >$1M (N=2,975)
Non-Latino white-owned, ≤$1M (N=3,304)
Paying operating expenses Credit availability
FIGURE 11
TOP FINANCIAL CHALLENGES, by Firm Revenue and Ethnicity
% of employer firms

11
National small business trends
These challenges are likely to have important implications for Latino business growth. When firms that applied for financing in the prior 12 months45 were surveyed about why they were seeking financing, a majority (61 percent) stated that they had applied for expansion funding. An inability to secure capital for expansion means deferred investment and growth.
Debt HoldingsOverall, more than two-thirds of both Latino- and white-owned businesses reported having outstanding debt.
45 Approximately Q4 2016 through Q4 2017.
Respondents could select multiple options.Source: 2017 Small Business Credit Survey, Federal Reserve Banks
Latino-owned (N=249)
Non-Latino white-owned (N=2,797)
59%61%
42%41%
25%22%
8%10%
Expand business, pursue new opportunity, or replace capital assets
Meet operating expenses
Refinance or pay down debt
Other reason
FIGURE 12
REASONS FOR APPLYING
% of applicants
Latino-owned (N=516)
Non-Latino white-owned (N=6,539)
Source: 2017 Small Business Credit Survey, Federal Reserve Banks
FIGURE 13
SHARE WITH PRIOR OUTSTANDING DEBT, At Time of Survey
% of employer firms
69%
69%

12
National small business trends
However, the debt holdings of Latino-owned businesses are smaller, consistent with higher shares of micro firms ($100,000 or less in annual revenues). Two-thirds of Latino-owned businesses with debt hold amounts of $100,000 or less, compared to 55 percent of white-owned businesses with debt.
The following figure details the type of debt holdings of Latino- and white-owned businesses, and illustrates that Latino-owned businesses are more likely to use credit cards, factoring, and merchant cash advances—products that require less collateral and that are also associated with higher average interest rates.
Categories have been simplified for readability. Actual categories are: ≤$25K, $25,001K–$100K, $100,001K–$250K, $250,001K–$1M, >$1M.Percentages may not sum to 100 due to rounding.Source: 2017 Small Business Credit Survey, Federal Reserve Banks
Latino-owned (N=351)
Non-Latino white-owned (N=4,554)
≤$25K $25K–$100K $100K–$250K $250K–$1M >$1M
22%
34% 33%32%
19%16%
18%14%
8%3%
FIGURE 14
AMOUNT OF DEBT
% of employer firms with debt

13
National small business trends
This observation about the types of financing products used is borne out in firms’ responses to questions about the collateral used to secure debt holdings. As seen in Figure 15, a higher share of Latino-owned businesses reported using products that require no collateral compared to white-owned businesses; among those that used collateral, more relied on a personal guarantee than business assets to secure the financing. There is a large gap between the 34 percent of Latino-owned businesses that use business assets to secure debt and the more than 51 percent of white-owned businesses that secure capital in this way.
Latino-owned (N=525)
Non-Latino white-owned (N=6,562)
Respondents could select multiple options.Source: 2017 Small Business Credit Survey, Federal Reserve Banks
Credit card
Factoring
Other
Business does not use external financing
Loan or line of credit
Trade credit
Leasing
Equity investment
Merchant cash advance
56%50%
51%54%
10%13%
10%11%
6%9%
7%4%
6%3%
3%2%
15%21%
FIGURE 15
EXTERNAL FINANCING HELD OR REGULARLY USED
% of employer firms

14
National small business trends
Financing NeedsDifferences in financing patterns are also present among firms that have recently applied for financing.46 Overall, Latino-owned businesses showed stronger demand for financing in 2017 than white-owned businesses, with nearly half of Latino-owned businesses applying for capital.
46 Applied for financing in the prior 12 months. Approximately Q4 2016 through Q4 2017.
Respondents could select multiple options.Source: 2017 Small Business Credit Survey, Federal Reserve Banks
FIGURE 16
COLLATERAL USED TO SECURE DEBT
% of employer firms with debt
Latino-owned (N=362)
Non-Latino white-owned (N=4,646)
Personal guarantee
Business assets
Personal assets
Portions of future sales
Other
None
56%47%
51%34%
33%25%
6%10%
14%21%
1%1%
Latino-owned (N=530)
Non-Latino white-owned (N=6,600)
Prior 12 Months is approximately Q4 2016 through Q4 2017.Source: 2017 Small Business Credit Survey, Federal Reserve Banks
FIGURE 17
SHARE THAT APPLIED FOR FINANCING, Prior 12 Months
% of employer firms
47%
40%

15
National small business trends
However, consistent with the smaller average revenue size of Latino-owned businesses, the financ-ing requests made by Latino-owned businesses tended to be smaller than those of white-owned businesses. Slightly more than two-thirds of Latino-owned businesses applied for $100,000 or less in capital, or what might be considered ‘micro loans.’ Differences in financing demand are also ap-parent among firms seeking amounts that are typically described as bank-friendly loans—amounts over $250,000—given origination costs and profitability concerns of financial institutions in lending smaller amounts of capital;47 the share of Latino-owned businesses applying for these amounts was 17 percent, compared to 26 percent of white-owned businesses.
47 Mills, K. and B. McCarthy. (2016). “The state of Small Business Lending: Innovation and Technology and the Implications for Regulation,” Harvard Business School Working Paper Series. Available: http://www.hbs.edu/faculty/Publication%20Files/ 17-042_30393d52-3c61-41cb-a78a-ebbe3e040e55.pdf
Percentages may not sum to 100 due to rounding.Source: 2017 Small Business Credit Survey, Federal Reserve Banks
Latino-owned (N=241)
Non-Latino white-owned (N=2,735)
≤$25K $25K–$100K $100K–$250K $250K–$1M >$1M
22%
27%
33%
40%
19%17% 18%
13%
8%4%
FIGURE 18
AMOUNT OF FINANCING APPLIED FOR
% of applicants

16
National small business trends
The products demanded are consistent across firms, with strong majorities of applicants—at least 80 percent—across the board seeking loans or lines of credit. In fact, the product demands of Latino and white applicants are similar, though Latino-owned firms apply at lower rates for loans and lines of credit and at higher rates for merchant cash advances.
Respondents could select multiple options.Source: 2017 Small Business Credit Survey, Federal Reserve Banks
FIGURE 19
FINANCING AND CREDIT PRODUCTS SOUGHT
% of applicants
Loan or line of credit
Factoring
Other
Credit card
Leasing
Trade credit
Equity investment
Merchant cash advance
Latino-owned (N=249)
Non-Latino white-owned (N=2,803)
86%80%
26%24%
10%12%
10%9%
8%9%
6%9%
4% 4%
6%5%

17
National small business trends
These differences persist when controlling for credit risk. Among low credit risk firms, 41 percent of white-owned businesses experienced a financing shortfall, compared to 53 percent of Latino-owned businesses. Moreover, while low credit risk Latino-owned businesses were more likely to receive all of the financing sought compared to medium/high credit risk Latino- owned businesses, about one-third of Latino-owned businesses received none of the financing sought, regardless of credit risk.
Credit risk is based on self-reported business credit score or personal credit score, depending on which is used to obtain financing for the business. If the firm uses both, the highest risk rating (lowest score) is used. ‘Low credit risk’ is an 80-100 business score or 720+ personal credit score. ‘Medium credit risk’ is a 50-79 business credit score or a 620-719 personal credit score. ‘High credit risk’ is a 1-49 business credit score or a <620 personal credit score.Source: 2017 Small Business Credit Survey, Federal Reserve Banks
Non-Latino white-owned, low credit risk (N=1,320)
Non-Latino white-owned, medium/high credit risk (N=634)
59%25%16%
26%44%30%
Latino-owned, low credit risk (N=75)
Latino-owned, medium/high credit risk (N=101)
47%19%34%
14%53%33%
Financing OutcomesWhile the expressed product needs of Latino-owned businesses and white-owned businesses are similar, their ability to secure financing differs markedly. The following figure shows the total amount of financing dollars approved by respondents. As seen in the figure below, nearly half of white-owned businesses received all of the financing they sought, whereas only 28 percent of Latino-owned businesses were approved for the full amount of financing. In fact, 71 percent of Latino-owned businesses experienced a financing shortfall in their applications, receiving less than the desired amount, compared to 51 percent of white-owned businesses.
Latino-owned (N=241)
Non-Latino white-owned (N=2,746)
Percentages may not sum to 100 due to rounding.Source: 2017 Small Business Credit Survey, Federal Reserve Banks
28%37%34%
49%31%20%
None Some All
FIGURE 20
FINANCING RECEIVED
% of applicants
FIGURE 21
FINANCING RECEIVED BY ETHNICITY & CREDIT RISK OF FIRM
% of employer firms
None Some All

18
National small business trends
A more detailed look at loan, line of credit, and cash advance applications shows higher financing success rates for these products than for financing amounts overall. Forty-five percent of Latino ap-plicants reported being fully approved for the loan, line of credit, or cash advance products that they applied for, compared to only 28 percent of applicants across all financing types. The same pattern holds among white applicants, with 62 percent of firms receiving the full amount requested for loans, lines of credit, and cash advances, compared to 49 percent success rates across all financing types.
Differences in success rates also vary by lending institution. The following figure depicts the success rates of loan/line of credit and cash advance applications at large and small banks for Latino-owned and white-owned businesses. While the data are limited and should be interpreted with caution, particularly among Latino-owned businesses, a consistent pattern holds; white-owned businesses reported higher approval rates. Moreover, small firms, irrespective of ethnicity, report greater success at small banks compared to large banks, and this pattern appears to be even more pronounced for Latino-owned businesses, with 60 percent of applicants reporting credit success at small banks, compared to 34 percent of applicants at large banks.
Latino-owned (N=180)
Non-Latino white-owned (N=2,129)
Percentages may not sum to 100 due to rounding.Source: 2017 Small Business Credit Survey, Federal Reserve Banks
FIGURE 23
LOAN, LINE OF CREDIT, AND CASH ADVANCE APPROVAL RATE BY SOURCE
% of loan/line of credit and cash advance applicants at each lender
Latino-owned (N=62–91)
Non-Latino white-owned (N=944–1,131)
Large bank Small bank
60%34%
70%56%
Source: 2017 Small Business Credit Survey, Federal Reserve Banks
FIGURE 22
LOAN, LINE OF CREDIT, AND CASH ADVANCE APPROVAL RATE
% of loan/line of credit and cash advance applicants
62%18%19%
45%21%34% None Some All
19
National small business trends
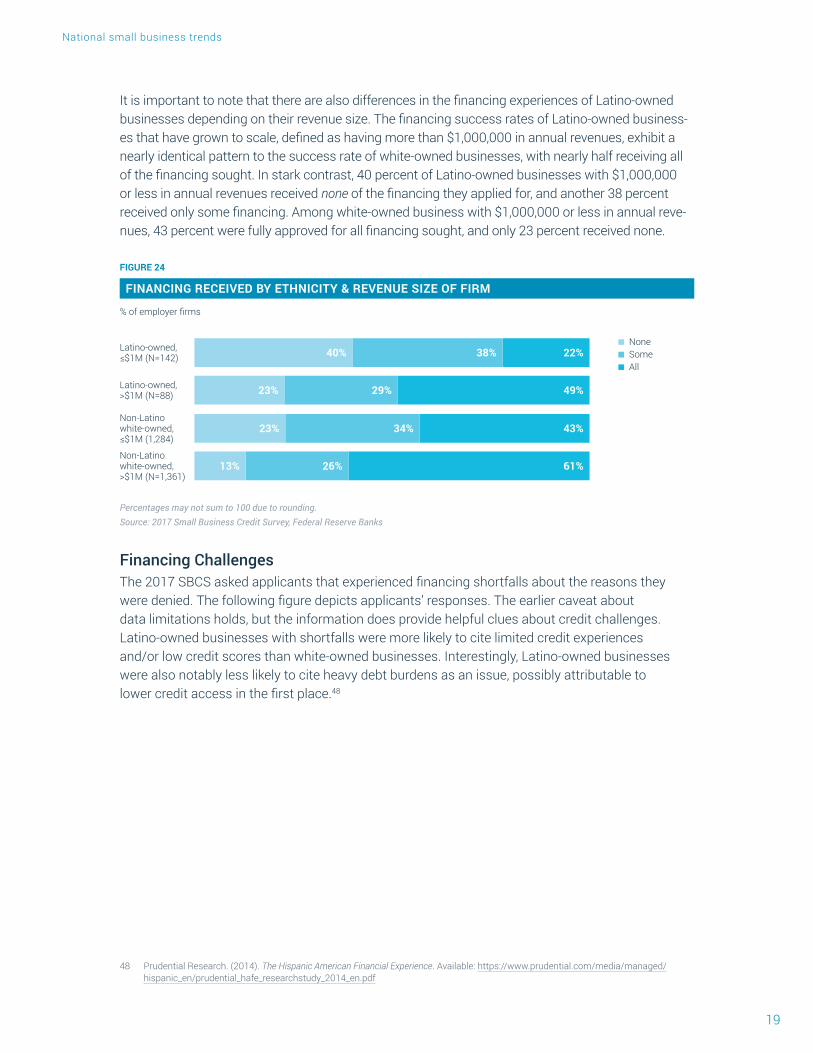
It is important to note that there are also differences in the financing experiences of Latino-owned businesses depending on their revenue size. The financing success rates of Latino-owned business-es that have grown to scale, defined as having more than $1,000,000 in annual revenues, exhibit a nearly identical pattern to the success rate of white-owned businesses, with nearly half receiving all of the financing sought. In stark contrast, 40 percent of Latino-owned businesses with $1,000,000 or less in annual revenues received none of the financing they applied for, and another 38 percent received only some financing. Among white-owned business with $1,000,000 or less in annual reve-nues, 43 percent were fully approved for all financing sought, and only 23 percent received none.
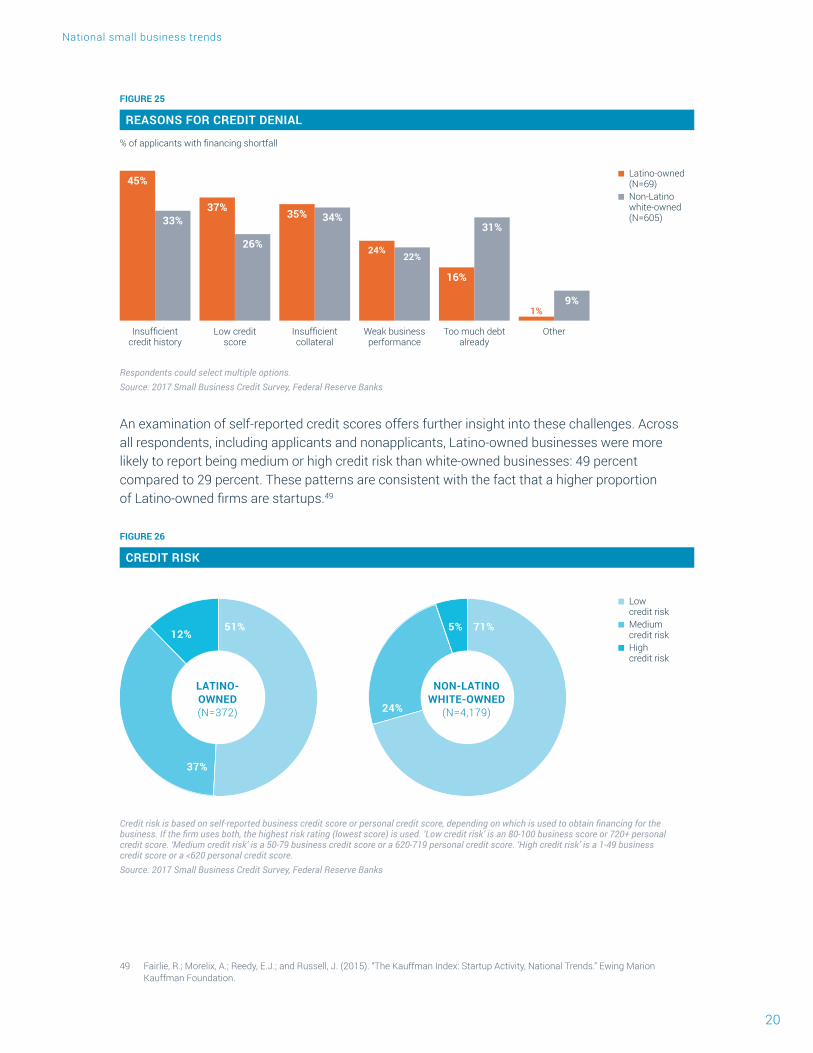
Financing ChallengesThe 2017 SBCS asked applicants that experienced financing shortfalls about the reasons they were denied. The following figure depicts applicants’ responses. The earlier caveat about data limitations holds, but the information does provide helpful clues about credit challenges. Latino-owned businesses with shortfalls were more likely to cite limited credit experiences and/or low credit scores than white-owned businesses. Interestingly, Latino-owned businesses were also notably less likely to cite heavy debt burdens as an issue, possibly attributable to lower credit access in the first place.48
48 Prudential Research. (2014). The Hispanic American Financial Experience. Available: https://www.prudential.com/media/managed/ hispanic_en/prudential_hafe_researchstudy_2014_en.pdf
43%34%23%
61%26%13%
Non-Latino white-owned, ≤$1M (1,284)
Non-Latino white-owned, >$1M (N=1,361)
22%38%40%
49%29%23%
Latino-owned, ≤$1M (N=142)
Latino-owned, >$1M (N=88)
Percentages may not sum to 100 due to rounding.Source: 2017 Small Business Credit Survey, Federal Reserve Banks
FIGURE 24
FINANCING RECEIVED BY ETHNICITY & REVENUE SIZE OF FIRM
% of employer firms
None Some All
20
National small business trends
An examination of self-reported credit scores offers further insight into these challenges. Across all respondents, including applicants and nonapplicants, Latino-owned businesses were more likely to report being medium or high credit risk than white-owned businesses: 49 percent compared to 29 percent. These patterns are consistent with the fact that a higher proportion of Latino-owned firms are startups.49
49 Fairlie, R.; Morelix, A.; Reedy, E.J.; and Russell, J. (2015). “The Kauffman Index: Startup Activity, National Trends.” Ewing Marion Kauffman Foundation.
FIGURE 25
Respondents could select multiple options.Source: 2017 Small Business Credit Survey, Federal Reserve Banks
Latino-owned (N=69)
Non-Latino white-owned (N=605)
Insufficient credit history
33%
45%
Low credit score
26%
37%
Insufficient collateral
34%35%
Too much debt already
31%
16%
Weak business performance
22%24%
Other
9%
REASONS FOR CREDIT DENIAL
% of applicants with financing shortfall
1%
FIGURE 26
Credit risk is based on self-reported business credit score or personal credit score, depending on which is used to obtain financing for the business. If the firm uses both, the highest risk rating (lowest score) is used. ‘Low credit risk’ is an 80-100 business score or 720+ personal credit score. ‘Medium credit risk’ is a 50-79 business credit score or a 620-719 personal credit score. ‘High credit risk’ is a 1-49 business credit score or a <620 personal credit score.Source: 2017 Small Business Credit Survey, Federal Reserve Banks
CREDIT RISK
Low credit risk
Medium credit risk
High credit risk
NON-LATINO WHITE-OWNED
(N=4,179)
71%5%
24%
LATINO- OWNED (N=372)
51%12%
37%

21
National small business trends
These credit risk patterns are also consistent with credit success rates and vary by firm size. Latino-owned businesses that have scaled reported similar credit score patterns to those of white-owned businesses, with more than two-thirds identifying as low credit risk. It is clear that, consistent with other indicators, firms with $1,000,000 or less in annual revenues face challenges in building credit histories and scores, which coincides with difficulty securing financing for their firms.
≤$1M (N=242)
>$1M (N=113)
Credit risk is based on self-reported business credit score or personal credit score, depending on which is used to obtain financing for the business. If the firm uses both, the highest risk rating (lowest score) is used. ‘Low credit risk’ is an 80-100 business score or 720+ personal credit score. ‘Medium credit risk’ is a 50-79 business credit score or a 620-719 personal credit score. ‘High credit risk’ is a 1-49 business credit score or a <620 personal credit score.Source: 2017 Small Business Credit Survey, Federal Reserve Banks
15%35%50%
5%30%65%
FIGURE 27
CREDIT RISK BY REVENUE SIZE OF FIRM
% of Latino-owned businesses
Low credit risk
Medium credit risk
High credit risk

2222
TOP TEN LATINO METROPOLITAN AREAS BY POPULATION
50 Morelix, A., Tareque, I., Orozco, M., Perez, I., Oyer, P., and Porras, J. The U.S. Latino Entrepreneurship Gap: A Comparative Measure of Latino Entrepreneurship Activity. Stanford Latino Entrepreneurship Initiative.
51 More information about methodology available in Appendix A.
OverviewDespite the progress and growth of Latino entrepreneurship, Latino business owners continue to face significant challenges, particularly in the realm of financing, which greatly affects the ability to scale. This is evident in the opportunity gap between employer versus nonemployer firms where non-Latinos own employer businesses at nearly three times the rate of Latinos.50 However, this gap is not evenly distributed across states or Metropolitan Statistical Areas (MSAs) and it is evident from the following figure that the share of the Latino population does not fully explain differences in the share of Latino-owned businesses. Differences in entrepreneurship rates and economic success may be due to personal characteristics of the entrepreneurs, such as gender, higher educational attainment, nativity, personal wealth, and social capital. Geographic characteristics, such as tax rates, cost of land, and local and state policies may also support or hinder business opportunity.
Using the nationally representative (at the MSA level) SLEI Survey of U.S. Latino Business Owners, employer and nonemployer, from 201751 (N=5,026), we have compiled a study of the ten largest metropolitan statistical areas (MSAs) by Latino population, as listed in Figure 28. This analysis uses demographic characteristics of Latino entrepreneurs in these MSAs, such as their average age, nativity, education, gender, and percent reporting a family history of entrepreneurship. Additionally, for each region we provide Latino business statistics on annual revenues, the share of industries among scaled (businesses generating at least $1,000,000 in annual revenue) and unscaled firms, and the greatest business challenges for growth. As an important contribution, we derive the Latino Entrepreneurship Scores of these metro areas, a measure of the gap in entrepreneurship rates between Latinos and non-Latinos.
3

23
Top ten latino metropolitan areas by population
FIGURE 28
TOP TEN METRO AREAS BY TOTAL LATINO POPULATION AND NUMBER OF LATINO-OWNED BUSINESSES (LOBs)
Metropolitan Area Latino Population Latino Share Number of LOBs LOB Share
Los Angeles, Long Beach, Anaheim 5,979,000 45.1 393,051 26.5
New York, Newark, Jersey City 4,780,000 23.9 339,415 15.4
Miami, Ft. Lauderdale, W. Palm Beach 2,554,000 43.3 423,163 47.0
Houston, The Woodlands, Sugar Land 2,335,000 36.4 164,923 27.2
Riverside, San Bernardino, Ontario 2,197,000 49.4 122,233 36.5
Chicago, Naperville, Elgin 2,070,000 21.8 89,523 9.9
Dallas, Fort Worth, Arlington 1,943,000 28.4 117,582 18.3
Phoenix, Mesa, Scottsdale 1,347,000 30.1 54,393 16.0
San Antonio, New Braunfels 1,259,000 55.7 81,126 43.3
San Diego, Carlsbad 1,084,000 33.3 62,753 21.4
Population and Origin in Select U.S. Metropolitan Areas, 2014Source: U.S. Census Survey of Business Owners, 2012 and Pew Research Center, Hispanic
Latino Entrepreneurship Score The Latino Entrepreneurship Score is a comparative measure of the entrepreneurship rates of Latinos and non-Latinos in the U.S. It is defined as the ratio of the employer business ownership rate—the number of entrepreneurs divided by the total population—for Latinos divided by the employer business ownership rate for non-Latinos.52 A score of one would indicate no discernable gap and a score of zero indicates a very large gap.53
As noted in The U.S. Latino Entrepreneurship Gap report, the five metropolitan statistical areas with the highest Latino Entrepreneurship Scores are:
1. Miami-Fort Lauderdale-West Palm Beach, FL2. Tampa-St. Petersburg-Clearwater, FL3. Washington-Arlington-Alexandria, DC-VA-MD-WV4. Orlando-Kissimmee-Sanford, FL5. Portland-Vancouver-Hillsboro, OR-WA
Among the ten MSAs with the largest Latino populations, only Miami makes the top five of the highest Latino Entrepreneurship Scores. Chicago makes the top ten list, ranked number seven with its Latino Entrepreneurship Score of 0.30. Figure 29 provides the rankings and scores of the other metro areas with the largest Latino populations. While we cannot prove the cause of these low entrepreneurship scores in the largest Latino metro areas, insights from Latino entrepreneurs in these regions, discussed in Section 4, shed light on possible factors. These factors include, but are not limited to, access to external funding, local economic development that favors certain indus-tries (e.g., construction), property values, state minimum wage laws, and local and state tax rates.
52 Number of entrepreneurs taken from the Census Bureau, 2015 Annual Survey of Entrepreneurs (ASE). Population data taken from 2011-2015 American Community Survey (5-year). We consider only employer firms, which are firms with at least one paid employee.
53 Ibid (51)

24
Top ten latino metropolitan areas by population
FIGURE 29
LATINO ENTREPRENEURSHIP SCORES FOR THE TEN MSAs WITH THE LARGEST LATINO POPULATIONS
Rank Metropolitan Area Latino Entrepreneurship Rate
Non-Latino Entrepreneurship Rate
Latino Entrepreneurship Score
1 Miami-Fort Lauderdale-West Palm Beach, FL 17.9 30.2 0.59
7 Chicago-Naperville-Elgin, IL-IN-WI 6.6 21.8 0.30
10 San Antonio-New Braunfels, TX 5.1 20.3 0.25
10 New York-Newark-Jersey City, NY-NJ-PA 6.8 27.3 0.25
11 San Diego-Carlsbad, CA 6.0 24.6 0.24
12 Houston-The Woodlands-Sugar Land, TX 4.3 20.0 0.22
13 Riverside-San Bernardino-Ontario, CA 3.7 17.7 0.21
14 Dallas-Fort Worth-Arlington, TX 3.9 19.2 0.20
15 Phoenix-Mesa-Scottsdale, AZ 3.3 18.5 0.18
16 Los Angeles-Long Beach-Anaheim, CA 5.0 33.3 0.15
Duplicate ranks are tied in the entrepreneurship score. Source: 2018 Stanford Latino Entrepreneurship Gap Report
Key Findings
RevenueAccording to the 2016 ASE, 20 percent of all Latino-owned employer firms are scaled, generating $1,000,000 or more in annual revenue, compared to 26 percent of non-Latino-owned employer firms. While Miami has historically been held as a central Latino entrepreneurship hub,54 greater success can be seen in other metro areas, as measured by the annual revenue of Latino-owned businesses. By this measure, shown in Figure 30, Phoenix is the metro leader with the greatest proportion (17 percent) of Latino-owned businesses surveyed in the scaled revenue bracket. New York comes in second with five percent of firms in the scaled bracket. The share of scaled firms in the other eight metro areas hovers around the national average share, among all Latino-owned businesses, of three percent.
54 Card, D. (1990). The Impact of the Mariel Boatlift on the Miami Labor Market. Industrial and Labor Relations Review, 43(2), 245–257.

25
Top ten latino metropolitan areas by population
Sources of CapitalData from the SLEI Survey of U.S. Latino Business Owners show that Latino-owned businesses primarily rely on personal savings and family/friends loans to start their businesses, not unlike that of other demographic groups. In addition, the data reveal nuances in the sources of external fund-ing that Latino entrepreneurs use to grow their businesses. These external sources include loans from commercial/national banks, local/regional banks, government agencies, private equity, angel funding, venture capital, and hard money. As noted in the previous section, these external sources of funding, such as national banks (large banks) and local banks (small banks), show different approval rates among Latino-owned businesses and white-owned businesses. These data are presented for those who had successful applications and do not account for those who attempted but did not receive funding from the different sources.
Similar to startup funding, the data show that personal savings and family/friends loans are commonly used in these ten MSAs for growth funding. Lines of credit also surface as a secondary source of capital for business growth. In fact, Latino employer firms use credit cards at higher rates than all other groups to grow their businesses and they also have the highest utilization rates of trade credit (buy now, pay later) according to the ASE, relative to other demographic groups. Similarly, Latino-owned businesses across the ten metro areas rely on hard money as the third most common and in some places, the second most common, source of external funding for growth. As noted in the 2017 State of Latino Entrepreneurship (SOLE) report, hard money is secured from private sources and is less regulated than more formal business loans. As well, the costs of hard money can be very high—interest rates often range from 12 to 18 percent—placing considerable pressure on businesses that use them for funding. Considering the primary sources of external funding, the data show that Latinos bear greater personal financial risk in starting and growing their businesses when compared to other groups.
FIGURE 30
Source: 2017 SLEI Survey of U.S. Latino Business Owners
>$1M $500K–$999K $100K–$499K $50K–$99K <$50K
Los Angeles (N=314)
New York (N=409)
Riverside (N=111)
Phoenix (N=76)
Miami (N=248)
Chicago (N=224)
San Antonio (N=70)
Houston (N=125)
Dallas (N=108)
San Diego
(N=62)
ANNUAL REVENUE FOR TOP TEN METRO AREAS

26
Top ten latino metropolitan areas by population
According to the 2016 ASE, Latino employer firms use bank loans the least to start businesses, relative to all other demographic groups. At the growth stage, Latino entrepreneurs rely more heavily on local bank loans as opposed to national bank funding. In Chicago and Houston, in par-ticular, local bank loans are accessed at higher rates than the national average among all Latino entrepreneurs surveyed.
FIGURE 31
Respondents could select multiple options.Source: 2017 SLEI Survey of U.S. Latino Business Owners
Hard Money Private Equity Angel Investor Venture Capital Loans from
a government agency
Loans from national/ commercial bank
Loans from local/regional bank
Lines of Credit Savings, Friends
and family
Los Angeles (N=314)
New York (N=409)
Riverside (N=111)
Phoenix (N=76)
Miami (N=248)
Chicago (N=224)
San Antonio (N=70)
Houston (N=125)
Dallas (N=108)
San Diego
(N=62)
Industry DistributionBased on SLEI’s 2017 Survey of U.S. Latino Business Owners, there is some variation across industries for scaled Latino-owned firms, which generally looks similar to other scaled non-Latino employer firms. Some notable differences among scaled employer firms include a higher concen-tration of Latino-owned businesses (19 percent) in the Construction (NAICS 23) sector, compared to 14 percent of non-Latino-owned businesses; a higher concentration of Latino-owned businesses in Accommodations and food services (NAICS 72) (14 percent), compared to nine percent of non-Latino-owned businesses; and a lower concentration of Latino-owned businesses (13 percent) in the Retail trade sector (NAICS 44-45), compared to 18 percent of non-Latino-owned businesses.55 In Figure 32, we see an overrepresentation in the Construction (NAICS 23) industry across all MSAs, except Chicago, which has a larger concentration of scaled businesses in Professional, sci-entific, technical services (NAICS 54) (65 percent) and Riverside, which has a larger representation of scaled businesses in the Information sector (NAICS 51) (31 percent). These results coincide with national trends for scaled Latino-owned firms, with 39 percent of scaled Latino-owned firms in the Construction (NAICS 23) sector and 23 percent in Professional, scientific, technical services (NAICS 54).56
55 Author’s calculations from 2016 ASE.56 Ibid
SOURCES OF CAPITAL FOR GROWTH FOR TOP TEN METRO AREAS

27
Top ten latino metropolitan areas by population
Employee CountsThe majority of Latino-owned businesses are nonemployer firms, firms that do not have any paid full- or part-time employees, as is shown in Figure 33 below. According to SLEI’s 2017 Survey of U.S. Latino Business Owners, among scaled Latino-owned firms in the ten MSAs with the largest Latino populations, the majority are employer firms, as is shown in Figure 34. Three MSAs are exceptions in having a higher proportion of scaled nonemployer firms, compared to the other MSAs: Chicago (59 percent), New York (73 percent), and Phoenix (97 percent).57
57 Some geographies have very small sample sizes. Data may not necessarily be representative at very small sample sizes.
FIGURE 33
Some geographies have very small sample sizes. Data may not necessarily be representative at very small sample sizes.Source: 2017 SLEI Survey of U.S. Latino Business Owners
Source: 2017 SLEI Survey of U.S. Latino Business Owners
50+ 10–49 1–9 0
Los Angeles (N=314)
New York (N=409)
Riverside (N=111)
Phoenix (N=76)
Miami (N=248)
Chicago (N=224)
San Antonio (N=70)
Houston (N=125)
Dallas (N=108)
San Diego
(N=62)
FIGURE 32
Trade/ Transportation/Utilities
Professional/Business Services
Other Services Natural
Resources/Marketing
Manufacturing Leisure/
Hospitality Information Financial
Activities Education/
Health Services
ConstructionLos Angeles (N=95)
New York (N=123)
Riverside (N=26)
Phoenix (N=12)
Miami (N=88)
Chicago (N=71)
San Antonio (N=11)
Houston (N=33)
Dallas (N=37)
San Diego
(N=28)
TOP INDUSTRIES AMONG SCALED LATINO-OWNED FIRMS ($1M+) FOR TOP TEN METRO AREAS
EMPLOYEE COUNTS AMONG ALL LATINO-OWNED FIRMS FOR TOP TEN METRO AREAS

28
Top ten latino metropolitan areas by population
Top Ten Metro Area SnapshotsThis section provides an overview of Latino-owned businesses, employer and nonemployer, across the top ten metro areas that includes business and business owner characteristics, utilization of capital for business growth, and participation in business organizations,58 based on data from SLEI’s 2017 Survey of U.S. Latino Business Owners.59 The top ten metros are discussed in order of their Latino entrepreneurship rank, based on the Latino entrepreneurship score. It should be noted that differences between MSAs are suggestive, rather than precise estimates. In addition to business and business owner characteristics, we include data on property and land value, wages and taxes at the metro and state levels.60 These data points begin to shed light on why some geographic areas may be doing better than others. For example, we see that metro areas in Texas benefit from lower land values and cost of labor, compared to all other metro areas discussed. Suburban metro areas in California, such as Riverside, also have a competitive advantage with lower land values across the state. We also see, according to the 2019 State Business Tax Climate Index,61 that Texas and Florida are states with some of the most business-friendly tax systems, which might attract new business and foment business growth. In this section, the trends in the metro areas are compared to the national averages among all Latino business owners surveyed (hereafter “national averages”).
58 See Table 1 in Appendix B for complete overview of the top ten metro area characteristics.59 The SLEI Survey of U.S. Latino Business Owners allows for comparisons of national Latino-owned businesses with Latino-owned busi-
nesses in the metro regions.60 See Table 2 in Appendix B for additional data about property value, wages, and taxes for the top ten metro areas.61 Walczak, J., Drenkard, S., & Bishop-Henchman, J. (2018) 2019 State Business Tax Climate Index. Tax Foundation.
https://files.taxfoundation.org/20180925174436/2019-State-Business-Tax-Climate-Index.pdf
FIGURE 34
Some geographies have very small sample sizes. Data may not necessarily be representative at very small sample sizes.Source: 2017 SLEI Survey of U.S. Latino Business Owners
50+ 10–49 1–9 0
Los Angeles (N=95)
New York (N=123)
Riverside (N=26)
Phoenix (N=12)
Miami (N=88)
Chicago (N=71)
San Antonio (N=11)
Houston (N=33)
Dallas (N=37)
San Diego
(N=28)
EMPLOYEE COUNTS AMONG SCALED FIRMS ($1M+) FOR TOP TEN METRO AREAS

29
Top ten latino metropolitan areas by population
MIAMI-FORT LAUDERDALE-WEST PALM BEACH, FL
62 Jiménez, A., Palmero-Cámara, C., González-Santos, M. J., González-Bernal, J., & Jiménez-Eguizábal, J. A. (2015). The impact of educational levels on formal and informal entrepreneurship. BRQ Business Research Quarterly, 18(3), 204-212.
Latino Entrepreneurship Rank:
1MSA Average Land Value:
$216,056State Minimum Wage:
$8.25State Corporate Income Tax:
5.5%Many Miami MSA Latino business owners have a strong family history of entrepreneurship (71 percent), which provides some evidence as to why it may have the highest Latino entrepreneurship gap score. There is also a high immigrant concentration (52 percent) compared to the national average of 27 percent and a much higher representation of females (56 percent), compared to the national average of 42 percent.
We know access to financial capital is crucial for business growth and it seems the Miami MSA provides ample access to different financial products for Latino-owned businesses. Miami MSA Latino-owned businesses leverage multiple sources of funding including savings, family and friends; local/regional bank loans; government loans; angel invest-ments; private equity; and hard money at higher rates, compared to Florida State-based Latino-owned businesses and Latino-owned businesses across the nation. The most popular sources of growth capital for Miami MSA Latino-owned businesses are savings, family and friends (16 percent) and hard money (14 percent).
The top two industries for Latino-owned scaled firms in the Miami MSA are 1) Construction and 2) Trade, transportation and utilities, which is why Latino-owned businesses in the area may be more networked in trade associations. Miami MSA Latino entrepreneurs are mostly engaged in trade associations (19 percent), compared to both Florida State (13 percent) and the national average (12 percent).
CHICAGO—NAPERVILLE—ELGIN, IL-IN-WI
Latino Entrepreneurship Rank:
7MSA Average Land Value:
$32,730State Minimum Wage:
$8.25State Corporate Income Tax:
9.5%Chicago MSA Latino-owned businesses have the third highest representation of scaled firms (4 percent) among the ten metro areas and high educational attainment. There is a larger representation of females (63 percent), compared to the national average of 42 percent. There is also a greater representation of college-educated Latino business owners (62 percent) compared to the national average (40 percent). This is not surprising, given that higher educational attainment is one of the most significant factors in economic success for any business.62
Chicago MSA Latino-owned businesses use local and regional banks more than any of the other metro areas discussed, which might suggest that there is a supportive funding ecosystem for Latino-owned businesses. Chicago Metro Area Latino-owned businesses also use lines of credit; savings, family and friends; local banks; and hard money as sources of capital for growth.
65 percent of Latino-owned Chicago MSAs are in Professional and business services and are highly networked. Chicago MSA Latino entrepreneurs are more actively networked in various organizations (Hispanic chambers of commerce, trade associations, and nonprofit boards) compared to state and national averages. Chicago MSA Latino-owned businesses are more actively engaged in nonprofit boards (33 percent) compared to all other metro areas, the state (29 percent) and the nation (5 percent).

30
Top ten latino metropolitan areas by population
SAN ANTONIO—NEW BRAUNFELS, TX
Latino Entrepreneurship Rank:
10MSA Average Land Value:
$25,484State Minimum Wage:
$7.25State Corporate Income Tax:
NoneThe majority of San Antonio MSA Latino business owners are slightly older, mostly male, U.S.-born, with microbusiness-es, generating less than $100,000 in annual revenue. Fewer (6 percent) San Antonio MSA Latino business owners are immigrants compared to the national average of 27 percent. San Antonio MSA Latino business owners are also slightly older with an average age of 44, compared to the national average of 42. Only 24 percent of San Antonio Metro Area Latino business owners have at least a bachelor’s degree compared to 40 percent nationally.
San Antonio MSA Latino-owned businesses use few sources of capital for growth, with the exception of hard money, which might be affecting the ability for small businesses to scale. San Antonio Metro Area Latino business owners use hard money (8 percent) more than businesses in the state of Texas (4 percent) and use savings, friends and family (9 percent) less than Latino-owned businesses in the state of Texas (16 percent) and nationally (13 percent).
San Antonio MSA Latino-owned businesses are also less engaged in business organizations compared to Latino business owners in the state of Texas and nationwide.
Note: Observations are limited for scaled firms. See Figures 32 and 34 for sample sizes.
NEW YORK—NEWARK—JERSEY CITY, NY-NJ-PA
Latino Entrepreneurship Rank:
10MSA Average Land Value:
$250,187State Minimum Wage:
$10.40State Corporate Income Tax:
6.5%The majority of New York MSA Latino business owners are female and younger, compared to national averages. The average age of New York MSA Latino business owners is 39 years compared to 42 years for the national average among Latino-owned businesses. There is a much higher representation of females (70 percent), compared to the national average of 42 percent. There is also a higher representation of scaled firms (5 percent) compared to the national average of two percent, coming in at second place among the top ten metros by Latino population.
One possible reason for the high representation of scaled firms may be a supportive financial ecosystem for Latino- owned businesses. New York MSA Latino-owned businesses leverage external funding of all types at similar rates compared to New York State-based Latino-owned businesses and Latino-owned businesses across the nation. The most popular sources of growth capital for New York MSA Latino-owned businesses are lines of credit (16 percent); savings, family and friends (12 percent); and hard money (11 percent).
More than half of Latino-owned businesses are owned by millennials who are very networked. New York MSA Latino entrepreneurs are more actively networked in Hispanic chambers of commerce (17 percent), compared to those in both New York State (12 percent) and the national average (10 percent). The entrepreneurs are more actively networked in general chambers of commerce (14 percent), compared to the national average (10 percent), and more involved in trade associations (9 percent) compared to those in New York State (6 percent).
federal rate

31
Top ten latino metropolitan areas by population
SAN DIEGO—CARLSBAD, CA
Latino Entrepreneurship Rank:
11MSA Average Land Value:
$436,092
State Minimum Wage:
$11State Corporate Income Tax:
8.84%San Diego MSA Latino-owned businesses are slightly older, more established, and have high rates of family entrepre-neurship in their background. Furthermore, 51 percent of the Latino business owners are female, which is higher than the national average of 42 percent. There is low immigrant representation (20 percent) compared to the national average of 27 percent, and low millennial representation (34 percent) compared to the national average of 40 percent.
Finances are the biggest challenge for growth for San Diego Metro Area Latino-owned businesses, and they seem to have limited opportunities to access external capital for growth. San Diego MSA Latino-owned businesses use all types of external funding less than Latino-owned businesses in the state of California and nationally.
Furthermore, 42 percent of San Diego MSA Latino-owned businesses are actively engaged in general chambers of commerce, higher than the nine other metro areas, much higher than other Latino-owned businesses in the state of California (9 percent) and across the nation (10 percent). San Diego MSA Latino-owned businesses are more actively engaged in trade associations (23 percent) compared to Latino-owned businesses in California (10 percent) and the nation (12 percent).
Note: Observations are limited for scaled firms. See Figures 32 and 34 for sample sizes.
HOUSTON—THE WOODLANDS—SUGAR LAND, TX
Latino Entrepreneurship Rank:
12MSA Average Land Value:
$62,911State Minimum Wage:
$7.25State Corporate Income Tax:
NoneThe majority of Houston MSA Latino-owned businesses have younger owners, are female-owned, and generate less than $100,000 in annual revenue (95 percent). The average age of Houston MSA Latino business owners is 39 years compared to 42 years nationally, and there is a higher percentage of millennials (48 percent) compared to the national average (40 percent). There is also a larger representation of females (66 percent), compared to the national average of 42 percent.
Houston MSA Latino-owned businesses leverage only a few sources of capital for growth, which may be why the vast majority of businesses are small. Thirteen percent of Houston MSA-based Latino-owned businesses use lines of credit—slightly higher than the national average of 12 percent and state average of 11 percent—and use savings, family and friends at a lower proportion (12 percent) compared to all Texas-based Latino-owned businesses (16 percent) and Latino-owned businesses nationwide (13 percent). More Houston MSA Latino-owned businesses (6 percent) use local or regional banks compared to all Latino-owned businesses in the state of Texas (4 percent).
Houston MSA Latino entrepreneurs are actively engaged in trade associations and general chambers of commerce. More specifically, 21 percent of Houston MSA Latino entrepreneurs are involved in general chambers of commerce, com-pared to only 11 percent in the state of Texas and ten percent nationwide. More Houston MSA Latino entrepreneurs (16 percent) are also involved in a trade association compared to Latino entrepreneurs in the state of Texas (15 percent) and nationwide (12 percent).
Note: Observations are limited for scaled firms. See Figures 32 and 34 for sample sizes.
federal rate

32
Top ten latino metropolitan areas by population
RIVERSIDE—SAN BERNARDINO—ONTARIO, CA
Latino Entrepreneurship Rank:
13MSA Average Land Value:
$128,676
State Minimum Wage:
$11State Corporate Income Tax:
8.84%Riverside MSA Latino-owned businesses and business owners are younger, compared to national averages, and 90 percent are micro businesses generating less than $100,000. The average age of a Riverside MSA Latino-owned business is six years compared to 9.5 years among Latino-owned businesses nationwide, while the average business owner age is 39, compared to 42 for the national average. Moreover, more Latino business owners are millennials in the Riverside Metro Area (54 percent), compared to the national average of 40 percent. There is also a larger representation of females (65 percent), compared to the national average of 42 percent. In addition, fewer Latino business owners are immigrants (21 percent), compared to the national average of 27 percent. Moreover, the vast majority (88 percent) of businesses are generating less than $50,000 in annual revenue.
Riverside MSA Latino-owned businesses seem to have limited access to external capital to grow. Riverside MSA Latino- owned businesses use savings, family and friends at two times the rate of California-based Latino-owned businesses (14 percent) and Latino-owned businesses nationwide (13 percent). Moreover, 22 percent of Riverside MSA-based Latino-owned businesses use lines of credit, which is higher than the California average of ten percent and the national average of 12 percent.
Riverside MSA Latino entrepreneurs are not actively engaged in any particular business organizations. Limited access to networks could also be affecting business growth.
Note: Observations are limited for scaled firms. See Figures 32 and 34 for sample sizes.
DALLAS—FORT WORTH—ARLINGTON, TX
Latino Entrepreneurship Rank:
14MSA Average Land Value:
$77,240State Minimum Wage:
$7.25State Corporate Income Tax:
NoneDallas MSA Latino business owners are older, U.S.-born, and the majority are female. Dallas Metro Area Latino- owned businesses and Chicago MSA Latino-owned businesses tie with the third highest proportion of scaled firms (4 percent) among the top ten metro areas. The average age of Dallas Metro Area Latino-owned businesses is 11 years, compared to 9.5 years for the national average among Latino-owned businesses. Sixty-six percent of Dallas MSA Latino business owners have a family history of entrepreneurship, which is greater than the average of Latino business owners nationwide. A smaller share of Latino business owners are millennials (23 percent) compared to the national average of 40 percent.
Even though Dallas MSA Latino-owned businesses have the third highest proportion of scaled firms among the top ten metro areas, the majority of businesses are small or microbusinesses generating less than $100,000 in annual revenue and this may be due to limited access to different types of financial products. Dallas MSA Latino-owned businesses primarily use lines of credit; and savings, family and friends as sources of capital for growth. Dallas MSA Latino-owned businesses use lines of credit (18 percent) more than the Texas state average (11 percent) and more than the U.S. average (12 percent).
Dallas MSA Latino-owned businesses are more actively networked in general chambers of commerce and Hispanic nonprofit boards compared to state and national averages. They are also more engaged (10 percent) with the Hispanic chamber of commerce compared to all Latino business owners in the state of Texas (6 percent).
Note: Observations are limited for scaled firms. See Figures 32 and 34 for sample sizes.
federal rate

33
Top ten latino metropolitan areas by population
PHOENIX—MESA—SCOTTSDALE, AZ
Latino Entrepreneurship Rank:
15MSA Average Land Value:
$92,141
State Minimum Wage:
$10.50State Corporate Income Tax:
4.9%Phoenix MSA Latino-owned businesses take the lead with the highest proportion of scaled firms (17 percent) and have the highest average firm age (16 years) among metro areas highlighted in this report. There is a larger representation of female business owners (77 percent) compared to the national average of 42 percent, and 80 percent of all Phoenix MSA respondents indicated having a family history of entrepreneurship.
Given the large number of scaled firms, surprisingly, Phoenix MSA Latino-owned businesses use fewer sources of capital for growth, compared to state and national averages, with the exception of hard money. Fourteen percent of Phoenix MSA Latino-owned businesses use hard money, which is more than Latino business owners in the state of Arizona (10 percent) and nationally (10 percent).
Phoenix MSA Latino-owned businesses are almost three times more actively engaged in the Hispanic chamber of commerce, compared to the average of Latino-owned businesses nationally (10 percent).
Note: Observations are limited for scaled firms. See Figures 32 and 34 for sample sizes.
LOS ANGELES—LONG BEACH—ANAHEIM, CA
Latino Entrepreneurship Rank:
16MSA Average Land Value:
$483,692State Minimum Wage:
$11State Corporate Income Tax:
8.84%Los Angeles MSA Latino-owned businesses have the lowest Latino entrepreneurship score out of the top ten metro areas. Los Angeles Metro Area Latino-owned businesses are younger compared to national averages of Latino business owners, which could mean that Los Angeles is just starting to take off in Latino business ownership. The average age of Los Angeles MSA Latino-owned businesses is seven years, compared to 9.5 years for the national average among Latino- owned businesses. Moreover, there is a higher representation of Latino business owners who are millennials in the Los Angeles MSA (55 percent), compared to the national average of 40 percent. There is also a higher representation of females (46 percent), compared to the national average of 42 percent. Lastly, more Los Angeles MSA Latino-owned busi-nesses have an owner with at least a Bachelor’s degree (50 percent), compared to the national average of 40 percent.
It seems like the Los Angeles MSA may have limited access to financial capital for business growth. Los Angeles MSA Latino-owned businesses leverage external funding of all types at lower levels, compared to California-based Latino-owned businesses and Latino-owned businesses across the nation. Only one percent of Los Angeles MSA- based Latino-owned businesses use local bank loans compared to four percent nationwide.
Los Angeles MSA Latino entrepreneurs are more actively networked in general chambers of commerce (10 percent) compared to the state average (8 percent). However, Los Angeles MSA Latino entrepreneurs are less connected to all other business organizations compared to state and national averages.

34
Top ten latino metropolitan areas by population
DiscussionThis section provided an overview of the business landscape for each MSA to better understand the regional context of Latino business ownership. A theme across most MSAs is the fact that only a small share of Latino-owned businesses have managed to scale, while the majority remain very small. It is evident that a major challenge is limited access to financial capital, with low usage of different types of financial products across all metro areas. This may warrant addi-tional research as to why Latino-owned businesses are not accessing a wide variety of financial products. As noted in the previous section, Latino business owners are less likely to receive the funding they requested compared to white business owners, which may explain some of the low rates of capital usage in these metro areas. Participation in business organizations was also relatively low across the board, which points to the need for additional research to identify where Latino-owned businesses get access to support and mentoring to grow their business and how this varies by intersectional identities (i.e. gender, age, nativity, etc.). For example, we observe that in places where Latino business owners are older and there are lower rates of immigrant-owned businesses (e.g. Dallas and San Diego), there is higher participation in general chambers of commerce. The next section takes a deeper dive through in-depth interviews with Latino entrepre-neurs across the top ten metro areas.

35
CASE STUDIES
63 Miles, M. B., Huberman, A. M., & Johnny Saldaña. (2014). Qualitative Data Analysis: A Methods Sourcebook. Thousand Oaks, CA: Sage Publications.
Overview Among the ten MSAs with the largest Latino populations (see Figure 28), only two regions also appeared on the top ten list of highest Latino Entrepreneurship Scores: Chicago and Miami. In this section, we explore the Latino business ecosystems of the top ten MSAs by Latino population to better understand the Latino entrepreneur experience—both the challenges and opportunities they face in their businesses within these regions.
Case Study Method Case studies were conducted using in-depth interviews ranging from 30-60 minutes. All interviews were recorded and then transcribed. Coding was conducted with a mix of predetermined catego-ries and inductive coding. Interrater reliability was facilitated by the Dedoose platform that allows for collaborative coding and analysis. Cases were selected in accordance with the assumptions of the strategy of maximum variation63 for the purpose of capturing variation across Latino business owners in the ten MSAs (i.e. differences in gender, industry, and size based on revenues and num-ber of employees) and to identify important common patterns that persist across variations.
Case studies were divided by collaborating organizations that have access to Latino entrepreneurs from their programming. For descriptions of the Stanford Latino Entrepreneurship Initiative Edu-cation Scaling program (SLEI-Ed) and the Interise StreetWise ‘MBA’™, please refer to Appendix C. Together, both SLEI and Interise coordinated on the basis of maximum variation. To ensure further variance, SLEI selected Latino entrepreneurs from the SLEI-Education scaling program, which con-sists of entrepreneurs generating at least $1,000,000 or more in annual revenue. Interise selected Latino entrepreneurs of businesses below the one million-dollar annual revenue threshold at the time of participation in the StreetWise ‘MBA’™. SLEI entrepreneurs were selected from San Antonio, Miami, Dallas, Riverside, and San Diego. Interise entrepreneurs were selected from Los Angeles, New York City, Houston, Chicago, and Phoenix. For an overview of the selected Latino business owners and businesses, see Figure 35 and Figure 36.
4

36
Case studies
FIGURE 35
CASE STUDY DESCRIPTIVES FROM THE STANFORD LATINO ENTREPRENEURSHIP INITIATIVE EDUCATION-SCALING PROGRAM
The Business Owners and Businesses
Entrepreneur Aaron Castro Conchie Fernandez Joel Sanchez Peter Mendoza Maria Carrillo
Business Name Superior Care Emergency CF Creative Premier Cleaning
Services High-light Electric, Inc. Carrillo and Sons
Metro Area San Antonio, TX Miami, FL Dallas, TX Riverside, CA San Diego, CA
Business Characteristics
Industry Ambulatory Services
PR/Digital Marketing
Janitorial Services
Construction and Engineering
Automotive Services
Business Gross Revenues $3.3 million $700,000 $28 million $20 million $2.9 million
Employee Size 65 15 3,460 76 16
Business Owner Characteristics
Gender Male Female Male Male Female
Education MA BA Some college, no degree BA High school
Marital Status Married Married Married Married Married
Immigrant Status U.S. Native Born Immigrant Immigrant Immigrant Immigrant
Family involvement in business
Started with brother
Husband is co-partner
Wife and extended family
Sibling is co-partner; father started
Sons and husband
Age — — 50 — 56
Ancestry Mexican, Mexican-American Dominican Salvadorian Mexican,
Mexican-AmericanMexican, Mexican-American
Case Study Key Words
City permits Microsoft partnership
International expansion; corruption
Business bug at early age
Family business
Finance background
International work
External factors impacting profitability
Municipality contracting
Industry worker shortage
Expansion to bigger location Debt aversion
Immigration, healthcare, minimum wage
Price of land in Riverside
Industry associations; women’s support and mentorship
Texas business friendly; San Antonio cost of living
Strong network in Miami
Multi-level companies
Bootstrapping and online financing (Kabbage)
Mental blockages; mentorship Employee retention Local bank
relationship
Pre-approved credit line; happenstance funding
Bootstrap Texas business friendly
SLEI mentorship on expansion
Note: Employee size calculated as follows: Full time=1; Part-time= .5; contractors=.25
37
Case studies
FIGURE 36
CASE STUDY DESCRIPTIVES FROM THE INTERISE STREETWISE ‘MBA’™
The Business Owners and Businesses
Entrepreneur William Diaz, Jr. Fabiola Jaque-Diaz David Sanchez Tony Batista David Griego
Business Name ESC Cabling California Testing & Inspections
10 Management, Inc., DBA 10 MGMT Floors2Luv Big Lake
Software, LLC
Metro Area Bronx, NY Los Angeles, CA Chicago, IL Houston, TX Phoenix, AZ
Business Characteristics
Industry Construction Professional Services
Arts, Entertainment, Recreation Construction Professional
Services
Business Gross Revenues $600,000 $2,800,000 $476,000 $900,000 $570,000
Employee Size 4 20 32 10 3.5
Business Owner Characteristics
Gender Male Female Male Male Male
Education Bachelor’s Degree
Bachelor of Science (Civil Engineering); Professional Engineer
Bachelor of Arts (Political Science) Associate’s Degree
Bachelor of Science (Computer Engineering)
Marital Status — Married Single Married Married
Immigrant Status — Immigrant Native Immigrant Native
Family involvement in business —
Co-owned with spouse, both working full time on the company
Sole owner Spouse responsible for accounting
Co-owned with spouse
Age 41 50 38 61 47
Ancestry — Chilean Mexican Cuban Spanish
Case Study Key Words
Bootstrapped startup
Understands need for back office systems
Bootstrapped startup
Manages accounts receivables very closely to manage cash flow
Bootstrapped startup
Pursues continuous learning
Startup funded partially by SBA 7(a) loan; plus bootstrap
Established line of credit with community bank
Avoids the need for loans
Transparency of technical work and engagement of clients
Provides profession-al development for employees
Sees personal loans as only viable source of capital
Expanded client base by recognizing social media trend (influencers)
Refinanced building mortgage through a small bank
Needs to delegate technical work to focus on sales
Established relationship with a micro lender and CDFI
Located business in a growth region as a local company
Engages local government about small businesses regulations
Has lieutenants for sales and operations
Manages contract startup costs with a line of credit; obtained from regional bank
Establishing a credit history for the business
Excellent technical and customer services
Engages employees with company’s growth plan
Compelled to mentor fellow Latino business owners
No dedicated mentor; relies on friends and peers
Hires cabling apprentices
Offers professional development to employees
Strong desire to be a role model
Believes most Latino business owners lack sufficient finance knowledge
Believes Latino business owners do not know enough about business support programs and services
Teaches and advises at community college

38
Case studies
Themes Among Scaled FirmsAmong all of the scaled Latino-owned businesses, there was a common theme of family involve-ment in the business. Whether it was a family history of business ownership, or sibling or spousal partnerships, these businesses were intentional in the way they involve family members in their business. Furthermore, several MSAs, especially the MSAs in Texas, were praised as being amena-ble to business through the tax system; Riverside and other regions were highlighted as being cost effective relative to other areas. Miami and San Diego were also considered business friendly with strong networks and community.
Peter Mendoza and Maria Carrillo both discussed the shortage of skilled trade workers in their respective industries—construction and automotive, respectively. With the advent of artificial intelligence (AI), there is a shift towards automation. As such, this is causing a shortage of workers for the trade skills. In order to combat these impending, long-term changes in their industries, both entrepreneurs are considering ways in which they can stand apart and provide a unique value proposition in their businesses. For Maria, this means retaining her personal touch and family iden-tity as a “boutique” shop. For Peter, his command in navigating government contracts will continue to be an asset.
Some of the other external challenges facing entrepreneurs in these regions include the changing political and regulatory environment, particularly as it relates to health care, minimum wage, and immigration reform. These entrepreneurs demonstrated analytical thinking in order to antici-pate changes and formulate a plan to mitigate risk. Aaron Castro demonstrated persistence and resilience when navigating his highly regulated industry and when securing a larger location for his business through his can-do mindset.
Themes Among Unscaled FirmsLike the scaled firms, the unscaled firms self-financed the startup of their businesses using per-sonal savings and capital from family and friends. The one exception is Fabiola Jaque-Diaz, who obtained an SBA 8(a) loan for 40 percent of the startup costs. The owners of the unscaled firms, across the board, mentioned they have had little-to-no success obtaining lines of credit or loans from large commercial banks, which parallels the findings in Section 2. They eventually developed relationships with mid-size banks, community banks, credit unions, or community development financial institutions (CDFIs). These smaller institutions most often approved lines of credit, which provided working capital allowing the business owners to hire staff and cover operational costs related to the kick off of new contracts before they realized receivables.
Family members take on the role of financier, sometimes influencing the business owners’ atti-tudes toward carrying debt and accepting equity financing. They are also business partners and subject matter experts. These business owners do not have formal one-to-one mentors or busi-ness coaches. Instead, they rely on executive education programs such as Interise’s StreetWise ‘MBA’™, services and technical assistance from agencies such as the SBA, and a cadre of individu-als who advise them on specific matters. Regarding the most critical factors to the growth of their businesses, the business owners identified:
� Financial knowledge (Fabiola, Tony, and David G.), � Team depth that allows them to focus on strategy (David G., David S, and Tony), and � Back office business systems (Fabiola, Tony).

39
Case studies
Community is very important to these business owners. Some like William and David G. chose to start a business in the place they call home. Others such as Fabiola chose their location because it provided favorable business conditions. All five of the business owners expressed a strong desire to give back to their communities through mentorship, apprenticeships, professional development, acting as role models, or teaching.
Overview of Cases
Scaled Firms
AARON CASTROFounder/CEO | SuperiorCare Ambulance Services | Ambulatory Services | San Antonio, TX
For Aaron, “it could have been shoes, it could have been chairs” he just knew he wanted to be an entrepreneur. After spending some time on Wall Street during the thick of the recession, he returned to Texas. He was working for a family-owned oil and gas company and found that he had a lot of down time and would volunteer with different entrepreneurship organizations. A family friend reached out to him wanting to grow his small transportation company that he was running out of a spare bedroom of his house. Both he and his brother provided a capital investment in this company and eventually would acquire the rest of it. That was the start of SuperiorCare Ambulance Services, a transportation company that transports non-emergent and emergent patients from “nursing homes, rehab centers, hospitals to doctors’ appointments,
and dialysis.” The company is growing into a full-service emergency medical services firm, providing 911 emergency response.
One of the hardest challenges for Aaron has been the regulations. “I was arrogant enough to think that whatever I touched was going to be successful and I probably jumped into one of the hardest businesses [...] the most heavily regulated [of] businesses.” Still, he was able to get an ambulance license and grow the transportation company. Because of his growth, he recently purchased a new location in a distressed area, a commercial property. Due to the zoning requirements, he had to get his city councilman involved and it has taken him several months to get the appropriate permits to conduct his operations. Still, he credits his finance and banking background in the overall success of his com-pany, indicating he would not be where he is today without his financing training and experiences noting, “my financial background, my evaluation, my analytical background has been huge in the success of this company.”
Furthermore, Aaron indicates he had to overcome “mental blockages” to get to where he is today, generating more than three million dollars in annual revenue. San Antonio has a relatively small share of Latino scaled firms with only one percent of all firms having growing to $1,000,000 in annual revenue compared to the national average of three percent. He remembers thinking one million was a huge number. As a change in mindset, he now thinks “Why can’t we be ten? Or maybe twenty?” Mentors helped him to overcome these mental blockages. These mentors, who he met through the Goldman Sachs network, served as models of people who have become successful entrepreneurs. Importantly, they helped him “normalize things to say, ‘Look, it’s okay to be nervous, it’s okay to be afraid. It’s okay to have these feelings, Rome wasn’t built in a day, but you have to show up the next day.’” Secondly, it is the people who he has hired that have made his company successful.
Aaron, like many other small business owners, has financed his company organically with initial investment from his personal funds. Across the board, San Antonio has low usage of capital for growth. When asked about leveraging external sources of capital for growth, Aaron describes:
I think it depends on the stage that you’re at and how bad you need it. Nothing’s free. Things have to make money, private equity firms have to make money on their investment, and I’m not oblivious to that. For me, it’s about maintaining good relationships with your bank, having them hold you accountable and vice versa, and how fast do you want to grow. We’ve had some private equity firms knock on our door, and I think initially it was great to feel wanted [...] But, it’s just like, why do I want to sell 20 percent of my company when I know we’re going to be double the size in 24 months, do I really need to do that? And that was my determining factor of like, “No, I’m comfortable with the debt component.”
Aaron recounts the line of credit that saved him. He received mail indicating that he was pre-approved for a hundred- thousand-dollar line of credit; this lender had gone through zip codes and checked the credit history of the company. Had they not “gone out there and marketed that, then I never would have known about it.”

40
Case studies
CONCHIE FERNÁNDEZ-CRAIGManaging Partner | CF Creative | Multicultural Marketing/Comms/Business Development | Fort Lauderdale, FL
Conchie is following her passion. She is a writer and always knew she would end up writing. As a content creator with her multicultural marketing, communications and business development firm, CF Creative, Conchie is bicultural and services both Latino- and non-Latino-owned compa-nies. At a young age, her father told her you know you can be successful “if you sweat and you smile.” That is Conchie’s formula of success—giving her best and working hard. Having grown up in the Dominican Republic, she moved to Miami as an adult because she had a longstanding professional network in the region. She always knew she wanted to come to the United States. “I was born with American DNA in my soul, if not my blood [...] How could you not want to be part of the youngest country in our hemisphere which is by far the most advanced? It seemed that life
was too short to live outside of that momentum and I needed to be a part of that,” she states.
Being named the number one marketing and communications agency in the U.S. last year by the U.S. Department of Commerce has generated much interest and business. Had she not learned to expand her business through the SLEI-Ed scaling program, Conchie indicates “we wouldn’t have been able to handle the workload we have now.” She has exciting business ventures with Microsoft with small teams in Colombia and Costa Rica and is developing opportunities in Asia. When it comes to managing employees abroad, Conchie does so with “constant contact, a lot of love and living wages.”
“Funding, funding, funding, funding, funding, funding without giving your soul to the devil,” Conchie describes as her big-gest hurdle. Cash flow has always been a challenge and she has considered taking equity from a partner. “It’s something we haven’t done and haven’t really had to do but it’s something that’s always top of mind when we think about expand-ing further.” When it comes to her current financing, Conchie has used savings and working capital to be self-sustain-able. In Miami, 16 percent of Latino-owned businesses use personal savings, family and friends to grow their business, which is among the most popular source for growth capital. She adds, “perhaps that’s why growth has been a little more sluggish, but it’s kept us out of debt and it’s still allowed us to do business with very large clients.” When asked about why she has financed her company in this way, she indicates “we didn’t know any better and we don’t like debt unless there is a deep reason to do that.” Her debt aversion is rationalized by her desire to be predictive about income and overhead costs. “We’re not comfortable getting into debt unless we are sure it’s something that we can offset relatively quickly.” Furthermore, her business is making enough to cover operations and does not need to take on debt.
The environment in South Florida, especially Miami, has been very welcoming for Conchie. As an immigrant, this wel-coming environment may be partly attributed to the high percent of immigrant entrepreneurs in the area, making up 52 percent of the Latino business ecosystem. “You have access to the headquarters of most of the corporations in the world who face Latin America.” She does indicate it is a smaller community than one may think because she still knows people professionally whom she met when she was working for HP in the Dominican Republic and Puerto Rico. Further-more, she finds the business community to be very collaborative and helpful in making introductions, and the media is accessible. Lastly, the climate makes it easy to attract clients and employees with warm temperatures year-round.
JOEL SANCHEZPresident | Premier Cleaning Services | Janitorial Services | Dallas, TX
Headquartered in Dallas, Joel has offices in over 12 U.S. cities: in Mexico, where his wife is from; and El Salvador, his home country. Employing over 3,000 people and generating $28 million in annual revenue, Joel’s cleaning and staffing company has experienced wild success, growing in revenue by $5 million every year in recent years. In the Dallas region, four percent of Latino-owned businesses have grown to scale, compared to three percent for the national average. Joel knew he wanted to be a business owner, always looking “for something else, but not just being an employee.” He had experience with multi-level companies like Herbalife and Amway, which he credits as giving him the motivation to start his own business and be suc-cessful. He tried earlier to start his own company but says his English was not very good and
as a result, he did not pass the licensing exams in his state, failing three times. When his wife became pregnant, they worked at the same company. She quit to spend time with their newborn and became a subcontractor. Eventually, Joel quit his job and became more involved in the operations and built a business.
His operations became global because his wife wanted to help her family in Mexico. This family operation in Mexico has not been without issues, as he describes, “It’s because when you work with family, it’s extremely different, you don’t want to hurt them, and they don’t respect you as a boss [...] and that breaks the chain of command, the culture.” His mentor from the SLEI-Ed program has helped him work out his operations in Mexico and now “it’s back on track, the way it should be.” His operations in El Salvador started because of a business opportunity, but an added benefit is that he is able to help family there.

41
Case studies
Joel has had to contend with many external regulations impacting the growth of his business. He finds that “the political matters affect you directly, not just to your revenues, not just to yourselves, the people that you work with, but the entire business system.” Specifically, even though he is an e-verified company and they try to get workers with proper documentation required by the U.S. for work, Joel indicates that the clients and business dealings are suffering. “Fifty percent of the meeting [with the clients] is about human resources, it’s about I9’s. Then we just talk fifty-percent of the conversation about how we can grow the business, how we can do better in this type of service, how we can start this new contract.” In addition to immigration issues, Joel indicates his company has been impacted by health care and minimum wage laws. Specifically, with temporary workers, it has been a challenge to provide health care for all of his employees although he agrees that they should have health care. For changes in minimum wage laws across states, Joel describes the challenge of negotiating a new rate with his clients in anticipation of the minimum wage changes, which upset his clients. He tells them it is not his doing, “it is a political matter and it can have an effect in our relation-ship with the customer.”
Being headquartered in Dallas for Joel was a no-brainer. He immigrated to Dallas and his dad and brother live there. He contends you can get a lot of land for not too much money and “Texas is very friendly in taxes, more than Arizona.” In fact, land prices in Dallas are moderately priced in the $250-$300 thousand per acre range.64 The highest metropolitan land value is found in New York metro area with $5.3 million per acre. The LA metro averages $2.7 million per acre and Chicago is at about $663 thousand per acre. The lowest values are found in small cities averaging $50 thousand per acre (Ibid). Since Joel has offices in several cities in the U.S., Joel claims, “we have had invitations to move corporate from here to California or Phoenix, but we decided not to move.” He recalls the Texas economy helping him get through the recession:
I remember those days in 2008, 2009, we got a big hit in Phoenix. We got hit big in Colorado, but Texas stayed stable. Our business went down from 100 percent to 30 percent, we were packing up everything and came back to Texas. Texas gave us the opportunity to stabilize our business because the economy was not as bad as those other states.
Joel’s only son just started college and he is not all that interested in the family business. Having met a lawyer through the SLEI-Ed program, Joel is now in preparation for succession planning. When asked about having business mentors before the SLEI-Ed program, Joel describes, “Yes, but they didn’t know because I never asked questions to them. I just paid attention to them, [what they did], when they talked, the way they made decisions. But they never knew they were my mentor.”
On financing, Joel indicates that as he keeps growing, “no matter how much money you put into it, the money is disap-pearing.” Joel made another connection in the SLEI-Ed program to get some financing to grow his business. In particular, he wants to diversify and venture into chemical supply. He spends a lot of money every month on supplies, so he wants to start his private label. To start his company, he shares that he didn’t really need a lot of money. “We were sufficient to invest in our growing. Instead of spending the profit, we recycled the money in the business.” He has a line of credit from a local bank that helps with payroll and has a good, working relationship with this small bank. As he notes, “they’re very accessible, more personal, something that I can trust.” On equity funding, Joel indicates he does not understand how it works. Joel’s concluding advice is around the importance of the people in one’s organization. He creates reward pro-grams, employee of the month, and certificates of appreciation, for example, because he wants loyal people by his side.
PETER MENDOZACo-founder and Vice President of Outside Operations | High-light Electric, Inc. | Construction and Engineering | Riverside, CA
“Let’s just say that the [entrepreneurship] bug bit my family and my siblings at a very early age.” Peter grew up watching his father, an electrician by grade, start his own company. Today, Peter and his brother have started a similar service company that provides infrastructure improve-ments in the electrical industry for the State of California. Interestingly enough, two of his other siblings are in the same industry and started a similar company at a smaller scale. Although he does not consider them competitors, they happen to be. For Peter, most of his clients are municipal, state, county, or federal governments.
Having weathered a lot of fluctuations in material pricing due to the series of natural disasters impacting the oil refineries his business relies on, his business is now covering the loses after
picking up two major projects. When recounting additional challenges, Peter describes,
One of the biggest growth challenges that we have right now is talent or workforce with the industry [...] With all the mega projects that are going out, not only locally but internationally, it has drawn a lot of the workforce away from the growth that we would like to experience in a more controlled environment. The workforce is not as abundant as it usually is.
64 Albouy, D., Ehrlich, G., & Shin, M. (2017). Metropolitan Land Values. NBER Working Paper.

42
Case studies
Peter went on to describe the competition for talent in this industry, which is poached through incentives and signing bonuses. As one example, he describes one of his employees who was offered a low six figure signing bonus, the equivalent of one year’s pay. In Riverside, Latino entrepreneurs report competition as a top challenge, which aligns to Peter’s experience.
Peter’s company has been working with municipalities for over 40 years. Even though there is extensive paperwork and regulations, he has learned how to navigate the documentation and redundancy, and understand the different departments. For others starting out, or venturing from one agency to another, it takes time to adjust to these requirements. Beyond the years of experience, Peter stays abreast of the changes through the associations to which he belongs. He describes, “it allows us to address some of the issues that the industry has or is experiencing, as well as be able to have an initial look at some of the changes that may be coming down through these different agencies with the relationship that these associa-tions may have with them.” Peter recounts getting the bulletins and emails through these membership lists.
Originally located in Santa Anna, Peter selected Riverside for his headquarters due to cheaper land prices. Additionally, Peter contends that Riverside was still open to idea of having contractors within their limits whereas other cities and counties are not too favorable for construction contractors. That is, they provide setbacks or land restrictions for how much equipment and material you can have on the ground and not covered or inside a building.
Peter has self-financed the company through savings and credit cards. He has been most frustrated by the way in which the lenders handle his industry as he describes:
Because of the historical nature of construction in itself and with most popular banks or commercial banks identifying construction as residential or commercial. The area that we perform our work under is not identified by these institutions as something that is sustainable because of the lack of industry information out there.
In Riverside, only one percent of Latino-owned businesses use banks of any kind, which is among the lowest for the metro areas. He further describes the role of collateral in commercial and residential projects where the property itself is collateralized. For Peter’s line of work with government contracts, he feels at a disadvantage. “They tend to lend more to those sectors of the industry in construction than they do to the person who is either widening the street, or improving the local streets, or even adding a runway to the airport.”
In describing his family background, Peter shares that his father has been the guiding light of the work that he does. With only a sixth-grade education, his father started in this line of work and was doing big projects before he was 18 years old. In addition to his siblings who have construction businesses, his other siblings have professional careers as a lawyer and an ER doctor. Although Peter was born in Mexico, his parents were having a summer vacation when he decided to “pop out” and he was brought back over to the U.S. at two months old.
MARIA CARRILLOOwner | Carrillo and Sons Collision Center | Automotive Services | San Diego, CA
Maria and her ex-husband started an auto collision center nearly 40 years ago. When they first opened the shop, Maria would work on the cars, take them apart, and sand them. She has since remarried and runs the shop with her three sons who grew up in the shop. Currently short a few workers, Maria is covering work in several departments including the front office. When asked how things are going in the business, Maria describes, “It’s a very scary, vulnerable time in my business.” They recently lost a technician due to a long commute and she laments the general state of the industry:
The lack of technicians that we have in our industry, it’s really dwindling down to where we have people that are in their late 40s and 50s and those are our top techs and we’re not growing a lot
of new ones. That’s our industry and the mechanical industry—we’re in [both]. We’re freaking out because we’re not growing new people.
She recalls once having six high schools in San Diego that used to offer automotive programs. Now there are only two. “Everything is just so automated that the interest isn’t there and the kids are pushed to go to college which is a great thing but technical school, there’s not that much availability.”
In addition to the lack of skilled-trades workers, Maria describes the “large multiple shop operators,” like Walmart, com-ing into town which also impacts her small business. A few years ago, she was approached by one of these larger shops and they offered to buy her out. She said, “No, this is my business, my family.” They advised her to sell; otherwise she was going to be put out of business.
Given these challenging times, Maria says she sometimes doubts and questions herself. She wonders, “Am I doing the right thing for my sons?” She tells them they do not have to be there, and she leaves the door open for them to do other types of work. Bearing her heart out, Maria shares, “It scares the hell out of me—if I made a wrong decision to what I really feel in my gut is the right thing to do. It scares me to think that I hurt my family by keeping it open, keeping it alive.” However, she says she will not give up. Her sons keep her going. She feels she can differentiate her shop from the Walmarts coming in because she is family owned and people still look for that. She wants her business to be a

43
Case studies
“boutique shop”—a unique value proposition relative to the “convenience of the big stuff.” She describes still going to her local hardware store although there is a Home Depot and Lowe’s down the street because she likes that it is “more personal.” For Maria, her own business is personal.
Maria came across some hard times after her divorce, amassing debt that she did not realize she had. Like all other business owners interviewed, she started the company by self-financing. Most recently, however, she heard of an online lending platform, Kabbage, where she was able to obtain a $50,000 loan at one percent interest. She describes, “They can log into your bank account and they see your sales and deposits and all that and it’s the easiest thing I’ve ever done as far as getting money from anywhere else but myself.” Like many others, she is most frustrated by the extensive paperwork that is required to secure funding.
Being a woman-owned business in a male dominated industry has not been without its challenges. Maria describes her business as one of four woman-owned centers in San Diego. She has found good friends and mentors in a national organization of women in collision repair services. Maria also notes that some opportunities are provided to her because her business is woman-owned, “they really like that [I am woman-owned], more so than being Latina.”
Unscaled Firms
WILLIAM DIAZ, JRPresident & CEO | ESC Cabling, Inc. | Construction | Bronx, NY
William started ESC Cabling, Inc. in 2002 when he was in his twenties with bootstrapped financing from savings and family. He chose to locate his business in the Bronx, as according to William, “I’m a Bronx guy. I’m from the Bronx.” ESC Cabling is a low-voltage cable company that installs the conduits and wires behind walls and in ceilings, such as electrical wiring, fiber optics, and cables that carry digital information. ESC Cabling is expected to scale by 2019 to which William credits his continuous learning, practice of strategic financial and business prac-tices, and development of a team that is technically qualified and nimble. William gives back to the community by teaching at LaGuardia Community College and serves on the advisory committee for C Tech, a certification program for technicians in the network cabling industry.
While ESC Cabling is currently poised to scale, the company experienced many of the financial and cash flow challenges that limit the growth of small businesses. Financing is a top challenge for Latino business owners in this region. William initially had trouble obtaining loans from large commercial banks and “time and time again” avoided investing the effort to complete a complex loan application. He had learned from experience that the bank would likely deny his application. Instead, he turned to family members before establishing himself with a micro lender and a Community Development Financial Institution (CDFI).
Cash flow was particularly bleak after the Great Recession as construction projects that were fully financed prior to the recession were completed. At that point, William participated in the Goldman Sachs 10,000 Small Businesses program, which whetted his appetite for continuous learning. He started to see the importance of financial analysis, marketing and branding, sales, and industry specific competencies. He subsequently participated in Columbia University’s Construction Trade Management Certificate/Mentorship Program, a course in bonding, and the Small Business Adminis-tration’s Emerging Leaders Initiative. Each course reinforced what he was learning about how to run his business more strategically. As a result, he made it a priority to create a credit history for ESC Cabling, thus separating his personal and business finances.
Early in William’s career, he worked for an employer who did not invest in professional development for his team, and both the employees and clients suffered. Having learned the cost of an inadequately trained staff, William now partners with a local community college to create apprenticeships and mentoring opportunities for students who become a talent pool for ESC Cabling. In addition, he is considering membership in trade unions that would give him access to experienced technicians. The combination of developing talent and relying on experienced employees keeps his teams nimble enough to respond to a range of project opportunities.

44
Case studies
FABIOLA JAQUE-DIAZPresident & CEO | California Testing & Inspections | Engineering Services and Testing Laboratory | Los Angeles, CA
Fabiola opened California Testing & Inspections in 2008 during the Great Recession. After several difficult years, the company is now growing and becoming more stable due to a focus on quality control, customer service, and maintaining good jobs for the company’s employees. California Testing & Inspections provides site exploration, materials testing, field inspections, and quality assurance and quality control for a variety of construction projects. The company works with public agencies, school districts, private companies, general contractors, and “any-body building any challenging project,” according to Fabiola. The company has a location in Los Angeles County and another in San Diego County.
A competitive advantage for California Testing & Inspections is that Fabiola and any of the company’s staff engineers are able to serve customers with excellent technical and personalized services. The company is able to retain a strong team by offering professional development and making a concerted effort to keep staff fully employed. Location is another growth strategy for the company. By choosing to stay local in Los Angeles, it is easier for the company to engage local transportation and building projects. The company is applying the strategy to expand its San Diego footprint. In five years, Fabiola expects California Testing & Inspections to be the “go-to-company” for construction inspection and related testing services.
The biggest challenges the company faces include access to capital and developing a back office that supports the growth of the company. After obtaining nearly half of the company’s startup capital through a Small Business Adminis-tration 7(a) loan, Fabiola had to rely on personal loans and she says, “I still don’t even have a line of credit on my busi-ness.” She has considered equity financing but feels that it is not the right option at this time. Despite having spent a significant amount of time learning about various ways to obtain capital through the company, she does not see another viable source of capital except for personal loans.
As the company grows and Fabiola continues to build business competencies, she realizes that finding and retaining engineering talent is not her biggest staffing challenge. Fabiola knows a network of experienced technicians and is able and willing to train less experienced engineers. The challenge lies in finding qualified business support services such as accounting and human resources, which becomes increasingly important to keep up with the growth of the company.
DAVID SANCHEZPresident & CEO | 10 Management, Inc. | Arts, Entertainment, and Recreation | Chicago, IL
10 Management is an integrated talent management firm representing models, hair and make-up artists, photographers, and most recently social media influencers and non-union actors. 10 Management has two lines of business, “both are mutually exclusive and mutually import-ant for each other.” The firm represents models and provides businesses, such as production studios and casting agencies, with integrated teams of models, artists, and photographers. The firm’s value proposition is why clients hire 10 Management—they hire one company and get all their talent needs.
The firm is currently on track to make $850,000 this year and wants to grow to $3 million by 2020. Only seven percent of Latino-owned businesses in Chicago fall within this revenue
range. Growth strategies include signing more talent and clients and expanding their market reach beyond the Mid-western states. David thinks meeting his growth goals successfully includes hiring and retaining the right people. That includes employees knowing how they fit into and will contribute to goals in the company’s growth plan. For this reason, David reviews the company’s growth plan with staff.
Two types of challenges 10 Management faces are regulations and obtaining capital through national commercial banks. David thinks Illinois has burdensome small business regulations such as high worker’s compensation require-ments, taxes, license and permit fees, and insurance requirements. He is working with the Mayor’s Office in Chicago to understand the impact these regulations have on small businesses. Like most small businesses, David struggles to obtain bank financing. He initially tried to establish a line of credit with a national commercial bank with no success. Eventually he developed a relationship with a community bank and was able to obtain a line of credit. There is a greater tendency overall for Latino-owned businesses to use local banks, but Chicago-based Latino entrepreneurs demonstrate an even greater propensity, where 10 percent have such relationships.
David started the company in 2013 with savings he accumulated while working as a model. He is now a different type of model—a role model for disadvantaged youth and Latino business owners. David and his brother were the first in his family to graduate from college and David now teaches entrepreneurship at Columbia College. He says, “I’m making the life that I want through entrepreneurship and I don’t know a lot of other fellow Latino-owned businesses. So I think it shows you how few we are.” David also identifies as gay and notes that the number of “queer CEOs” is even smaller. On a recent panel, David was speaking to underprivileged adolescents and teenagers, and realized the importance of being visible and vocal so that youth can see how people overcome challenges to get to success.

45
Case studies
TONY BATISTAPresident & CEO | Floors2Luv, LLC | Construction | Houston, TX
Tony describes Floors2Luv as a flooring company that takes care of anything that is “inside and if you step on it, that’s our business.” The company’s ideal customer is a homeowner or property owner who wants to invest in improvements. Floors2Luv has been growing annually against competition from big box stores to sole proprietors who install flooring. Tony targets revenue growth to at least $2,000,000 by 2020. He attributes the growth of his business to his knowledge of financing and to having implemented good business practices from the time he opened Floors2Luv.
Tony has established several important systems in his business that help keep it growing. He has a “lieutenant” to manage the sales side and another to manage the operations side. From
the time he opened Floors2Luv, he has had an employee looking after accounts receivable and ensuring that they are collected on time. With such detail to cash flow and operating expenses, Tony has not had “to borrow money for any reason.” His frustration with accessing capital came in the form of wanting to refinance the mortgage on the building from which he operates his business. Several banks denied the refinance, including large commercial banks. He was eventually successful in developing a relationship with a small bank that refinanced his building.
Tony acknowledges that if Floors2Luv were be become a certified business with the City of Houston and received a contract(s) to renovate the floors of an entire building, he would be constrained by capital. In order to take advantage of such opportunities, he would be compelled to apply for a loan. However, he believes that his finances and financial documents are in order and he would be ready to apply for a loan when needed.
Tony describes himself as fortunate to have learned important business practices on the job working for large com-panies and to have a wife who has expertise in financing. He has sought and taken advice from SCORE and programs such as the Emerging Leaders Initiative and the Goldman Sachs 10,000 Small Businesses program. From experiencing business success, Tony feels compelled to help other Latino business owners through mentoring. What he sees as the “top challenge” for Latino business owners is not the ability to accumulate startup funds, but the financial knowledge and know-how needed to manage cash flow and capital to run the business well.
DAVID GRIEGOPresident | Big Lake Software, LLC | Professional, Scientific, and Technical Services | Phoenix, AZ
Big Lake Software is a boutique software development firm that specializes in the open source Linux operating system. David embodies the open-source software philosophy of providing clients with transparency and active participation in the development of their products. David self-financed the company in 2012 when a member in his professional network in Silicon Valley contracted with him for software development. As Big Lake Software successfully delivered projects, word of mouth referrals became new clients. The company primarily operates out of Phoenix and has major clients in the California Bay Area and Oklahoma City.
Regarding challenges to growing his business, David has addressed the need for operating cap-ital and is still working on developing a fuller sales funnel. David started banking with a national
commercial bank, but paid costly fees and was unable to obtain a line of credit. Less than one percent of Latino-owned businesses use national banks to grow their business in Phoenix. He eventually established a relationship with a bank operating in the Midwest and Southwest that has a focus on mid-market businesses. He obtained a line of credit that he uses to pay new staff and subcontractors at the start of a new project. As new projects start yielding earned revenue, he pays off the line of credit. This process allows him to take on additional contracts.
David’s second challenge is maintaining the sales funnel for Big Lake Software. He realizes that he and his “number two” both want to work on programming, but he needs to turn more of his focus to the sales funnel. David says, “No, we don’t have a full sales funnel. …We dedicate ourselves to the technical portion of the business, which has left this large gap in the business, which is the market and sales portions. …If I’m doing the business and he’s doing the technical, it’s a per-fect match.” David’s goal is to grow Big Lake Software to a $3 to $4 million dollar company in five years by his focusing on sales and new markets.
David also talked about the isolation of being a business owner, where friends, family, and employees don’t fully un-derstand the burdens and responsibilities of being a business owner. While David does not have a business mentor, he seeks out trusted friends and peers who are willing to give him the “advice you don’t want to hear.” He also takes advan-tage of programs and resources through the SBA and through companies that contract with Big Lake Software. David admits that earlier in his career, he had been “woefully ignorant” of programs that support disadvantaged small business owners. For example, the Silicon Valley contact who awarded Big Lake Software its first contracts ran a program that offered qualified minority-owned businesses a faster invoice payment schedule. David suggests that many other Latino business owners may not be aware of support programs and resources.

46
BEST PRACTICES FOR SCALING
The case studies of scaled and unscaled businesses demonstrate the importance of continued and improved programming to support the growth and development of Latino-owned businesses. More specifically, the Latino business owners discussed ways to buffer against the challenges they faced, including engaging mentors; participating in business organizations; managing finances, particularly cash flow; nurturing employees; and implementing sound business systems. Participating in trade associations and Hispanic chambers of commerce can yield information on new business oppor-tunities, and they can also be sources of support. Owners of scaled businesses, Maria in particular, found comfort in a national organization for women in collision repair, as being a woman-owned business in a male-dominated industry can be a solitary journey. While the scaled firms have formal business mentors through the SLEI-Ed program, for example, there is an immense need to have more structured business mentorship programs. Joel describes having “mentors” who do not know they are his mentors. Rather than serving a mentorship role, the “mentors” Joel describes serve more as role-models. He recounts observing them from afar and not asking them questions. While role-models and aspirational business leaders can serve a motivating purpose, mentorship requires engaged, purposeful, and sustained interaction that serves a more practical role. Mentors can help troubleshoot or plan for the future. Oftentimes, the mentorship relationship provides mutually constitutive benefits for all parties involved.
Among the unscaled firms, participating in capacity building programs, such as the StreetWise ‘MBA’™, Emerging Leaders Initiative, and Goldman Sachs 10,000 Small Businesses can serve as a source of business knowledge and mentors. While most of the unscaled business owners do not have formal mentors, they tend to rely on networks of fellow entrepreneurs, family members, and friends who act as mentors providing subject matter expertise, advice, or moral support. There is a need for more structured capacity building programs and mentorship programs for business owners of unscaled firms as there is for those with scaled firms.
Regionally, local communities can foster the growth and development of Latino-owned businesses by ensuring a dense network of support for owners of scaled businesses. Miami, for instance, serves as a hub with a high Latino entrepreneurship score and was touted as having dense and longstanding business networks available to Latino business owners. In other regions, Latino entrepreneurs discussed having to navigate city permits and regulations on their journey to be-coming scaled firms. Municipalities and local governments can work closer with Latino business owners to ensure that these processes are transparent and fair.
5
47
Best practices for scaling
The importance of external funding has been stated throughout this report for scaled and un-scaled businesses. Expanding access to capital and information about the different types of capi-tal available—both debt and equity—are key in supporting the growth of Latino-owned businesses to scale. Among the scaled firms, business owners demonstrated a firm understanding of their business operations and the conditions in which external sources of financing would be sought. Conchie, for instance, indicated that her business is making enough to cover operations and does not need to take on debt. Still, she is aware of the possibilities that would be afforded with an equi-ty partner and although they have not been in a position to need this type of funding, it is “always top of mind.”
Among the business owners with unscaled firms, capital was also a matter that they dealt with regularly. David S. and David G. utilize lines of credit to manage cash flow and to support servicing a new client or contract, while Fabiola uses personal loans. Tony monitors his company’s cash flow vigilantly to avoid the need for a line of credit or loan. William takes steps to build a credit his-tory for his company, thus reducing the need for him to rely on his personal credit history. All would need an infusion of capital if they wanted to grow quickly to take advantage of an opportunity. Both scaled and unscaled business owners have more success working with smaller banks than with national commercial banks. Regional banks, community banks, credit unions, and CDFIs are more likely to approve lines of credit and loans, and it is therefore worth the business owner’s effort to develop relationships at such financial institutions. As Joel recounts of his relationship with his small bank, “it’s nice, they actually pay attention to your needs. You don’t really need to wait too much to talk to the decision maker.” Findings from the Fed’s 2017 SBCS support this empirical pat-tern of small banks being more likely to approve credit applications from small business owners.
Many of the entrepreneurs with scaled businesses credited their growth and success to their employees, and discussed strategies to retain employees. For Joel, this included implementing re-wards programs, and Conchie ensures she provides constant communication with remote teams and provides living wages. Moreover, getting ahead of the changes facing skilled-trades industries with automation and worker shortages will be essential for future success. This includes coaching and guiding business leaders to communicate the unique value-add proposition of their business in a constantly changing environment.
Likewise, the owners of the unscaled firms see the importance of investing in professional devel-opment for employees, providing agency for employees to do their jobs, mentoring fellow business owners, and being a role model to the community. Fabiola, Tony, and David S. identified business systems as important components of scaling a business. Fabiola focuses on back office systems such as accounting and human resources. Tony identifies his “lieutenants” of sales and operations as critical to the success of his company since it opened for business. David S. reviews his growth plan with employees so they can better understand how their work helps in reaching growth goals. David S. also has regular staff meetings to manage weekly goals. It is likely that owners of scaled firms have learned the importance of sound business systems and of delegating work and responsibility to employees. Owners of unscaled businesses must embrace and implement these practices if they want to increase the probability of scaling.

48
KEY FINDINGS AND FUTURE RESEARCH
65 Aspen Institute. Latinos & Society Program. 2017.
The growing share of Latino-owned businesses and their outsized role in job creation under-score the importance of these businesses to the U.S. economy. This report examined their key needs and challenges through three lenses: national comparisons, MSA-level data, and interviews with individual business owners. These analyses enabled both broad looks and deep dives into Latino-owned businesses, resulting in several key findings and opportunities for future research.
Factors contributing to credit risk were a recurring theme for many Latino-owned businesses. Many relied on personal savings and/or loans from family and friends to start their business. Among businesses that use external financing, Latino-owned businesses tend to use products that require less collateral and often have higher average interest rates. These financing realities can have long-term implications, since using personal funds or costly products may negatively impact the owner’s personal credit and can impede the business from scaling. Moreover, Latino business owners are much more likely to report lower credit scores than white business owners, which likely affects their ability to access affordable capital.
Latino business owners also experience various challenges to starting, growing, and/or man-aging their business. They face operating expense and credit availability issues at higher rates than white-owned businesses, and these challenges seem to persist even once a Latino-owned business has scaled. Scaled firms are also facing talent shortages, and are considering ways to develop talent and create unique value propositions.
Despite challenges in accessing credit, Latino business owners report being more successful when they work with local banks or other smaller lending institutions. These lenders are more likely to offer them opportunities to develop personal relationships and get customized advice.
The analysis presented here points to several clear opportunities for Latino-owned businesses and those that serve them:
� First, there is clear demand for expanded micro-lending, including products that help firms to manage operating expenses.
� Second, there is also a strong need for products that assist firms in building credit reputations and in improving credit scores.
Our analysis also points to additional opportunities for Latino business development. Currently, a majority of Latino-owned firms sell to individuals and a large proportion sell to other businesses. Yet, only a minority of Latino-owned firms is engaged in government procurement. Whether through access to improved information or incentivizing sub-contracting opportunities,65 there is a clear opportunity for Latino-owned businesses to diversify and expand sales through corporate and government procurement channels.
6

49
Key findings and future research
Finally, Latino-owned businesses repeatedly underscored the importance of building networks for mentoring and for expanding business opportunities, particularly in MSAs where business networks are relatively weak. As evidenced in the case studies, sustained business networks and successful mentors can support Latino business owners in defining goals and developing business strategies. Strong networks can also provide business referrals, or direct connections to customers and clients. The case studies also reveal the importance of formal programs that foster these relationships.
Future ResearchThe trends analyzed in this report and the experiences of the entrepreneurs in the different MSAs point to the need for continued research on this growing segment of businesses. Several areas warrant additional research and resources: access to capital, capacity building and mentorship programs, and equitable ecosystems that support Latino-owned businesses.
1) Access to Capital and Finance KnowledgeThere is notable evidence that Latino-owned businesses face more acute challenges than white-owned businesses when it comes to accessing capital. Future research focusing on why Latino business owners are not accessing the range of financial products they need to grow their busi-nesses would be helpful to catalyze specific policy and programmatic actions. Causes of this difference may lie in systemic barriers within the banking system or within attitudes of Latino business owners toward debt, risk, and previous financing experiences.
Additional research may explore means to:
� Raise awareness about the size of the business opportunity stemming from Latino-owned businesses’ capital needs. Estimate the long-term impacts to business growth, personal wealth, and the U.S. economy attributable to Latino-owned businesses’ improved access to credit.
� Expand relationship banking and lending opportunities from small banks to unscaled, scaling, and scaled Latino-owned businesses.
� Incentivize large banks to provide more lending opportunities and appropriately sized loan products, including partnerships with fintech providers.
� Increase business owner awareness of alternative lenders, such as CDFIs, nonprofit lenders, and venture capital funds that are focused on providing financial services to communities under-served by conventional banks. Nonprofit lenders, such as Mission Asset Fund, provide business and personal financial services to marginalized communities. Venture capital funds, such as Kapor Capital, provide startup investments to increase diversity in technology-driven companies by providing access for low-income communities and for entrepreneurs of color.
� Measure the impact of fintech lending on Latino-owned business growth.

50
Key findings and future research
2) Formal Mentorship and Capacity Building ProgramsLatino business owners cited a need for programs offering formal mentorship and capacity build-ing that provide more awareness of and training in business strategy and financial understanding.
For example, the peer mentoring component of Interise’s StreetWise ‘MBA’™ helps business owners maintain accountability to themselves and to others in their mentoring group. Impact data from the StreetWise ‘MBA’™ show that the combination of capacity building and peer-based accountability leads to lasting behavioral changes; business owners are more focused on busi-ness strategy rather than day-to-day operations.
In addition to being paired with a successful business mentor, participants in the SLEI-Ed scaling program organize into regional alumni groups and gather for networking events. The mantra of the program is to “do business with each other, get business for each other,” and these sustained business networks from across the country provide continual opportunities for direct business relations or referrals. Indeed, data from a recent alumni survey indicate that at least half of partici-pants have already engaged with each other to forge a business relationship directly or facilitate it with others.
Anchor institutions (e.g., universities and colleges), nonprofits, government entities, corporations, and philanthropy have shared roles to play in supporting and scaling mentor and executive educa-tion programs. Procurement can be an effective way for small businesses to grow. Anchor institu-tions and corporations have a role in supporting this through systematically increasing diversity in their supply chains. Interise is currently piloting a participatory action research project involving disadvantaged business enterprises (DBE), anchor institutions and corporations, capital providers, and capacity builders to identify the blockages to creating more mutually beneficial procurement opportunities for DBEs. The stakeholders work collectively to identify blockages in the system and each stakeholder commits to making changes within their policies and processes to mitigate the blockage. In this way, the blockages become leverage points to change the procurement system.
Philanthropy has a distinct opportunity to expand its funding of mentoring and capacity building programs for Latino business owners. According to the Latino Community Foundation, less than 1.3 percent of annual philanthropic dollars are supporting Latino-based organizations.66 One area where philanthropy can focus with immediate benefit is in funding programs for Latino-owned microbusinesses. The emphasis of this report was on scaled and unscaled Latino-owned busi-nesses that are established, employer businesses, which combined account for about ten percent of Latino-owned businesses. The remaining 90 percent are microbusinesses with annual revenues of less than $100,000. Research is needed to better understand and prioritize the challenges and needs of these businesses to become sustainable and consider strategies for scaling.
66 Latino Community Foundation. (2018). Blog “Latinos are not getting a share of the Philanthropic Pie,” https://latinocf.org/289-2/.

51
Key findings and future research
Additional research can shed light on the availability of capacity building programs and their utility to Latino business owners. Research areas include:
� Uncovering the sources of business and financial information that Latino entrepreneurs turn to when there is a dearth of mentorship and capacity building resources.
� Detailing the innovative and conventional best practices to providing mentoring and capacity building programs.
� Establishing the business knowledge and practices that Latino business owners need at different stages of business growth.
� Focusing on the mentorship and capacity building needs of microenterprises (those businesses generating less than $100,000 in annual revenue), which make up 90% of Latino-owned businesses.
� Expanding our understanding of how scaled Latino-owned businesses can influence the increased growth of unscaled firms by understanding the growth factors and barriers to growth of scaled companies.
3) Innovative and Equitable Ecosystems to Support Scaling and GrowthThere is a need for business ecosystems and networks that support entrepreneurs in all stages of business growth. Local economic development leaders are implementing innovative programs that support equitable ecosystems for small businesses.
Examples of these programs67 include New York City’s Contract Financing Loan Fund, which is a revolving loan fund for minority- and women-owned businesses, and the Bond Collateral Assis-tance Fund that provides collateral assistance for obtaining surety bonds required for construction projects. City Accelerator is a joint initiative between Living Cities and the Citi Foundation that provides city leaders with coaching, technical assistance, and grant funding to develop and imple-ment strategies for increasing diversity in vender and contractor pools. Member cities in the 2017 City Accelerator cohort are Charlotte, Chicago, Los Angeles, Memphis, and Milwaukee. In Boston, Eastern Bank and the Greater Boston Chamber of Commerce forged the Business Equity Initiative, which provides capacity building for black- and Latino-owned businesses—the two demographic groups with the greatest wealth disparity in Boston.
Future research can include a comprehensive scan of these programs, documenting their features, impact, and lessons learned for replicability and scalability. Aspects of these ecosystems that would benefit from additional research include:
� Identifying and addressing the business ecosystem factors that lead to most of the ten MSAs with the largest Latino populations not having commensurate shares of Latino-owned businesses.
� Uncovering the local, ecosystem-level factors (e.g., access to local business networks, access to markets, costs of doing business) that contribute most significantly to a supportive business environment for Latino business owners.
67 Lee, Nancy S. (2018). Bridging the Wealth Gap Small Business Growth. The United States Conference of Mayors.

52
APPENDICES
68 For more information on partnerships, please visit https://www.fedsmallbusiness.org/partnership.
Appendix A: Survey Methodologies
Federal Reserve Banks’ Small Business Credit Survey (SBCS)The SBCS is an annual survey of firms with fewer than 500 employees. Respondents are asked to report information about their business performance, financing needs and choices, and borrowing experiences. In this report, survey data are confined to small employer firms (firms with one to 499 employees), and compare Latino-owned small employer firms (“Latino-owned businesses”) to white-owned small employer firms (“white-owned businesses”). The SBCS classifies a firm as “Latino-owned” if more than 50 percent of the business is owned by a person/persons who is/are Hispanic, regardless of race. It classifies a firm as “white-owned” if at least half of the business is owned by a person/persons who is/are non-Hispanic white.
Data CollectionThe SBCS uses a convenience sample of establishments. Businesses are contacted by email through a diverse set of organizations that serve the small business community.68 Prior SBCS participants and small businesses on publicly available email lists are also contacted directly by the Federal Reserve Banks. The survey instrument is an online questionnaire that typically takes six to 12 minutes to complete, depending upon the intensity of a firm’s search for financing. The questionnaire uses question branching and flows based upon responses to survey questions. Therefore, the number of observations for each question varies by how many firms receive and complete a particular question.
WeightingA sample for the SBCS is not selected randomly; thus, the SBCS may be subject to biases not present with surveys that do select firms randomly. To control for potential biases, the sample data are weighted so the weighted distribution of firms in the SBCS matches the distribution of the small firm (one to 499 employees) population in the U.S. by number of employees, age, industry, geographic location (census division and urban/rural location), gender of owner(s), and race/eth-nicity of owner(s). For detailed information on the weighting framework and process, please see the Methodology section of the 2017 Small Business Credit Survey Report on Employer Firms (https://www.fedsmallbusiness.org/survey/2018/report-on-employer-firms).
7

53
Appendices
SLEI Survey of U.S. Latino Business OwnersSince 2015, the Stanford Latino Entrepreneurship Initiative has collected national survey data on Latino-owned businesses across the country and Puerto Rico on a yearly basis. To be considered for the survey, respondents must answer affirmative to 1) are you a business owner and 2) are you of Latino or Hispanic origin (if yes, they simultaneously specify country/ancestry); otherwise, they are screened out from survey completion. These two parameters present an expansive view of business ownership in that they also consider self-employed individuals and those whose busi-ness ownership may not be the primary means of livelihood. Respondents are sampled through proprietary business panels and internal outreach efforts.
About the 2017 SLEI SurveyThe 2017 SLEI Survey of U.S. Latino Business Owners was administered online through a Qualtrics proprietary business panel. An additional five percent of responses were collected through internal outreach efforts, such as Hispanic chambers of commerce, social media, or previous survey respondents, yielding a total sample of 5,026 respondents. Data were weighted using population target estimates as designated by the Census Survey of Business Owners, weighting by revenues, industry, employees, and geography. Because geography was used for weighting and we consider the ten largest metro areas of the Latino population, the data reported for the metro areas is fairly representative of those regions. However, care should exercised when looking at cuts with small sample sizes (e.g. scaled firms in small metro areas). For detailed information on weighting, see the Methodology section of the 2017 State of Latino Entrepreneurship research report (https://www.gsb.stanford.edu/sites/gsb/files/publication-pdf/report-slei-state-latino- entrepreneurship-2017.pdf).
Appendix B: Top Ten Metro Area CharacteristicsTABLE 1
SUMMARY OF METROPOLITAN STATISTICAL AREAS SNAPSHOTS
Characteristic Los
An
gele
s
San
Dieg
o
Rive
rsid
e
Hou
ston
Dalla
s
San
An
toni
o
Phoe
nix
Mia
mi
New
Yor
k
Chic
ago
Nat
iona
lStanford Survey Sample Size 314 62 111 125 108 70 76 248 409 224 5,026
Business and Business Owner
Scaled Businesses (percent) 2 2 <1 <1 4 1 17 1.6 5 4 3
Average Firm Age (years) 7 5 6 9 11 9 16 8 9 8 10
Average Age of Entrepreneur (years) 41 43 39 39 41 44 42 43 39 41 42
Millennials (percent) 50 34 54 48 23 39 40 42 55 31 40
Female (percent) 46 51 65 66 57 37 77 56 70 63 58
Earned Bachelor’s Degree (percent) 50 28 38 33 46 24 11 32 47 62 40
Immigrant (percent) 25 20 21 31 14 6 14 52 30 26 27
Family history of entrepreneurship (percent)
55 57 63 45 66 27 80 71 45 44 51

54
Appendices
SUMMARY OF METROPOLITAN STATISTICAL AREAS SNAPSHOTS
Characteristic Los
An
gele
s
San
Dieg
o
Rive
rsid
e
Hou
ston
Dalla
s
San
An
toni
o
Phoe
nix
Mia
mi
New
Yor
k
Chic
ago
Nat
iona
l
Utilization of Capital
Savings, Family and Friends
MSA (percent) 13 7 26 12 15 9 8 16 12 10 13
State (percent) 14 14 14 16 16 16 5 11 7 10
Line of Credit
MSA (percent) 7 5 22 13 18 1 2 7 16 27 12
State (percent) 10 10 10 11 11 11 1 11 15 31
Local/Regional Bank Loan
MSA (percent) 1 1 1 6 2 1 2 3 2 10 4
State (percent) 1 1 1 4 4 4 1 4.5 1 9
National Bank Loan
MSA (percent) 1 <1 1 1 1 1 <1 1 2 <1 1
State (percent) 1 1 1 1 1 1 <1 2 1.5 <1
Government Loan
MSA (percent) <1 <1 <1 <1 1 <1 <1 5 <1 <1 1
State (percent) <1 <1 <1 <1 <1 <1 <1 2.3 <1 <1
Venture Capital
MSA (percent) 1 <1 1 <1 1 <1 <1 1 5 <1 3
State (percent) <1 <1 <1 <1 <1 <1 7.6 2.3 6.2 <1
Angel Investment
MSA (percent) 2 1 1 <1 2 <1 <1 5 4 1 2
State (percent) 2 2 2 <1 <1 <1 <1 2.5 5.7 1
Private Equity
MSA (percent) <1 1 1 1 1 1 3 6 2 <1 2
State (percent) <1 <1 <1 1 1 1 1.7 3.2 2.3 <1
Hard Money
MSA (percent) 6 3 10 2 3 8 14 14 11 7 10
State (percent) 10 10 10 4.5 4.5 4.5 10.5 12 13 6.6
Participation in Business Organizations
General Chamber of Commerce
MSA (percent) 10 42 1 21 14 2 9 2 14 12 10
State (percent) 8 8 8 11 11 11 15 7 16 11
Hispanic Chamber of Commerce
MSA (percent) 4 4 2 2 10 8 28 5 17 14 10
State (percent) 7 7 7 6 6 6 29 13 12 12
Trade Association (percent)
MSA (percent) 6 23 1 16 2 11 7 19 9 15 12
State (percent) 10 10 10 15 15 15 16 13 6 14
Nonprofit Board (percent)
MSA (percent) 2 3 1 6 1 1 7 5 3 33 7
State (percent) 9 9 9 3 3 3 7 5 5 29
Hispanic Nonprofit Board (percent)
MSA (percent) 1 3 2 1 15 1 9 8 4 17 5
State (percent) 3 3 3 4 4 4 6 6 5 16
Source: 2017 SLEI Survey of U.S. Latino Business Owners

55
Appendices
TABLE 2
PROPERTY VALUE, WAGES AND TAXES BY STATE AND METRO AREA
State CALIFORNIA TEXAS ARIZONA FLORIDANEW YORK ILLINOIS
Metro Area Los
An
gele
s
San
Dieg
o
Rive
rsid
e
Hou
ston
Dalla
s
San
An
toni
o
Phoe
nix
Mia
mi
New
Yor
k
Chic
ago
Property Value
Average home value (2016) $684,089 $657,284 $368,876 $250,745 $262,912 $167,376 $298,432 $403,142 $526,833 $272,694
Average structure cost (2016) $200,397 $221,192 $240,200 $187,835 $185,671 $141,892 $206,292 $187,085 $276,647 $239,964
Average land value (2016) $483,692 $436,092 $128,676 $62,911 $77,240 $25,484 $92,141 $216,056 $250,187 $32,730
Utilization of Capital
Wages
Median Wages (2017) $19.13 $20.15 $17.06 $18.74 $18.28 $16.65 $17.92 $16.67 $22.07 $19.23
Average Wages (2017) $26.94 $27.12 $22.76 $25.87 $24.64 $22.21 $23.80 $22.53 $30.23 $26.04
State Minimum Wage $11 $7.25 (fed rate) $10.50 $8.25 $10.40 $8.25
Taxes
2019 State Business Tax Climate Index1 49 15 27 4 48 36
State Corporate Income Tax (2018)
8.84% None 4.9% 5.5% 6.5% 9.5%
State Sales Tax (2018) 7.25% 6.25% 5.6% 6% 4% 6.25%
State Individual Income Tax (2018) 1-13.3% None 2.5–
4.5% None 4-8.8% 4.95% of federal
State Unemployment Insurance Tax (2018) 1.5–6.2% 0.46–6.46% 0.05–
12.76%0.1– 5.4%
0.9– 8.3%
0.525– 6.925%
1 A rank of 1 is best, 50 is worst.
Sources: Davis, M. A. & Palumbo, M.G. (2007). The price of residential land in large U.S. cities. “Journal of Urban Economics,” 63 (1), p. 352-384; data located at Land and Property Values in the U.S., Lincoln Institute of Land Policy http://www.lincolninst.edu/resources/. https://datatoolkits.lincolninst.edu/subcenters/land-values/metro-area-land-prices.asp.Bureau of Labor Statistics. (2017) May 2017 metropolitan and nonmetropolitan area occupational employment and wage Estimates. https://www.bls.gov/oes/current/oessrcma.htm.Economic Policy Institute. (2018). Minimum Wage Tracker. https://www.epi.org/minimum-wage-tracker/#/min_wage.Walczak, J., Drenkard, S., & Bishop-Henchman, J. (2018) “2019 State Business Tax Climate Index.” Tax Foundation. https://files.taxfoundation.org/20180925174436/2019-State-Business-Tax-Climate-Index.pdf.

56
Appendices
Appendix C: About the Collaborating Organizations
About InteriseInterise stimulates economic development in low- to moderate-income communities by providing established small business owners with executive education, access to markets, and integration into networks across the small business ecosystem. Interise’s small business capacity building program, the StreetWise ‘MBA’™, uses a peer-based learning model to provide small business own-ers with the business knowledge, management know-how, and network relationships they need to achieve scale. As these companies grow, they further contribute to local economic development and job creation where it is needed most. The StreetWise ‘MBA’™ is offered in 70+ cities nation-wide. 6,000+ small businesses are powered by the StreetWise ‘MBA’™. More information can be found at http://www.interise.org/, @StreetWiseMBA, and at www.facebook.com/Interise.
Interise StreetWise ‘MBA’™ The StreetWise ‘MBA’™ is a practical executive education program that provides small businesses with the business knowledge, management know-how, and professional networks needed to further grow their established business. The StreetWise ‘MBA’™ is licensed to partners for local delivery and is currently offered in 70+ cities. Curriculum is delivered over thirteen classroom sessions, focusing on business strategy, financial analysis, marketing and sales, talent, and procurement. Instructors trained in peer learning facilitate each session, and participants meet in small CEO Mentoring Groups outside the classroom. As business owners participate in the program, they make the behavioral shift from working in their business to working on their busi-ness for sustained growth. The program culminates with participants developing a three-year Strategic Growth Action Plan™ for their businesses. Interise monitors changes in business outcomes over a three-year period post-program.
About Stanford Graduate School of BusinessStanford Graduate School of Business (GSB) has established itself as a global leader in manage-ment education through educational programs designed to develop insightful principled global leaders. Stanford GSB supports faculty research, curriculum development, and interaction among academic disciplines.
Stanford Latino Entrepreneurship Initiative (SLEI)Stanford Latino Entrepreneurship Initiative (SLEI) is a research and education collaboration between Stanford University and the Latino Business Action Network (LBAN), a 501(c)(3) not-for-profit organization.
SLEI Research ProgramSLEI explores and expands our knowledge of the Latino entrepreneurship segment in the U.S. economy through research, knowledge dissemination, and facilitated collaboration. The effort, jointly supported by LBAN and Stanford, aims to:
� Grow the current database of more than 1.3 million U.S. Latino-owned companies and survey a panel of more than 5,000 independent companies
� Support the advancement of knowledge and discourse by generating significant research, and broadly disseminating its findings

57
Appendices
SLEI Education—Scaling Program (SLEI-Ed)SLEI’s initial education effort, a scaling program focused on promoting the growth of Latino owned companies, is a collaboration between Stanford Graduate School of Business Executive Education and the Latino Business Action Network (LBAN). It is an opportunity designed for Latino-owned businesses that generate more than $1 million in annual revenue or have raised at least $500,000 of external funding. This immersive program provides business owners with education, enhanced networks, personal mentorship, and a better understanding of how to access capital to scale their businesses. The program has more than 420 alumni from 30 states and Puerto Rico who collec-tively generate over $1.5 billion in annual revenue.
About Latino Business Action Network (LBAN)LBAN works to make America stronger by empowering Latino entrepreneurs to grow large busi-nesses through entrepreneurship research, education, and networks. LBAN’s goal is to double the number of $10 million, $100 million, and $1 billion Latino-owned businesses by 2025. To learn more, visit www.lban.us.
About the Federal Reserve Bank of New YorkThe New York Fed serves the Federal Reserve’s Second District. Although the district is geographi-cally smaller compared with other Federal Reserve Banks, the New York Fed is the largest Reserve Bank in terms of assets and volume of activity.
The New York Fed has several unique responsibilities within the Federal Reserve System. Under the direction from the FOMC, the New York Fed executes open market operations on behalf of the Federal Reserve System and holds the resulting investments in the System Open Market Account. The New York Fed is also home to the Wholesale Product Office, which is responsible for man-aging three major wholesale payment and settlement systems on behalf of the Federal Reserve System—the Fedwire Funds Service and Fedwire Securities Services, and the National Settlement Service. Collectively these services clear and settle financial transactions exceeding $4 trillion per day, or approximately 65% of all of the nation’s electronic payments.
In addition, the New York Fed: carries out foreign exchange-related activities on behalf of the Federal Reserve System and the U.S. Treasury monitors and analyzes global financial market developments, manages foreign currency reserves of the United States, and provides foreign central banks with services such as accounts, the receipt and payment of funds in U.S. dollars, the purchase and sale of foreign exchange, the custody, transfer, and investment of U.S. Treasury and other securities, and the storage of monetary gold.
Finally, the New York Fed president serves as a permanent voting member of the FOMC.
Outreach & EducationThe New York Fed’s Outreach & Education function engages with communities across the New York Fed’s district, which includes New York State, 11 counties in Northern New Jersey, Fairfield County in Connecticut, Puerto Rico, and the U.S. Virgin Islands. The Bank’s outreach efforts are designed to help fill information gaps, particularly on topics of relevance to policymakers, service providers, and investors in underserved communities. We focus our outreach efforts in under-served and low- and moderate- income communities on a set of topics aligned with the Bank’s mission and expertise, including household debt and credit, community economic well-being, small business vitality, and workforce development.