latino summit presentation: houston community college building a pipeline of stem success for...
TRANSCRIPT
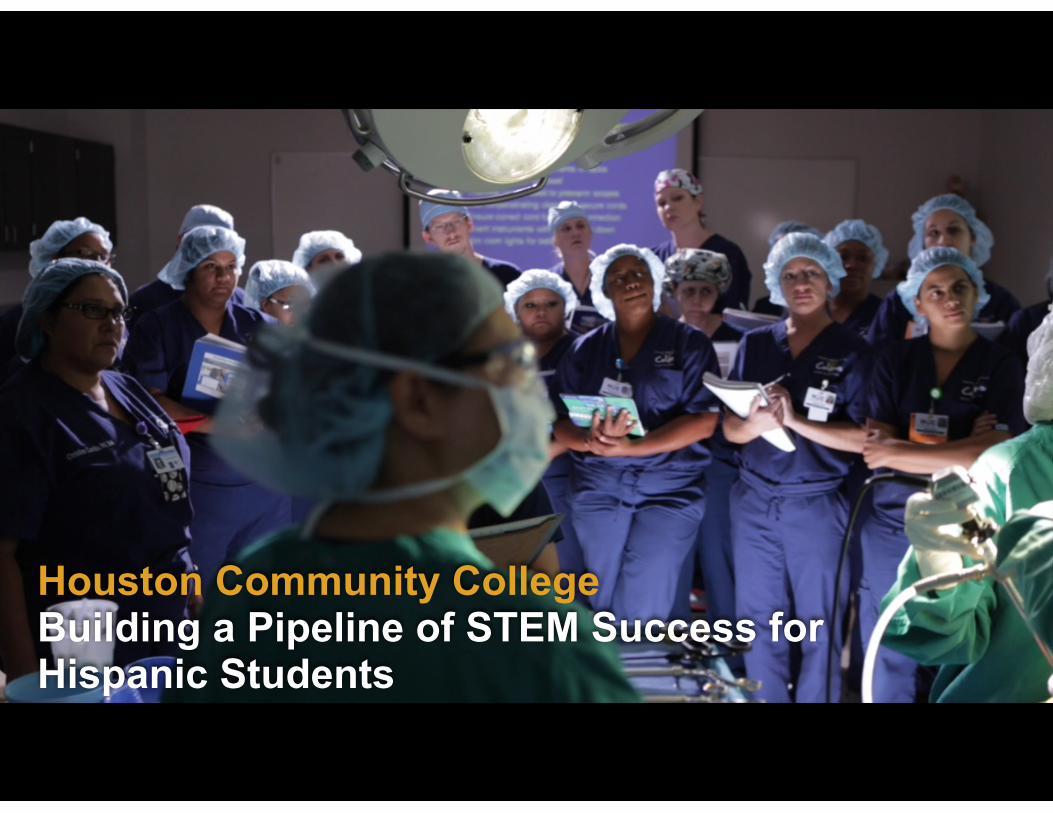
Houston Community College Building a Pipeline of STEM Success for Hispanic Students

Science Technology Engineering Math

Science Technology Engineering Math
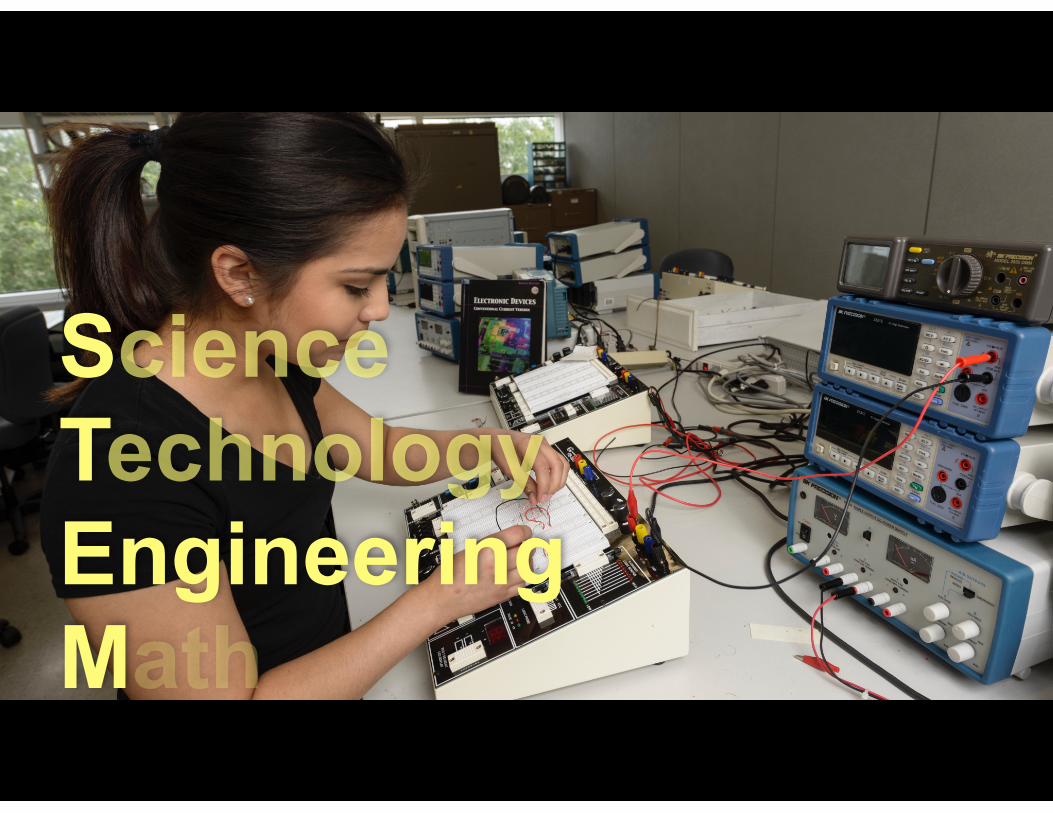
Science Technology Engineering Math

Science Technology Engineering Math
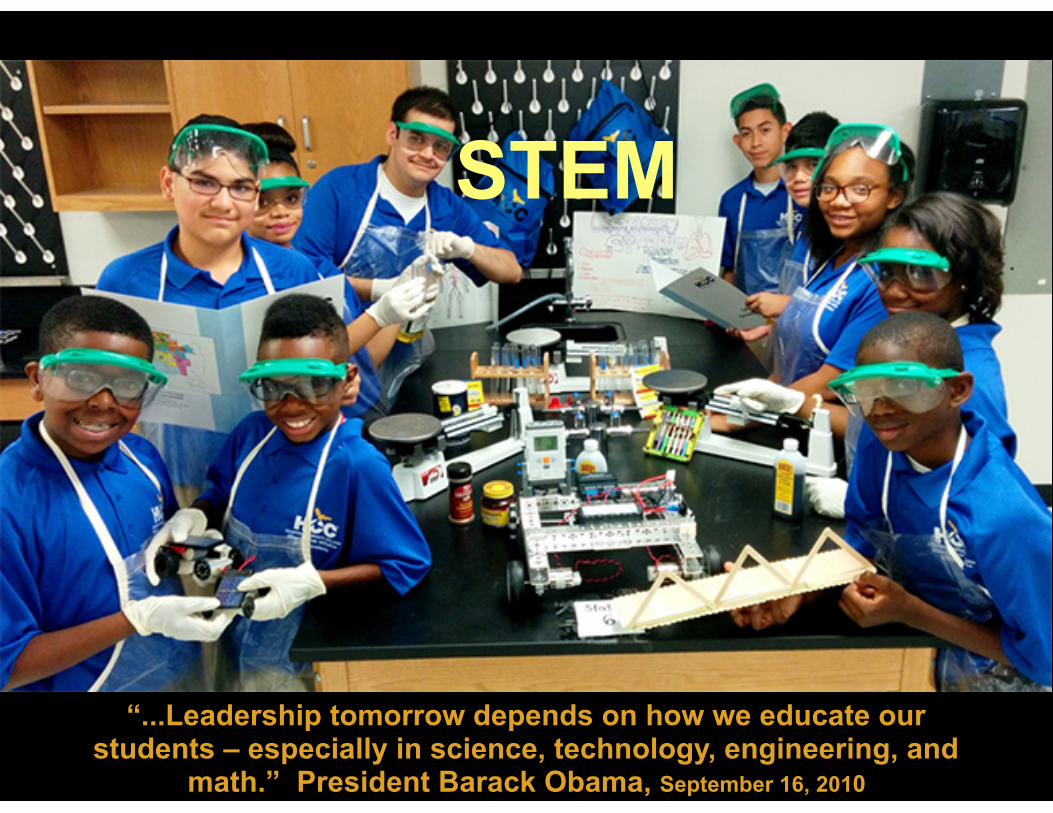
6“...Leadership tomorrow depends on how we educate our
students – especially in science, technology, engineering, and math.” President Barack Obama, September 16, 2010
STEM

7
Health Care
8
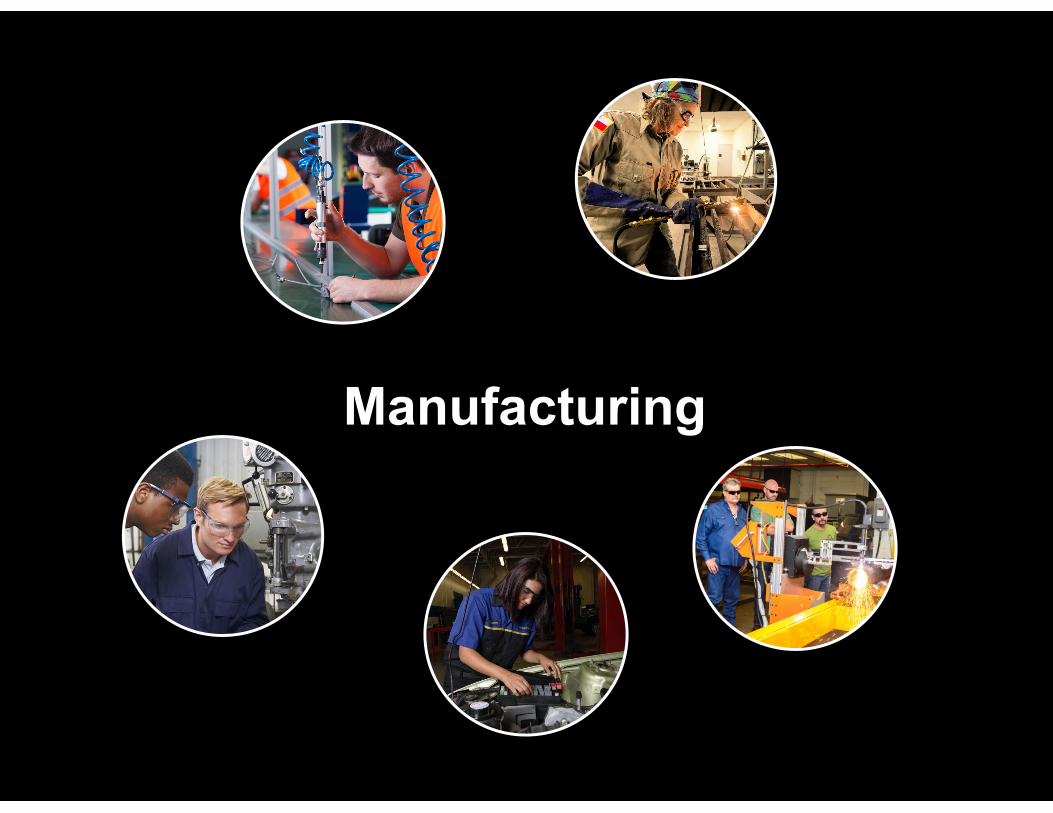
Manufacturing
9
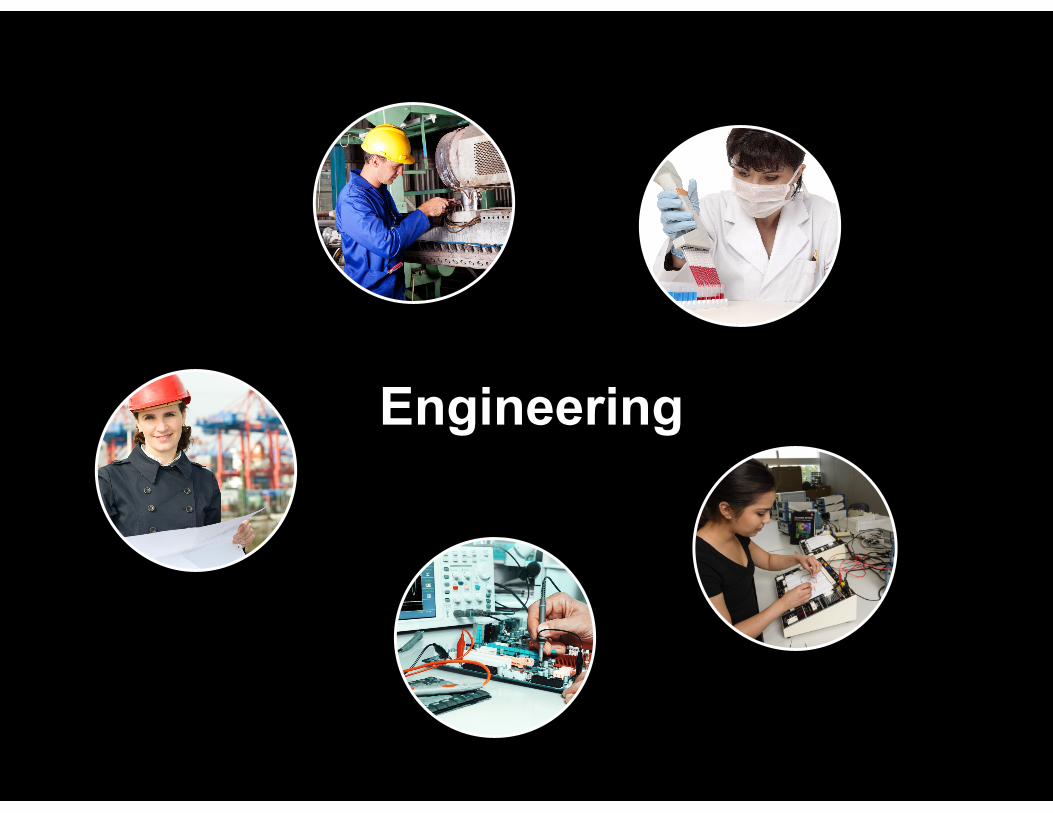
Engineering
10
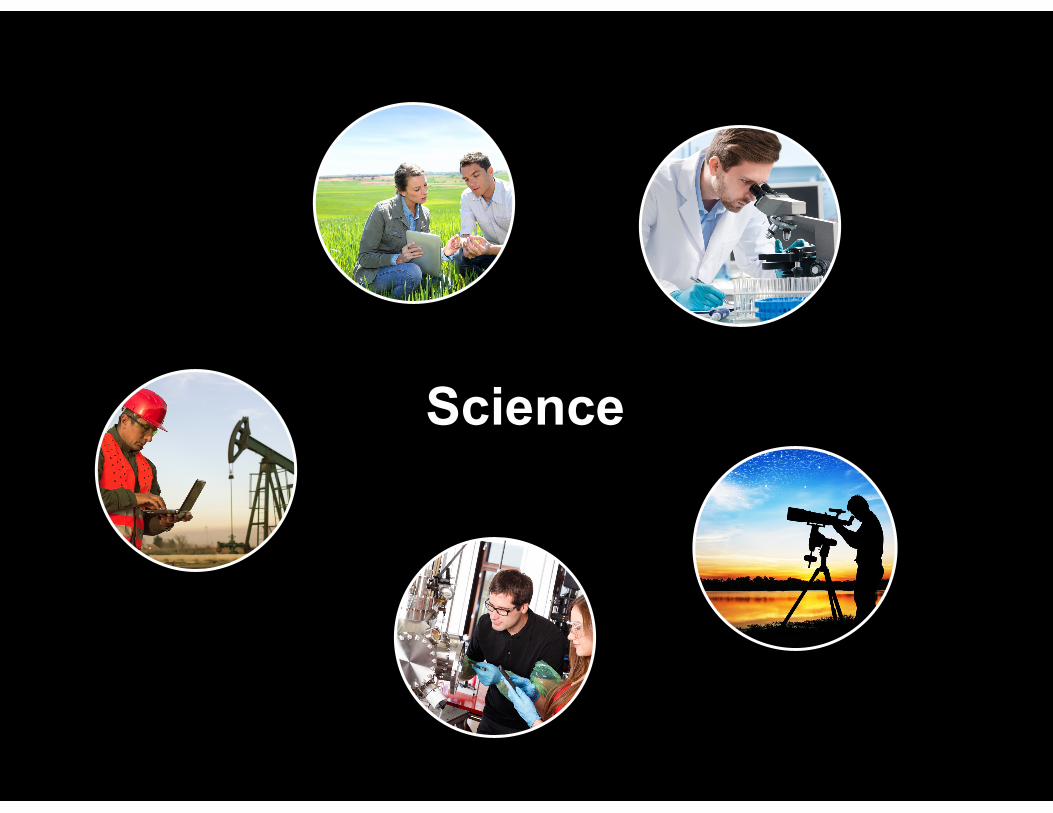
Science
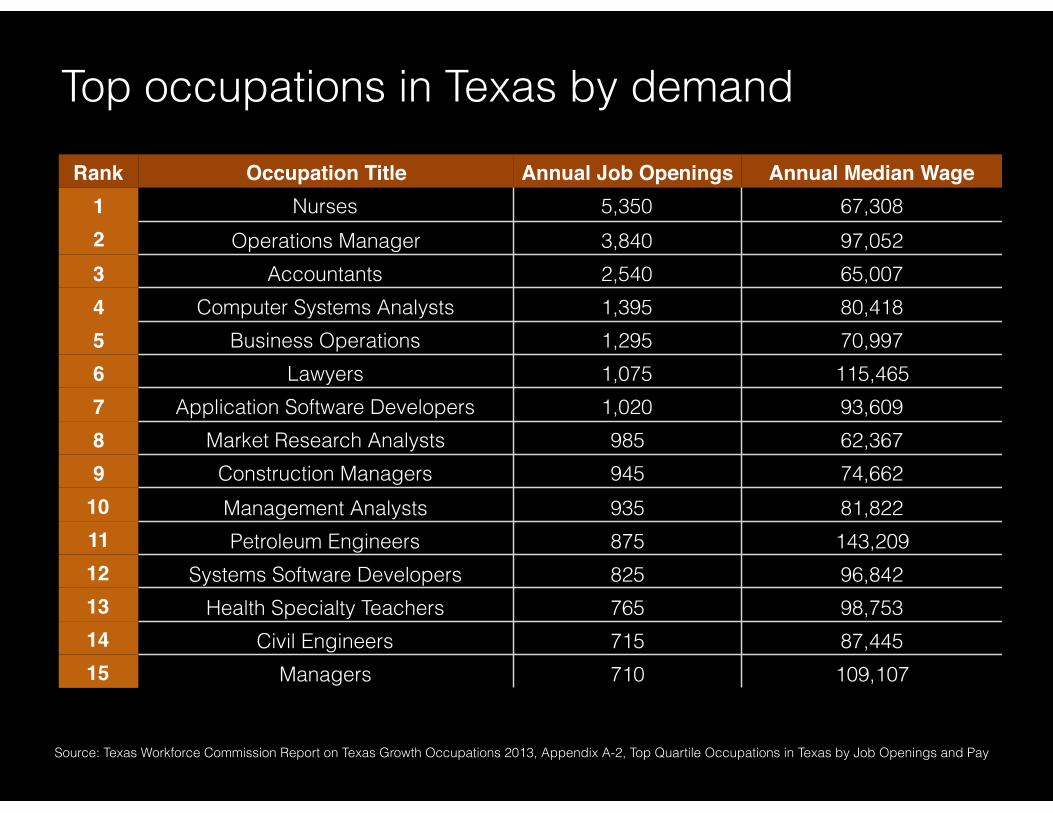
Top occupations in Texas by demandRank Occupation Title Annual Job Openings Annual Median Wage
20131 Nurses 5,350 67,3082 Operations Manager 3,840 97,0523 Accountants 2,540 65,0074 Computer Systems Analysts 1,395 80,4185 Business Operations 1,295 70,9976 Lawyers 1,075 115,4657 Application Software Developers 1,020 93,6098 Market Research Analysts 985 62,3679 Construction Managers 945 74,662
10 Management Analysts 935 81,82211 Petroleum Engineers 875 143,20912 Systems Software Developers 825 96,84213 Health Specialty Teachers 765 98,75314 Civil Engineers 715 87,44515 Managers 710 109,107
Source: Texas Workforce Commission Report on Texas Growth Occupations 2013, Appendix A-2, Top Quartile Occupations in Texas by Job Openings and Pay
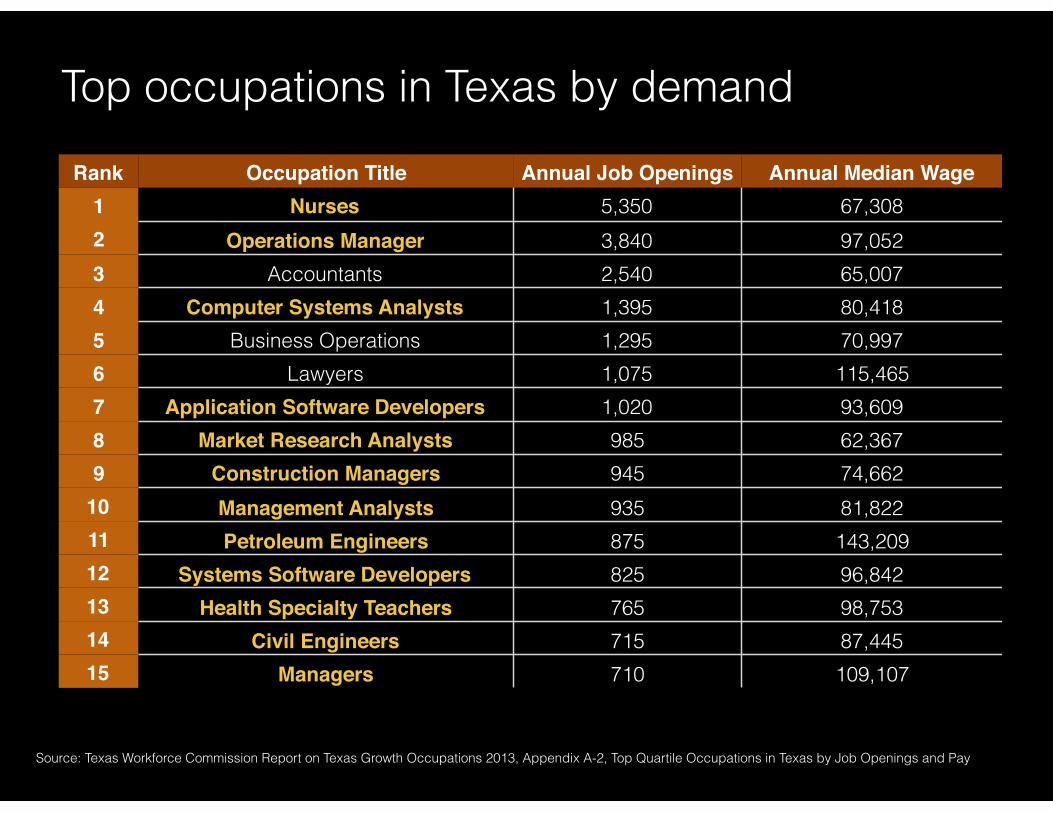
Rank Occupation Title Annual Job Openings Annual Median Wage 20131 Nurses 5,350 67,308
2 Operations Manager 3,840 97,0523 Accountants 2,540 65,0074 Computer Systems Analysts 1,395 80,4185 Business Operations 1,295 70,9976 Lawyers 1,075 115,4657 Application Software Developers 1,020 93,6098 Market Research Analysts 985 62,3679 Construction Managers 945 74,662
10 Management Analysts 935 81,82211 Petroleum Engineers 875 143,20912 Systems Software Developers 825 96,84213 Health Specialty Teachers 765 98,75314 Civil Engineers 715 87,44515 Managers 710 109,107
Top occupations in Texas by demand
Source: Texas Workforce Commission Report on Texas Growth Occupations 2013, Appendix A-2, Top Quartile Occupations in Texas by Job Openings and Pay
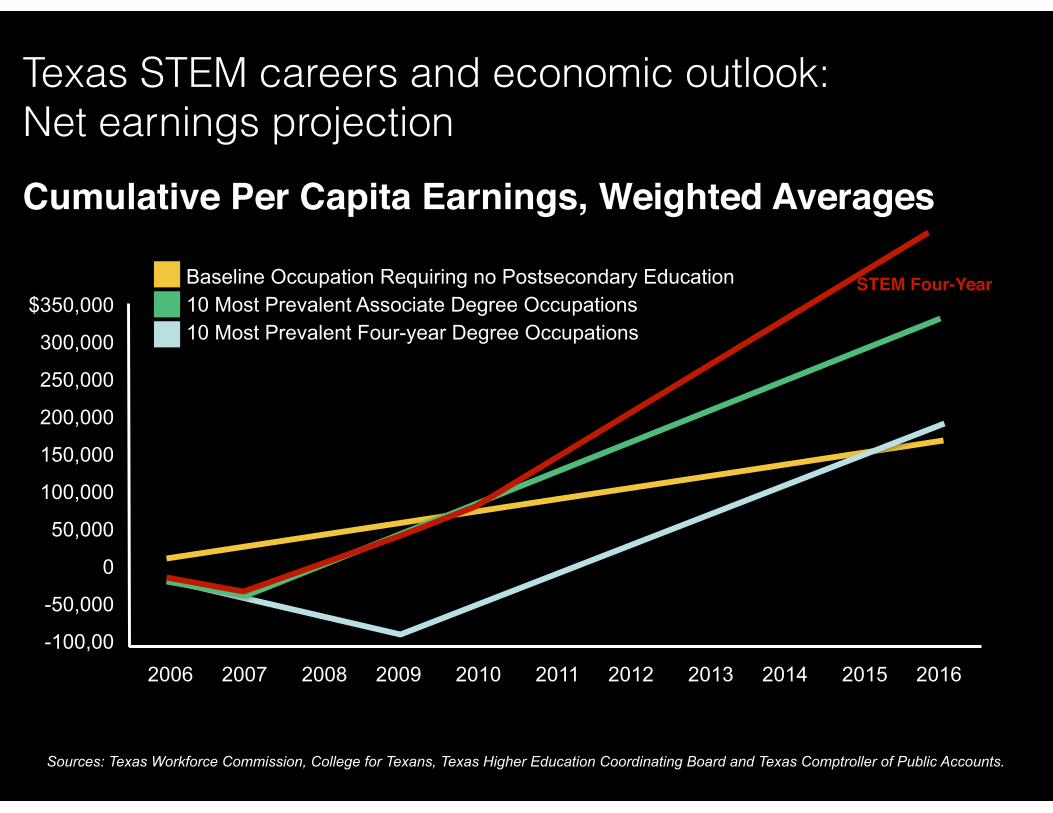
Texas STEM careers and economic outlook: Net earnings projection
STEM Four-Year
Sources: Texas Workforce Commission, College for Texans, Texas Higher Education Coordinating Board and Texas Comptroller of Public Accounts.
Cumulative Per Capita Earnings, Weighted Averages
$350,000
300,000
250,000
200,000
150,000
100,000
50,000
0
-50,000
-100,002006 2007 2008 2009 2010 2011 2012 2013 2014 2015 2016
Baseline Occupation Requiring no Postsecondary Education 10 Most Prevalent Associate Degree Occupations 10 Most Prevalent Four-year Degree Occupations
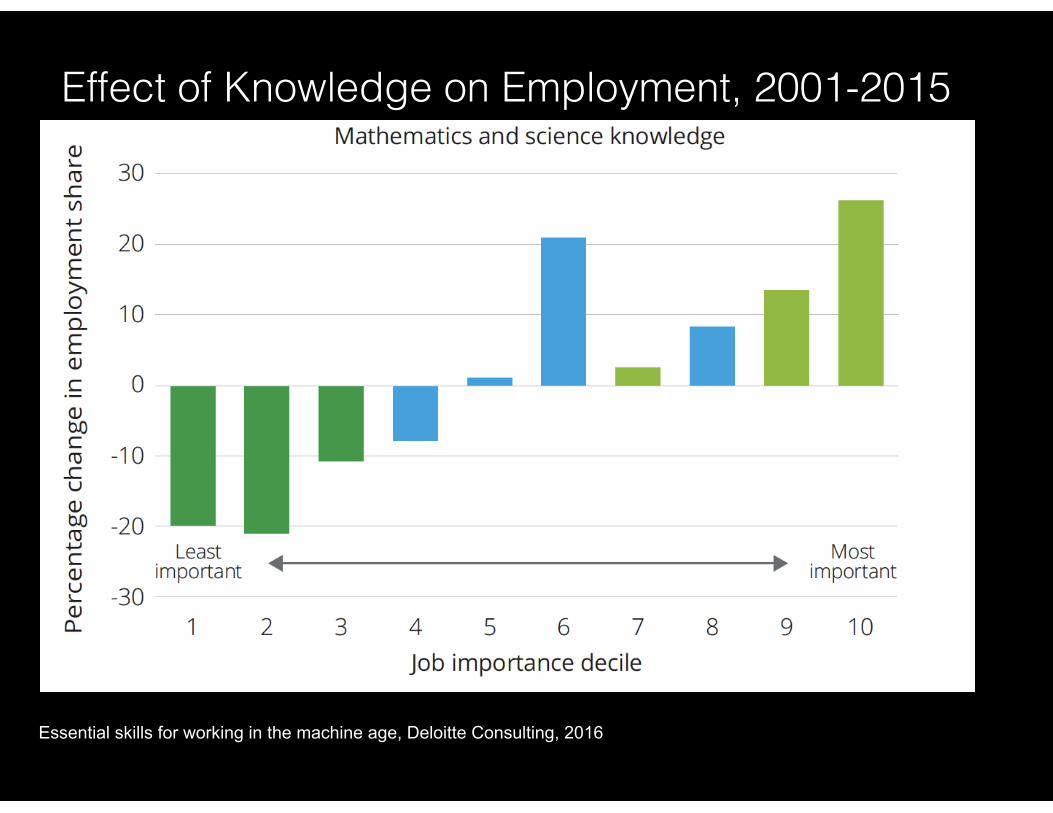
Effect of Knowledge on Employment, 2001-2015
Essential skills for working in the machine age, Deloitte Consulting, 2016
14
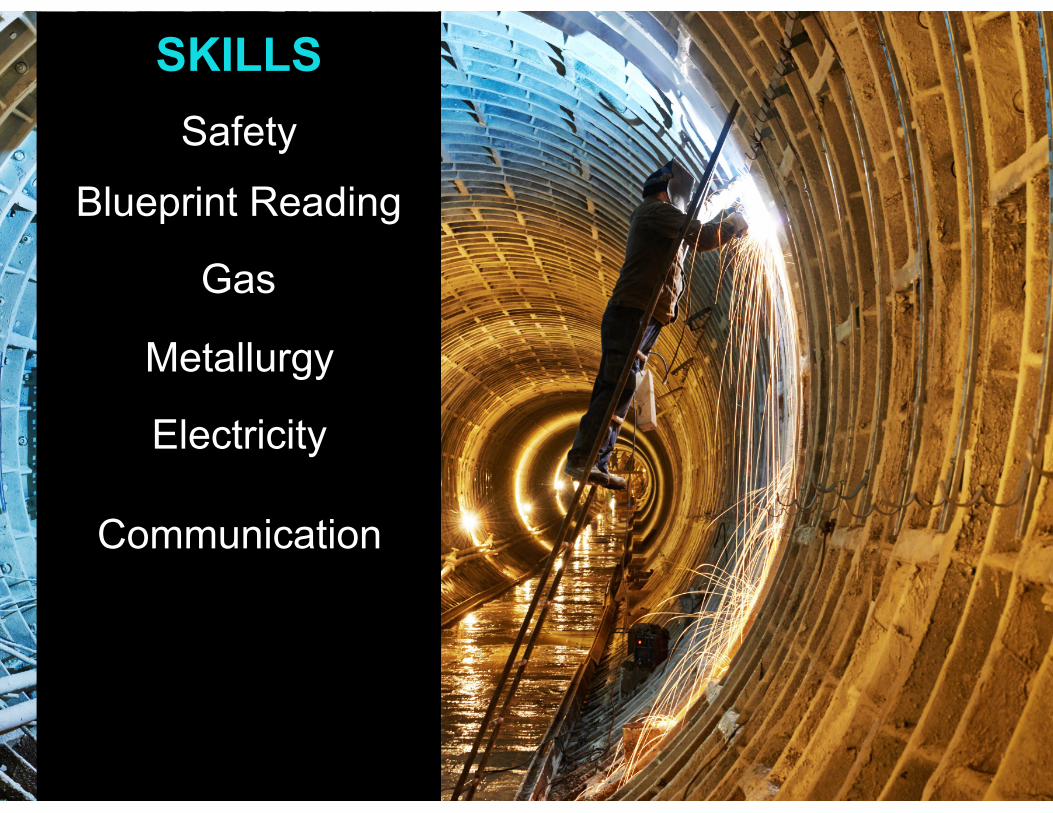
SKILLS Safety
Blueprint Reading
Gas
Metallurgy
Electricity
Communication
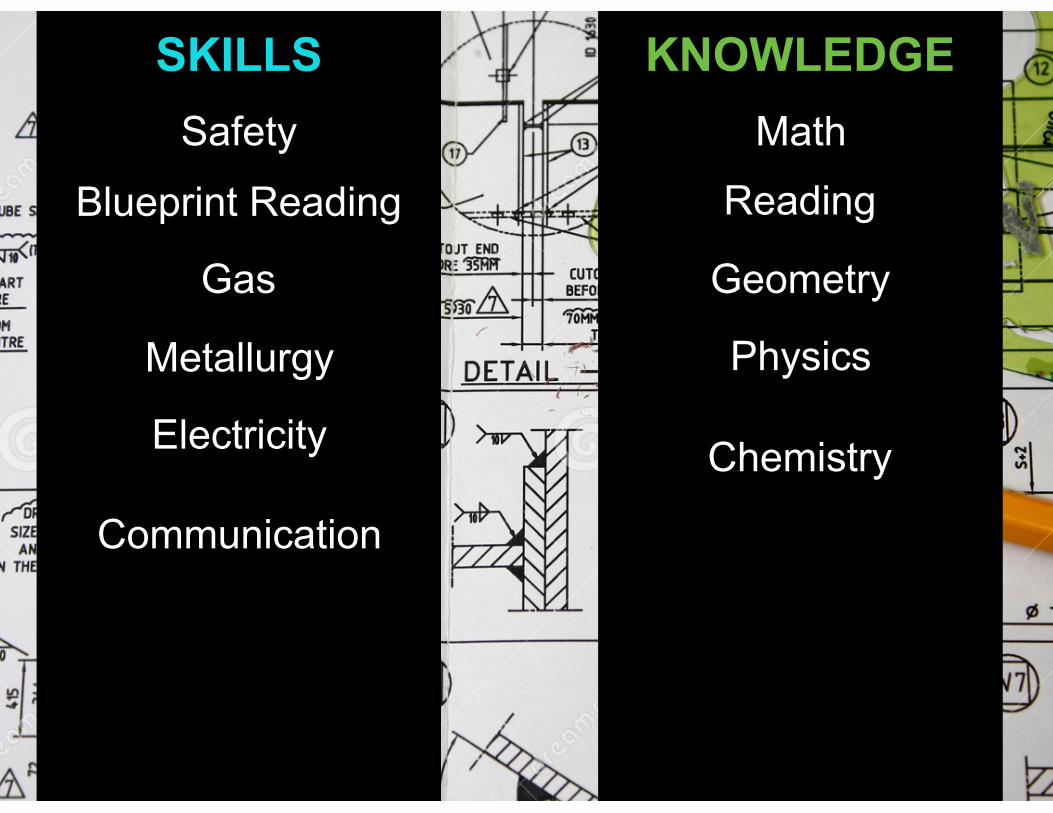
SKILLS Safety
Blueprint Reading
Gas
Metallurgy
Electricity
Communication
KNOWLEDGE Math
Reading
Geometry
Physics
Chemistry
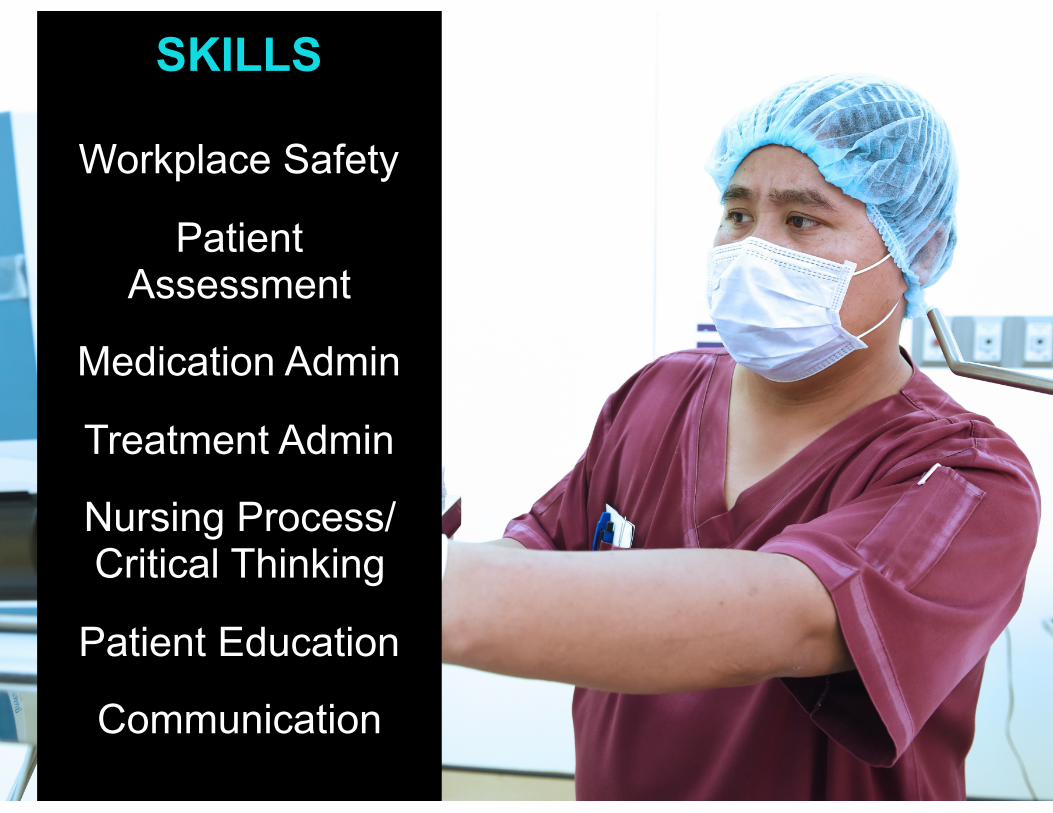
SKILLS
Workplace Safety
Patient Assessment
Medication Admin
Treatment Admin
Nursing Process/Critical Thinking
Patient Education
Communication
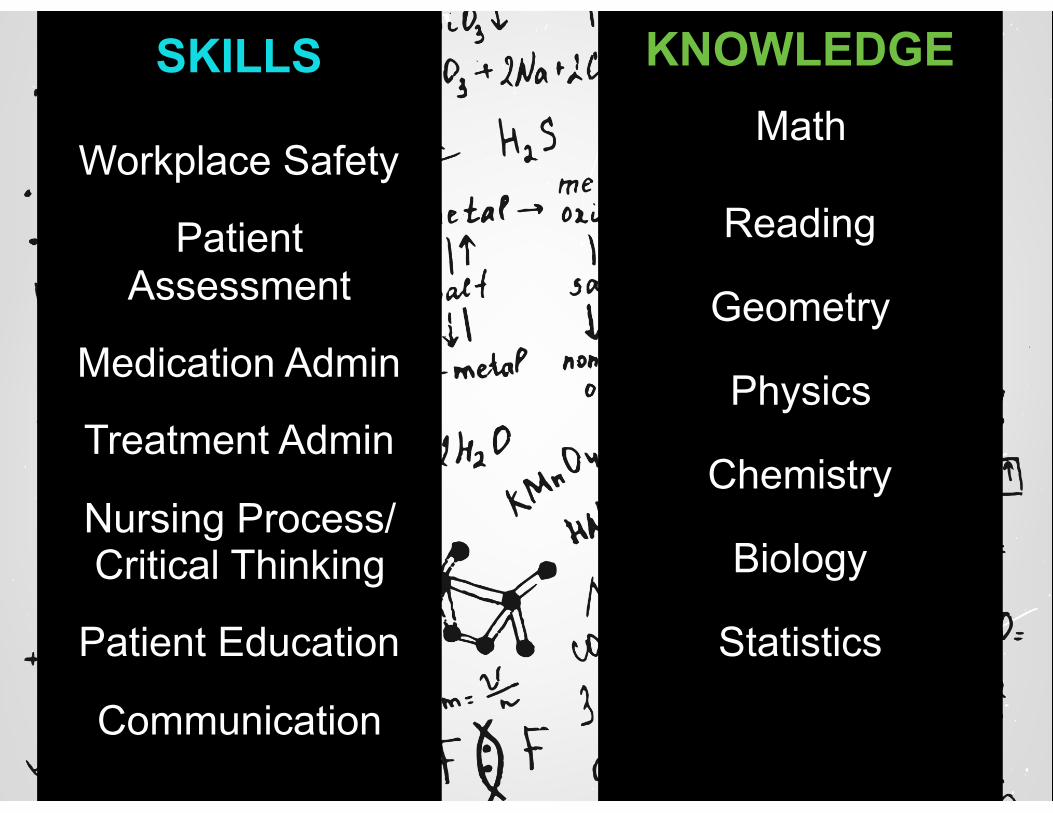
SKILLS
Workplace Safety
Patient Assessment
Medication Admin
Treatment Admin
Nursing Process/Critical Thinking
Patient Education
Communication
KNOWLEDGE Math
Reading
Geometry
Physics
Chemistry
Biology
Statistics
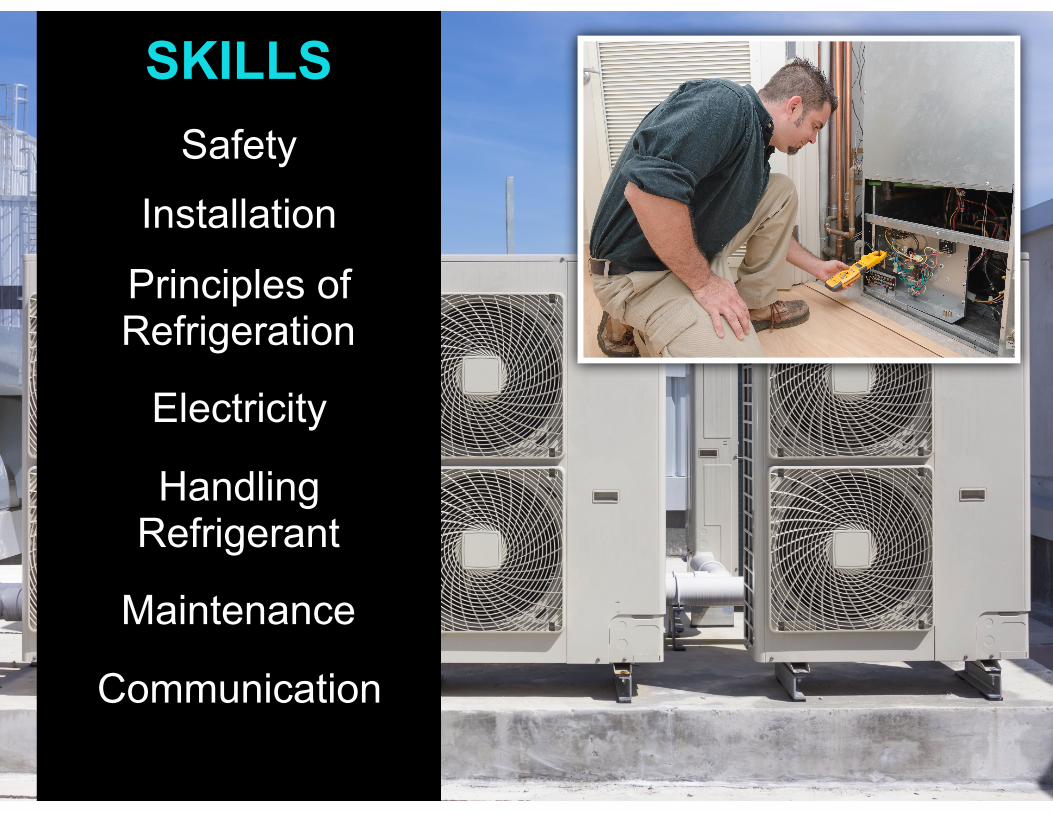
SKILLS Safety
Installation
Principles of Refrigeration
Electricity
Handling Refrigerant
Maintenance
Communication
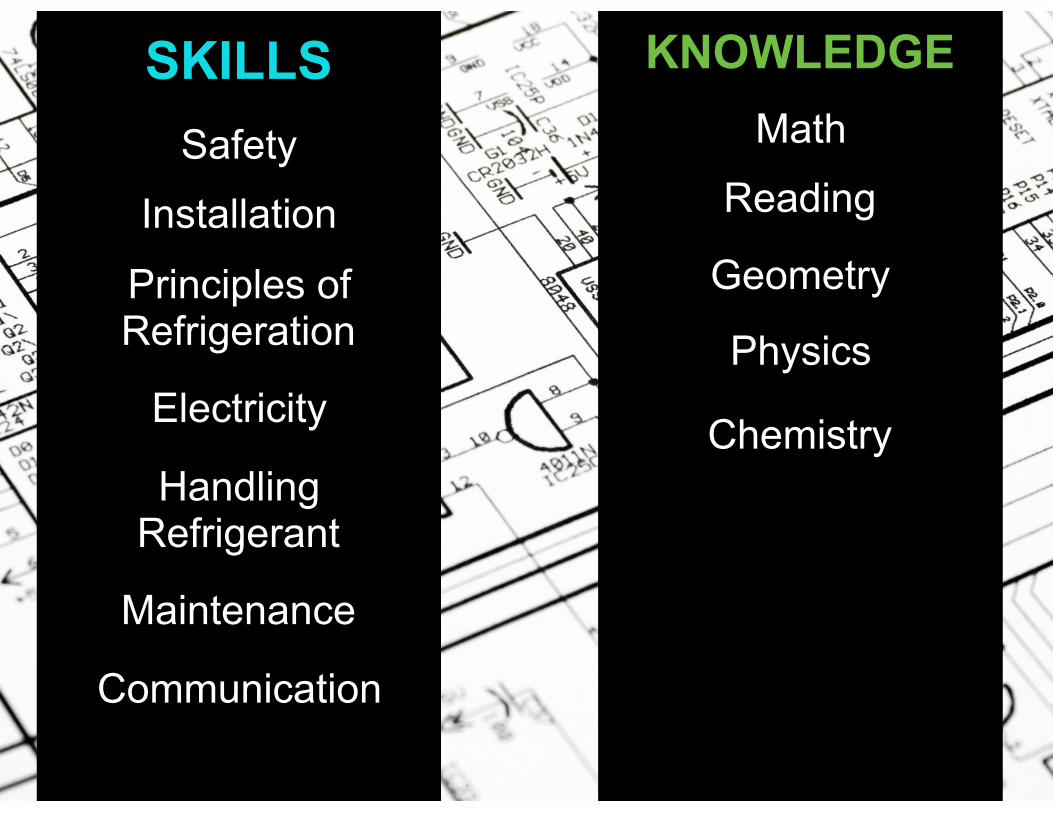
KNOWLEDGE Math
Reading
Geometry
Physics
Chemistry
SKILLS Safety
Installation
Principles of Refrigeration
Electricity
Handling Refrigerant
Maintenance
Communication

25
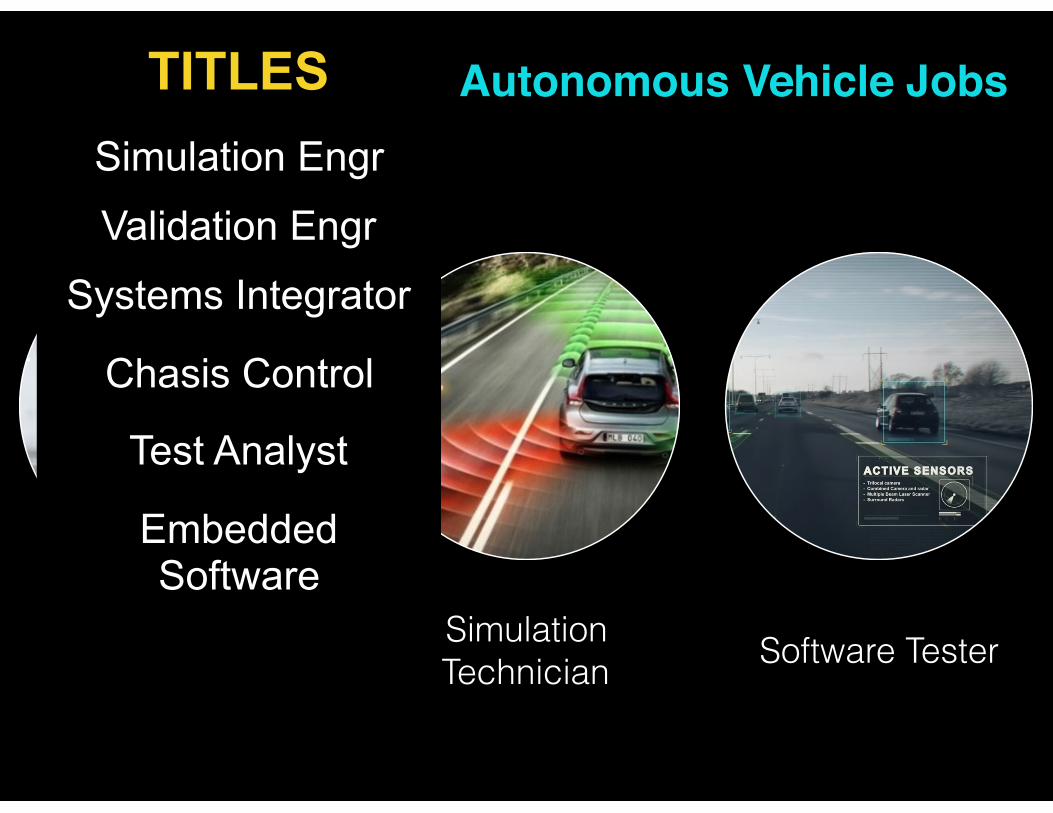
Autonomous Vehicle Jobs
Vehicle Intelligence
Simulation Technician Software Tester
TITLES Simulation Engr
Validation Engr
Systems Integrator
Chasis Control
Test Analyst
Embedded Software
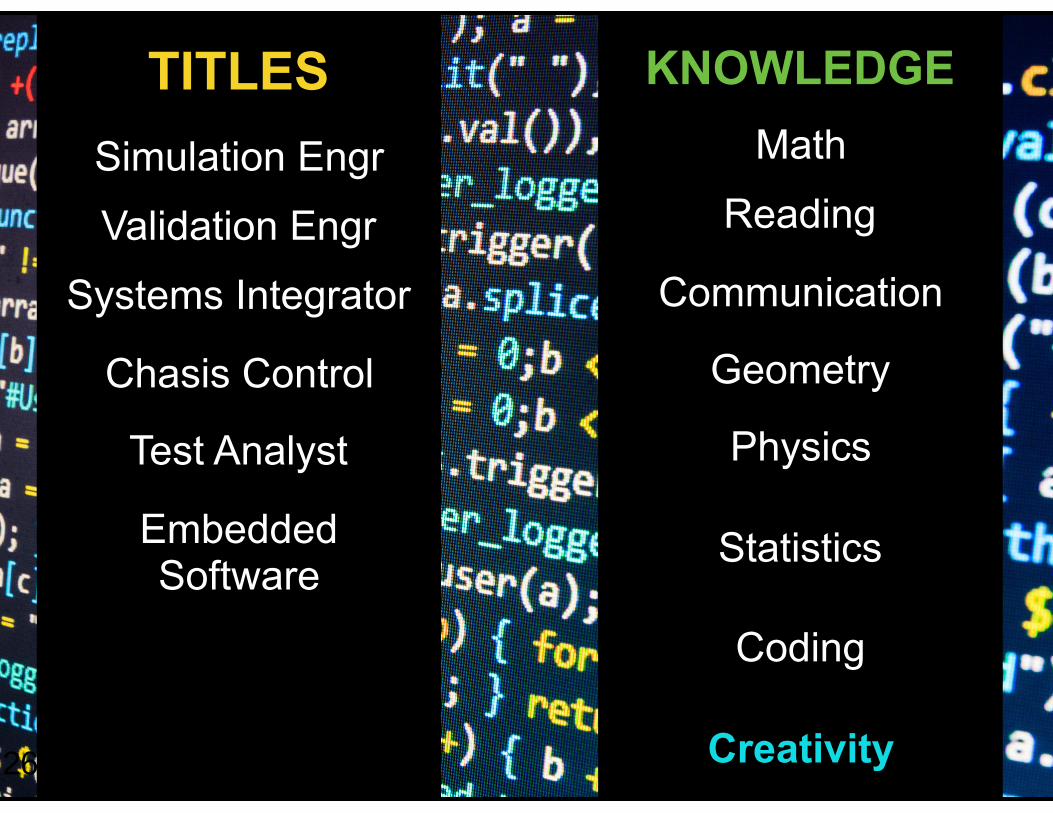
26
Vehicle Intelligence
TITLES Simulation Engr
Validation Engr
Systems Integrator
Chasis Control
Test Analyst
Embedded Software
KNOWLEDGE Math
Reading
Communication
Geometry
Physics
Statistics
Coding
Creativity
31
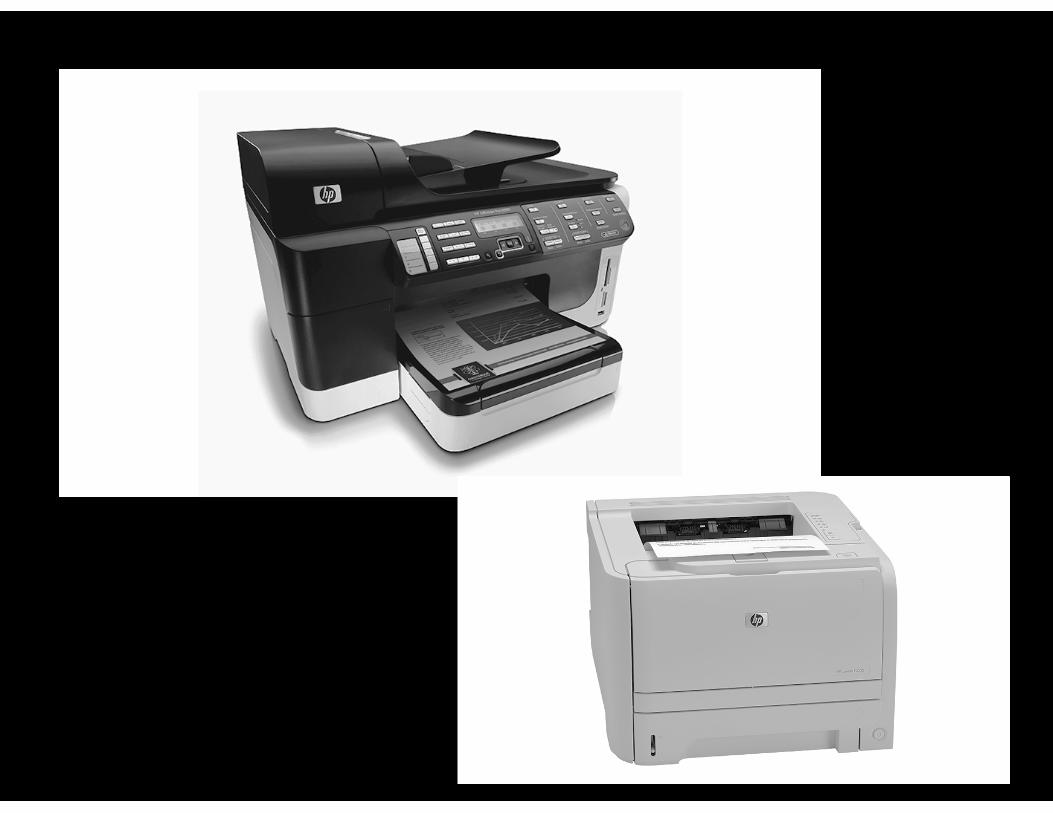
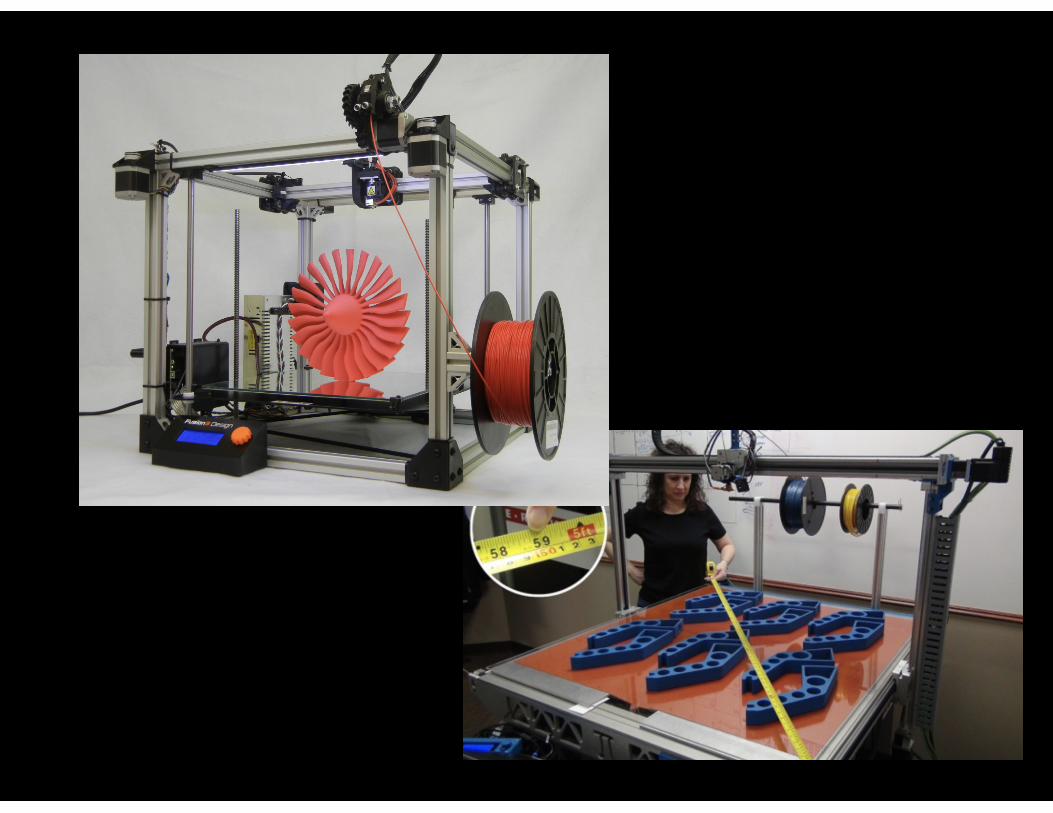
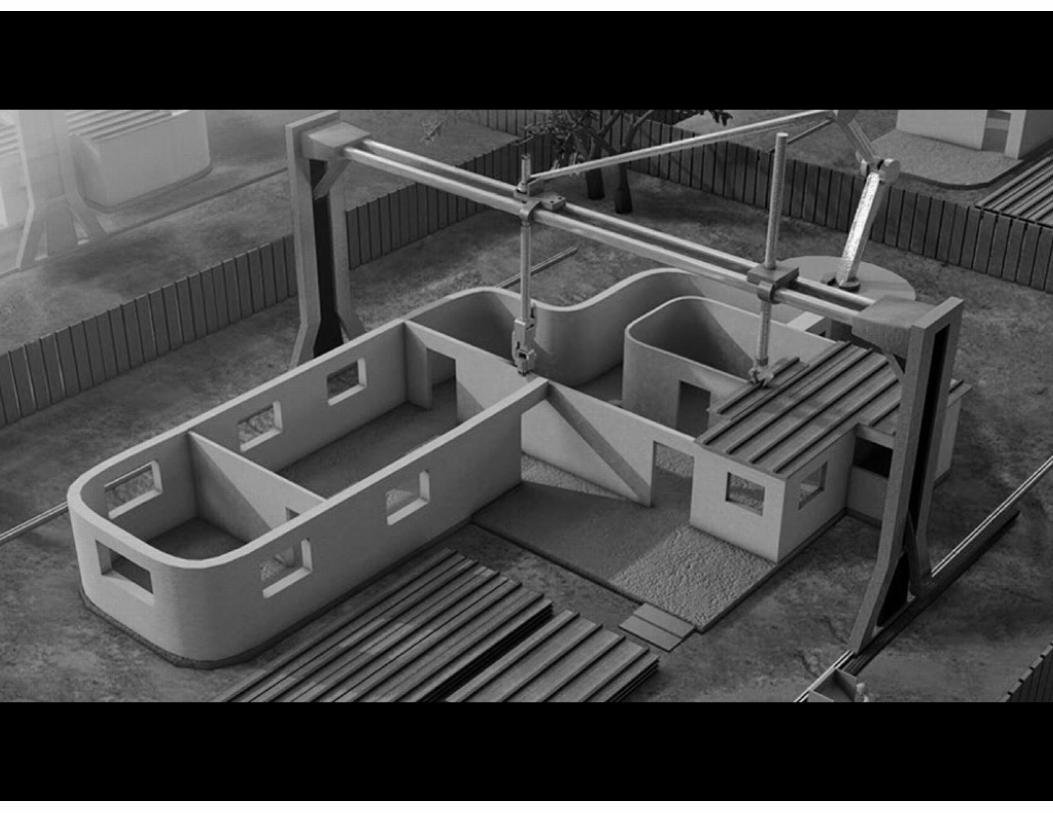
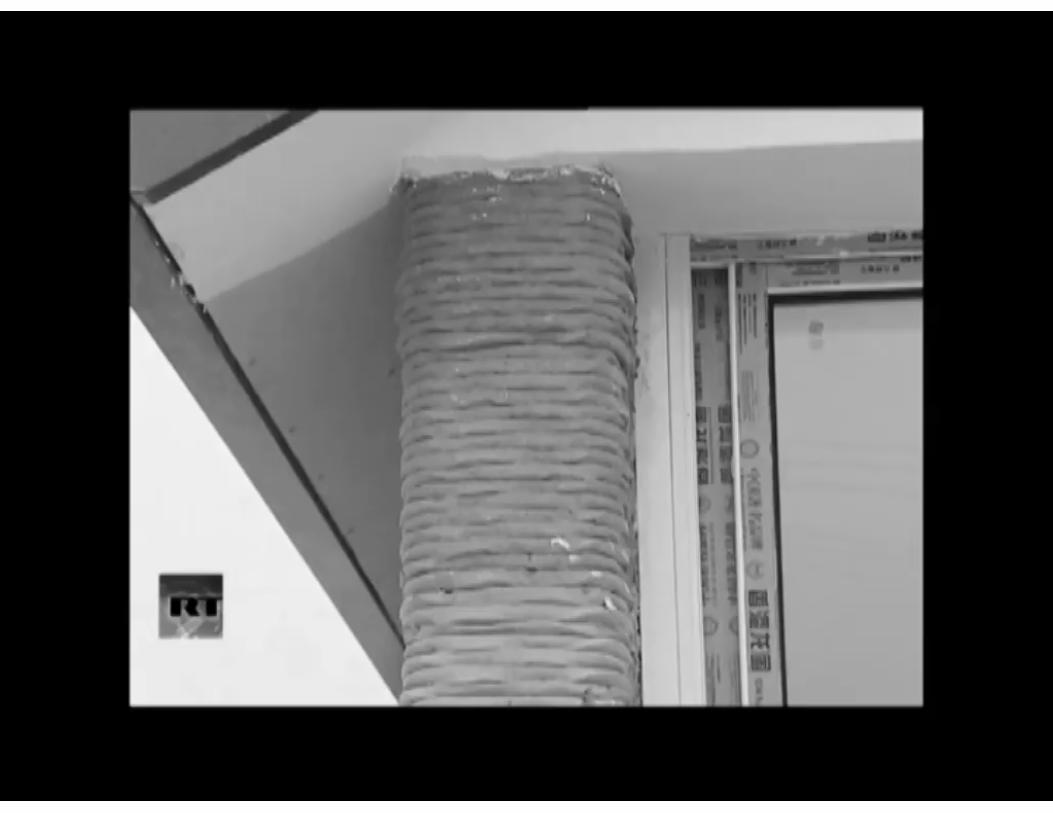
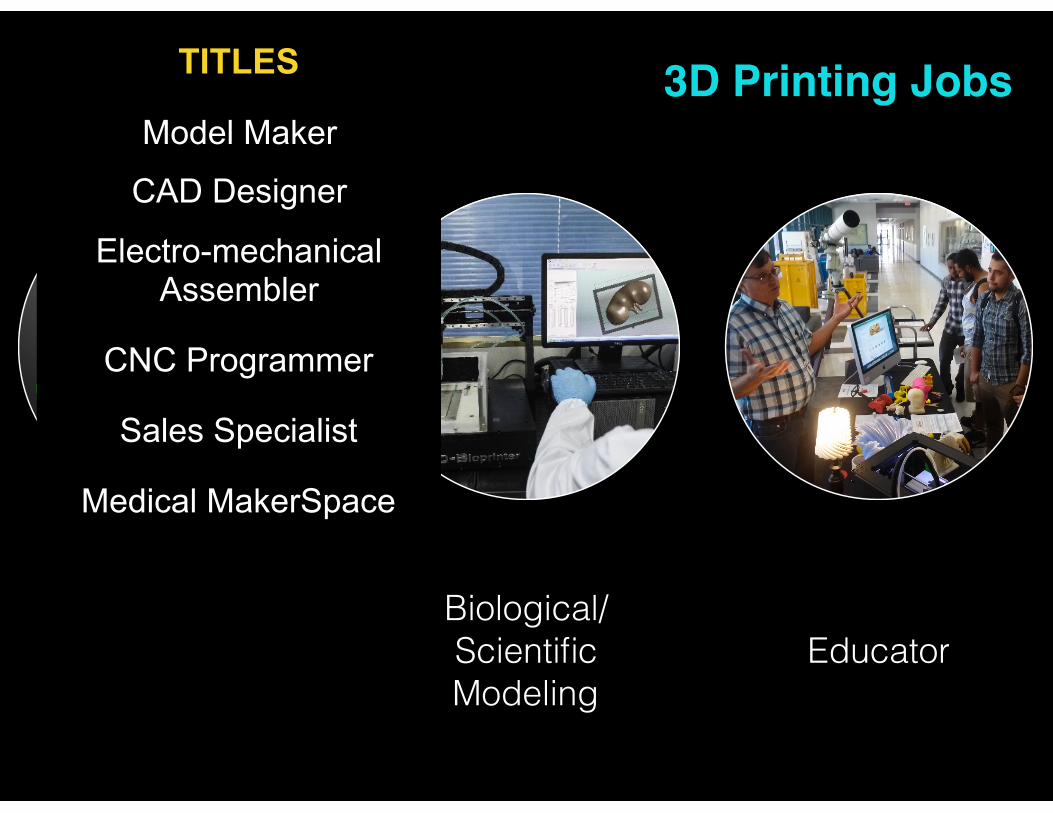
3D Printing Jobs
3D Computer-
Aided Design
Biological/Scientific Modeling
Educator
TITLES
Model Maker
CAD Designer
Electro-mechanical Assembler
CNC Programmer
Sales Specialist
Medical MakerSpace
32
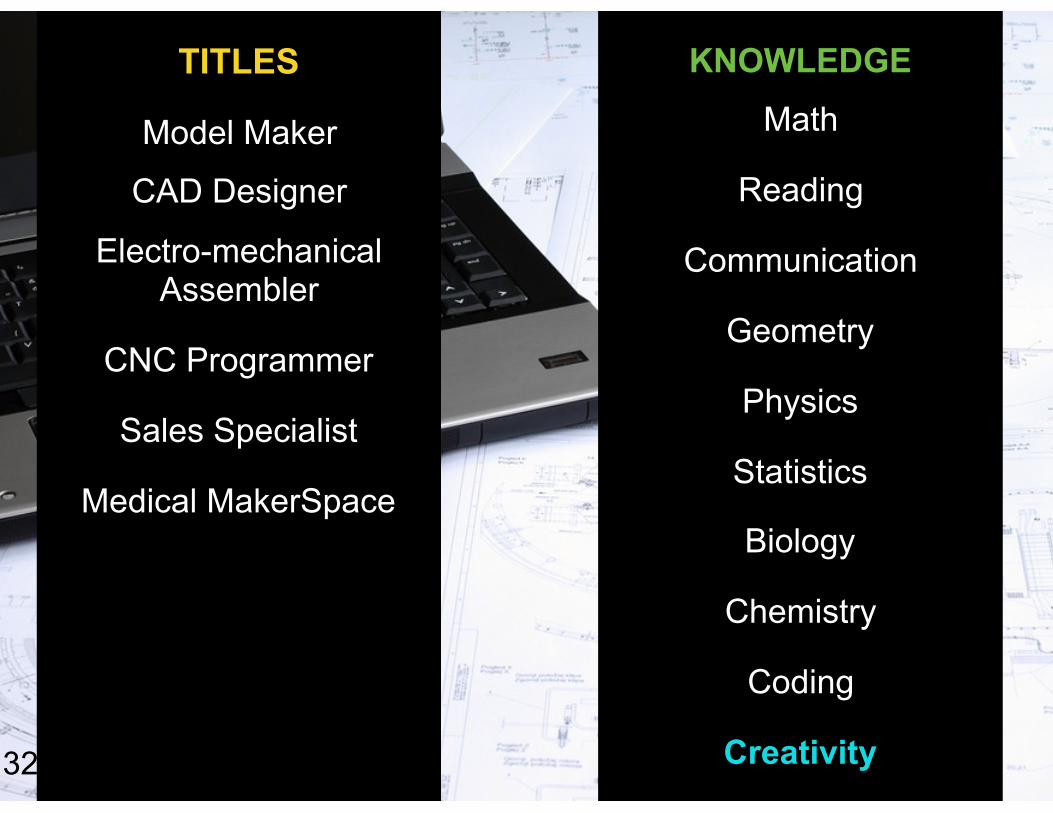
TITLES
Model Maker
CAD Designer
Electro-mechanical Assembler
CNC Programmer
Sales Specialist
Medical MakerSpace
KNOWLEDGE
Math
Reading
Communication
Geometry
Physics
Statistics
Biology
Chemistry
Coding
Creativity
• Body Level One
33
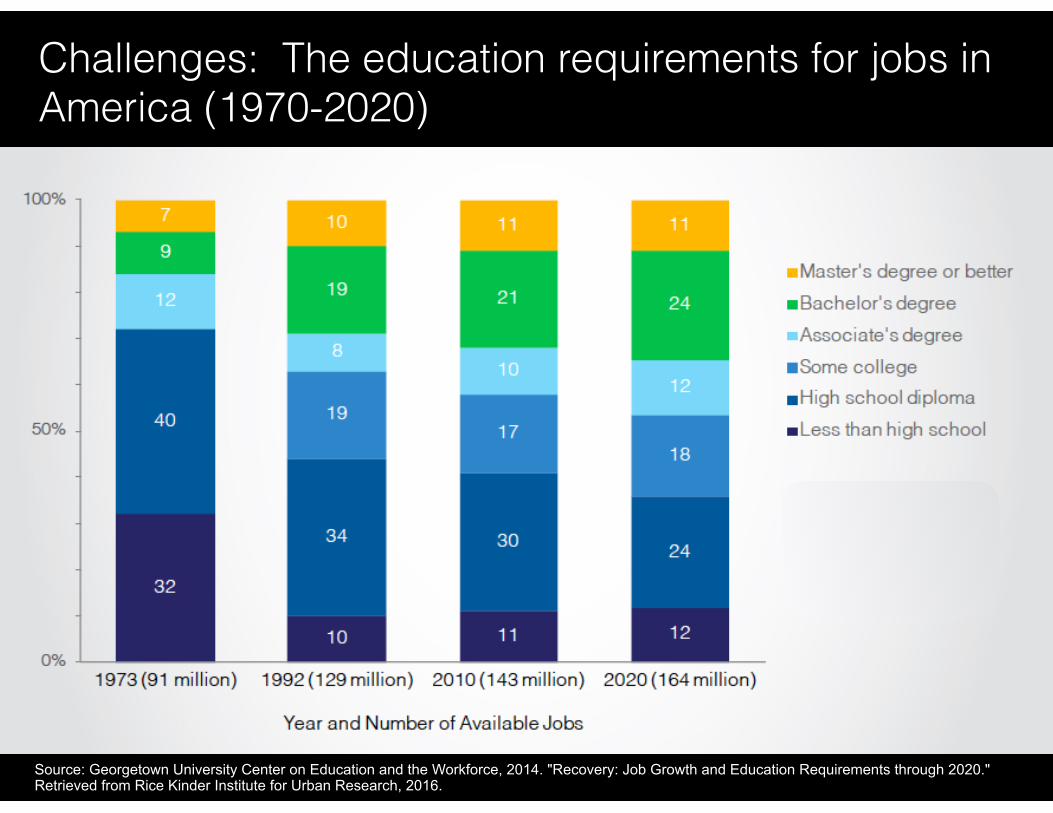
Challenges: The education requirements for jobs in America (1970-2020)
Source: Georgetown University Center on Education and the Workforce, 2014. "Recovery: Job Growth and Education Requirements through 2020." Retrieved from Rice Kinder Institute for Urban Research, 2016.
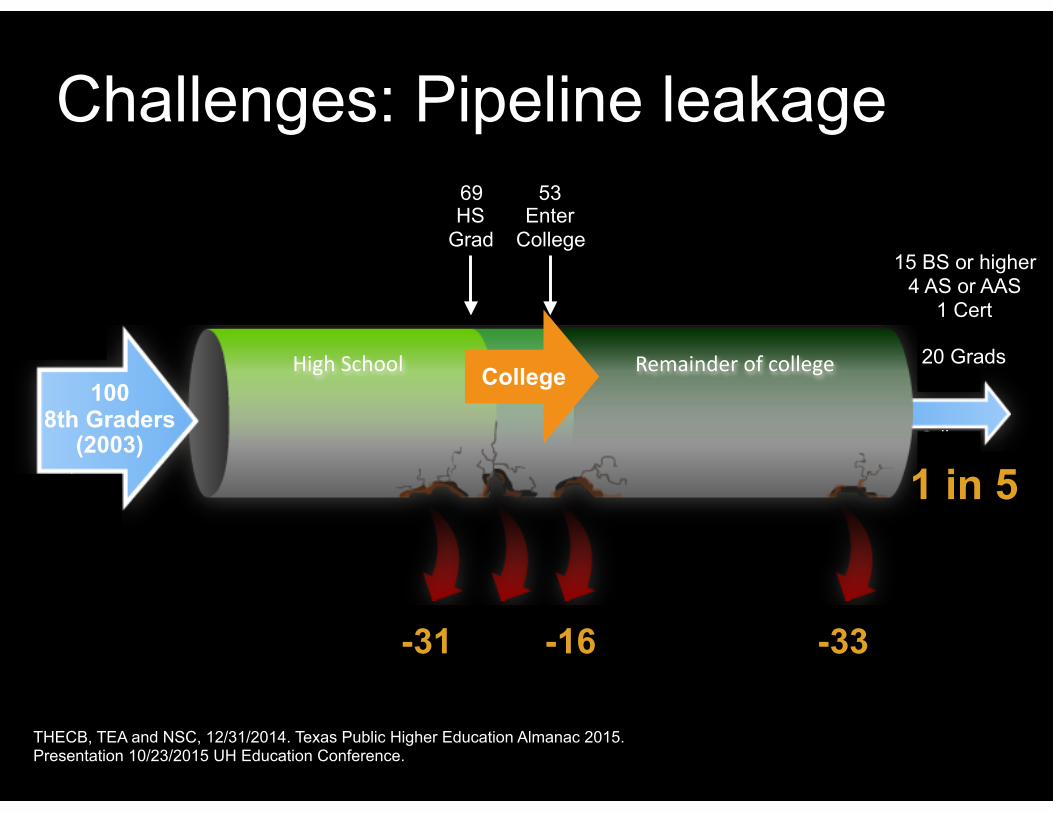
Challenges: Pipeline leakage
100######Ninth#Graders#
18###College#Graduates,#including#Associate’s#degrees#
First#year######of#college#
High#School# Remainder#of#college#
@32# @28# @13# @9#
#Graduate#
from##high#school#
on#Dme#
#Enroll#directly#in#college#
Are#sDll#enrolled#the#next#year#
27#68#40#
#Source:##Hunt,#J.#&#Tierney,#T.,#2006.##
-31 -16 -33
100 8th Graders
(2003)
69 HS
Grad
53 Enter
College15 BS or higher
4 AS or AAS 1 Cert
20 GradsCollege
THECB, TEA and NSC, 12/31/2014. Texas Public Higher Education Almanac 2015. Presentation 10/23/2015 UH Education Conference.
1 in 5
35Source: TEA Division of Performance Reporting, Texas Academic Performance Reports, 2012-13; 2014-15 District Attendance and Post Secondary Readiness Report. © Dr. Stephen L. Klineberg and the Kinder Institute for Urban Research
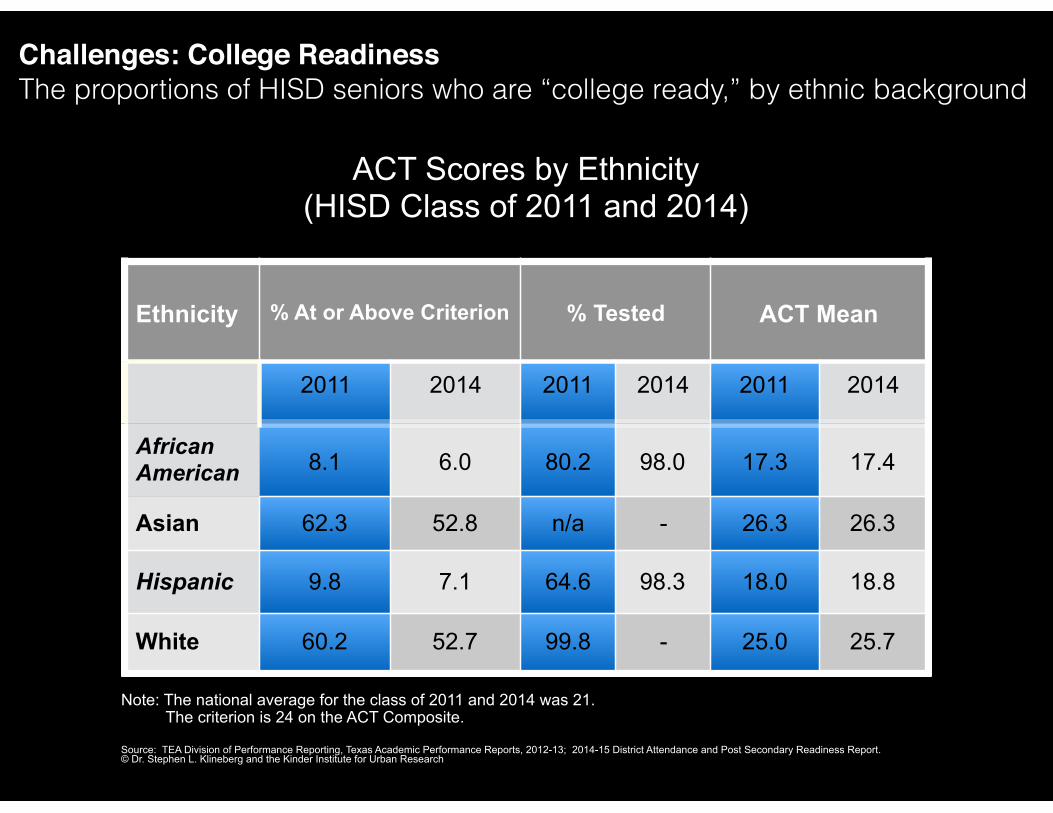
ACT Scores by Ethnicity (HISD Class of 2011 and 2014)
Ethnicity % At or Above Criterion % Tested ACT Mean
2011 2014 2011 2014 2011 2014
African American 8.1 6.0 80.2 98.0 17.3 17.4
Asian 62.3 52.8 n/a - 26.3 26.3
Hispanic 9.8 7.1 64.6 98.3 18.0 18.8
White 60.2 52.7 99.8 - 25.0 25.7
Note: The national average for the class of 2011 and 2014 was 21. The criterion is 24 on the ACT Composite.
Challenges: College ReadinessThe proportions of HISD seniors who are “college ready,” by ethnic background
36
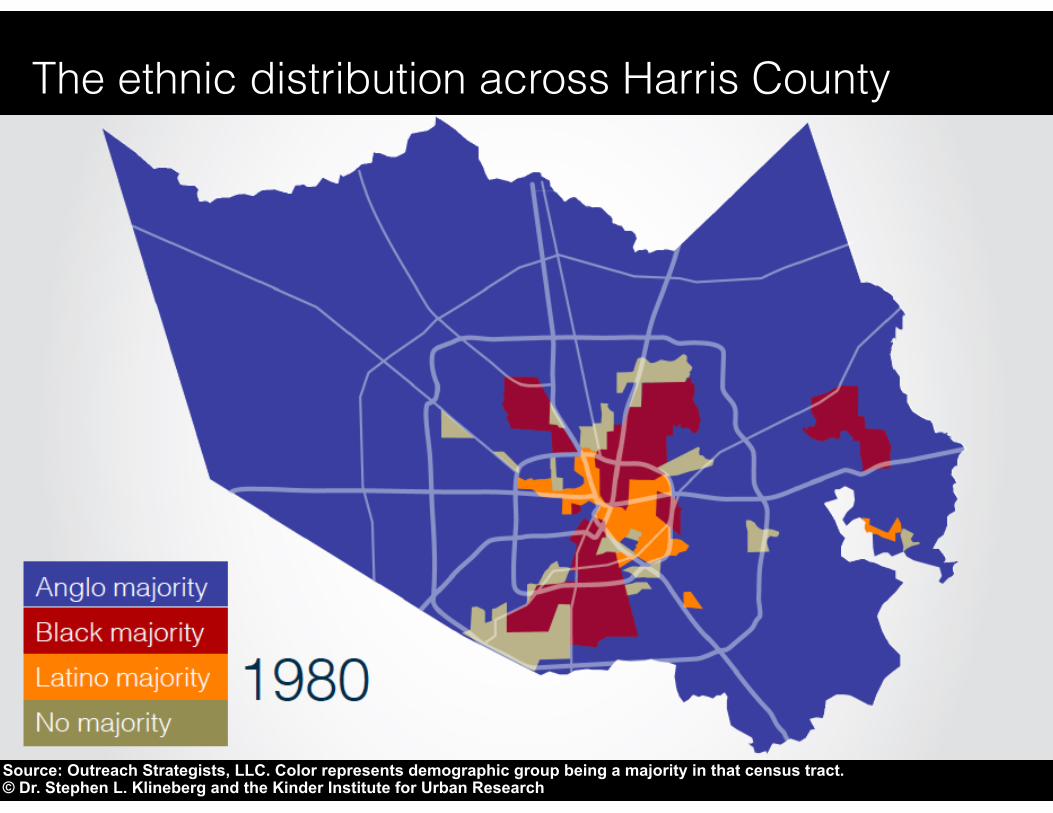
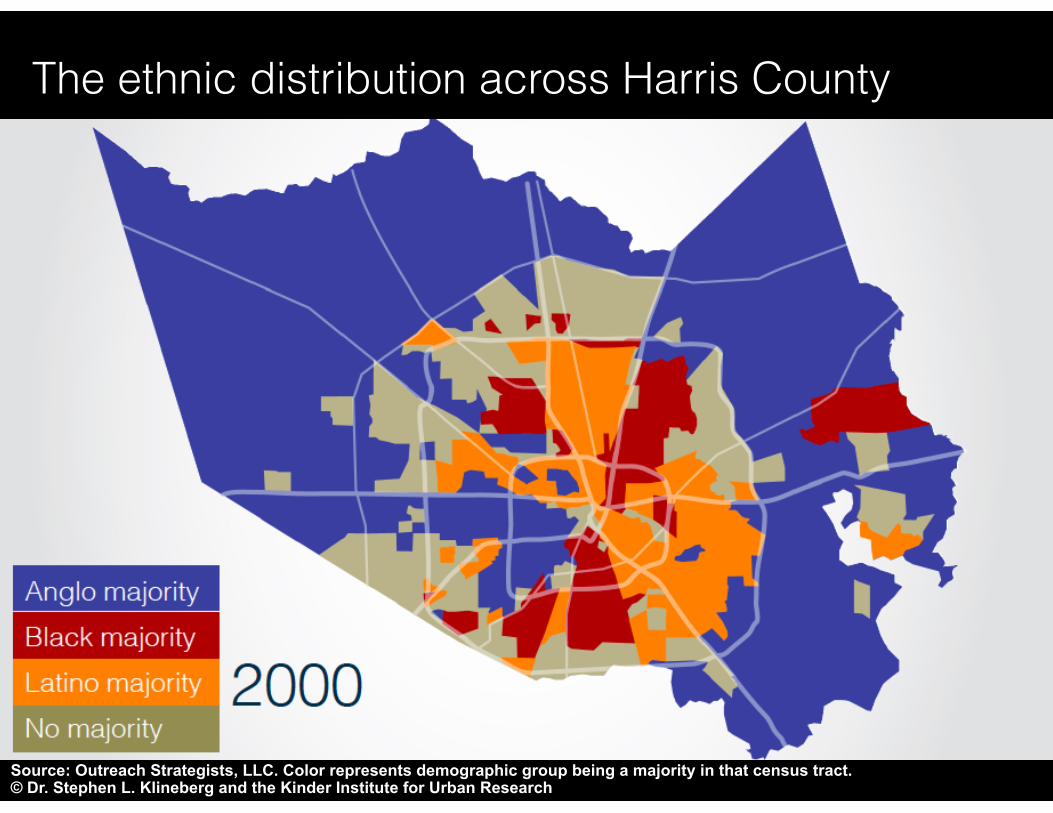
The ethnic distribution across Harris County
Source: Outreach Strategists, LLC. Color represents demographic group being a majority in that census tract. © Dr. Stephen L. Klineberg and the Kinder Institute for Urban Research
37
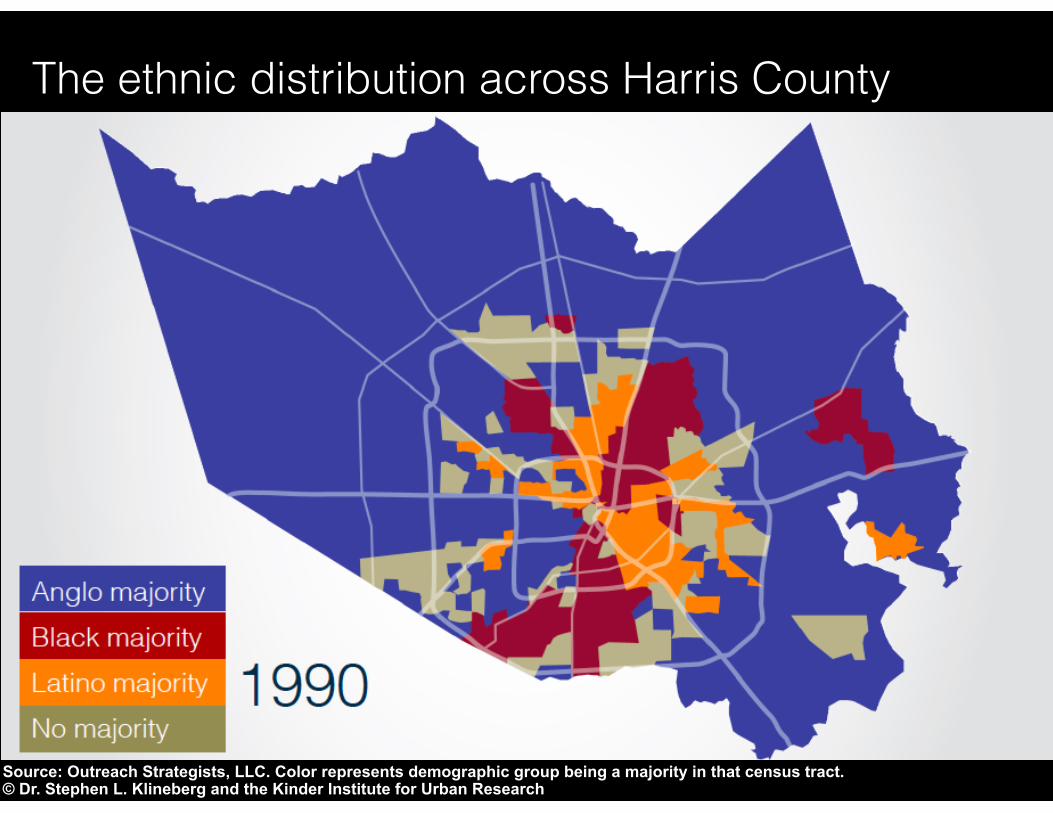
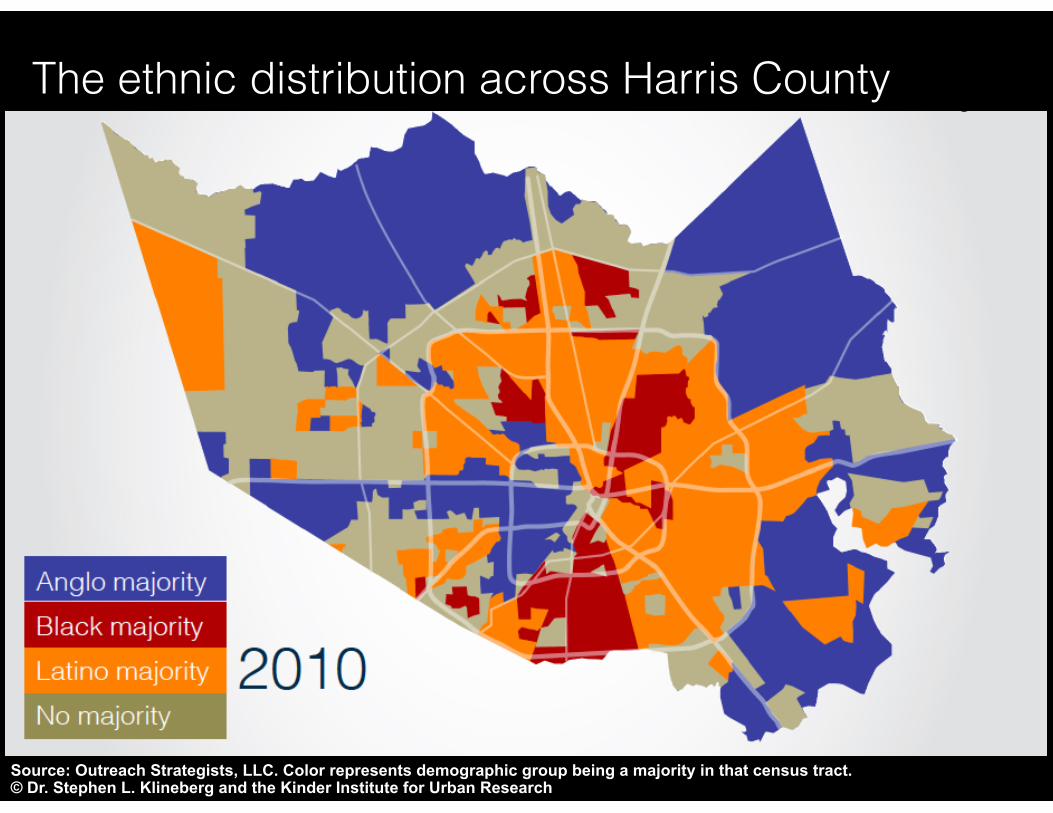
The ethnic distribution across Harris County
Source: Outreach Strategists, LLC. Color represents demographic group being a majority in that census tract. © Dr. Stephen L. Klineberg and the Kinder Institute for Urban Research
38
The ethnic distribution across Harris County
Source: Outreach Strategists, LLC. Color represents demographic group being a majority in that census tract. © Dr. Stephen L. Klineberg and the Kinder Institute for Urban Research
39
The ethnic distribution across Harris County
Source: Outreach Strategists, LLC. Color represents demographic group being a majority in that census tract. © Dr. Stephen L. Klineberg and the Kinder Institute for Urban Research
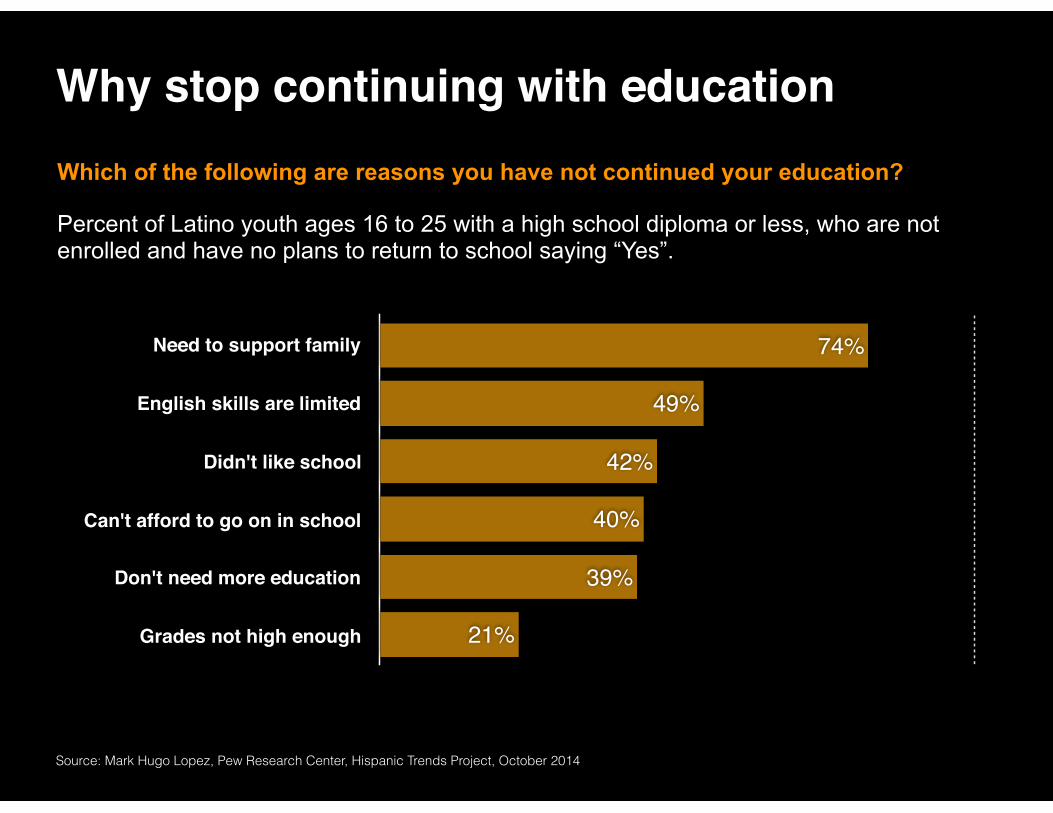
Why stop continuing with educationWhich of the following are reasons you have not continued your education?
Percent of Latino youth ages 16 to 25 with a high school diploma or less, who are not enrolled and have no plans to return to school saying “Yes”.
Need to support family
English skills are limited
Didn't like school
Can't afford to go on in school
Don't need more education
Grades not high enough 21%
39%
40%
42%
49%
74%
Source: Mark Hugo Lopez, Pew Research Center, Hispanic Trends Project, October 2014
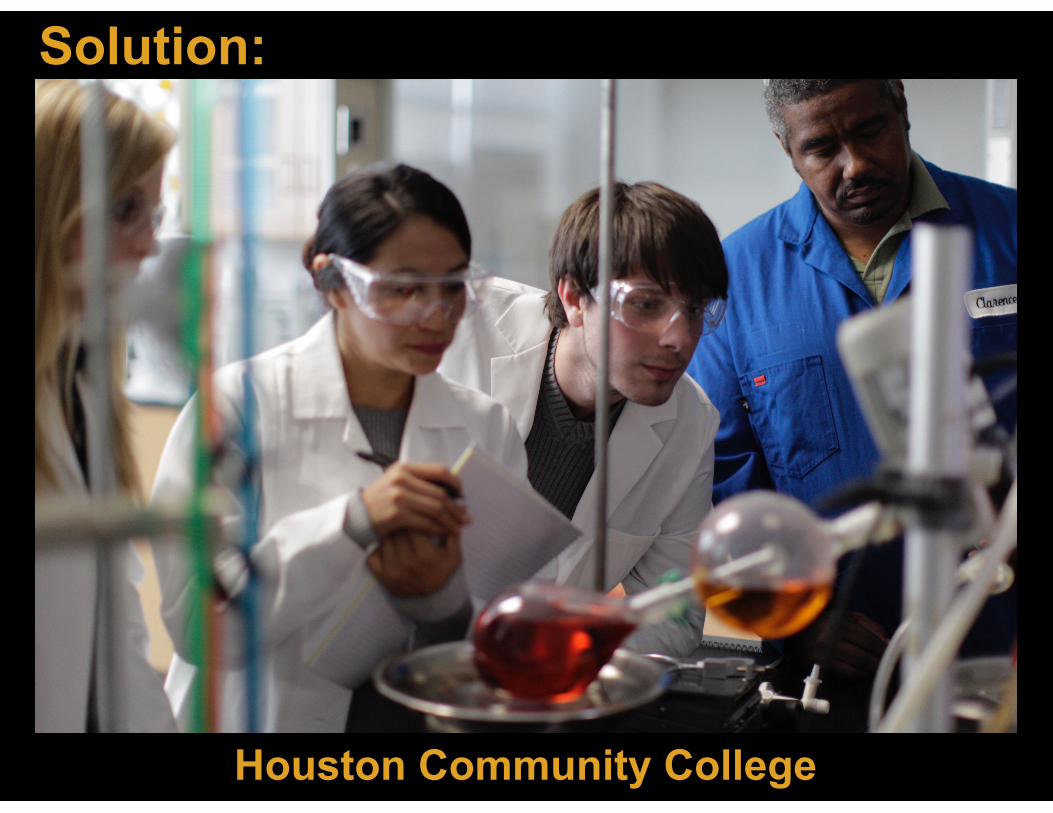
41 Houston Community College
Solution:

Don’t like school?
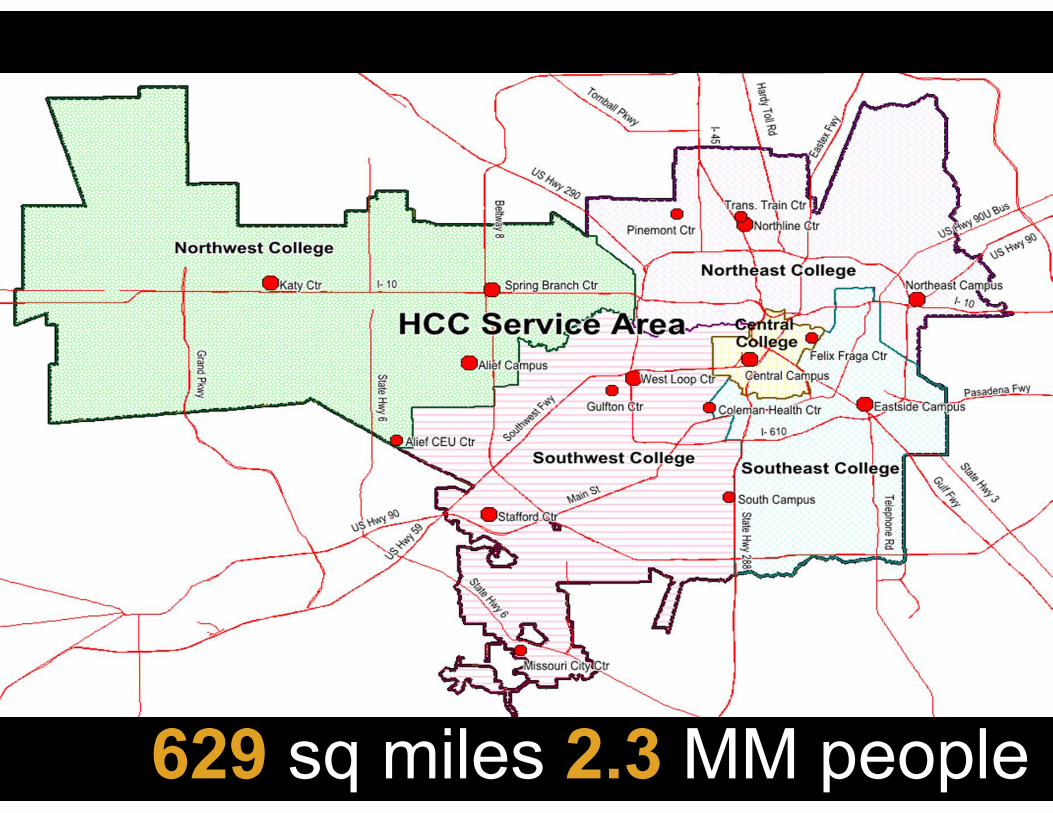
629 sq miles 2.3 MM people
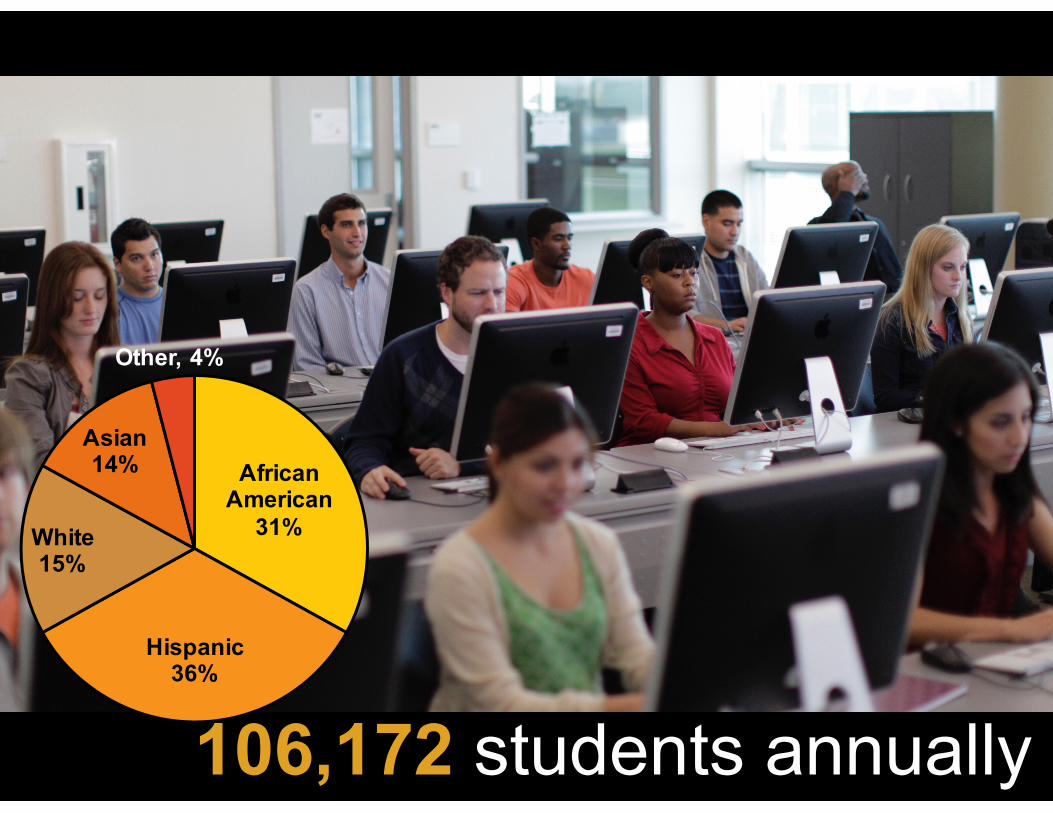
106,172 students annually
African American
31%
Hispanic36%
White15%
Asian14%
Other, 4%
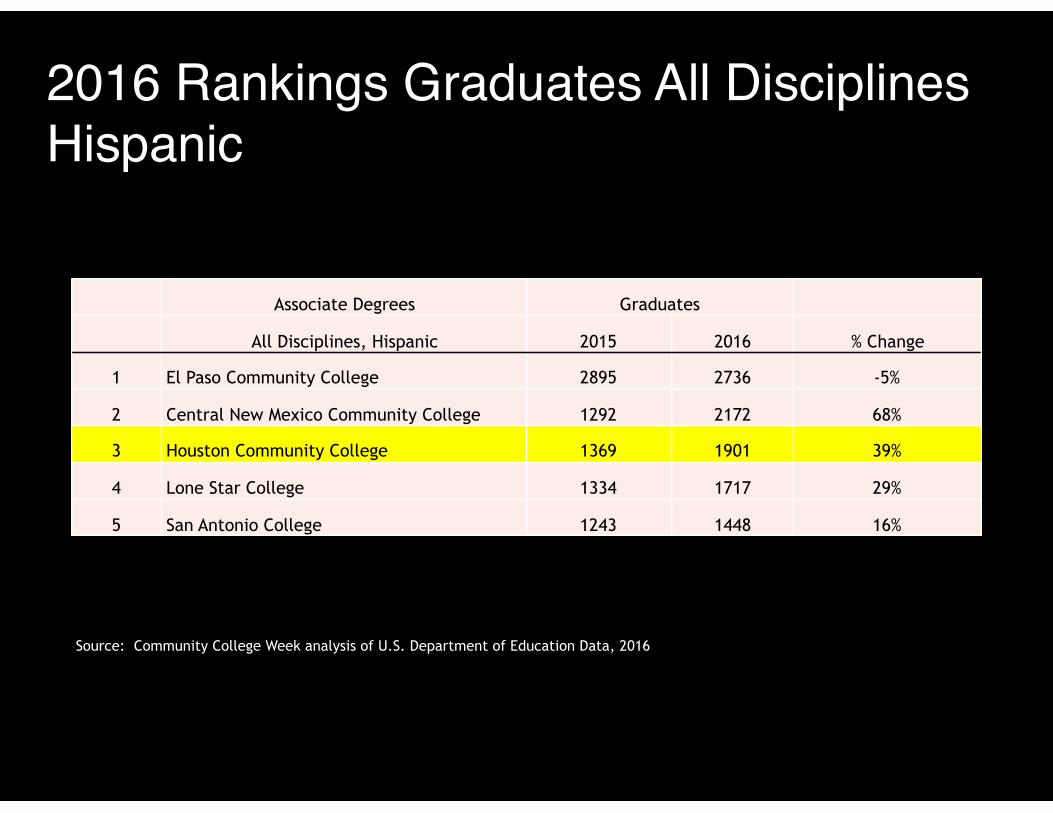
Associate Degrees Graduates
All Disciplines, Hispanic 2015 2016 % Change
1 El Paso Community College 2895 2736 -5%
2 Central New Mexico Community College 1292 2172 68%
3 Houston Community College 1369 1901 39%
4 Lone Star College 1334 1717 29%
5 San Antonio College 1243 1448 16%
Source: Community College Week analysis of U.S. Department of Education Data, 2016
2016 Rankings Graduates All DisciplinesHispanic
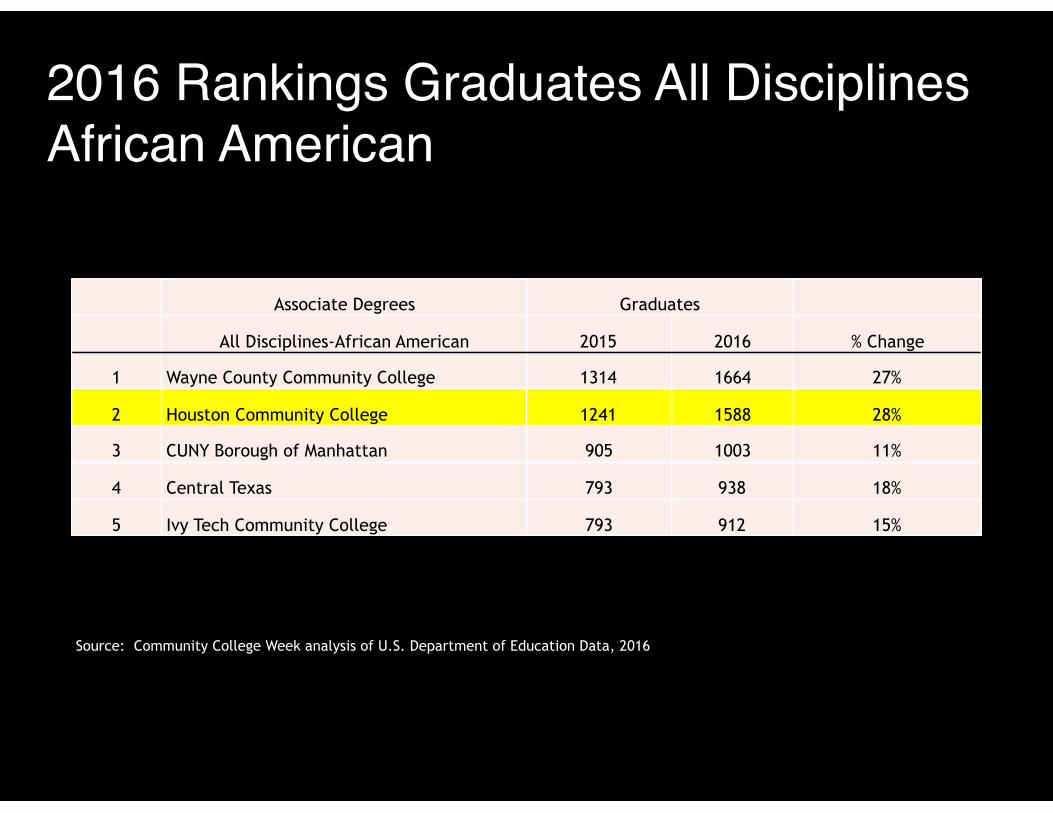
2016 Rankings Graduates All DisciplinesAfrican American
Source: Community College Week analysis of U.S. Department of Education Data, 2016
Associate Degrees Graduates
All Disciplines-African American 2015 2016 % Change
1 Wayne County Community College 1314 1664 27%
2 Houston Community College 1241 1588 28%
3 CUNY Borough of Manhattan 905 1003 11%
4 Central Texas 793 938 18%
5 Ivy Tech Community College 793 912 15%
2,400 classes daily
2,500 faculty
2,000 staff

50
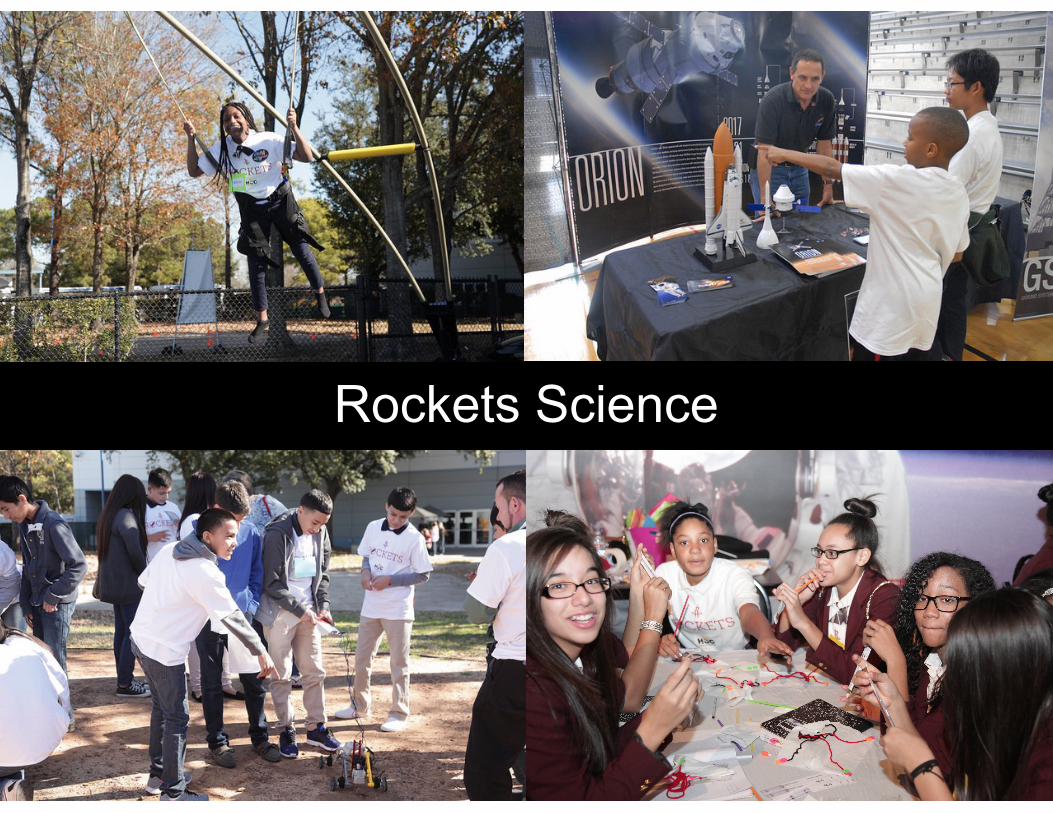
Rockets Science
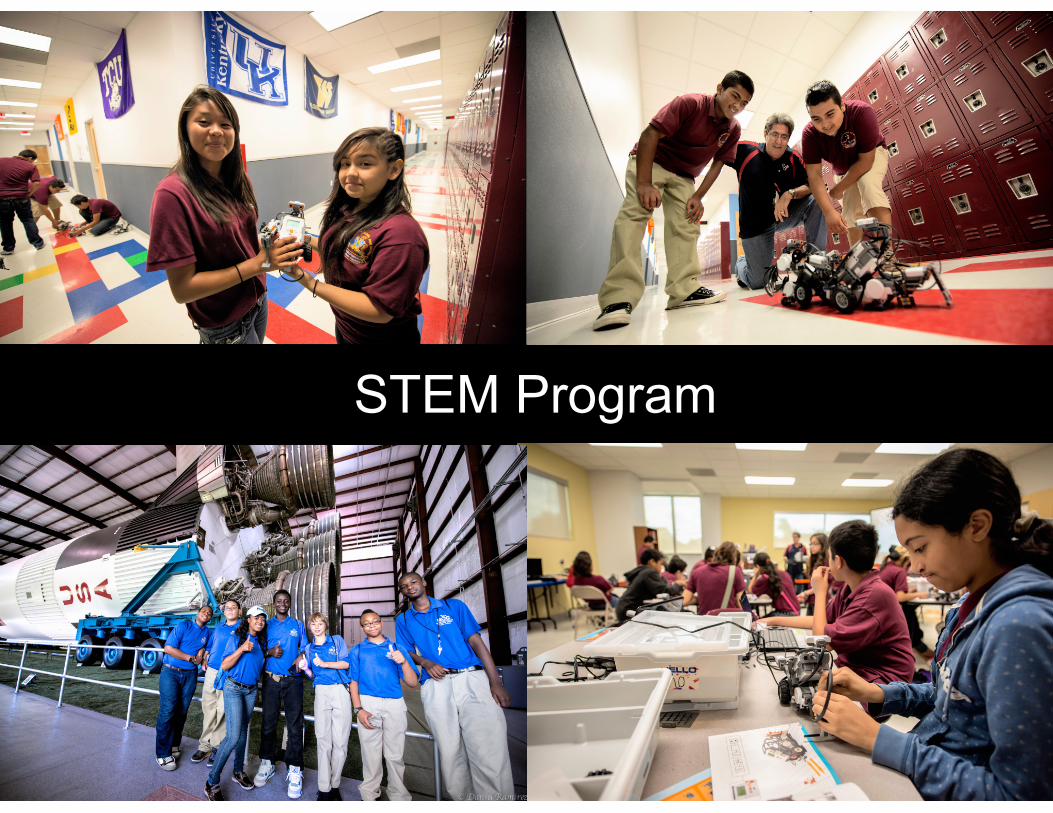
STEM Program
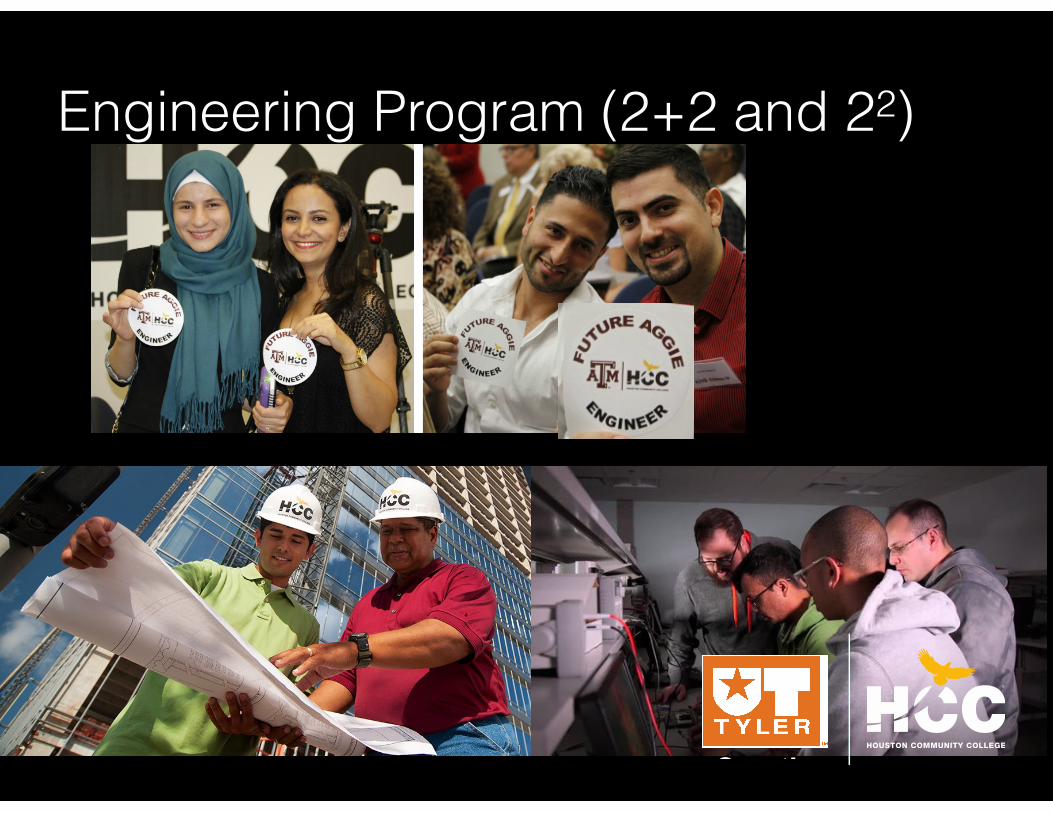
Engineering Program (2+2 and 22)
Creatin
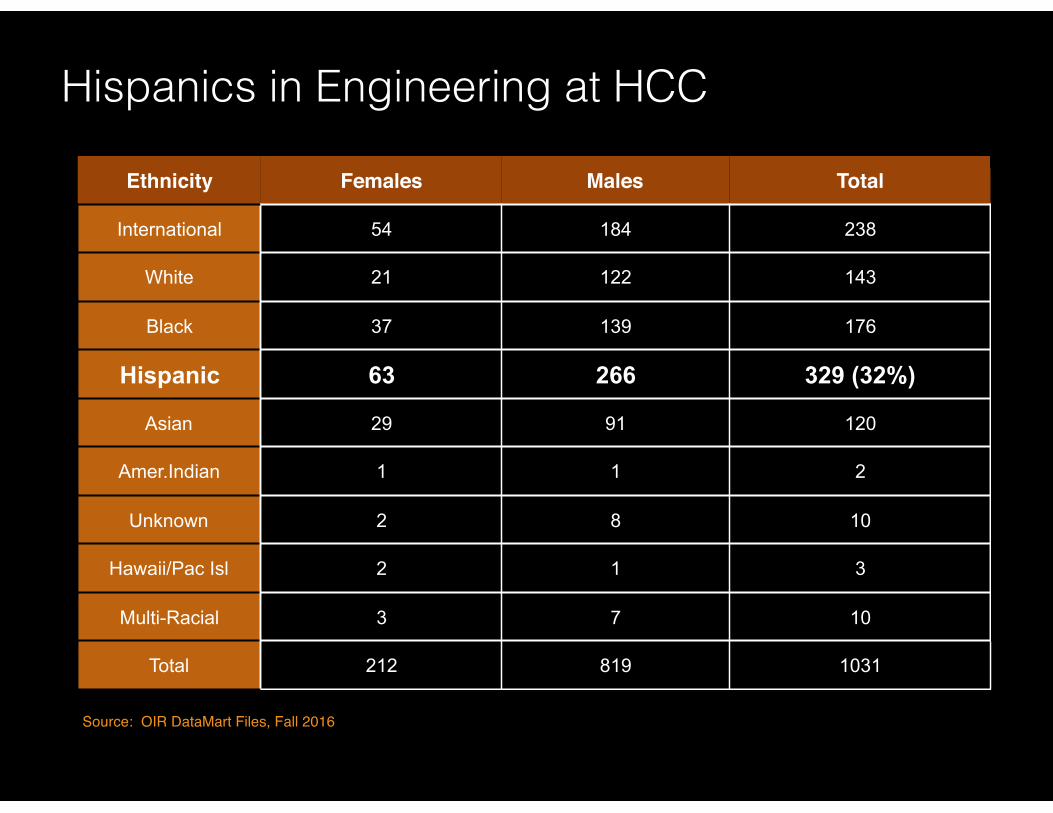
Hispanics in Engineering at HCC
Ethnicity Females Males Total
International 54 184 238
White 21 122 143
Black 37 139 176
Hispanic 63 266 329 (32%)
Asian 29 91 120
Amer.Indian 1 1 2
Unknown 2 8 10
Hawaii/Pac Isl 2 1 3
Multi-Racial 3 7 10
Total 212 819 1031
Source: OIR DataMart Files, Fall 2016
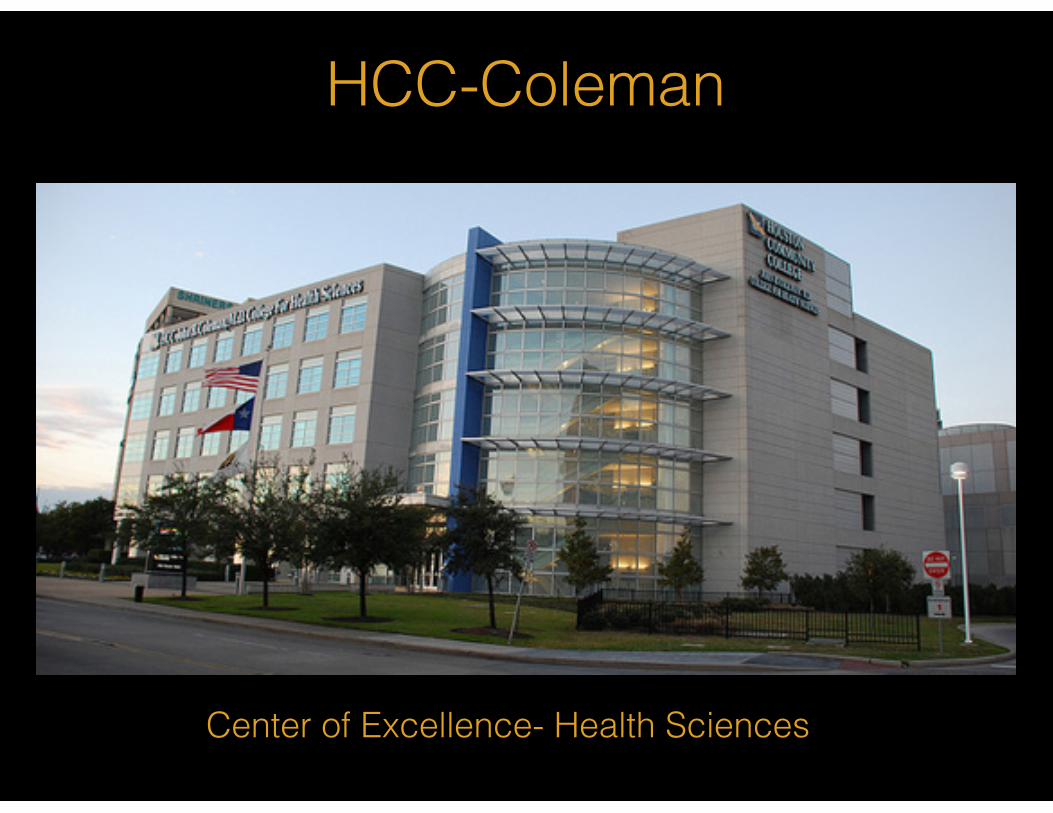
HCC-Coleman
Center of Excellence- Health Sciences
HCC UHD RN to BSN PROGRAM (22 )
1. Students will enroll at HCC to earn their ADN/RN.
2. Students will seamlessly begin their BSN at UHD in the same building at the Medical Center.
HCC Partners
1. Texas Industry Cluster Innovative Academies
2. Grant intended to add industry partners and expand Early College High Schools’ focus on STEM related programs