latvia’s productivity challenges - lu
TRANSCRIPT

Latvia’s productivity challenges
Massimo Suardi - European Commission, Directorate General
for Economic and Financial Affairs
25 November 2020

The role of productivity boards

Productivity boards in the EU
3

Role of productivity boards
• The Boards promote policies that enhance productivity and competitiveness of the EU
member states, informing the national debate via their analysis and contributions
• The Boards help to identify productivity’s long-term drivers – anything from real exchange
rates to education and innovation, to preparing for a greener and more digital future
• From an institutional set-up point of view, Boards should:
• enjoy functional autonomy
• be objective, neutral and independent in their analysis
• be able to actively participate in the public debate
• enjoy stable funding to undertake their activity on a continuous basis
• have appropriate access to information4

The current economic context
and policy response

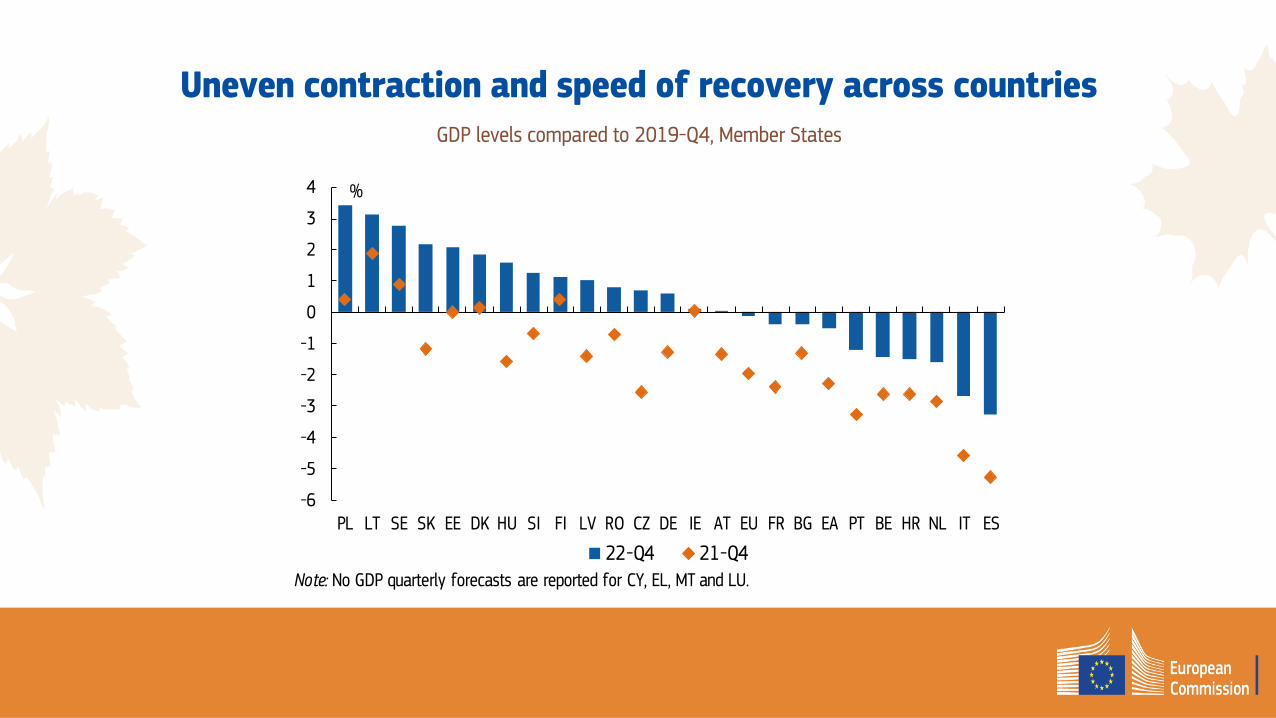
Uneven contraction and speed of recovery across countries
-6
-5
-4
-3
-2
-1
0
1
2
3
4
PL LT SE SK EE DK HU SI FI LV RO CZ DE IE AT EU FR BG EA PT BE HR NL IT ES
%
22-Q4 21-Q4Note: No GDP quarterly forecasts are reported for CY, EL, MT and LU.
GDP levels compared to 2019-Q4, Member States

Public deficits as % of GDP
Budgetary outlook2020 & 2021
8

Next Generation EU – Recovery and Resilience Facility

• Investments and reforms included in the RRPs should:
address challenges identified in the relevant country-specific recommendations;
contribute to the green and to the digital transitions;
strengthen the growth potential, job creation, economic & social resilience
• A minimum of 37% of funds related to climate (July European Council on the climate
mainstreaming target of 30%);
• A minimum of 20% of funds related to digital transition (agreement at the European
Council of October)
• All measures must respect the “do no significant harm” principle (Article 17 of the
Taxonomy Regulation, Regulation (EU) No 2020/852).
National Recovery and Resilience Plans
10
Productivity challenges in Latvia

Strong average productivity over 2 decades
• Latvia’s productivity growth averaged 4% annually
over 2000 - 2019
• It has slowed over time, yet remains solidly above EU
average (2.4% vs 0.9% annually over past 5 years)
• Poorer countries tend to grow faster but not all in the
same way:
• Rapidly catching-up – PL, EE, LV, LT, RO
• More slowly catching-up – BG
• Started richer and still converging – CZ, SI, HR
• Started richer but falling behind – CY, SK, HU
-20.0
0.0
20.0
40.0
60.0
80.0
100.0
CY SI CZ HR SK HU PL EE LT LV BG RO
Productivity per person, % of EU average
2000 2000 - 2010 2010 - 2019 2019
12

Strong growth in services, less in manufacturing
• In the early phase, productivity
growth in Latvia’s services was
stronger than in manufacturing
• Estonia and Lithuania ran ahead
with much stronger productivity
growth in manufacturing
• In the later phase, productivity
growth in manufacturing has
proved more resilient
0.0%
1.0%
2.0%
3.0%
4.0%
5.0%
6.0%
7.0%
8.0%
9.0%
Manufacturing Market services Manufacturing Market services
2000-2010 2010-2019
Sectoral productivity growth, % per year
EE LV LT13

Exports weaker than in the other Baltics
• A lower export share of GDP may
partly explain why Latvia’s productivity
is lower than its Baltic peers
• Latvia specialised in transit and
financial services, which proved to
have lower growth potential than
manufacturing
• Recent specialization in IT services is
proving to be more promising
0
5
10
15
20
25
30
Services exports, % of GDP
EE LV LT
0
10
20
30
40
50
60
70
Goods exports, % of GDP
EE LV LT
14
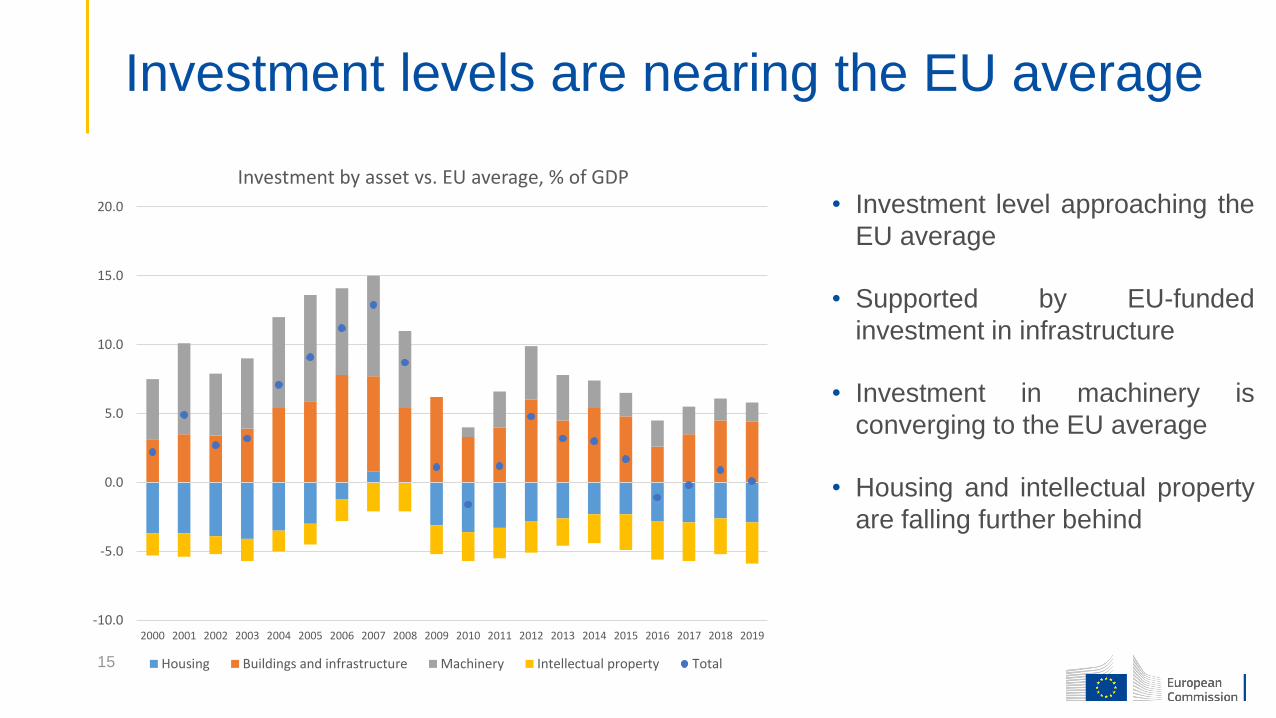
Investment levels are nearing the EU average
• Investment level approaching the
EU average
• Supported by EU-funded
investment in infrastructure
• Investment in machinery is
converging to the EU average
• Housing and intellectual property
are falling further behind
-10.0
-5.0
0.0
5.0
10.0
15.0
20.0
2000 2001 2002 2003 2004 2005 2006 2007 2008 2009 2010 2011 2012 2013 2014 2015 2016 2017 2018 2019
Investment by asset vs. EU average, % of GDP
Housing Buildings and infrastructure Machinery Intellectual property Total15

• Strengths and opportunities
• Low public debt and deficit, balanced
current account and low private
indebtedness
• Flexible labour markets and
favourable business environment
• Dynamic IT sector well developed
public IT services
• High share of renewables
Productivity strengths and challenges
• Challenges
• Large shadow economy, affecting tax
compliance
• Low investment in Research & Development
• Perceived lack of fair competition in public
procurement
• Growing regional inequality and affordable
housing in peripheral regions
• Population decline: ageing of the working-
age population, shortage of digital and
STEM skills, higher per capita cost of
infrastructure
16
Conclusion

• The plans should address challenges identified by the analysis and recommendations in
the European Semester and build on a long-term sustainable growth strategy
• Securing continued productivity growth is one of Latvia’s key challenges. Achieving this
would help to address demographic challenges and ensure that growth is more inclusive
• Enhancing productivity growth requires enabling reforms and targeted investment,
addressing the weakness and opening new opportunities building on a country’s
strengths
• Productivity boards are well-placed to provide valuable expertise and facilitate an
exchange of ideas amongst relevant actors. This will help policy-makers in setting
priorities and designing effective policy interventions
A role for productivity boards in the recovery and resilience plans
18

Thank you!