launch business state of play - nasa launch systems –multiple measures (slide 19), ^est total kg...
TRANSCRIPT
The State of PlayUS Space Systems Competitiveness
Prices, Productivity, and Other Measures of Launchers & Spacecraft
Edgar ZapataNASA Kennedy Space Center
Presentation to the Future In-Space Operations (FISO) SeminarOctober 11, 2017
https://ntrs.nasa.gov/search.jsp?R=20170009968 2018-07-28T13:17:33+00:00Z

09/25/2017
Launches - US Major Launches (slide 9), & US Launch Tempo (slide 24) for launch of Atlas V September 23, 2017 …NRO
- Global Commercial (slide 23) for launch of Proton September 11, 2017 …Amazonas
- US Major Launches (slide 9), & US Launch Tempo (slide 24) for launch of Falcon 9 September 7, 2017 …X-37
- US Major Launches (slide 9), Global Commercial (slide 23) & US Launch Tempo (slide 24) for launch of Falcon 9 August 24, 2017 …Formosat
- US Major Launches (slide 9), & US Launch Tempo (slide 24) for launch of Atlas V August 18, 2017 …TDRS
- US Major Launches (slide 9), Global Commercial (slide 23) & US Launch Tempo (slide 24) for launch of Falcon 9 August 14, 2017 …CRS-12
- US Major Launches (slide 9), Global Commercial (slide 23) & US Launch Tempo (slide 24) for launch of Falcon 9 July 5, 2017 …Intelsat
- Launch Systems – Multiple Measures (slide 19), “Best” Total kg in a year by any Model, for Falcon 9 ->13 launches to date in 2017
- Global Commercial (slide 23) for launch of Ariane 5 May 4, 2017
Other
- Commercial Crew test flight dates (slide 6)
06/26/2017
Launches - US Major Launches (slide 9), Global Commercial (slide 23) & US Launch Tempo (slide 24) for launch of Falcon 9 June 25, 2017 …Iridium
- US Major Launches (slide 9), Global Commercial (slide 23) & US Launch Tempo (slide 24) for launch of Falcon 9 June 23, 2017 …Bulgariasat
- Global Commercial (slide 23) for launch of Proton June 7, 2017
- US Major Launches (slide 9), Global Commercial (slide 23) & US Launch Tempo (slide 24) for launch of Falcon 9 June 3, 2017 …CRS-11
- Global Commercial (slide 23) for launch of Ariane 5 June 1, 2017
- Global Commercial (slide 23) for launch of Soyuz (Arianespace/French Guiana) May 18, 2017
- US Major Launches (slide 9), Global Commercial (slide 23) & US Launch Tempo (slide 24) for launch of Falcon 9 May 15, 2017 …Inmarsat
- Global Commercial (slide 23) for launch of Ariane 5 May 4, 2017
- US Major Launches (slide 9), & US Launch Tempo (slide 24) for launch of Falcon 9 May 1, 2017 …NRO
Other - Commercial Crew: Update to dates of 1st flights (slide 9)
- Budget: Updates for 2017 budget deal May 1, 2017 (slide 8), after the 2017 Continuing Resolution
- SLS: Corrected labeling of SLS data point (slide 10); point does include a % of ground systems
- Orion: Updates to Orion data text description (slide 20)
- Commercial crew/cargo: Clarification on crew/cargo data text description (slide 21)
2
Updates
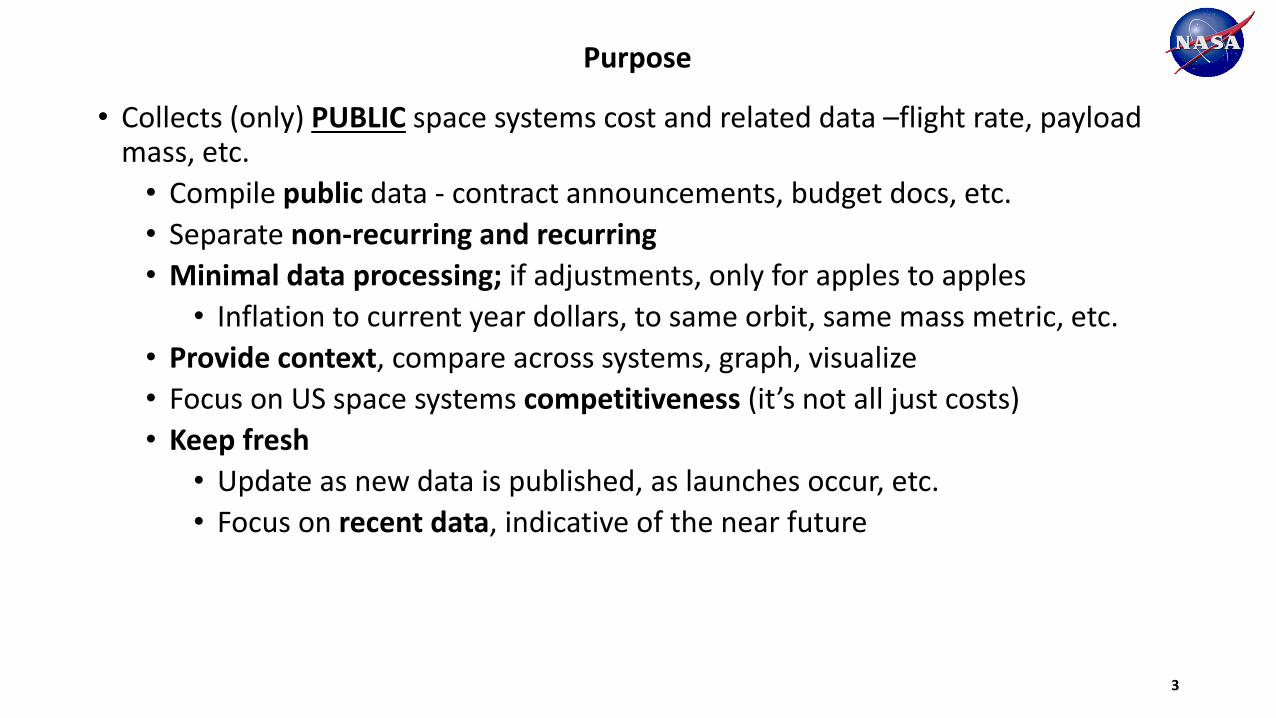
• Collects (only) PUBLIC space systems cost and related data –flight rate, payload mass, etc.
• Compile public data - contract announcements, budget docs, etc.
• Separate non-recurring and recurring
• Minimal data processing; if adjustments, only for apples to apples
• Inflation to current year dollars, to same orbit, same mass metric, etc.
• Provide context, compare across systems, graph, visualize
• Focus on US space systems competitiveness (it’s not all just costs)
• Keep fresh
• Update as new data is published, as launches occur, etc.
• Focus on recent data, indicative of the near future
3
Purpose

Lets do the math
4
Purpose
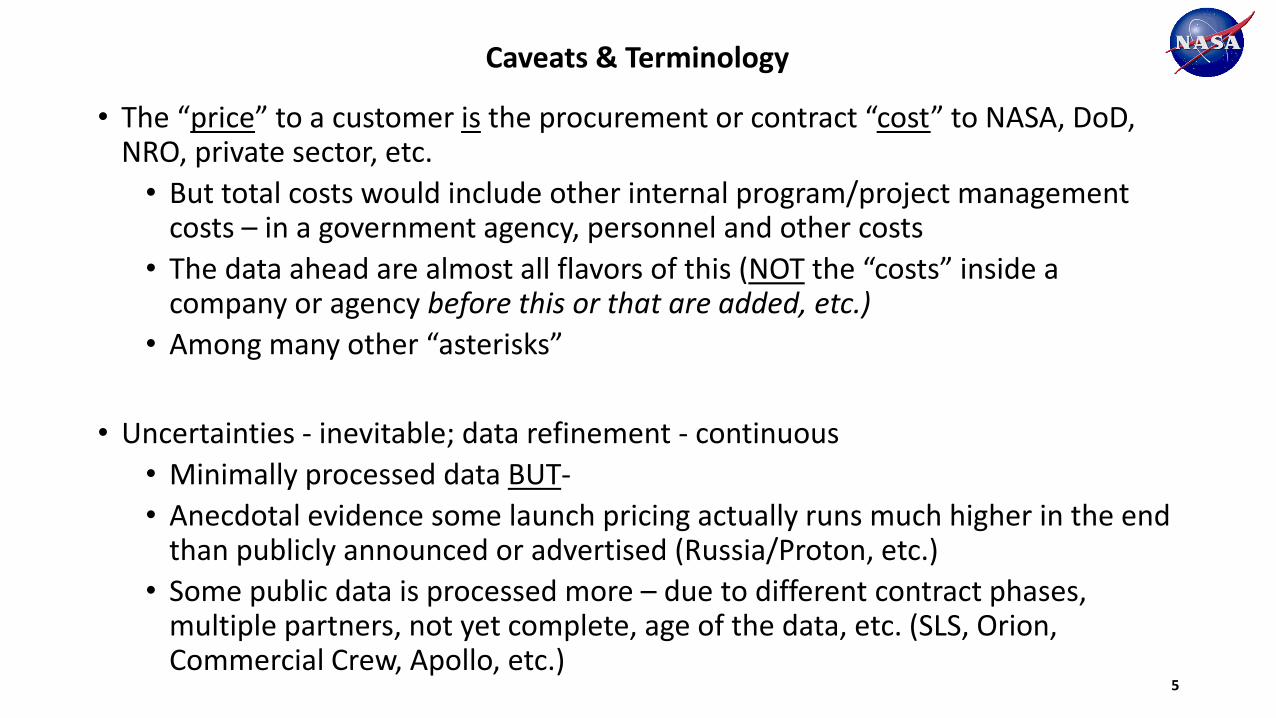
• The “price” to a customer is the procurement or contract “cost” to NASA, DoD, NRO, private sector, etc.
• But total costs would include other internal program/project management costs – in a government agency, personnel and other costs
• The data ahead are almost all flavors of this (NOT the “costs” inside a company or agency before this or that are added, etc.)
• Among many other “asterisks”
• Uncertainties - inevitable; data refinement - continuous
• Minimally processed data BUT-
• Anecdotal evidence some launch pricing actually runs much higher in the end than publicly announced or advertised (Russia/Proton, etc.)
• Some public data is processed more – due to different contract phases, multiple partners, not yet complete, age of the data, etc. (SLS, Orion, Commercial Crew, Apollo, etc.)
5
Caveats & Terminology

• Source data for this report is available in the Life Cycle Cost (LCC) Model
• Data sheets are available upon request to NASA, government, government contractors or for peer/collaborative purposes
• Contact [email protected]
6
Source Data
The NASA Life Cycle Cost (LCC) Model
Updates
12/7/2016
Launch System Life Cycle Cost Model
NASA Scenarios Model for Human Exploration & Operations
Budgets vs. Life Cycle Costs
Data

Example Data Sheet
Nominal or
Inflated
Document public source, pp., doc, etc.
Document and justify adjustments
(like “no EUS”)
7
Source Data
NON-RECURRING COSTS
Sources: re. Notes Below 4,532.2$ 2,374.5$
Year 2006 2007 2008 2009 2010 2011 2012 2013 2014 2015 2016 2017 2018 2019 2020 2021 2022 2023
$M Real Year 839.2$ 479.5$ 889.5$ 1,387.2$ 1,640.0$ 1,196.0$ 1,200.0$ 1,113.8$ 1,197.0$ 1,194.0$ 1,270.0$ 1,350.0$ 1,119.9$ 1,123.9$ 1,135.1$ 1,153.3$ 1,175.8$ 1,198.7$
Sum Procurement & Gov't 2006 to here in RY $> 12,406$ Sum Procurement & Gov't 2017 to here in RY $> 8,257$
Inflation adjustment to 2017 per NASA
Inflation Index 1.276 1.244 1.213 1.185 1.160 1.138 1.127 1.105 1.080 1.066 1.036 1.000 1.025 1.051 1.078 1.104 1.130 1.157
$M 2017$ 1,071.0$ 596.7$ 1,078.6$ 1,643.8$ 1,902.5$ 1,361.5$ 1,352.7$ 1,230.4$ 1,292.4$ 1,272.4$ 1,315.6$ 1,350.0$ 1,092.1$ 1,068.9$ 1,053.3$ 1,044.7$ 1,040.3$ 1,035.7$
Sum Procurement & Gov't 2006 to here in 2017$> 14,117$ Sum Procurement & Gov't 2017 to here in 2017$> 7,685$
Sum Procurement $ ONLY 2006 to here in 2017$ -> 12,605$ Sum Procurement $ ONLY 2017 to here in 2017$ -> 6,862$ <-CAUTION!
(?) (?) Feeds sheet "Scen-Data Deck"
From above data Scen-Data Deck
Cx Era 2006 to 2010 and 2011 $M nom. Total Orion Development Procurement ONLY $M in 2017$ 19,466$
5,235$
6,431.4$
Orion nom.-year 2012-2021 $M
11,857$ <- Compare -> Apx. Program LCC per GAO Mar. 2016 Total nom. $ Total in 2017$
See GAO-16-309SP 20,663$ 21,802$
Orion nom. year 2011-2021 11,284$ <- ok
13,053$
This data sheet gathers all the PUBLIC NASA budget data for this program and indicates all the source documents.
The actual costs to date are the sum of the budgets through the date indicated, usually up to the current year, with the
numbers after being the planned budgets from the same documents.
Minor adjustments include seperating out Government program/project management, civil servants et al, vs. the contractor
"procurement" dollars, as well as creating a new line in current year dollars using the official NASA inflation indices.
NOTE! "Actuals" PUBLIC budget data, actual costs, appear in NASA budget documents a year or more after the budget year
indicated. For example, the "Actual" 2008 budget data is found in the 2010 NASA budget request.
The OFFICIAL RECORD INDICATES:
This is the data for Orion, before 2015 (aka CEV, MPCV) in Real Year $M:
2006=$839.2 (re. 2008 budget doc, 168652main_NASA_FY08_Budget_Request.pdf, pg. 308)
2007=$479.5 (re. 2009 budget doc, 210019main_NASA_FY09_Budget_Estimates.pdf, pg. 6)
+dist. PI&O; add 49%, i.e., 2007=$714.5
2008=$889.5 ("actual", re. 2010 budget doc, 345225main_FY_2010_UPDATED_final_5-11-09_with_cover.pdf, pg. 8)
+dist. PI&O; add 32%, i.e., 2008=$1174.1
2009=$1,387.2 ("enacted", not "actual" -re. 2010 budget doc, 345225main_FY_2010_UPDATED_final_5-11-09_with_cover.pdf,
pg. 8)
+dist. PI&O; add 26%, i.e., 2009=$1,747.9
2010=$1,383.5 ("request" not actual, -re. 2010 budget doc, 345225main_FY_2010_UPDATED_final_5-11-09_with_cover.pdf, pg.
8)
+dist. PI&O; 2010 =$1,640
2011=$1,196.0 (re. 2013 budget doc, 622655main_FY13_NASA_Budget_Estimates.pdf, pg. 4)
2012=$1,200.0 (re. 2014 budget doc, 740512main_FY2014 CJ for Online.pdf, pg. 8)
2013=$1,113.8 (re. 2015 budget doc, 508_2015_Budget_Estimates.pdf, pg. 5)
2014=$1,197.0 ("actual", -re. NASA_FY_2016_Budget_Estimates.pdf, pg 5 = BUD-5)
2015=$1,194.0 (ESTIMATED / TENTATIVE - NASA_FY_2016_Budget_Estimates.pdf)
($1,190.2 "operating plan" value per "fy_2017_budget_estimates.pdf")
Then, inflation adjustments to 2017$, and removing 12% (government management; The model adds this back in seperately),
the "industry/procurement" portion of this would be apx. $12,605M spent on Orion before 2017 in 2017$.
2016-2022
1. Build of year by year nominal budget data:
2016 = $ 1,270M
p. 182, 2016-CPRT-114-HPRT-RU00-SAHR2029-AMNT1final.pdf
2017 - from FY 2017 budget deal - 2017 z-fy 17 wrapup budget deal -CPRT-115-HPRT-RU00-SAHR244-AMNT.pdf
=$$1,350M
Also see sheet "Data-NASA Budget" for detail
2018 - 2021 -> p. BUD-4, fy_2017_budget_estimates.pdf
NOTE! Senate version 2017 = $1,300M (not $1,270M)
http://spacenews.com/senate-bill-cuts-other-nasa-programs-to-fund-sls-and-orion/
http://www.spacepolicyonline.com/news/senate-appropriators-approve-19-3-bill ion-for-nasa-for-fy2017
2022 - 2023 use same as 2021, but with average 2003 to date historical budget increases of 1.95% above 2021.
2. Removed 12% (estimated) from the above budget data for government management. (The model adds this back in
seperately).
i .e., Orion Development Sum Procurement $ ONLY remaining to completion, 2016 to 2023, in 2017 $ as shown.

8
The NASA Budget – Purchase Power Drop Since 2003 = 9%
4/18/14>
1/9/14>Antares
11/18/13 Atlas>
1/23/14 Atlas>
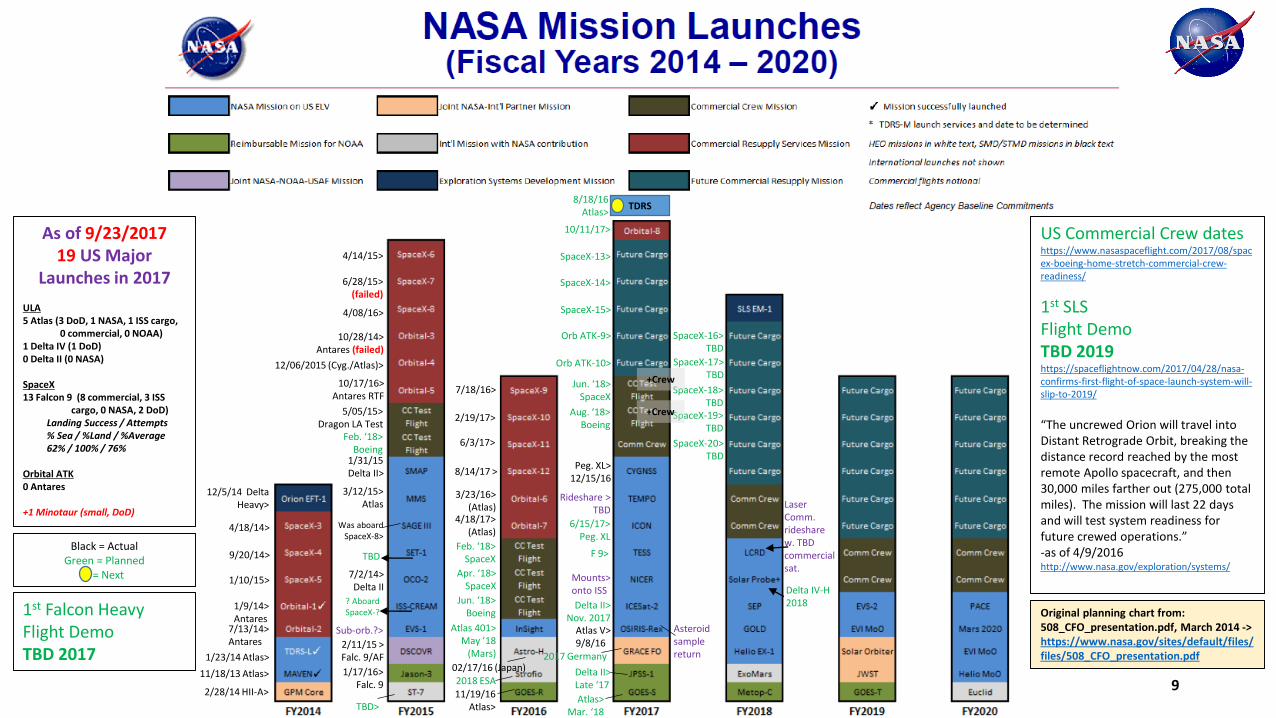
US Commercial Crew dateshttps://www.nasaspaceflight.com/2017/08/spacex-boeing-home-stretch-commercial-crew-readiness/
1st SLSFlight DemoTBD 2019https://spaceflightnow.com/2017/04/28/nasa-confirms-first-flight-of-space-launch-system-will-slip-to-2019/
“The uncrewed Orion will travel into Distant Retrograde Orbit, breaking the distance record reached by the most remote Apollo spacecraft, and then 30,000 miles farther out (275,000 total miles). The mission will last 22 days and will test system readiness for future crewed operations.”-as of 4/9/2016http://www.nasa.gov/exploration/systems/
1/31/15Delta II>
3/12/15>Atlas
Was aboard SpaceX-8>
TBD
Sub-orb.?>
1/17/16>Falc. 9
2/11/15 >Falc. 9/AF
As of 9/23/201719 US Major
Launches in 2017
ULA5 Atlas (3 DoD, 1 NASA, 1 ISS cargo,
0 commercial, 0 NOAA)1 Delta IV (1 DoD)0 Delta II (0 NASA)
SpaceX13 Falcon 9 (8 commercial, 3 ISS
cargo, 0 NASA, 2 DoD)Landing Success / Attempts% Sea / %Land / %Average62% / 100% / 76%
Orbital ATK0 Antares
+1 Minotaur (small, DoD)
Atlas 401>May ’18
(Mars)
11/19/16Atlas>
Peg. XL>12/15/16
7/13/14>Antares
2/28/14 HII-A>
6/15/17>Peg. XL
12/5/14 Delta Heavy>
Delta IV-H 2018
1/10/15>
9/20/14>
10/28/14>Antares (failed)
Rideshare >TBD
F 9>
Mounts>onto ISS
Delta II>Nov. 2017
Atlas V>9/8/16
Asteroid sample return
Laser Comm. rideshare w. TBD commercial sat.
9
4/14/15>
4/08/16>
5/05/15>Dragon LA Test
Black = ActualGreen = Planned
= Next 7/2/14>Delta II
Delta II>Late ‘17
Original planning chart from: 508_CFO_presentation.pdf, March 2014 ->https://www.nasa.gov/sites/default/files/files/508_CFO_presentation.pdf
SpaceX-15>
Orb ATK-9>
SpaceX-14>
SpaceX-13>
6/28/15>(failed)
1st Falcon HeavyFlight Demo TBD 2017
12/06/2015 (Cyg./Atlas)>
3/23/16>(Atlas)
? Aboard SpaceX-?
Feb. ‘18>Boeing
Orb ATK-10>
10/17/16>Antares RTF
4/18/17>(Atlas)
7/18/16>
2/19/17>
SpaceX-16>TBD
SpaceX-17>TBD
SpaceX-18>TBD
SpaceX-19>TBD
SpaceX-20>TBD
TBD>
+Crew
+Crew
02/17/16 (Japan)2018 ESA
Atlas>Mar. ‘18
2017 Germany
6/3/17>
8/14/17 >
10/11/17>
TDRS8/18/16
Atlas>
Feb. ‘18>SpaceX
Apr. ‘18>SpaceX
Jun. ‘18>Boeing
Jun. ‘18>SpaceX
Aug. ‘18>Boeing
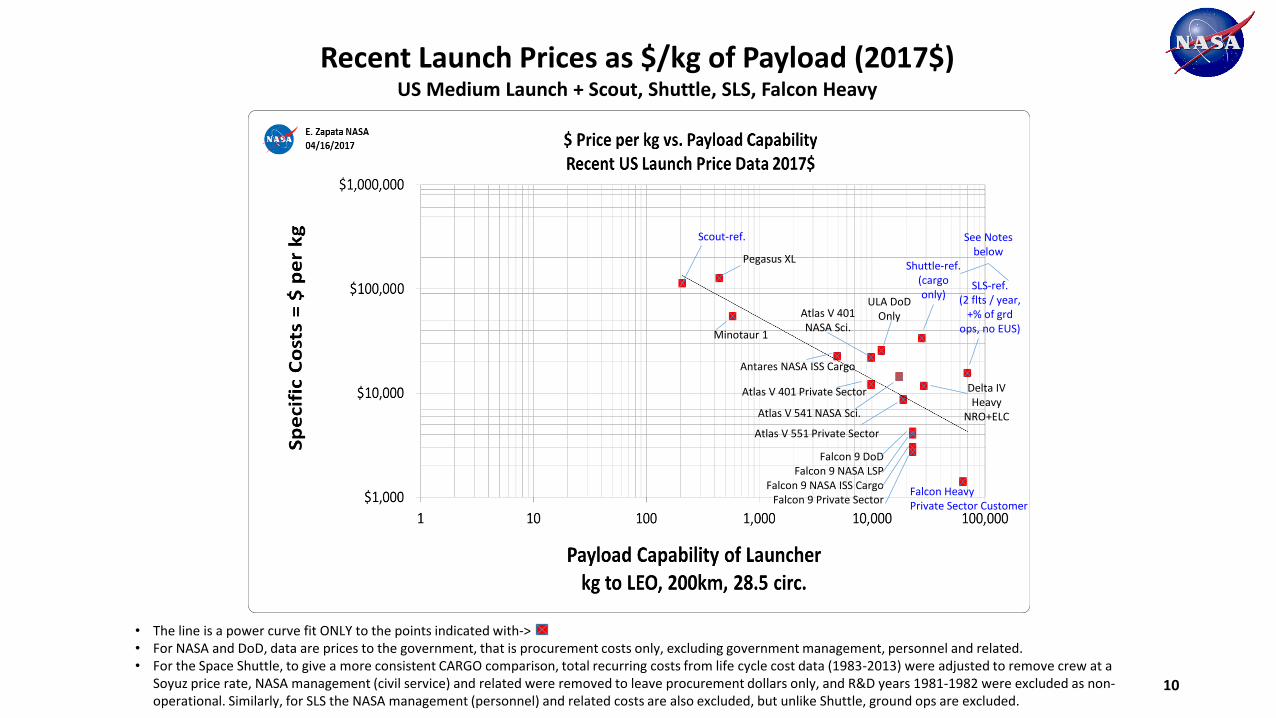
• The line is a power curve fit ONLY to the points indicated with-> • For NASA and DoD, data are prices to the government, that is procurement costs only, excluding government management, personnel and related.• For the Space Shuttle, to give a more consistent CARGO comparison, total recurring costs from life cycle cost data (1983-2013) were adjusted to remove crew at a
Soyuz price rate, NASA management (civil service) and related were removed to leave procurement dollars only, and R&D years 1981-1982 were excluded as non-operational. Similarly, for SLS the NASA management (personnel) and related costs are also excluded, but unlike Shuttle, ground ops are excluded.
10
Pegasus XL
Scout-ref.
Minotaur 1
Atlas V 541 NASA Sci.
Atlas V 401 NASA Sci.
ULA DoD Only
SLS-ref. (2 flts / year,
+% of grdops, no EUS)
Shuttle-ref. (cargo only)
Falcon 9 DoDFalcon 9 NASA LSP
Falcon 9 NASA ISS CargoFalcon 9 Private Sector
Falcon Heavy Private Sector Customer
Delta IV Heavy
NRO+ELC
Antares NASA ISS Cargo
Recent Launch Prices as $/kg of Payload (2017$)US Medium Launch + Scout, Shuttle, SLS, Falcon Heavy
Atlas V 551 Private Sector
Atlas V 401 Private Sector
See Notes below
11
Pegasus XL
Minotaur 1
Atlas V 541 NASA Sci.
Atlas V 401 NASA Sci.
ULA DoD Only
Falcon 9 DoDFalcon 9 NASA LSP
Falcon 9 NASA ISS CargoFalcon 9 Private Sector
Falcon Heavy Private Sector Customer
Delta IV Heavy
NRO+ELC
Antares NASA ISS Cargo
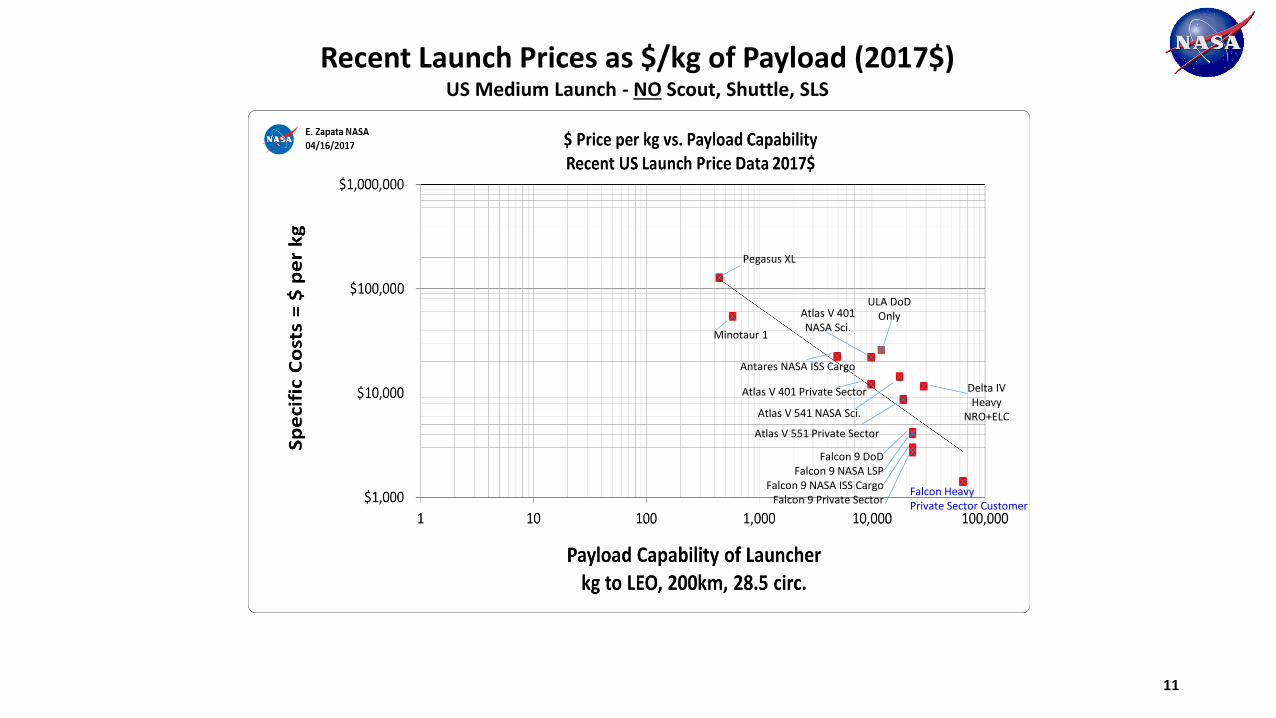
Recent Launch Prices as $/kg of Payload (2017$)US Medium Launch - NO Scout, Shuttle, SLS
Atlas V 551 Private Sector
Atlas V 401 Private Sector

Pegasus XL
Minotaur 1
Atlas V 541 NASA Sci.
Atlas V 401 NASA Sci.
ULA DoD Only
Falcon 9 DoDFalcon 9 NASA LSP
Falcon 9 NASA ISS CargoFalcon 9 Private Sector
Falcon Heavy Private Sector Customer
Delta IV Heavy
NRO+ELC
Antares NASA ISS Cargo
Atlas V 551 Private Sector
Atlas V 401 Private SectorSpaceX ESPA
NanoRacks1U
SpaceX PPOD Spaceflight
Services
NanoRacks50kg
12
NanoRacks as of 12/7/2015
SpaceFlight Services as of 12/7/2015
See Backup slides for data sources
Recent Launch Prices as $/kg of Payload (2017$)With Available US Small Launch / Services
Pegasus XL
Minotaur 1
Atlas V 541 NASA Sci.
Atlas V 401 NASA Sci.
ULA DoD Only
Falcon 9 DoDFalcon 9 NASA LSP
Falcon 9 NASA ISS CargoFalcon 9 Private Sector
Falcon Heavy Private Sector Customer
Delta IV Heavy
NRO+ELC
Antares NASA ISS Cargo
Atlas V 551 Private Sector
Atlas V 401 Private SectorSpaceX ESPA
NanoRacks1U
SpaceX PPOD
NanoRacks50kg
Gen-Orbit
Rocket Labs VG Launcher
One
13
NanoRacks as of 12/7/2015
SpaceFlight Services as of 12/7/2015
Virgin Galactic Launcher One as of 9/14/2015
Rocket Labs as of 8/10/2015
Generation Orbit as of 6/5/2015
See Backup slides for data sources
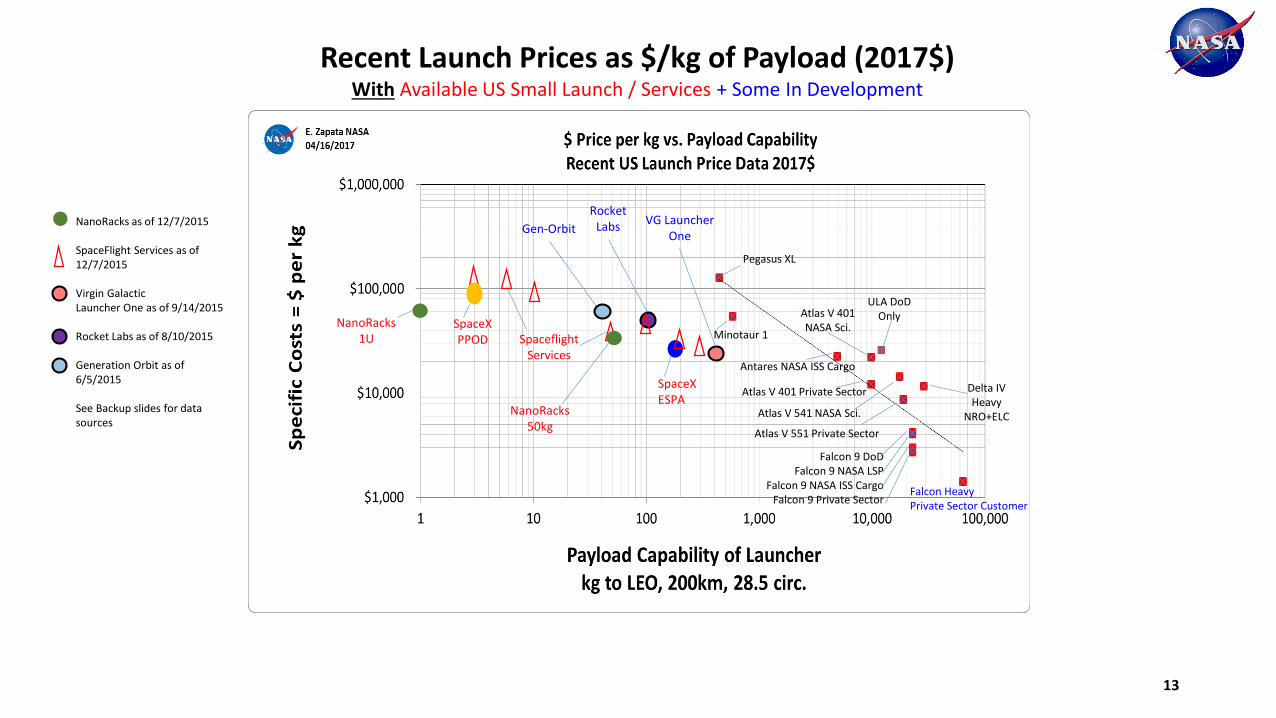
Recent Launch Prices as $/kg of Payload (2017$)With Available US Small Launch / Services + Some In Development
Spaceflight Services

1. Pegasus XL443 kg
5. Minotaur 1580 kg
2. Antares 4,900 kg
3. Atlas V 4019,797 kg
1. NASA price contracted for one 2017 launch (ICON)2. NASA price contracted for block of launches as a service (ISS cargo, derived price, minus Cygnus Spacecraft)3. NASA price contracted in 2010, launched in 2013 (MAVEN)4. DoD Price contracted in 2017 for a GPS launch5. DoD Price contracted, launched in 20136. Price to DoD of the launch service including the amortized EELV Launch Capabilities (ELC) contract, the yearly ELC contract amount divided evenly over the DoD only launches, for NRO7. NASA Price contracted in 2012, each, with two launches procured together, launched in 2016 + TBD 20178A. and 8B. NASA Sci. price (8A) contracted in 2012, launched in 2016 (JASON), and (8B) NASA price contracted for block of launches as a service (ISS cargo, derived price, minus Dragon Spacecraft)9A. and 9B. Prices for private sector customers
7. Atlas V 54117,443 kg
9A. Falcon HeavyPrivate Sector Customer63,800kg
10. Price to NASA; higher orbit, plus includes providing the Dragon spacecraft for carrying / placing the customers cargo (pressurized, unpressurized, return, etc.)11. Price to NASA; higher orbit, plus includes providing the Cygnus spacecraft for carrying / placing the customers cargo (pressurized, disposal, etc.)12. 13. and 14. Prices to customers from 2015 launches in the 2016 FAA launch compendium15. Ariane 6 –Proposed, shown w. derived equivalent LEO payload capacity. See backup slide and -> http://www.spaceflightnow.com/news/n1406/17airbussafran/16. NASA price contracted in 2015 for one 2018 launch. See backup slide.17. Per ULA -> www.RocketBuilder.com
Maximum Payload (kg) to Low Earth Orbit (200km, 28.5 circ.) - except as noted
Pri
ces
$
10. Falcon 9 +Dragon SpacecraftTo High/ISS Orbit
11. Antares +Cygnus SpacecraftTo High/ISS Orbit
12. Proton M $68M22,000 kg
14. Soyuz 2.1a $84M8,200 kg
13. Ariane 5 $187M21,000 kg
15. Ariane 6-Proposed$95M @~LEO Cap.
ULA Avg. w. ELC DoD Only 6. Delta IV
28,790 kgIncl. ELC $
Falcon 922,800kg4. DoD8A. NASA LSP/Sci.8B. NASA ISS9B. Private Sector Customer
14
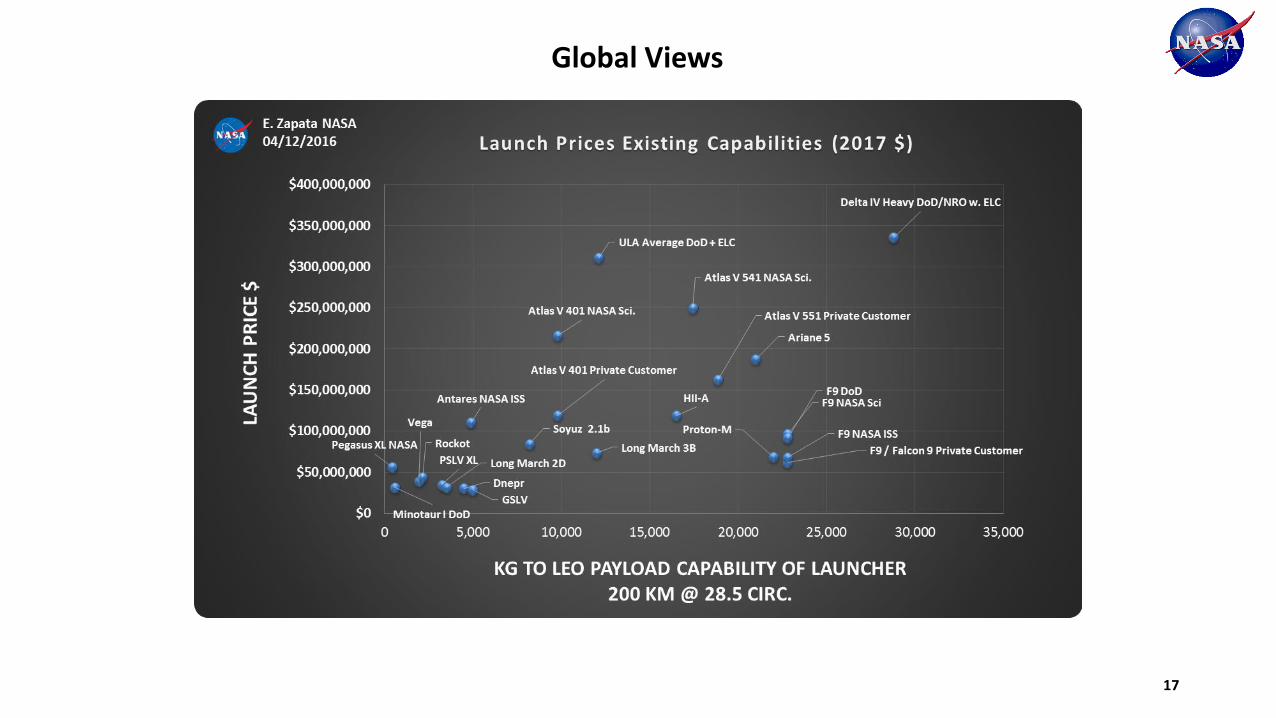
16. Delta IV28,790 kg$389.1M
RED = NASA
Blue = DoD
Black = Private / non Gov’t
Recent Launch Prices vs. Payload Capability (2017$)
17. Atlas 401 & 551 Private Sector
15
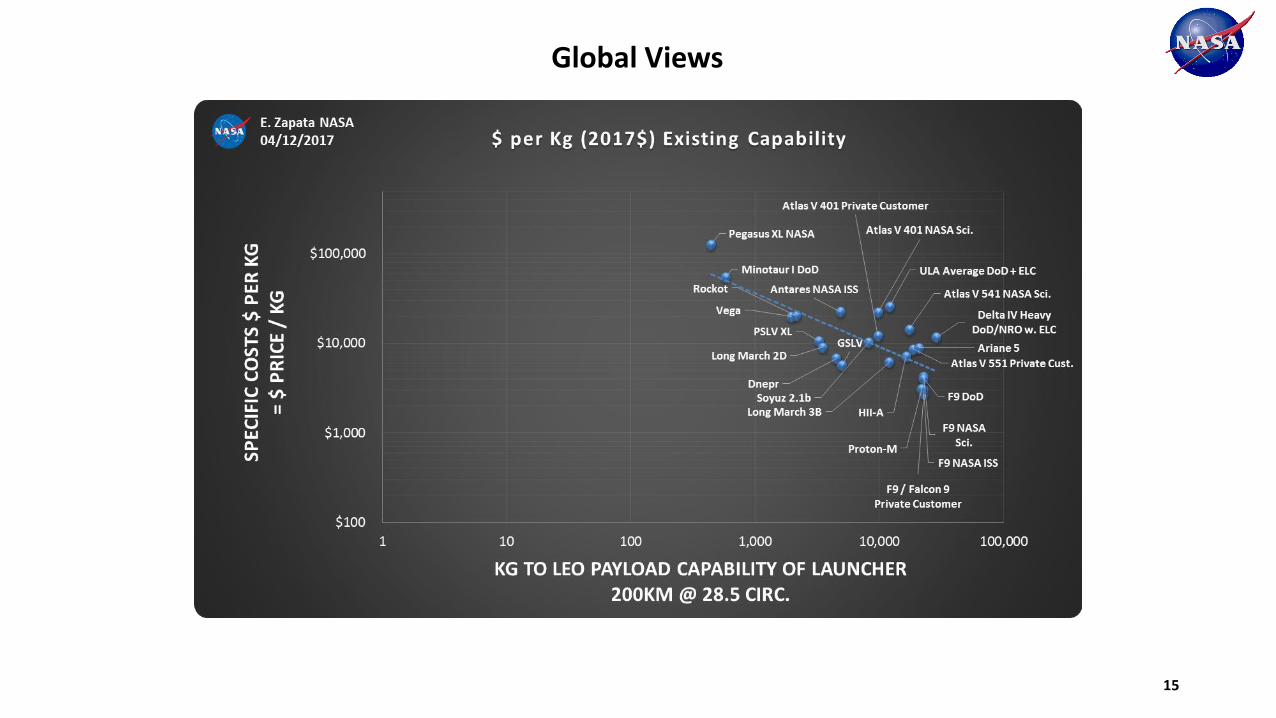
Global Views

16
Global Views
17
Global Views
18
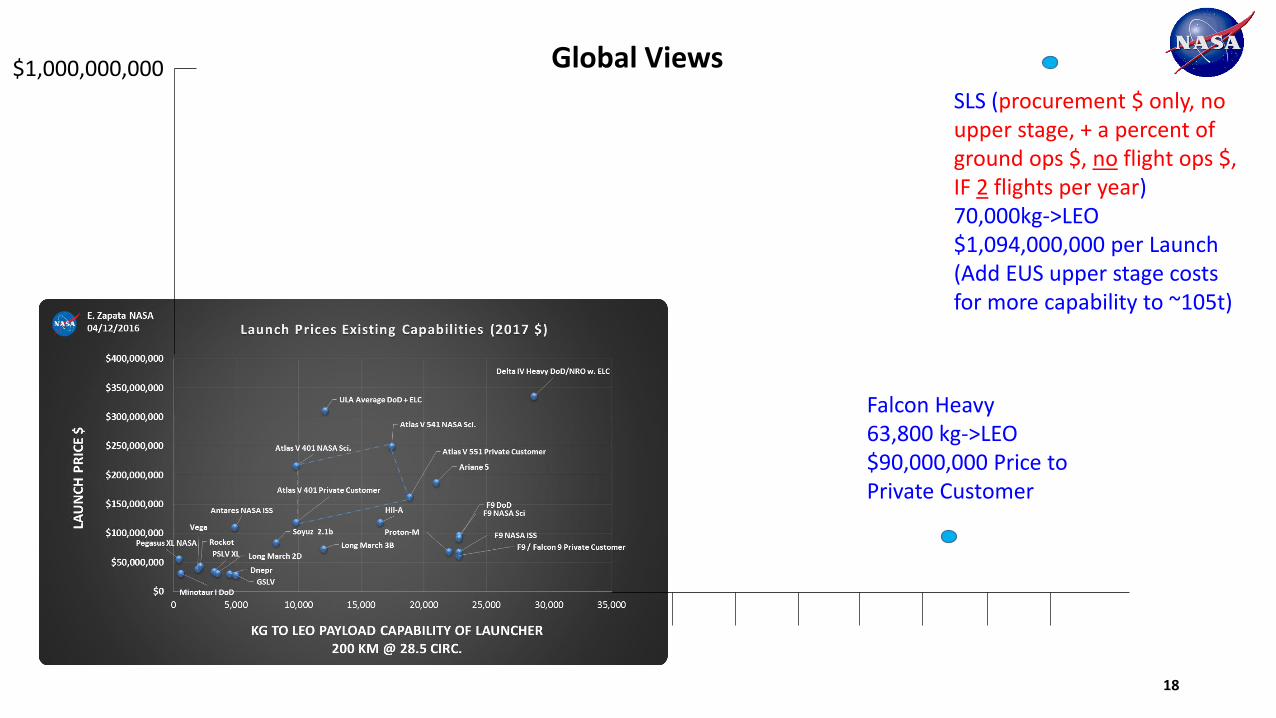
Global Views$1,000,000,000
Falcon Heavy63,800 kg->LEO$90,000,000 Price to Private Customer
SLS (procurement $ only, no upper stage, + a percent of ground ops $, no flight ops $, IF 2 flights per year)70,000kg->LEO$1,094,000,000 per Launch(Add EUS upper stage costs for more capability to ~105t)

19
Trying to estimate a launch price, the cost of a launch for NASA or DoD? Ask the following, then see which data point above is most similar.1. Who is procuring the launch?
The NASA Launch Services Program? The NASA ISS Transportation Office (Cargo)? The NASA ISS Commercial Crew Office? The DoD / Air Force? The DoD / Air Force for the National Reconnaissance Office (NRO)? A private sector customer?
2. How is the launch procured? As a block of launches, or as a single award unrelated to others? As a service (like cargo to the ISS)?3. With what other items is the launcher being procured alongside, such as a spacecraft (Cygnus, Dragon)?4. What is being launched? Is the launch for simpler cargo, repetitive and similar, or more complex, irreplaceable, unique? Or is it for crew?
Launch Systems – Multiple Measures – Especially kg per Year

$26,700
$3,271 $251 $307
$2,201
$14,761
$19,466
$-
$5,000
$10,000
$15,000
$20,000
$25,000
CSM-Apollo (crew toCis-Lunar)
CST-100 (crew toLEO)
Cygnus (cargo toLEO)
Dragon 1.0 (cargo toLEO)
Dragon 2.0 (crew toLEO)
LM-Apollo (crew toLunar Surface)
Orion (crew to Cis-Lunar)
No
n-r
ecu
rrin
g $
M
Spacecraft Non-recurring NASA Development,Procurement Only, $M 2017$
E. Zapata NASA6/2/2017
Alphabetical Order ->
Total of Actuals to 2017, +Planned 2018-2021, +Estimates 2022-2023 to complete
Average Shown; UncertaintyLo $21B, Hi $32B
Average Shown; UncertaintyLo $12B, Hi $17B
Total of Actuals to 2014,+Planned to complete
Total of Actuals to 2014,+Planned to complete
NASA Only ShownPrivate $ add $345M
NASA Only ShownPrivate $ add $352M
20
CrewCommercial
CargoCommercial
CargoCommercial
CrewCommercial
CrewCost+
Spacecraft Costs – Development(Costs = Price to NASA)
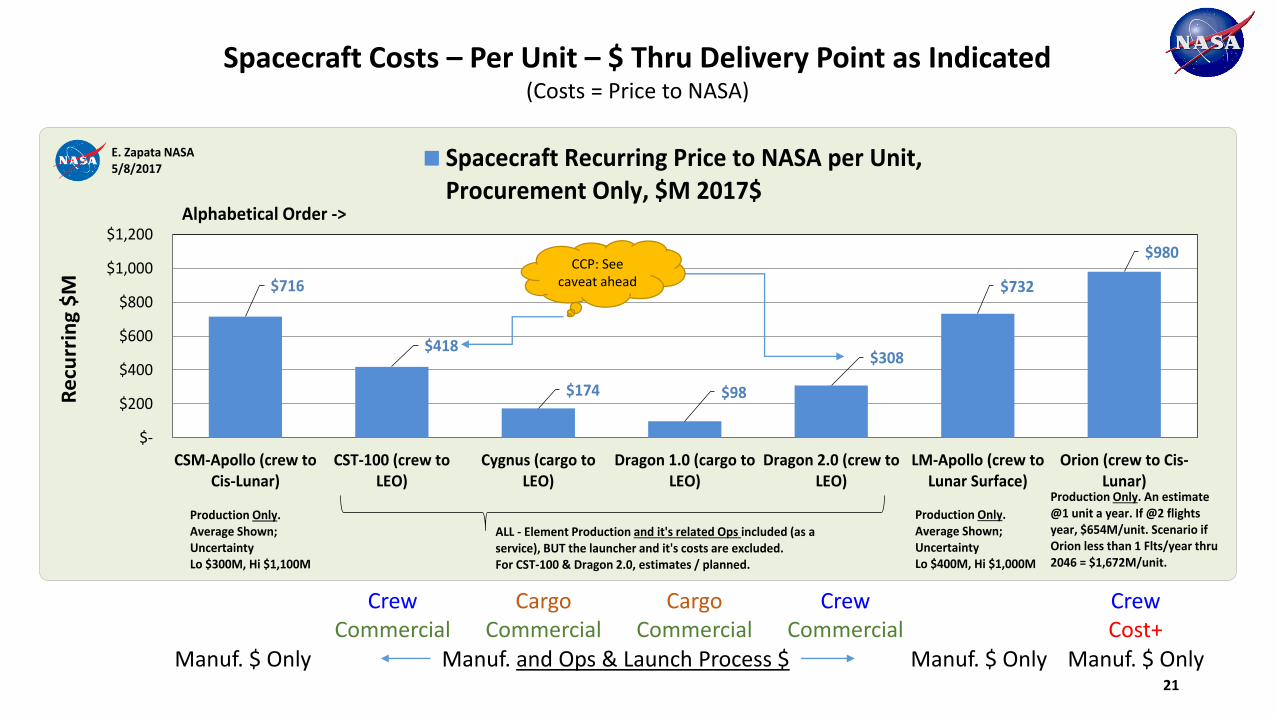
$716
$418
$174 $98
$308
$732
$980
$-
$200
$400
$600
$800
$1,000
$1,200
CSM-Apollo (crew toCis-Lunar)
CST-100 (crew toLEO)
Cygnus (cargo toLEO)
Dragon 1.0 (cargo toLEO)
Dragon 2.0 (crew toLEO)
LM-Apollo (crew toLunar Surface)
Orion (crew to Cis-Lunar)
Re
curr
ing
$M
Spacecraft Recurring Price to NASA per Unit,Procurement Only, $M 2017$
E. Zapata NASA5/8/2017
Alphabetical Order ->
Production Only. An estimate @1 unit a year. If @2 flights year, $654M/unit. Scenario if Orion less than 1 Flts/year thru 2046 = $1,672M/unit.
ALL - Element Production and it's related Ops included (as a service), BUT the launcher and it's costs are excluded.For CST-100 & Dragon 2.0, estimates / planned.
Production Only.Average Shown; UncertaintyLo $300M, Hi $1,100M
Production Only.Average Shown; UncertaintyLo $400M, Hi $1,000M
21
Manuf. $ Only Manuf. $ OnlyManuf. and Ops & Launch Process $ Manuf. $ Only
CrewCommercial
CargoCommercial
CargoCommercial
CrewCommercial
CrewCost+
Spacecraft Costs – Per Unit – $ Thru Delivery Point as Indicated(Costs = Price to NASA)
CCP: See caveat ahead
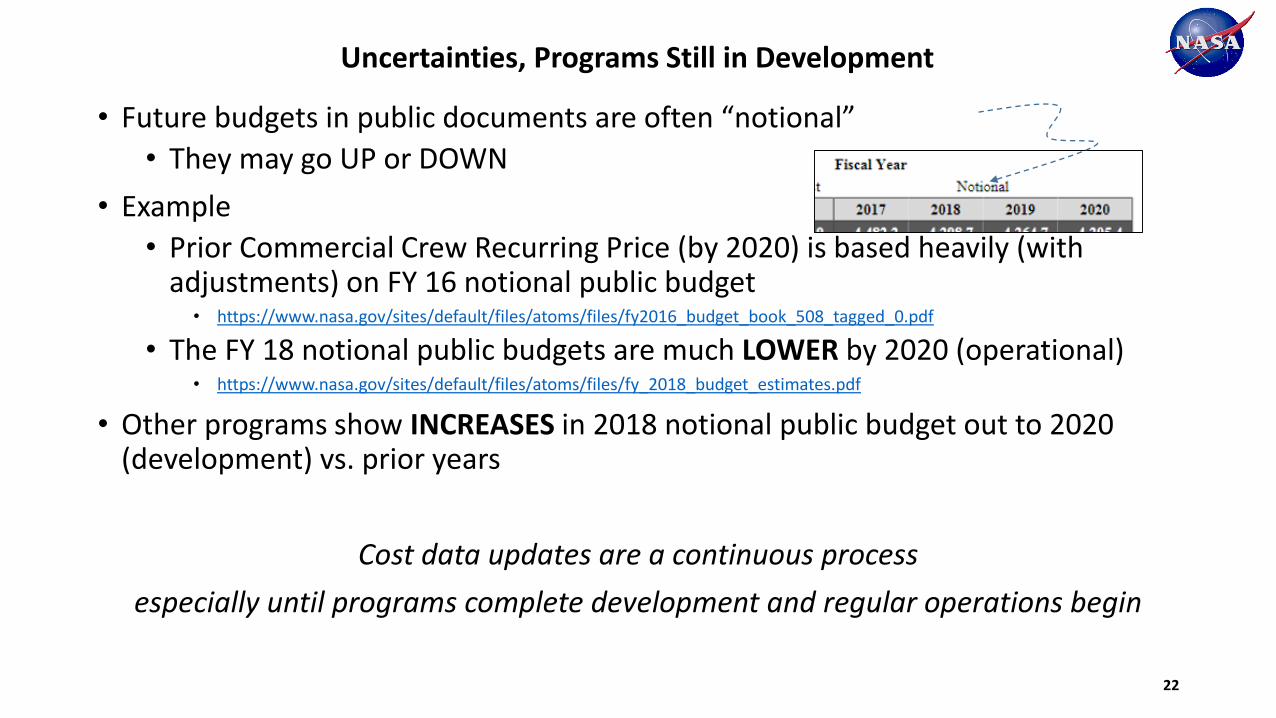
• Future budgets in public documents are often “notional”
• They may go UP or DOWN
• Example
• Prior Commercial Crew Recurring Price (by 2020) is based heavily (with adjustments) on FY 16 notional public budget
• https://www.nasa.gov/sites/default/files/atoms/files/fy2016_budget_book_508_tagged_0.pdf
• The FY 18 notional public budgets are much LOWER by 2020 (operational)• https://www.nasa.gov/sites/default/files/atoms/files/fy_2018_budget_estimates.pdf
• Other programs show INCREASES in 2018 notional public budget out to 2020 (development) vs. prior years
Cost data updates are a continuous process
especially until programs complete development and regular operations begin
22
Uncertainties, Programs Still in Development
0
5
10
15
20
25
30
35
40
45
Nu
mb
er o
f La
un
ches
Year
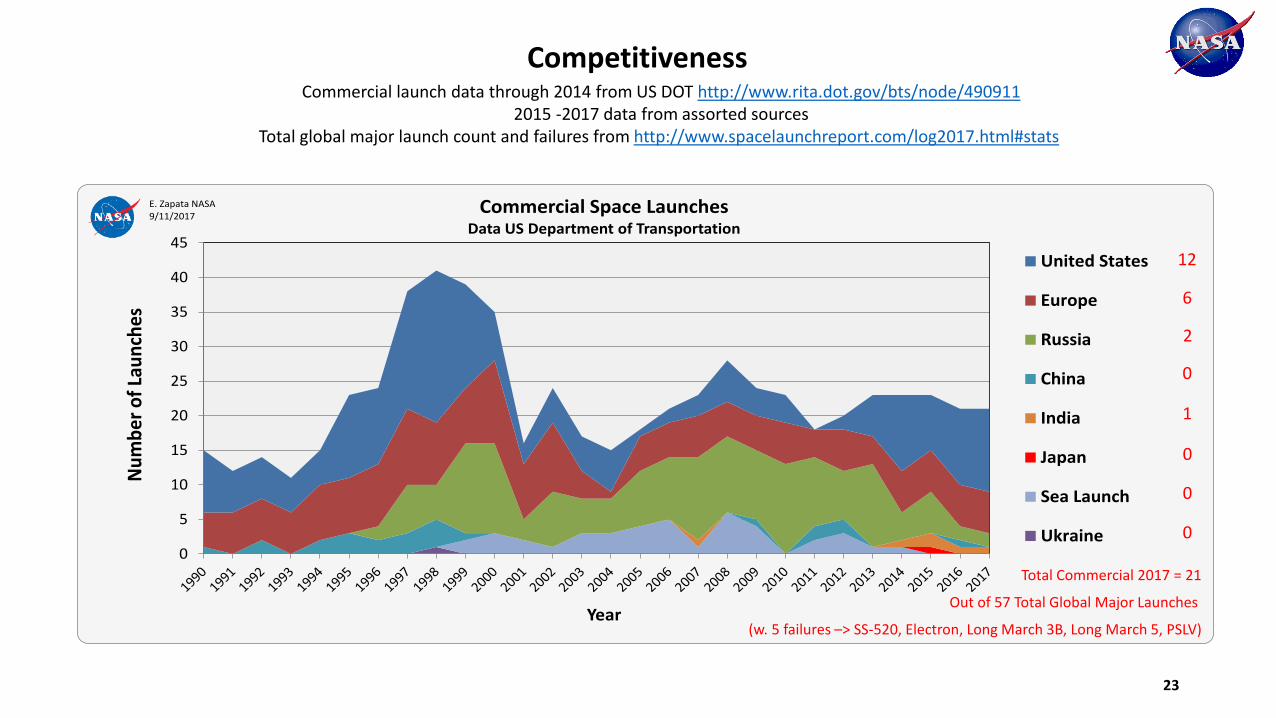
Commercial Space LaunchesData US Department of Transportation
United States
Europe
Russia
China
India
Japan
Sea Launch
Ukraine
E. Zapata NASA9/11/2017
Commercial launch data through 2014 from US DOT http://www.rita.dot.gov/bts/node/4909112015 -2017 data from assorted sources
Total global major launch count and failures from http://www.spacelaunchreport.com/log2017.html#stats
12
6
2
0
0
1
0
23
Total Commercial 2017 = 21
Out of 57 Total Global Major Launches
(w. 5 failures –> SS-520, Electron, Long March 3B, Long March 5, PSLV)
0
Competitiveness

R² = 0.999
R² = 0.993
0
20
40
60
80
100
120
140
160
180
200
1/1/1989 6/24/1994 12/15/1999 6/6/2005 11/27/2010 5/19/2016 11/9/2021
TOTA
L LA
UN
CH
ES
SIN
CE
1ST
LA
UN
CH
US Launch Systems Growth
Delta II Atlas I+II+III Atlas V Delta IV Falcon 9 Antares
1. The failures in the Delta II line for 8/27/98, 5/5/99 and 8/23/00 were a variant, the Delta III, which was then retired.
2. For the Atlas V and Delta IV partial failure points, the first partial failure is a Delta IV launch on 12/21/2004; the second partial failure is an Atlas V on 6/15/2007.
= Partial Failure= Failure
E. Zapata NASA9/23/2017
24
Growth
• Space is hard
• Adding up space system costs, budgets, flights, payload capabilities, etc. – not hard, just tedious
• Define competitiveness, compare systems, understand cost vs. productivity
• Establish facts on the ground
• Value: situational awareness
• Where are we?
• Where might we go?
Questions?
25
Closing

Backup
26

• As of 12/07/2015 - NanoRacks - “Commercial payloads start at $60,000 per 1U” + volume discounts, to 50kg as advertised @ http://nanoracks.com/resources/faq/• 3U $295,000, 6U $545,000, 12U $995,000, 50kg $1,750,000, 100kg $3,950,000, 200kg $5,950,000, 300kg $7,950,000 as advertised @
http://www.spaceflightindustries.com/schedule-pricing/• SpaceX - secondary payload “PPOD” to LEO $200,000-$325,000 (=$67,000-$108,000/kg; from Aug. 2012, 26th Annual AIAA USU, Conference on Small Satellites)• SpaceX – secondary payload, ESPA-class satellite weighing up to 180 kilograms would cost $4–5 million for LEO; from August 2012, 26th Annual AIAA USU, Conference on Small
Satellites (=$22,000 to $28,000/kg)
• As of 09/14/2015 – Virgin / Launcher One - In development - 400kg to LEO for $10M (=$25,000/kg) per http://www.parabolicarc.com/2015/09/14/virgin-galactic-announces-capable-launcherone/
• As of 08/10/2015 - Rocket Lab - In development - 100kg to LEO for $4.9M (=49,000/kg) per http://www.geekwire.com/2015/reserve-a-launch-for-your-satellite-online-rocket-lab-can-make-it-so/ albeit to a 310 mile high orbit, implying performance to LEO 200nm is more, so the “ ”
• As of 06/05/2015 - Generation Orbit - In development – 40kg to LEO for $2.5M (=$62,500/kg) per http://www.satellitetoday.com/launch/2015/06/05/generation-orbit-gains-golauncher2-commitments-plans-golauncher-3/
• As of 07/08/2016 – Stratolaunch / Vulcan Aerospace – In development – No public price statements by the company. Some early payload performance statements (6,100kg to LEO) that have since been overtaken by events. https://en.wikipedia.org/wiki/Stratolaunch_Systems
27
Data Sources, Small Payload Launch Options, Small Launch in Development, Other (see slides 6-7)
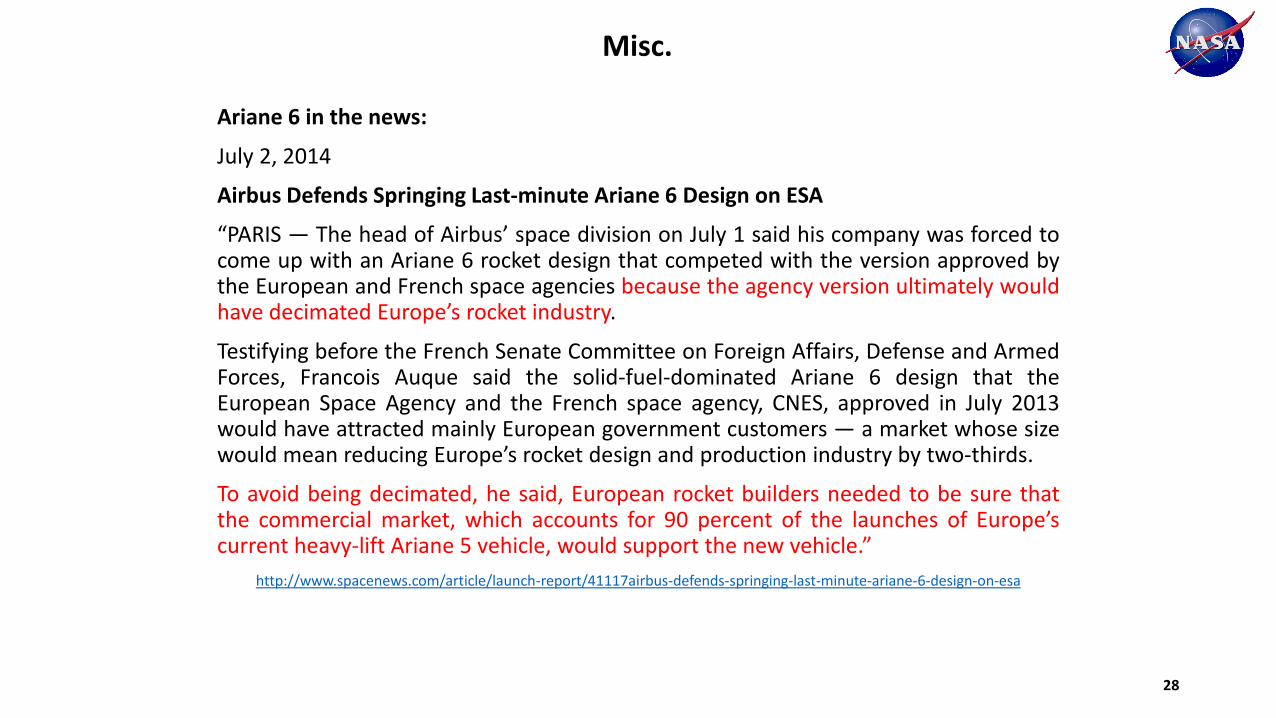
Ariane 6 in the news:
July 2, 2014
Airbus Defends Springing Last-minute Ariane 6 Design on ESA
“PARIS — The head of Airbus’ space division on July 1 said his company was forced tocome up with an Ariane 6 rocket design that competed with the version approved bythe European and French space agencies because the agency version ultimately wouldhave decimated Europe’s rocket industry.
Testifying before the French Senate Committee on Foreign Affairs, Defense and ArmedForces, Francois Auque said the solid-fuel-dominated Ariane 6 design that theEuropean Space Agency and the French space agency, CNES, approved in July 2013would have attracted mainly European government customers — a market whose sizewould mean reducing Europe’s rocket design and production industry by two-thirds.
To avoid being decimated, he said, European rocket builders needed to be sure thatthe commercial market, which accounts for 90 percent of the launches of Europe’scurrent heavy-lift Ariane 5 vehicle, would support the new vehicle.”
http://www.spacenews.com/article/launch-report/41117airbus-defends-springing-last-minute-ariane-6-design-on-esa
28
Misc.
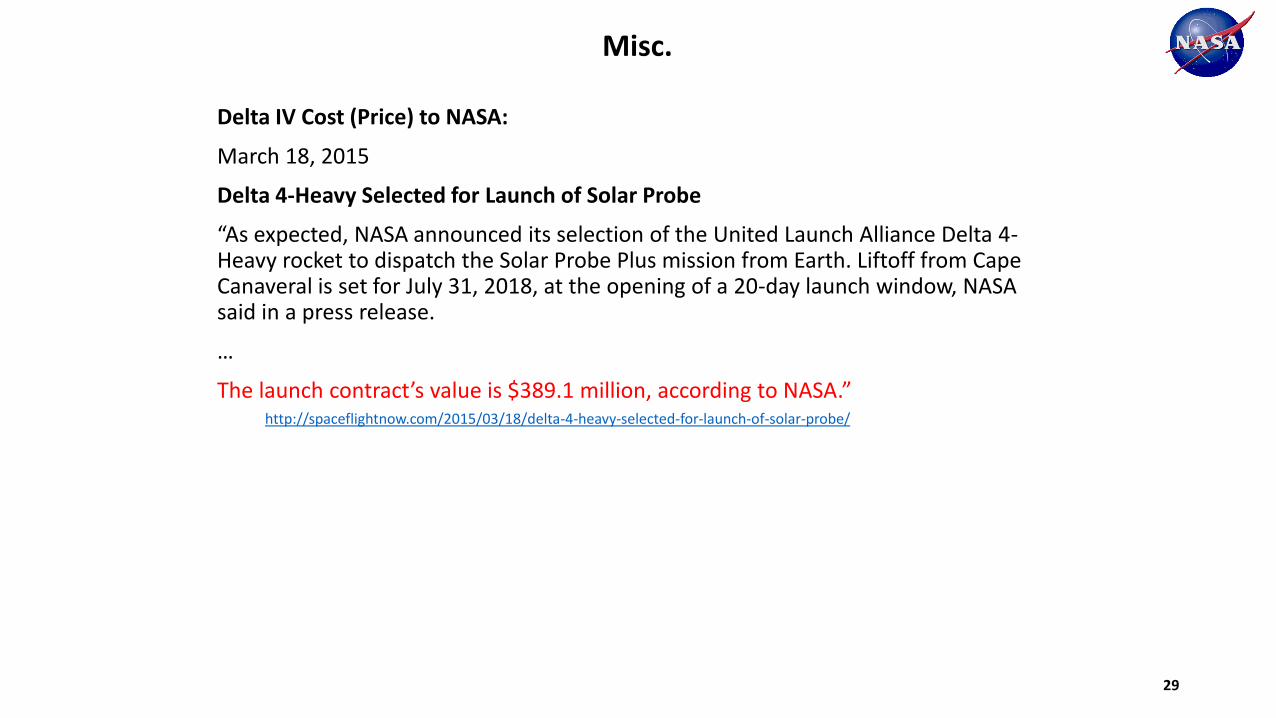
Delta IV Cost (Price) to NASA:
March 18, 2015
Delta 4-Heavy Selected for Launch of Solar Probe
“As expected, NASA announced its selection of the United Launch Alliance Delta 4-Heavy rocket to dispatch the Solar Probe Plus mission from Earth. Liftoff from Cape Canaveral is set for July 31, 2018, at the opening of a 20-day launch window, NASA said in a press release.
…
The launch contract’s value is $389.1 million, according to NASA.”http://spaceflightnow.com/2015/03/18/delta-4-heavy-selected-for-launch-of-solar-probe/
29
Misc.
Falcon 9 Cost (Price) to NASA:
November 22, 2016
NASA Selects Launch Services for Global Surface Water Survey Mission
“NASA has selected Space Exploration Technologies (SpaceX) of Hawthorne, California, to provide launch services for the agency’s Surface Water and Ocean Topography (SWOT) mission. Launch is targeted for April 2021 on a SpaceX Falcon 9 rocket from Space Launch Complex 4E at Vandenberg Air Force Base in California.
The total cost for NASA to launch SWOT is approximately $112 million.”https://www.nasa.gov/press-release/nasa-selects-launch-services-for-global-surface-water-survey-mission
30
Misc.