launching a neighborhood-based - new york...i think being healthy overall is taking care of yourself...
TRANSCRIPT

Harlem Health Advocacy Partners (HHAP) Community Needs Assessment
Neighborhood-BasedCommunity Health Worker Initiative
Launching a
A joint report from the NYU-CUNY Prevention Research Center, New York City
Department of Health and Mental Hygiene, New York City Housing Authority,
and Community Service Society


2 Introduction
5 Demographic Overview
8 General Health Status and Health-Related Quality of Life
11 Chronic Disease Burden
12 Multi-Morbidity
13 Burden of the Three Qualifying Conditions
14 Sources of Health Care and Insurance Coverage
14 Insurance Coverage
15 Medical Visits
16 Sources of Health Care Services
16 Care When Needed
17 Regular Primary Care Provider
18 Chronic Disease Management
18 Hypertension
19 Diabetes
20 Asthma
20 Barriers to Chronic Disease Management
21 Modifiable Risk Factors
21 Smoking
22 Obesity
23 Diet and Nutrition
24 Physical Activity
25 Barriers and Facilitators
26 Neighborhood Environment and Social Support
28 Community Service Utilization
29 Interest in Community Health Workers (CHWs)
30 Recommendations
33 Partners Involved in the Harlem Health Advocates Partnership (HHAP)
35 Methodological Appendix
ContentsTable of

Introduction
Harlem is a vibrant community with a growing economy and a richly diverse cultural identity. However, Harlem residents experience high levels of chronic health conditions, resulting in increased morbidity and mortality compared to the citywide population. In 2014 the New York City Mayor’s Office provided resources to the New York City Department of Health and Mental Hygiene (DOHMH) to launch the Harlem Health Advocacy Partners (HHAP) initiative. HHAP’s goal is to improve the health outcomes of New York City Housing Authority (NYCHA) residents in Harlem by linking residents with Community Health Workers (CHWs) and Health Advocates.
CHWs and Health Advocates are the cornerstone of the HHAP initiative.
CHWs are community members serving as frontline public health workers who have a unique understanding of the norms, values, and strengths of the communities in which they work.
Health Advocates provide health insurance enrollment and post-enrollment assistance to residents, including solving medical billing issues, connecting residents to clinicians, and working collaboratively with CHWs to navigate the health care system.
2
Working with residents, health care providers, and community organizations, the HHAP initiative aims to improve access to needed health care and social services, build leadership and capacity to address health needs among community residents, and improve the health of NYCHA residents suffering from poorly controlled hypertension (high blood pressure), diabetes (high blood sugar), and asthma.
CHW HealthAdvocates

The 5 developments include: King Towers, Taft Houses, Johnson Houses, Clinton Houses, and Lehman Village. These developments were selected because Health Department data sources showed resident as having disproportionately high rates of uncontrolled diabetes.
HARLEM RVR DR
HARLEM RVR DR
Density of persons with poorly controlled diabetes East Harlem 2013
FRED
DO
UG
LASS
BL
FRED
DO
UG
LASS
BL 5
AV5
AV
W 96 ST
W 96 ST
W 125 ST
W 125 ST
W 96 ST
W 96 ST
3
55
22
11
4
4
11
NYCHA Developments**1 Clinton2 Johnson3 King Towers4 Lehman Village5 Taft
*Density of persons with poorly controlled diabetes per 0.1 square mile**NYCHA developments engaged by Harlem Health Advocacy Partners
MT
MO
RRIS
PK
W
MT
MO
RRIS
PK
W
CATHEDRAL PY
CATHEDRAL PY
NYCHA Developments Participating in HHAP
KIN
G T
OW
ERS
T
AFT HOUSES JOHNSON
HO
USES
CLINTON HOUSES LEHMAN VIL
LAG
E
NYCHA DEVELOPMENTS PARTICIPATING
IN H
HA
P
SEN
IOR CEN
TERS
Community Centers
HHAP CHWs began their community outreach activities in February 2015 at five Central and East Harlem NYCHA developments: Clinton Houses, Johnson Houses, Lehman Village, King Towers, and Taft Houses. These developments were selected because they have disproportionately high rates of poorly controlled diabetes compared to other neighborhoods in New York City.
Lowest
Highest
Density*
3

4
In this report, HHAP partner institutions share results of a community needs assessment designed to capture current needs and health priorities of NYCHA residents in the five selected developments. Several weeks before the CHWs began their work, a telephone survey was conducted using a representative sample of over 1,000 residents aged 35 and older. Six focus groups were also conducted among residents living with diabetes, hypertension, and/or asthma to better understand their specific challenges.
About the Community Needs Assessment
A random sample of adults aged 35 and older living in the five NYCHA developments was asked to participate in a brief telephone survey conducted from December 2014 to January 2015. Of those approached, 43.5% completed the survey (1,123 respondents). Adults aged 35 and older were targeted because they more commonly have conditions addressed by the HHAP intervention (hypertension, diabetes, and asthma).
The HHAP partners also held six focus groups with 55 residents suffering from hypertension, diabetes, and/or asthma who lived in one of the five intervention developments. Participants discussed disease management, barriers and facilitators to healthy behaviors, health promotion within their culture, and the role of the CHWs.
See Technical Notes at the end of the document for details on how the community needs assessment was conducted.
• NYCHA residents telephone survey
• Six focus groups
• HHAP identifies individuals with hypertension, diabetes, and/or asthma interested in one-on-one health coaching
• HHAP identifies individuals in need of health insurance enrollment or navigation assistance
• CHWs begin enrolling NYCHA residents with chronic diseases in health coaching services
• Health Advocates begin on-site presence at NYCHA developments to assist with insurance and health care navigation
December 2014 - January 2015 Community Needs Assessment
January 2015 February 2015 HHAP Project Begins
Harlem Health Advocacy Program initiative timeline

5
Demographics of NYCHA
The demographic profile of the five HHAP developments is similar to that of NYCHA residents as a whole. A profile on all NYCHA residents appears in “NextGeneration NYCHA,” a report detailing Mayor Bill de Blasio’s affordable housing plan, and is available at: http://www1.nyc.gov/assets/nycha/downloads/pdf/nextgen-nycha-web.pdf
Demographic Overview
Understanding the unique demographic profile of residents in the five selected developments helps HHAP partners tailor interventions.
NYCHA is the largest public housing authority in North America, with 328 developments across the five boroughs of NYC and more than 400,000 residents. Approximately 12,720 residents live in the five NYCHA developments selected for the HHAP intervention; 1,123 of these residents were surveyed.
A higher percentage of the population in these developments is either younger (<20 years old) or older (65+ years) than the overall population of NYC.
NYCHA residents living in the HHAP intervention developments are more likely than all NYC residents to be female and Black or Latino.
Children/teens (<20 years)
20-34 years
35-44 years
45-64 years
65+ years
All NYC residents NYCHA tenant data in five target developments
24%31%
25%20%
14%10%
24%23%
12%16%
(1) Source: United States Census Bureau, 2010 Census.(2) Source: NYCHA TDS, persons on the lease in the five targeted developments in 2014.
Includedin survey
Age distribution overview

Many residents who participated in the survey are foreign-born or from a U.S. territory such as Puerto Rico (44%). Nearly one-third (30%) are living alone, especially older adults. Compared to 11% of younger adults aged 35 to 49, nearly half (47%) of adults aged 65 years or older live by themselves.
Roughly three in 10 (29%) of NYCHA residents who took the survey are employed, 26% are unable to work, 23% are retired, and 13% are able to work but are currently unemployed. The remaining 9% of residents is mostly comprised of homemakers.
Household size, by age group
35-49 years 50-64 years 65+ years
3 or more persons
2 persons1 person
Source: Needs assessment survey, n=1123, among adults 35 years and older.
11%
30%
59%
28%
38%
34%
47%
32%
21%
Population 18 years and older in NYC(1)
Population 18 years and older in CHW NYCHA developments
(as of July 1, 2015)(2)
Population 35 years and older in CHW NYCHA
developments(3)
Female 53% 67% 73%Male 47% 33% 27%
White* 36% 2% 4%Black* 22% 43% 42%Latino 27% 48% 49%Asian 13% 7% 3%Other 2% 1% 3%
6
(1) Source: United States Census Bureau, 2010 Census. (2) Source: NYCHA TDS, persons on the lease in the 5 targeted developments in 2015. (3) Source: Needs assessment survey, among adults 35 years and older * Includes non-Latino adults only

Overall, 42% of residents in the developments have annual household incomes below $20,000. More than half (51%) of women and 42% of men live in households that earn less than $20,000 per year.
In sum, the population in the NYCHA developments where the HHAP intervention is taking place is comprised mostly of women, and includes a disproportionate number of children, older adults, and people living in poverty, compared to the rest of NYC.
Household Income
Annual household income calculated from the NYCHA Tenant Data System did not take into account household size. For reference, a three-person household with an income at or below $20,090 is considered to be living in poverty, according to the 2015 federal poverty guidelines. Median household income in New York City is $50,711, per 2010-2012 U.S. Census Bureau estimates.
7
Adult residents living with a household income of less than $20,000
35-49 years 50-64 years 65+ years 35-49 years 50-64 years 65+ years
38%47%
39%47% 47%
60%
Male Female
Source: NYCHA TDS.

General Health Status and Health-Related Quality of Life
Self-reported health is widely used as a reliable indicator of future disability and need for health care services.1 Nearly half (46%) of NYCHA residents aged 35 and older in the five targeted developments report their general health status as being fair or poor, compared to 29% of NYC adults aged 35 and older. More than one quarter (27%) describe their mental health as being fair or poor.
Nearly 40% of adults report being limited because of a health problem in activities people usually do.
In focus groups with residents from the five selected developments, residents described being healthy as having the ability to care for oneself and one’s family members, being able to live longer, and doing things that are fulfilling.
Fair/poor general health
Fair/poor mental health
Health limits their activities
46%
27%
39%
8
Reported health status among adult residents
K is an older female resident and participant with a chronic disease living alone on a low fixed income.
“I think being healthy overall is taking care of yourself … the capacity to take care of your business and not have to rely heavily on others for daily functions. It’s about having the energy to do these things on your own without assistance. Sometimes you might need assistance, but not all the time … That is my philosophy. As long as I am able to do, physically, mentally, and spiritually, I’m fine. ”
1 Idler EL, Russell LB, Davis D. Survival, functional limitations, and self-rated health in the NHANES I Epidemiologic Follow-up Study, 1992. First National Health and Nutrition Examination Survey. Am J Epidemiol. 2000;152:874–83. Available at: http://www.ncbi.nlm.nih.gov/pubmed/11085400
Citywide estimates of general health among adults aged 35+
Excellent 15% Very good 23% Good 33% Fair/poor 29%
Source: NYC Community Health Survey 2013, adults aged 35+

Reported fair/poor general health status, by gender and age
9
Older residents are more likely to report fair or poor general and mental health than younger residents, yet younger adults are equally as likely as older adults to report that poor health limits them from activities people usually do.
In all age groups, women report worse general health than men. Among residents 65 years and older, the percentage of women reporting poor or fair health is 63% compared to 45% for men.
““[Being healthy means] living longer and being here for your family and kids; if you cut it short, you cut everything short.”
“[Being healthy means] exercising and eating right, being able to do what you want to do.”
Reported fair/poor health status, by age group
Male
Female
35-49 years 50-64 years 65+ years
20%
34%40%
52%45%
63%
46% overall
Fair/poor general health
Fair/poormental health
Poor healthlimits activities
31%
49%
58%
22%
27%
33%
37%
45%
37%
35-49 years
50-64 years
65+ years
Source: Needs assessment survey among adults 35 years and older.

On average, foreign-born Latino residents more frequently rate their general and mental health as fair or poor than U.S.-born Latino or Black residents. However, foreign-born Latinos do not report limitations in their daily activities due to health more than other groups.
Residents with lower incomes are more likely than those with higher incomes to report poor health and limitations in activity. More than half (54%) of lower-income residents report fair or poor general health, compared to lower levels among residents in households with higher annual incomes.
Reported fair/poor health status, by ethnicity group
10
Household income and prevalence of poor health
In fair/poor general health In fair/poor mental health Poor health limits activities
54%
42%
35%
22%
45%
37%Less than $20K
$20K to <$40K
$40K or more
34%
19%
32%
Fair/poor general health
Fair/poormental health
Poor healthlimits activities
40% 40%42%
59%
24%27%
34%
45%
36%
Black
U.S.-born Latino
Foreign-born Latino

Reported fair/poor health status, by ethnicity group
11
Prevalence of chronic conditions
Hypertension
Diabetes
Current asthma
Arthritis/similar disease
High cholesterol
Heart disease
Osteoporosis
Cancer
Emphysema
Chronic kidney disease
54%29%
12%
40%
15%
4%
35%
38%
13%
11%
7%
4%
4%
Citywideestimates
Chronic Disease Burden
One of the primary goals of HHAP is to improve the health of NYCHA residents with hypertension, diabetes, and asthma—three common chronic health conditions that require careful ongoing self-management.
The burden of hypertension, diabetes, and asthma is high in this community. Overall, more than half (54%) of residents aged 35 years and older report having been diagnosed with hypertension, more than one quarter (29%) with diabetes, and 12% with current asthma (had an episode of asthma in the past 12 months). Three out of four (74%) have at least one of these three conditions.
Seven additional conditions were also assessed, including arthritis, cancer, emphysema, heart disease/stroke,
high cholesterol, kidney disease, and osteoporosis. Residents most frequently report having arthritis (38%), high cholesterol (35%), and heart disease (13%). Other conditions, such as cancer, emphysema, and chronic kidney disease, are less common but can also have a major effect on a person’s overall health and quality of life.
Less than a quarter (23%) of residents report that they have no chronic conditions, compared to 54% among all NYC adults aged 35 and older.
Citywide prevalence of health conditions among adults aged 35+
Hypertension 40% Diabetes 15% Current asthma 4% Source: NYC Community Health Survey 2013, adults aged 35+
12
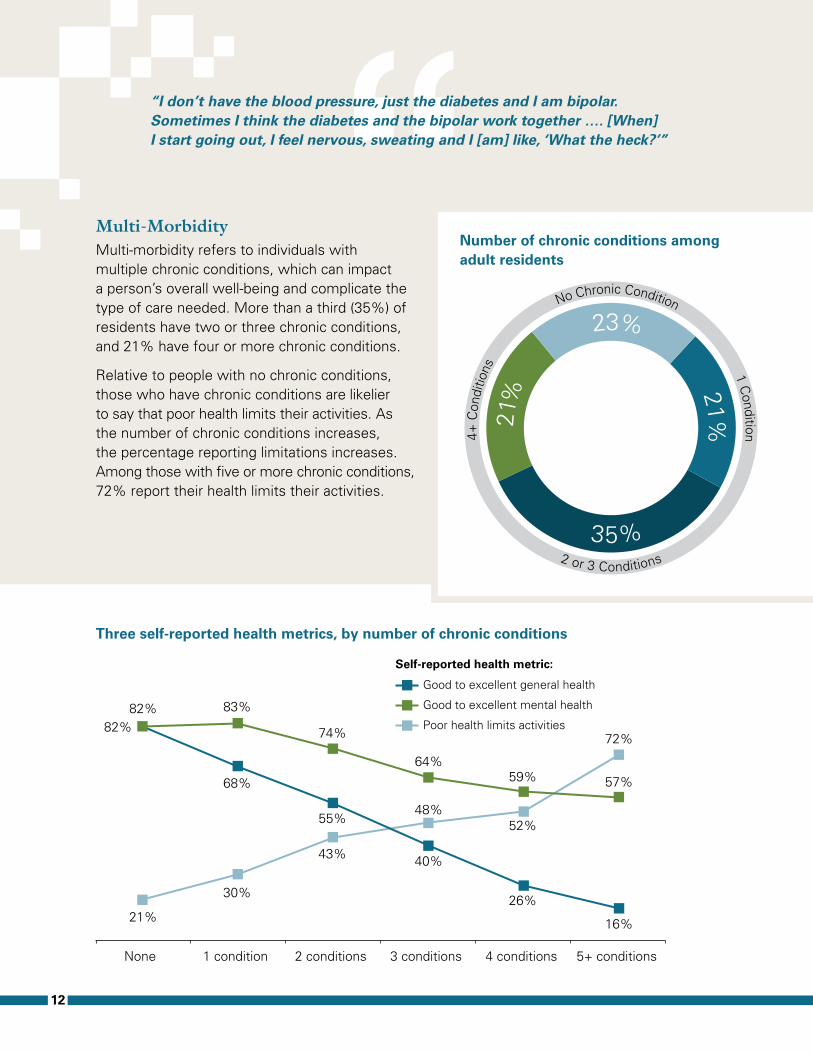
Multi-MorbidityMulti-morbidity refers to individuals with multiple chronic conditions, which can impact a person’s overall well-being and complicate the type of care needed. More than a third (35%) of residents have two or three chronic conditions, and 21% have four or more chronic conditions.
Relative to people with no chronic conditions, those who have chronic conditions are likelier to say that poor health limits their activities. As the number of chronic conditions increases, the percentage reporting limitations increases. Among those with five or more chronic conditions, 72% report their health limits their activities.
““I don’t have the blood pressure, just the diabetes and I am bipolar. Sometimes I think the diabetes and the bipolar work together …. [When] I start going out, I feel nervous, sweating and I [am] like, ‘What the heck?’”
Number of chronic conditions among adult residents
Three self-reported health metrics, by number of chronic conditions
4+ C
ondi
tions
No Chronic Condition 1 Condition
2 or 3 Conditions
2
1%
23% 21%
35%
Good to excellent general health
Self-reported health metric:
Good to excellent mental health
Poor health limits activities82%
82%
21%
83%
74%
64%59% 57%
30%
43%
48%52%
72%
68%
55%
40%
26%
16%
None 1 condition 2 conditions 3 conditions 4 conditions 5+ conditions

Burden of the Three Qualifying ConditionsThe burden of the three chronic conditions that can qualify residents to receive HHAP CHW services differs by age, gender, and race/ethnicity. Hypertension and diabetes increase directly with age, while current asthma burden peaks among adults aged 50 to 64.
Women are three times more likely to report experiencing current asthma episodes than men (15% vs. 4%). Hypertension is also more common among women than men (58% vs. 45%), except among younger adults aged 35 to 49 (28% vs. 26%). Men and women have similar levels of diabetes (29%).
While there are no differences in current asthma or diabetes levels between race/ethnic groups, nearly two-thirds (63%) of Black adults have hypertension, compared to 51% of Latino residents.
““I’m always in pain with my legs and ankle and back. When I don’t feel well, I get depressed because if I am walking with a cane then my ankles swell up. I take a lot of medication. I have high blood pressure. I take medication in the morning and at night. And me, I get depressed.”
13
Prevalence of asthma, diabetes, and hypertension, by age group
35-49 years 50-64 years 65+ years
14% 13% 15%
33%
7%
40%
Current asthma
Diabetes
Hypertension
28%
59%
74%

Sources of Health Care and Insurance Coverage
Insurance Coverage In the five targeted developments, almost all (95%) NYCHA residents aged 35 years and older report having health insurance coverage. Medicaid is the leading form of coverage for NYCHA residents (49%), followed by Medicare (25%) and employer- sponsored health insurance (18%).
Employed residents are less likely to report health insurance coverage than residents who are retired or unable to work (89% vs. 98%). Half of all employed residents receive their coverage under government subsidized insurance plans (Medicaid or Medicare). More than three quarters (76%) of employed residents with a college degree have employer-sponsored health insurance, compared to 53% of employed residents with a high school diploma and 22% of those with no high school diploma.
Even with health insurance, many NYCHA residents experience problems with insurance or gaps in coverage. Overall, among insured
residents, 28% had a problem with their insurance in the past year, and 10% went
14
Health insurance problems experienced
Percentage of insured residents
Experienced a problem or were denied payment for a service 28% Experienced a problem 20% Getting or obtaining coverage 8% Resolving health care billing issues 8% Finding affordable care 7% Getting through or “navigating” the health care system 7% Appealing decisions by health insurance 4% Another problem 3% Plan refused to pay for a medical service received or desired 15%
Health insurance distribution
Employer-sponsored
Medicaid Medicare Other
46%
18%
22%
49%
22%25%
9% 8%
NYC adults
NYCHA residents in the HHAP developments*
*Residents aged 35 and older with health insurance

15
without insurance for a period of time in the past year. Other insurance-related problems residents describe include facing difficulties resolving health care billing issues, having their plan refuse to pay for medical services, and navigating the health care system.
Focus group participants expressed frustration with various aspects of navigating health benefits.
Medical Visits Although most residents report using a health clinic or a private doctor’s office on a regular basis, nearly one in five (18%) residents relies on emergency departments (EDs) for regular medical care. The use of EDs is more common among Latino than Black residents (20% vs. 14%), and particularly common among foreign-born Latino residents (24%).
“Sources of regular medical care
Oth
er
Health Clinic
An E
mergency Room A Private D
octor’s
Off
ice
5
%
42%
18%
35%
“I think we need better Medicaid. Every time, I go through that whole long process and then I [find] out I have been cut off. And then I have to go through the whole long process all over again.”
“Then I drink a pill—this pill cost $100. I had to fight for it. My insurance didn’t want to pay for it, but then I [called] them, and I fought for it. I told them, if I had money I would pay for it—but I don’t. I told them it [is] not your life. It is my life. But then I had to go through it. I was taking this medicine for so many years but it was—like—why are they taking it away from me?”
“If you are hospitalized and you need anesthesia, they are working on a team. And then they need your insurance, but then you find out, this [one] guy working on you … was not covered by the insurance. They need to know that certain doctors are covered. They shouldn’t have had him on the team in the first place.”
“Yeah, it is stressful. Because whatever money you have in your pocket, it is—like—why now? You get stressed; you get headaches. It is—like—give me my medication because I am poor, but don’t charge me or whatever. It is about trying to put me on the street. It is all about money. Why is it that they aren’t here to see us? Do you see what I am saying?”

Results based on telephone survey responses using a representative sample of NYCHA residents aged 35 and older (n=1100), December 2014-January 2015
1 - 9
10 - 24
25 - 79
195 - Metropolitan Hospital
395 - Mount Sinai Medical Center
Primary Care FacilitiesUse by participants in proportional symbol
NYCHA intervention developments in baseline survey
Percentage and estimated number of residents aged 35 and older who attend Harlem health care locations based on the population of the five developments:
Mt. Sinai Medical Center..................30%(~1,900 residents)
Metropolitan Hospital .......................11%(~700 residents)
Advantage Care Physicians ...............6%(~400 residents)
Settlement Health ................................3%(~200 residents)
EAST 116 STREET
16
Sources of Health Care Services The doctor’s office or clinic most often visited for primary care among residents in this community is Mt. Sinai Medical Center (30%), followed by Metropolitan Hospital (11%), Advantage Care Physicians (6%), and Settlement Health (3%). There are many other clinics and offices in Northern Manhattan that attract small numbers of residents.
Care When Needed Receiving timely and consistent care is important for managing chronic diseases. Among all residents, 14% report an instance in the past 12 months when they needed medical care and did not receive it. Residents between the ages of 50 and 64 most often report this.
35-49 years
50-64 years
65+ years
15%
18%
9%
All residents14%
Needed medical care in past 12 months and didn’t receive it, by age
Medical institutions where NYCHA residents with chronic illness seek primary health care

17
Regular Primary Care ProviderAmong residents, 85% report having one or more people they think of as their personal doctor or health care provider, with women and Black residents more likely to report having an ongoing relationship with a provider than men or Latino residents. Residents who are retired or unable to work are also more likely to report having a primary care provider compared to those who are employed.
Among residents with a personal doctor, nearly all (91%) have seen their doctor in the past 12 months. Women are more likely than men to have visited a doctor in the past year (93% vs. 87%).
In focus groups, residents commented that medical system staffing practices undermine their ability to have a long term relationship with a primary care physician.
““I had a doctor that I had for 10 years and he knew me, but when they started this HMO thing, I keep getting a new doctor every six months. I don’t get a chance to know my doctor. If we don’t know the doctor, if we don’t have a chance, then we need to.”
“Your doctor is not that accessible. You have to make an appointment just to ask a question, you don’t get the doctor, you get the receptionist, and they don’t return your call.”
“I can’t reach him. When I call my doctor, I have to go through the answer machine and the system. I need someone like a social worker or a liaison. I need someone to tell me what to do.”
Resident with primary care providers, by selected characteristics
Female
Male
Black
Latino
Retired/Unable to work
Employed
88%
79%
89%
82%
89%
80%
All residents85%

Chronic Disease Management
There are many challenges to controlling chronic disease, such as adhering to medication, treatment or behavior plans, finding financial and social support, and acquiring the confidence and skills to carefully manage one’s condition(s). Overall, more than four out of five (83%) residents feel that they are doing a good or excellent job taking care of their health.
HypertensionAmong Harlem NYCHA residents with diagnosed hypertension, almost nine in 10 (89%) residents report taking medication as advised by their doctor, 6% report that they were not advised to take medication, and 5% report that they were advised to take medication but are not doing so. The percentage using medication when advised is slightly lower among residents who are employed, between the ages of 35 to 49, or of higher education (data not shown).
Nearly one-third (31%) of residents with hypertension report that they sometimes forget to take their hypertension medicine. Adults under the age of 65 forget to take their medication more often than older adults (36% vs. 25%). When stratified by employment status, the residents who most frequently report forgetting are employed adults (44%).
Less than half (45%) of residents with hypertension check their blood pressure at home. Men with hypertension more often report checking blood pressure at home than women (53% vs. 42%). This also differs by race/ethnicity, with over half (53%) of foreign-born Latino residents reporting that they check their blood pressure at home, compared to 39% of Black residents. As with medication adherence, residents who are employed are less likely to check their blood pressure compared to those who are retired or unable to work (36% vs. 46%).
18
6%
5%
89%
Currently taking medication for hypertension
Not advised to take medication for hypertension
Advised, but not taking medication for hypertension
*Among those who have been told they have hypertension
Hypertension medication adherence*

DiabetesThe A1C test is an effective tool to test blood sugar and manage diabetes. Three-quarters (76%) of residents with diabetes have had their A1C tested in the past 12 months, while one in 10 (10%) have not had their A1C checked, and another 15% are not sure or have not heard of the test.
Among residents with a diagnosis of diabetes, 30% report taking insulin and 69% take oral hypoglycemic agents. Almost three in five (59%) report taking insulin or oral hypoglycemic agents only, 20% take both insulin and oral medication, and 21% report taking neither. Residents who are employed more often report not taking medication for their diabetes than those who are retired or unable to work (35% vs. 14%).
Among diabetic residents, almost one in 10 (8%) have been hospitalized in the past 12 months due to diabetes. The proportion of
diabetic residents reporting hospitalizations increases with additional co-occurring chronic conditions and differs by education level. Residents with less than a high school education are more than twice as likely to report hospitalizations than those with a high school education or more (11% vs. 5%).
19
““Me, I am a constant hospital person because of diabetes. It has affected my life really bad. It is like breaking my body down. My A1 is so high that they cannot bring it down and that is the main thing.”
Any hospitalization in the past 12 months due to diabetes, among diabetic residents
Less thanhigh school
High schoolor more
0 to 1 2 3 4+
11%
5%
0%
4%
11%
16%
Education Number of Additional Chronic Conditions

20
AsthmaResidents with asthma report having a personal doctor or health care provider more often than those without asthma (98% vs. 90%). More than a third (35%) report using an emergency room or urgent care facility within the past 12 months. Women with asthma are almost twice as likely to use an emergency room or urgent care facility compared to men with asthma (38% vs. 21%).
Barriers to Chronic Disease ManagementResidents express difficulty finding the information and resources required to manage their conditions.
Unfavorable side effects can impact medication adherence, and close coordination between providers and their patients is needed to ensure that patients are taking medications that work for them. In some of
the remarks on medication, residents said they withhold information about discontinuing medications from their doctors.
““I was diagnosed with hypertension six months ago. To this day, the doctor still hasn’t explained to me what I should eat, what I should do, how to take my medicine. All he did was give me a prescription and send me home … I still don’t know anything about what to eat or how to keep myself healthy. That is why I am here because I heard I could find help.”
“They just try to pawn you off to someone else like the nutritionist or the other lady who looks at your sugar. The diabetic specialist, the doctors, they don’t really have much time to talk.”
“ “They prescribe it and it doesn’t work with me. I stopped taking it and I felt better. The doctor even said, whatever you are doing, keep doing it. And then I didn’t tell them that I stopped taking the medicine.”
“I listen, but when I go to the doctor, I just say okay. But my problem is that I don’t take my medication.”
“These pills make me feel terrible, all of them: ‘Here, take more insulin.’ I want to stop taking my insulin, because if I am going to die, this is how I want to be ... ”
M is a male resident and participant with asthma and hypertension.
“I’m an asthmatic. My breath went in the street and I thought I was going to die. It happened twice. Not good. My air went. Nobody knows. I couldn’t breathe. There [were] people right around. They didn’t know what to do. Say something. Do something, I thought ... Now I know I have to keep my weight down and I have to take care of myself. The pump it helps me a lot. And a pill, which my insurance doesn’t want to pay for ... which I have to fight for ... I’ve been taking the pill for years ... why do I have to fight for it?” ”

Modifiable Risk Factors
SmokingOne in five (21%) of NYCHA adult residents in the five developments surveyed currently smokes—12% smoke every day, and 9% smoke less often than every day. Residents aged 65 years or older smoke less often (12%) compared to adults aged 50 to 64 (28%) and 35 to 49 (22%).
Overall, current smoking is more common among Black residents than Latino residents (26% vs. 16%). Among Latino residents, smoking is more common among men than women (22% vs. 14%). Foreign-born residents have much lower smoking rates than those born in the U.S.
Most (87%) residents live in households where they are not exposed to secondhand smoke from other household members. Compared to nonsmokers, smokers are more likely to live with another smoker.
More than a quarter (27%) of residents with current asthma report smoking, compared to 18% of residents without asthma.
21
Currently smoking, by age
Currently smoking, by asthma status
Citywide estimate of smoking among adults aged 35+
65+ years50-64 years35-49 yearsTotal
12%
28%
22%21%
No asthmaCurrent asthma
18%
27%
Current smoker 16%
Source: NYC Community Health Survey 2013, adults aged 35+
BlackLatino
Latino maleLatina female
U.S.-born residentForeign-born resident
26%16%
22%
14%
29%
10%
All residents21%
Citywide estimate16%
Currently smoking, by selected characteristics

22
ObesityObesity is a risk factor for several chronic conditions, including hypertension and diabetes. Three-quarters (77%) of Harlem NYCHA residents aged 35 and older are overweight or obese.
Obesity is more common among residents 50 to 64 years of age, women, Black adults, U.S.-born Latino adults and residents with a chronic condition.
Calculating the Percentage of Overweight and Obese Residents
Survey participants were asked to report their height and weight. This information was used to calculate Body Mass Index (BMI). Adults who have a BMI between 25 and 30 are considered overweight; those with a BMI of 30 or greater are classified as obese. Underweight Normal Overweight Obese
2% 3%
35%
20%
37%34%
26%
44%
NYC adults
NYCHA residents in the HHAP developments
Obesity distribution
MaleFemale
Qualifying chronic condition
No qualifying chronic condition
BlackU.S.-born Latino
Foreign-born Latino
35-49 years50-64 years
65+ years
All residents44%31%
48%
49%
34%
49%54%
35%
44%50%
36%
Obesity among adult residents, by selected characteristics

Diet and NutritionOverall, 14% of NYCHA residents report that their diet is somewhat or very unhealthy. Reports of an unhealthy diet are more common among women, Black residents, and those with lower education. Residents with one of the three qualifying chronic conditions are more likely to report a somewhat or very unhealthy diet than residents without those conditions (16% vs. 11%).
Overall, reports of an unhealthy diet increase with the number of chronic conditions. The proportion of residents reporting an unhealthy diet rises from 7% among residents with no chronic conditions to 25% among residents with five or more chronic conditions.
Food insecurity refers to when people do not have consistent access to adequate food due to lack of money and other resources. Nearly one-third (32%) of residents are concerned with having enough food for themselves and/or their families. Food insecurity decreases with age; 37% of adults aged 35 to 64 report food insecurity, compared to 23% of adults aged 65 years and older.
23
““I think it’s more challenging raising a family on one income. It makes it, you know, [financially] difficult to eat healthy because of, I guess, the culture I grew up in and was raised in. It is hard to combine healthy and culture and what is affordable.”
Male
Female
Qualifying chronic condition
No qualifying chronic condition
BlackU.S.-born Latino
Foreign-born Latino
Less than high school
High schoolCollege
8%
16%
16%11%
17%16%
11%
18%
12%
10%
All residents14%
Reported unhealthy diet, by selected characteristics
Reported unhealthy diet, by number of chronic conditions
None 1condition
2conditions
3conditions
4conditions
5+conditions
7%
11%12%
20%
15%
25%

24
Physical ActivityOverall, almost two-thirds (65%) of Harlem NYCHA residents report that they are very or somewhat physically active. The percentage of residents who are active decreases with age, from 70% of residents aged 35 to 49 to 62% of residents aged 65 years or older, as well as by the number of chronic conditions they have.
When asked about whether they have exercised within the past 30 days, including running, dancing, walking, gardening, yoga, and other vigorous or moderate activities
apart from their regular jobs, more than half (55%) of the adult residents say that they have, compared to 72% of NYC adults aged 35 and older. Black residents more often report participating in recent exercises than Latino residents (63% vs. 48%). Physical activity also differs by employment status, as employed residents report engaging in exercise more than retired or disabled residents (60% vs. 52%).
“
“
“I don’t exercise. I started walking, but by me having asthma, my breathing is not good. I try, but I have to stop. At the center we walk around the gym, I get up to walk around like six times, and then I went to the hospital so I haven’t started back doing any exercise yet.”
“I can’t afford the gym or the organic food. I can’t afford the healthy food. There is a lot of things I can’t afford.”
“It’s still difficult to completely eat healthy because it’s not as affordable so it’s a challenge.”
“I [tried] to go to the gym, but it was too expensive.”
None 1condition
2conditions
3conditions
4conditions
5+conditions
27%25%
36%
45%42%
49%
Very/somewhat physically inactive, by number of chronic conditions

25
“ “I’m raising three boys. They are always hungry and I have to [choose] quantity over quality … it’s more challenging raising a family on one income.”
“If you were just cooking for yourself, you can just do what you want to do. But when you cook for other people you can’t give them what food you would cook for you. And then you want to sit down and eat with them.”
M is a Latina resident diagnosed with diabetes and hypertension.
M is concerned about her diabetes; she reported that her grandmother and father both died of the disease. She is the family breadwinner, with little time to care for herself and a lot of anxiety, which keeps her up at night:
“I do not work out regularly. I think I work too hard. I work six days a week and since I can’t afford to eat out, I have to cook for these kids. I am exhausted because on top of that, I don’t sleep very well.” ”
Barriers and Facilitators Residents report many barriers to healthy eating and physical activity, including juggling multiple responsibilities and facing economic and health challenges.
Residents highlight affordability as a barrier to both healthy eating and physical activity.
Several residents feel challenged to satisfy household or familial expectations for healthy eating.
Many residents note that health limitations prevent them from engaging in physical activity.
Residents find support by exercising in groups or with others.
““I want to walk and sometimes I can’t really make it or I am breathing hard because I am going up the hill. It stops me from doing more, especially from riding the bike … It has stopped me from being more active.”
“I have two younger kids and this is my third one. You know, kids are very active and when I am playing with them, I get winded … I have to sit every five to 10 minutes to catch my breath. I can’t play with them like how I want to.”
“Exercising in groups motivates you.”
“I do group exercising on Saturdays; I think those are the good things because you get the camaraderie. I like the commitment of having somewhere to go.”

Neighborhood Environment and Social Support
A person’s environment can influence his or her health. The majority of residents agree that their neighborhood is pleasant to walk in, provides opportunities to be physically active, and has a large selection of fruits and vege-tables available. However, residents indicate they feel insecure about other things. Almost two in five (37%) residents feel that people in their neighborhood cannot be trusted, 39% feel that people in the neighborhood do not share the same values, and 33% don’t feel safe walking in their neighborhood.
Reports of trust are more common among Latinos, elderly residents, those with less than a high school education, and foreign-born residents (data not shown).
While over half (59%) of residents have three or more friends or relatives they could call for help, 29% have fewer, and 12% report
having none at all. A sizeable minority (20%) of residents leave their home infrequently (two or fewer times in an average week), and 17% report often feeling lonely.
26
Perceptions of the neighborhood*
Social resources among adult residents
Do not have help available
Leave homeinfrequently
Often lonely
17%
20%
12%
Has large selection of fresh fruits/vegetables available
Often see other people exercising
Is pleasant to walk
Opportunities to be physically active
Safe for walking day or night
People share the same values
People can be trusted
Agree Disagree
18%71%
19%69%
25%55%
27%52%
33%49%
39%32%
37%30%
*Percentage of those with neutral response is not shown

Multiple chronic conditions can confine individuals to their homes. Many (61%) residents leave their home every day, but the percentage declines as the number of chronic conditions a resident has increases.
Poor mental health is also associated with social isolation. While two-thirds (66%) of residents with excellent to good mental health leave home every day, less than half (46%) of residents in fair or poor mental health leave their home every day. Nearly one-third (30%) of those in fair or poor mental health leave their home infrequently.
Feelings of loneliness are more concentrated among residents reporting fair/poor mental health than those not (31% vs 11%). Almost a quarter (24%) of foreign-born Latino residents report feeling lonely, compared to 13% of U.S.-born Latino residents.
27
Percent who are often lonely
““I usually talk to myself because no one wants to hear it. No one wants to hear your problems. Today my son said ‘How is your diabetes?’ and I say, ‘Today my lung hurts.’ He tells me why does things always hurt and he tells me to go out, but I don’t want to. I just stay home lonely and stressed out and crying. Maybe I need a husband or something.”
Percent of residents who leave home every day by number of chronic conditions
None 1condition
2conditions
3conditions
4conditions
5+conditions
75%
72%
60%
54%
44%
39%
Excellent/good mental health
Fair/poor mental health
BlackU.S.-born Latino
Foreign-born Latino
EmployedRetired/unable to work
All residents17%12%
13%
31%
24%
12%20%
11%

Community Service Utilization
NYCHA offers programs and services to enrich the lives of residents. The five developments targeted by the HHAP intervention each offer community programs in dedicated facilities. Three of the NYCHA developments (Taft, King Towers, and Lehman Village) have senior centers, while Johnson offers senior programs within the community center and Clinton has no senior center.
Overall, more than one in five (22%) residents use community centers—13% visit once a week or less and 9% visit multiple times a week.
Visiting a community center is more common among college graduates and Black residents compared to those with less education and Latino residents. Community center use does not vary depending on which NYCHA development a resident lives in.
Overall, about a quarter (24%) of residents 60 years old or older use a senior center. Among
adults 60 years and older, using any senior center was lowest among Clinton House residents (13%) and highest among Taft House residents (30%).
28
Once a week or less Multiple tim
es a week
Never
13% 9%
78%
Used a community center in the past 3 months

29
Interest in Community Health Workers (CHWs) At the time of the survey, more than half (60%) of the NYCHA residents were not familiar with the concept of CHWs. Among residents with asthma, diabetes, and/or hypertension, nearly half (47%) said they were interested in being contacted about the program. Both men and women had a similar level of interest. Favorable response was strongest among adults under 65 years and those with limited social resources.
Focus group participants had numerous suggestions for how community health workers might benefit them. They suggested that CHWs could provide education and support in disease management, help them navigate the health care system, help them purchase and prepare healthy food, and encourage physical activity among seniors, adults, and children. Participants also felt that CHWs should be empathetic and compassionate.
““As far as I am concerned, I need someone to show me what you are talking about. Come to my house, show me what to cook and what to not cook, don’t give me a recipe. I need someone to show me and this is how I learn. That’s pretty much how I cook … ”
“Maybe we can get someone in the community who can explain these charts the doctors give us.”
“If someone was highly trained I would be open to talk to him or her. Also, if this person has good human nature and is straightforward.”
“I want someone who knows what we eat and how we can modify that and also teach the next generation because it is so difficult.”
Percent of qualified residents* interested in working with CHWs
Excellent/good general health
Fair/poor general health
Hardly ever lack companions
Sometimes lack companions
Often lack companions
35-49 years
50-64 years
65+ years
*Adults with asthma, diabetes, or hypertension
40%
53%
37%
55%
68%
57%
51%
37%
All residents47%

Recommendations
Findings from the HHAP community needs assessment have captured many of the specific challenges and needs of residents in this community, particularly those living with chronic conditions. Based on these findings, we propose the following recommendations for the project and for stakeholders engaged in the community:
Outreach Our findings highlight the unique needs of demographic subgroups, depending on age, gender, ethnicity, health status, language, culture, income, and employment status. HHAP leadership will need to expand its outreach strategy to target different demographic subgroups, particularly hard-to-reach residents, such as those who face social isolation, have limited mobility, have long work hours, and/or experience cultural, linguistic, or stigmatizing barriers. For example, CHWs and Health Advocates should have staggered shifts to cover some evenings and weekends, and HHAP should partner with organizations that reach into homes, such as Meals-On-Wheels and Visiting Nurse Service, for homebound seniors or other reclusive adults. Outreach materials should be adapted to ensure that the content is culturally and linguistically appropriate to foreign-born and limited-English-proficient groups represented in the community. To capture the broadest range of residents, most outreach efforts should take place on the NYCHA campus and involve surrounding community institutions, including social service agencies and faith-based organizations. Outreach efforts should be carefully tracked to determine which are most effective at mobilizing different demographic groups within the community.
Workforce Development Both CHWs and Health Advocates play an important patient navigation role within clinical settings and for insurance coverage. While CHWs and Health Advocates received over a month of preparatory training that covered core competencies and a wide range of other topics, additional training and structure are needed to ensure that HHAP staff can effectively help residents navigate the care they need. Specifically, findings from the report underscore the need to address important medication and disease management considerations. During direct coaching sessions, CHWs and Health Advocates should identify residents struggling with medication management, and then guide them in considering health implications of non-adherence and approaches for discussing medication options with their provider(s).
Other pressing resident needs include services and support to address mental health problems and functional limitations. CHWs and Health Advocates should have referral resources that include potential solutions or next steps for these issues. Special training may also be required for CHWs and Health Advocates to understand and address the care complexities of residents living with multiple chronic conditions and/or disabilities, including how to develop routines for residents to
30

31
prevent additional comorbidities and how to facilitate access to long-term care coverage and services such as home care, durable medical equipment, and case management. Training should ensure that CHWs and Health Advocates are proficient in interacting with existing caregivers. Health Advocates should receive ongoing technical assistance to strengthen their Medicaid and Medicare counseling to residents and their ability to effectively navigate coverage issues.
CHWs, Health Advocates, and community members will also need training to become effective advocates of systemic community change to reduce health disparities. Leadership talent in the community and program workforce will have to be nurtured by HHAP directors for effective advocacy to flourish.
Program ImplementationThrough group activities, CHWs have the potential to raise neighborhood cohesion and trust. This might be done by encouraging residents to participate in youth sports activities, neighborhood walks/runs, or gardening events.
The role of HHAP CHWs includes community education about disease prevention. Community-based nutrition education activities should be targeted to meal preparers in the home as well as larger community to help integrate cost-effective, enjoyable, and culturally-acceptable meals appropriate for a community with high rates of obesity, diabetes, and hypertension. CHWs should collaborate with existing local free and
affordable fitness programs and service providers, such as Shape Up NYC, to provide referrals to fitness activities or on-site classes.
Partnerships and LinkagesHHAP has the potential to strengthen partnerships between health care providers and patients. CHWs and Health Advocates will need reliable agency relationships to successfully link/refer residents with resources for their pressing health and social needs. The referral process should be structured to ensure referrals are successful. Documentation should be kept up-to-date on referral resources and the success/failure of past referrals. Dominant hospital medical centers and insurance providers in Central and East Harlem may wish to become partners to align program referrals with HHAP. Nutrition, fitness, disease management, and smoking cessation programs could be cross-promoted.
Some community members need help connecting with appropriate preventive care since they are relying on hospital EDs for treatments. Health Advocates and CHWs should provide residents with information about primary care options available in the community, including patient-centered medical homes, which offer coordinated, team-based, and comprehensive care, and can potentially reduce out-of-pocket costs for residents. Given the large proportion of Spanish speaking residents, HHAP partners should identify CBOs that cater their services to Spanish-speaking individuals.

Finally, HHAP leadership should engage with Partners in Performing Provider Systems in Harlem to encourage leveraging Delivery System Reform Incentive Payment (DSRIP) funds, especially those tied to Project 11 (see box), to expand place-based initiatives like HHAP that use CHWs, Health Advocates, or other community-based extension workers to discourage unnecessary ED visits, encourage utilization of non-emergency primary care services, and maximize patient self-efficacy in navigating services they may require.
Summary
Based on information gained from this in-depth community needs assessment and from CHW and Health Advocate experiences during the initial launch of the HHAP initiative, we identified a strong need for community-level health advocacy to address the high burden of chronic illness in East and Central Harlem.
While the original goals and strategies of the HHAP program are well suited to address these needs, in this report, we have made several specific recommendations that are most likely to impact program success going forward.
The first set of recommendations focuses on improving outreach and expanding the program’s reach going forward. The second set of recommendations identifies additional forms of staff training to ensure that CHWs
and Health Advocates are equipped to become effective community leaders. A final set of recommendations focuses on partnerships because residents struggle with more than just personal barriers to medical care. They are also collectively affected by systemic issues that result in disparate health outcomes, compared to more affluent communities.
The success of this program will depend on how well HHAP partners can build linkages with clinical providers, community service organizations, and policymakers to support residents in achieving their personal goals and effectively creating healthy communities and living environments. Going forward, ongoing evaluation of the program, with extensive opportunities for community input and feedback, is needed to ensure that the HHAP project will successfully improve chronic health outcomes as intended.
32
About Delivery System Reform Incentive Payment (DSRIP) program
DSRIP´s purpose is to restructure New York State’s Medicaid health care delivery system, with the primary goal of reducing avoidable hospital use.
Performing Provider Systems (PPS) are entities that are responsible for performing a DSRIP project.

33
Partners Involved in the Harlem Health Advocates Partnership (HHAP)
Community Service Society (CSS) is an independent, not-for-profit organization that has been at the forefront of public policy innovations that support low-income New Yorkers for more than 170 years. CSS uses a dedicated team of three community-based Health Advocates to bring health insurance enrollment and post-enrollment navigational assistance to individuals residing in the five NYCHA developments. CSS’s Health Advocates work with the CHWs to: (1) identify uninsured residents; (2) help those residents enroll into free or low-cost health insurance when eligible; (3) find free or low-cost health services if the resident is ineligible, and 4) help residents who are already insured troubleshoot health insurance and health plan problems, such as treatment denials and billing disputes. The Health Advocates also conduct workshops to help residents understand how health insurance works and fill gaps in coverage and conduct outreach alongside CHWs within and around the developments. Finally, CSS’s role also includes providing training and technical assistance to the HHAP program partners.
New York City Department of Health and Mental Hygiene’s (DOHMH’s) mission is to protect and promote the health of all New Yorkers. The DOHMH’s Center for Health Equity builds on this mission by strengthening and amplifying the Health Department’s work to eliminate health inequities, which are rooted in historical and contemporary injustices and discrimination, including racism. The DOHMH’s Center for Health
Equity invests in neighborhoods deprived of sufficient resources and attention including the South Bronx, North and Central Brooklyn, and East and Central Harlem through its Neighborhood Health Action Centers located in each of these communities. HHAP is run out of the East and Central Harlem Neighborhood Health Action Center.
New York City Housing Authority (NYCHA) provides decent and affordable housing in a safe and secure living environment for low- and moderate-income residents throughout the five boroughs. The nation’s oldest and largest public housing authority, NYCHA operates 328 developments that are home to more than 400,000 New Yorkers. NYCHA’s 178,000 units include more than half of all apartments in New York City with an asking rent of under $800 a month. NYCHA is currently implementing NextGeneration NYCHA, a long-term strategic plan that details how NYCHA will create safe, clean, and connected communities for residents and preserve New York City’s public housing assets for the next generation. NYCHA views CHW initiatives as an important opportunity to engage residents and connect them to best-in-class services, one of four NextGeneration NYCHA goals.
The NYU-CUNY Prevention Research Center (NYU-CUNY PRC) is a public-private research partnership between the New York University (NYU) School of Medicine and City University of New York (CUNY). The partnership aims to integrate evidence-based interventions

into community-clinical approaches to reduce cardiovascular disease disparities in New York City, with a particular emphasis on ethnically diverse and immigrant communities. The NYU-CUNY PRC is leading the evaluation of the HHAP project, including the community needs assessment prior to HHAP initiation.
34

35
Methodological Appendix
Tenant Survey
Survey data collection
A tenant survey was conducted from December 4, 2014 through February 3, 2015. It was meant to serve as a source of baseline information that was collected before the intervention began. Tenants were surveyed in the five NYCHA developments where the CHWI was planned to be implemented: King Towers, Taft, Johnson, Clinton, and Lehman Village.
In total, 5,000 adults aged 35 and older from the five developments were randomly selected by NYCHA to participate in the survey. Once selected, tenants were eligible if they could speak English or Spanish, and were physical and mentally fit enough to participate in a phone survey. It was expected that about 1,000 of the sampled tenants would participate in the survey and that approximately 3,500 would not participate due to non-working phone numbers, respondents not speaking English or Spanish, physical or mental incapacity, or an unwillingness to participate.
Before the survey was conducted, all selected individuals were mailed a letter explaining the survey. NYCHA also included information about the survey in newsletters.
The survey was conducted by Baruch College Survey Research, which managed Opinion Access Research. For tenants who could not be reached by telephone, CUNY research staff conducted home visits and invited residents to take the survey in person. Assistance was provided by NYCHA Community Operations staff, NYCHA resident leaders, and NYCHA community volunteers.
A total of 1,059 tenants were interviewed by phone, including 821 English-language interviews and 238 Spanish-language interviews. An additional 64 interviews were completed face-to-face. With the combined phone and face-to-face interviews, there was a 43.5% response rate (the number of people who completed interviews divided by the number of people who could have completed them), a 74.0% cooperation rate (the number of people interviewed divided by the number of people who were contacted to participate in the survey), and a 15.3% refusal rate (the number of people who refused to participate or ended the interview early divided by the number of all of the people who could have been interviewed).2
This report is based on two sources of baseline data that were collected to inform the CHW intervention development and evaluation: a baseline survey of tenants and focus groups with tenants.
2 The American Association for Public Opinion Research. 2008. Standard Definitions: Final Dispositions of Case Codes and Outcome Rates for Surveys. 5th edition. Lenexa, Kansas: AAPOR.

Survey data weighting
The data in this report were adjusted to be demographically representative of the five NYCHA developments. Percentage adjustments were made to ensure that the survey responses mirrored the total population by race, ethnicity, gender, and household role.
Precision of the survey data
The margin of error around the percentages presented in this report is +3 percentage points, at a 95% confidence level. This means that if every single tenant in the five NYCHA developments had answered the survey questions, it is 95% likely that their answers on average would have been the same as the ones presented here, within three percentage points above or below.
Data analysis and presentation
Survey data were linked to demographic information from tenant data system records and de-identified before analysis. Data were weighted as described above to be representative of adults 35 years and older in the five NYCHA developments.
Percentages were calculated after dropping “don’t know” and “refused” responses from the denominator. As a result, there are modest sample size differences presented in the report. Percentages have been rounded to the nearest whole number and are not age-adjusted. Some totals may not equal 100% because of rounding. Chi-square tests
were computed to determine significant differences between prevalence estimates. Only significant differences (p<0.05) are discussed in the text.
Tenant Focus Groups
Focus group data collection
Focus groups with NYCHA tenants were conducted in December 2014. Outreach to invite tenants to the focus groups was made at health fairs, cultural events, and meetings held at Community Centers at NYCHA social service agencies. Flyers about the focus groups were also posted in NYCHA apartment buildings. In order to be eligible to participate, tenants had to be residents of the five developments, ages 35-65, English- or Spanish-speaking, and have a self-reported diagnosis or family history of diabetes, asthma, and/or hypertension.
The focus groups were conducted at DOHMH’s East Harlem Neighborhood Health Action Center, as well as the CUNY School of Public Health. Each focus group was led by a trained NYU staff member, and lasted approximately 1.5 to 2 hours. A total of six focus groups were completed, with a total of 55 tenants participating. Topics covered included barriers and facilitators to disease management and engaging in healthy behaviors, preferred methods of health education and promotion, and acceptability and motivation to participate in a CHW intervention.
36

37
Data analysis
All focus groups were audio-recorded and later transcribed for analysis. Data were analyzed using the constant comparison analytic approach, meaning that analysts simultaneously identified themes in the focus group materials, and compared each focus group with the previous ones to understand the full picture. Atlas.ti© was used for data coding.
Tenant Data System
The developments’ characteristics and tenant income data were taken from NYCHA’s tenant data system, which is updated twice a year. This database contains household-level data for every occupied unit within NYCHA developments.
New York City Community Health Survey
Citywide estimates were taken from the 2013 Community Health Survey (CHS). CHS 2013 data are weighted to the NYC adult residential population per the American Community Survey, 2012. The estimates were prepared by DOHMH’s Bureau of Epidemiology Services in October 2015. Estimates are not age-adjusted.
Suggested CitationFeinberg A, Seidl L, Levanon Seligson A, Pinzon J, Mata A, Gray L, Myers C, Drackett E, Islam N, Riley L, Cromeyer E, Lopez P, Lopez J, Maybank A, Thorpe L. Launching a Neighborhood-Based Community Health Worker Initiative: Harlem Health Advocacy Partner (HHAP) Community Needs Assessment. A joint report by the NYU-CUNY Prevention Research Center, New York City Department of Health and Mental Hygiene, New York City Housing Authority, and Community Service Society, December 2015.
AcknowledgmentsThank you to the following individuals who contributed to this report:
Najuma Abdullah, Violeta Alvarado, Noah Amuzu, Kevin Anderson, Sonia Angell, Eugene Averkiou, Sindia Avila, Michelene Blum, LaShawn Brown-Dudley, Thomas Cannell, Lauren Carey, Matthew Caron, Shadi Chamany, Georges Compagnon, Iris Cooney, Brigitte Cousins, Nneka Lundy De La Cruz, Cynthia Curry, Sheila Desai, Cadine DeSouza, Khady Diaby, Katherine Earle, Ayman El Mohandes, Folake Eniola, Anne-Marie Flatley, Aline Da Fonseca, Martin Frankel, Marc Gourevitch, Cynthia Greaves, Fangtao He, Diana Herrera, Yong Hwang, Maritza Martinez, Yaxkyn Mejia, Lara Rabiee, Adam Ramos, Nerisusan Rosario, Charlene Ryan, Margaret Ryerson, Crystal Sacaridiz, Tara Smith, Jamil Soriano, Cassiopia Toner, Albert Tovar, Diane Vasquez, Sterling Walker
We would like to acknowledge all of the staff in the NYC Health Department who have contributed to the HHAP project, in particular, for vision and leadership from Commissioner Dr. Mary T. Bassett and Executive Deputy Commissioner Dr. Oxiris Barbot and the work of the Department’s Center for Health Equity staff. We would also like to thank NYCHA’s executive staff, resident leaders, borough Property Management staff, and Community Operations staff for their support, and the many active residents and community leaders who provided feedback on the report findings at resident meetings. Last, a special thank you to the Baruch College Survey Research team for careful execution of the telephone survey.
Supported in part by the Centers for Disease Control and Prevention under award number U48DP005008. The content is solely the responsibility of the authors and does not necessarily represent the official views of the Centers for Disease Control and Prevention.

Center for Health Equity