lava flow surface textures: sir-b radar image texture, field ... · pahoehoe lavas near the vent,...
TRANSCRIPT
Lava Flow Surface Textures: SIR-6 Radar Image Texture, Field Observations, and Terrain Measurements Lisa R. Gaddis*, Peter J. Muugi~zis-Mark, and Juan N. Hayashi Planetary Geosciences Division, Hawaii Institute of Geophysics, University of Hawaii, Honolulu, HI 96822
ABSTRACT: Space Shuttle Imaging Radar (SIR-8) images, field observations, and small-scale (cm) terrain measurements are used to study lava flow surface textures related to emplacement processes of a single hawaiian lava flow. Although smooth pahoehoe textures are poorly characterized on the SIR-B data, rougher pahoehoe types and the a'a flow portion show image textures attributed to spatial variations in surface roughness. Field observations of six distinct lava flow textural units are described and used to interpret modes of emplacement. Terrain measurements of these units show that surface roughness differs across and along the flow, apparently due to shear during flow emplacement. The radar smooth/rough boundary between pahoehoe and a'a occurs at a vertical relief of -10 cm on this lava flow. While direct observation and measurement most readily yield information related to lava eruption and emplacement processes, analyses of remote sensing data such as those acquired by imaging radars and altimeters can provide a means of quantifying surface texture, identifying the size and distribution of flow components, and delineating textural unit boundaries.
INTRODUCTION
0 BSERVATIONS AND MEASUREMENTS of lava flow surface tex- tures, including varieties of pahoehoe, a'a, and transitional
lavas, have been used for many years to study lava eruption characteristics and emplacement processes (e-g., Wentworth and Macdonald, 1953; Swanson, 1973; Hulme, 1974, Peterson and Tilling, 1980; Lipman and Banks, 1987). Because it is often not possible to observe the eruption and emplacement of lava flows, particularly those of volcanic terrains in remote parts of the Earth and on other planets (e.g., Mars, Venus), the study of post-eruption volcanic landforms represents an important means of understanding volcanic activity as it has occurred in the past and as it is expected to occur in the future. Orbital remote sens- ing data acquired at visible, near-infrared, and microwave wavelengths provide a means of characterizing the regional geologic setting of volcanoes (cf. Francis and Baker, 1978; Kaupp et al., 1986; Greeley and Martel, 1988; Gaddis et al., 1989). In this paper, digital radar images acquired by the second Shuttle Imaging Radar (SIR-B) system, field observations, and terrain roughness (cm-scale) measurements are used to examine sur- face roughness or "textural" variations and their utility for char- acterization of eruptive style and emplacement processes of a lava flow. This analysis extends the work of others in the study of lava flow surface textures by focusing on a detailed analysis of the morphology and inferred origin of textural units along the entire length of a single lava flow. The lava flow investigated was erupted in December 1974, and is located along the South- west Rift Zone of Kilauea Volcano, Hawaii. The simple char- acter and short duration of the December 1974 eruption, the presence of a variety of flow surface textures, and the isolated nature (i.e., physically separate from other recent flows) of this lava flow make it an ideal focus of such an investigation.
The use of SIR-B data in the geologic analysis and interpre- tation of eruptive history of Kilauea Volcano has been described by Gaddis et al. (1989). These authors noted variations in radar image brightness along the length of the December 1974 flow and suggested that these variations reflect differences in surface texture produced during flow emplacement. This paper pre-
*Now at the Department of Geology, Arizona State University, Tempe, AZ 85287.
PHOTOGRAMMETRIC ENGINEERING AND REMOTE SENSING, Vol. 56, No. 2, February 1990, pp. 211-224
sents a detailed analysis of these lava flow surface textures on scales of centimetres to kilometres, with the ultimate goal of assessing the utility of remote sensing data such as those ac- quired by imaging radars and altimeters for characterizing lava flow emplacement processes. First, the characteristics of the December 1974 lava flow as it appears in the SIR-B data are described to examine the utility of these data for distinguishing, lava flow textural variations over an area of a few square kilo- metres. Second, field observations of six lava flow surface tex- tural units and the use of those unit characteristics to interpret the mode of emplacement of the December 1974 lava flow are presented. Small-scale surface roughness data obtained from direct measurements at 13 sites along and across the December 1974 flow were then used to quantify field observations and to relate them to the SIR-B data. Analyses of such high-resolution surface profiles may aid in the interpretation of topographic data acquired by instruments such as the Airborne Laser Alti- meter (Garvin and Williams, 1988). Finally, an image analysis technique was applied to the digital SIR-B data to determine the relationship between radar image texture and surface textural variations as they are observed on the December 1974 lava flow. In conclusion, the utility of lava flow surface textural informa- tion (as it can be obtained in the field, through terrain rough- ness measurements, and through radar observations) for characterization of flow eruption and emplacement processes is evaluated.
Gaddis et al. (1989) describe the geologic setting of Kilauea Volcano in the context of the SIR-8 data. The major structural components of Kilauea Volcano are the summit caldera complex and the Southwest and East Rift Zones; SIR-B coverage was limited to the summit and Southwest Rift Zone (SWRz) of Kilauea (Figure 1). The summit is dominated by Kilauea Caldera (4.0 krn across, up to 120 m deep) which is ringed by a series of arcuate step faults on the northeastern and western sides, while the southern rim of the caldera is a low, ash-mantled rise. The pit crater Halemaumau (900 m across), the sites of most of the historic volcanic activity at the summit, is located in the southwestern floor of Kilauea Caldera.
The SwRz extends southwest -30 krn from Kilauea Caldera to the ocean. It lies at the base of the southeastern border of
0099-1112/90/5602-211$02.25/0 01990 American Society for Photogrammetry
and Remote Sensing
PHOTOGRAMMETRIC ENGINEERING & REMOTE SENSING, 1990
- 2 km Great Crack
during lava flow emplacement (e-g., Wentworth and Macdonald, 1953; Swanson, 1973; Peterson and Tilling, 1980; Fink, 1980; Kilburn, 1983; Lipman and Banks, 1987). First described by Dutton (1884), the most common physical forms of basaltic lava are "pahoehoe" and "a'a", a single lava flow may be comprised of both pahoehoe and a'a, with no compositional variation observed. Because pahoehoe has been observed often to undergo an irreversible textural transition to a'a, pahoehoe is considered the more primitive lava type (e.g., Macdonald et al., 1983). Pahoehoe is described by Macdonald (1953) as having a smooth, billowy, or ropy surface, while a'a has a rough, spinose, clinkery surface. In general, pahoehoe flows are thinner than a'a flows, averaging less than 1 m in thickness, while a'a flows are often up to several metres thick (Macdonald et al., 1983). Additional characteristics of pahoehoe flows are their low viscosities, their smooth, glassy surfaces (consisting of a rapidly cooled layer up to several cm thick), abundant near-surface vesicles often with spherical or spheroidal shapes, and the presence of lava tubes. -
15 km Although a wide variety of pahoehoe flow types have been observed, including shark skin, filamented, corded, and entrail
(a) pahoehoe (Wentworth and Macdonald, 1953; Macdonald, 1953, 1967), types commonly observed in Hawaii are shelly pahoehoe, sheet pahoehoe, and slab pahoehoe (Swanson, 1973).
ERUPTION OF THE DECEMBER 1974 IAVA FLOW
Kilauea Volcano erupted virtually continuously from May 1969 to July 1974, with most of the activity centered at Mauna Ulu on the East Rift Zone (e-g., Moore et al., 1973; Swanson, 1973; Macdonald et al., 1983; Stearns, 1985). While eruptive activity at Mauna Ulu ceased near the end of July 1974, a series of small
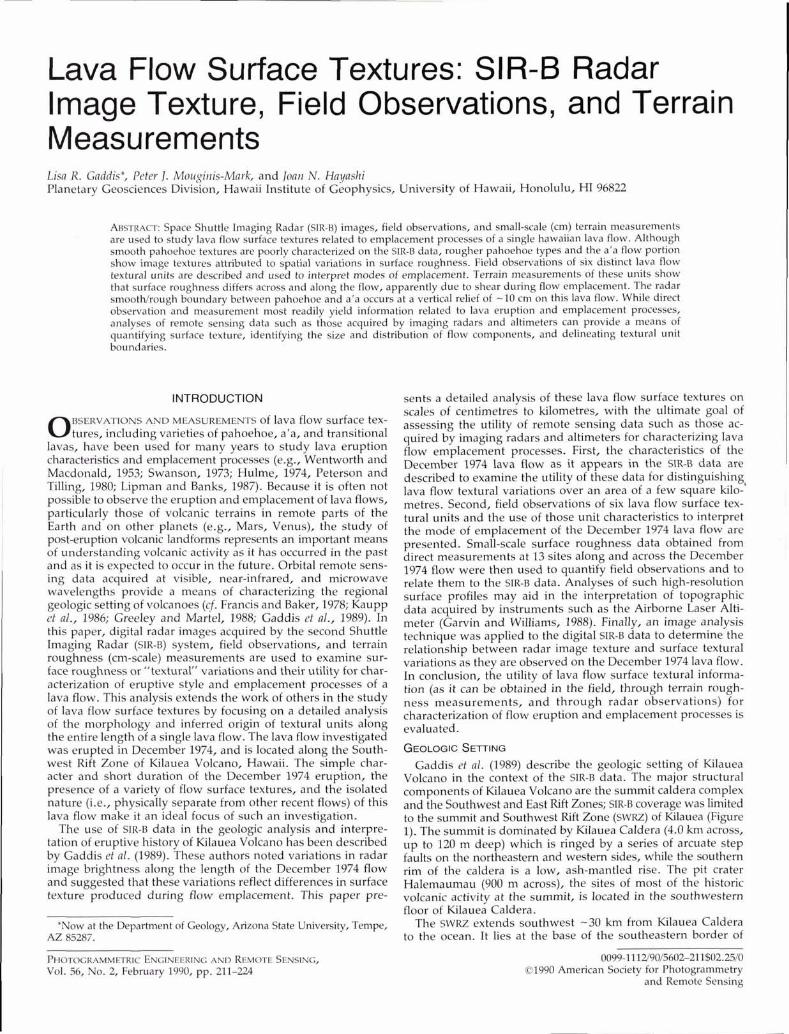
(b) eruptions occurred in and near the summit caldera of Kilauea FIG. 1. (a) Map of the island of Hawaii showing the locations of three during remainder of that year- As Lockwood et a1 major volcanoes and the town of Hilo. The two SIR-B radar ground swaths the December 1974 eruption was preceded by ~~miderable are shown; the solid line outlines the image acquired at a 28" incidence summit inflation and numerous short-period caldera earthquakes, angle, and the dashed line marks the 48" incidence angle image. The indicating filling of the shallow magma reservoir beneath the radar illumination direction (arrow) is toward the southeast. The area shown summit caldera. At about 0300 on 31 December, lava began in Figure 1 b is also outlined. (b) Map of the summit and Southwest Rift fountaining from fissures of the Upper sw~z, located just south Zone of Kilauea Volcano: pahoehoe lavas are shaded in black, and a 'a of ~ i l ~ ~ ~ ~ caldera. N~~ fissures opened to the northeast and larvas are outlined; the 1790 (dot-dashed line) and 1924 (dotted line) of the original fissures, extending a total of -4 km pyroclastic deposits are also shown. Dashed lines mark fissures of the Southwest Rift Zone, and faults are outlined with dots marking the down- With of less than lo to 600 in length. thrown side. Craters are outlined with tick marks pointing inward, and the Fountaining from these en fissures reached a maximum cinder cones of the Karnakaia Hills are dotted. Dates refer to the year of height of -100 m, with an average height of 30 to 40 m. After eruption of lava flows. only two hours, eruptive activity began to wane at the
northeastern end of the fissure system, decreasing further to
Mauna Lea, and is bordered on the southeast by the Koae Faults. the southwest, and ceasing about 0900; the entire
The Koae Fault system is a series of northwest-facing, duration of this eruption was thus only about 6 hours. The areal
high normal faults trending northeast. To the south, the Hilina extent of the December 1974 flow is estimated at -7.5 km2 with Pali consists of a system of shallow, southeast-facing, listric an extruded of -I5 m3 (Lockwood et 1975; fault scarps (up to 500 m high) formed as a result of gravitational et 1983; Steams, 1985). as pahoehoe
and rnagma-induced stresses as Kilauea expands southward. and flowing down a re@0na1 'lope <lot lavas the December
Most historic volcanic eruptions (less than -250 years) along 1974 underwent a textural transition to a'a at a distance of -6
the SWRZ flowed from fissures such as the Great Crack (1 to 15 km from the vent, attaining a maximum flow length of -13 km
m wide) and those of the upper rift zone (up to 10 m wide) (Figure lb).
near the southwestern rim of Kilauea Caldera (Holcomb, 1987). SIR-B OF THE DECEMBER 1974 LAVA The location and areal extent of many historic flows - including those produced during the 1823 eruption of the Great ~ r a c E the 1971 eruption of the upper Southwest Rift zone, the December 1974 eruption, and the 1919-20 and 1971 eruptions near Mauna Iki - are shown in Figure lb. Many of these flows consist of pahoehoe lavas near the vent, becoming rougher, clinkery a'a as the lava cooled and solidified along the length of the flow. Vent areas are commonly marked by features such as cinder cones (e-g., the Kamakaia Hills), spatter ramparts (e.g., along fissures feeding the December 1974 flow), and low lava shields (e-g., Mauna Iki).
Lava flow surface textures have been studied in detail and have long been recognized as resulting from processes occumng
The SIR-B experiment collected two L-band (23-cm wave- length) radar images of southeastern Hawaii in 1984. These im- ages have an average resolution of 25 mZ per pixel, and were obtained at incidence angles of 28" and 48". As described for the SIR-B experiment by Cimino et al. (1986), quantitative com- parisons between the two SIR-B images are not warranted due to data acquisition problems (including variations in antenna gain and transmitted power) during the SIR-B mission. The in- fluence of such factors on the SIR-B images of Kilauea is de- scribed by Gaddis et al. (1989). For this paper, emphasis has been placed on qualitative comparison of features depicted in the two SIR-8 radar images of the December 1974 lava flow.

LAVA FLOW SURFACE TEXTURES
The two SIR-B radar images of the December 1974 lava flow are shown in Figure 2, with an aerial photograph of the flow for comparison. In these images, the pahoehoe portion of the flow is on the right and the a'a portion is on the left. Variations in radar image brightness are primarily attributed to the influ- ence of three terrain factors: topography, dielectric properties, and roughness (on the scale of the radar wavelength) of surface material. Although the influence of topographic and possibly dielectric constant variation can be observed in the SIR-B data of Kilauea (Gaddis et al., 1989), surface roughness is the dominant terrain factor. As a result, these images may be viewed in part as maps of surface roughness variability on the 23-cm scale, with rough units exhibited as bright areas on the radar images and smooth units appearing dark.
Examination of the two SIR-B images (Figure 2a, 2b) and the aerial photograph (Figure 2c) of the December 1974 lava flow reveals differences and similarities in lava flow feature discrim- ination on the two images. Many of the differences, including the indistinct unit edges and the lower degree of saturation of the bright features on the 28" image, can be attributed to vari- ations in image contrast (the 28" image has a lower contrast than the 48" image (Gaddis et al., 1989) due to data acquisition and processing problems. The similarities in feature depiction between the images appear to be related to terrain parameters and are of interest here. One such similarity is the difficulty in distinguishing the pahoehoe flow portion on the radar images. On the photograph, pahoehoe is surrounded by higher-albedo material (pyroclastic ash and alluvium) and thus is clearly vis- ible. By contrast, the low radar backscatter intensities (i.e., darkness) of the smooth pahoehoe, ash, and alluvium make these units difficult to separate on the SIR-B data.
Within the dark pahoehoe flow portion, small bright regions are observable on both images; note the sinuous bright streak (near the middle of the flow) which bifurcates and broadens to the northeast (right in Figure 2). Examination of these bright regions on the photograph indicates that they correspond to a series of thin, low-albedo patches in the pahoehoe flow. The radar-bright returns of these low-albedo areas indicate that they
are rough on the scale of the radar wavelength. Another radar- rough unit is the a'a portion of the flow, visible as a bright unit from about halfway along the flow length to the end of the flow on both radar images (left in Figure 2). This halfway point (marked with a "t" in Figure 2c) marks the zone along which the textural transition from pahoehoe to a'a occurs. This textural transition is observed at the same place on both radar images, indicating that the increase in surface roughness accompanying the change from pahoehoe to a'a resulted in similar backscatter responses at the two different radar incidence angles. In the section on terrain measurements, the average roughness of flow units within this transition zone is described in more detail.
These SIR-B radar data for the December 1974 lava flow clearly show variations in image texture which can be identified on both images. In the following sections, the correspondence be- tween these image textural variations and flow surface rough- ness differences is investigated.
FIELD OBSERVATIONS OF LAVA FLOW SURFACE TEXTURES
The major lava flow surface textural units occurring along the length of the December 1974 lava flow were documented through observation and measurement of the size and distribution of flow surface components, lava flow dimensions such as thick- ness and width, and regional and local slopes. Figure 3 shows the distribution of six major textural types observed. Each of these textural types is described below, followed by a summary of the eruption and emplacement processes of the December 1974 flow inferred from the observed textures and field rela- tionships. These observations are presented to establish a re- lationship between lava flow surface textures and their origins, and to provide a volcanological context for evaluation of terrain roughness and radar image data for characterizing lava flow surface textures.
The December 1974 lava flow consists of pahoehoe for about 6 km along its 13-km length (Figure 3). Three types of pahoehoe textures are prominent along this flow: ropy pahoehoe, sheet pahoehoe, and slab pahoehoe. Ropy pahoehoe, with small amounts of shelly pahoehoe, is observed near the northeastern and southwestern fissure vents and along the outer portions of the flow (Site 1, Figure 3b; Figure 4a); the distribution of flow lobes of ropy pahoehoe was strongly influenced by the presence of preexisting alluvial gullies eroded into the friable 1790 pyroclastic deposit (the Keanakakoi Formation of Wentworth (1938)). Ropy pahoehoe commonly has a thin (3- to 5-an), glassy nnd overlyi& a vesicular core; shelly pahoehoe is similar, but may consist of only a thin rind and little underlying lava. Although ropy pahoehoe has a smooth, glassy surface, ropes up to 30 cm in height are common, particularly where the lava encountered an obstacle such as another flow lobe, a gully wall, or a kipuka (an area of land surrounded by lava flows). Flow thicknesses observed
FIG. 2. SIR-B images of the December 1974 lava flow acquired at (a) 28"- and (b) 48"-incidence angles. Radar illumination direction is from the top. (c) an aerial photograph of the flow (U.S.D.A. photograph #GS-VEEC, frame 8-32). The transition point between pahoehoe and a'a lavas is marked with a "t" on this photograph.
for the ropy pahoehoe of the December 1974 flow range from 20 to 70 cm, with an average thickness of -40 cm.
On the December 1974 lava flow, sheet pahoehoe is observed in the middle of the flow and is associated with the central fissure vents (Figures 3, 4b). Well-developed spatter ramparts, up to 2 m high, are observed only near these central vents, suggesting that the largest volume of eruptive activity occurred in this area. Sheet pahoehoe is extremely smooth-surfaced and glassy, denser (i.e., less vesicular) than ropy pahoehoe, with few or no surface undulations near the main portion of the flow. Small-scale (5- to 10-cm) longitudinal ridges are observed along the marginal portions of the sheet pahoehoe. Thicknesses observed for the sheet pahoehoe flows range from 20 to 130 cm, with an average thickness of -1 m.

PHOTOGRAMMETRIC ENGINEERING & REMOTE SENSING, 1990
A'a Lavas:
clinkery
ball
Transitional Lava: Pahoehoe Lavas:
spiny ropylshelly
sheet
slab
lal
December 1974 Lava Flow
- - -
(b) FIG. 3. The December 1974 lava flow, showing (a) the six textural units including ropy/shelly pahoehoe, sheet pahoehoe, slab pahoehoe, spiny pahoehoe, clinkery a'a, and ball a'a. The fissure vents are marked with hachured lines. The slope break which marks the point of transition from pahoehoe to a'a is marked with a "t". Topographic data (contours in feet above sea level) are derived from U.S. Geological Survey 7.bminute quad maps of Kilauea Caldera (1981) and the Ka'u Desert (1981). (b) shows the 13 sites of the terrain roughness measurements.
Slab pahoehoe consists of a jumbled mass of broken pahoehoe plates; these plates are generally only a few cm thick, and range from a few tens of cm to 2 m across (Figure 4c). In the December 1974 flow, slab pahoehoe is observed as relatively narrow (up to several m across), thin (50- to 100-cm) streamers within the pahoehoe and transitional lavas (Figure 3a). Above the zone of transition, slab pahoehoe primarily occurs in areas where ropy or sheet pahoehoe encountered a barrier such as the Koae Fault scarps or a kipuka; within the transition zone, it commonly occurs at the junction of two or more flow lobes (Sites 2 and 3, Figure 3b).
The transition from pahoehoe to a'a lavas can be observed along a 1.5-km length of December 1974 flow (Figure 3). Above the transition zone, the surfaces of the ropy and sheet pahoehoe lavas become duller, less glassy, and rougher, evolving into a lava type called spiny pahoehoe (after Peterson and Tilling, 1980; Figure 4d). This type of lava retains the general morphology of the pahoehoe from which it evolved (in this case either the ropy texture of ropy pahoehoe or the flat, almost featureless, texture
of sheet pahoehoe), but the surface has small jagged spines. Spiny pahoehoe is observed both within the transition zone, where it occurs primarily along the flow margins, and adjacent to the a'a portion of the flow for several km along its length (Figure 3a). Flow thicknesses for spiny pahoehoe within the transition zone are comparable to those of sheet pahoehoe, with an average thickness of -1 m.
A'a lavas first appear on the downslope side of the transition zone. As the slabby pahoehoe observed near the central portion of the flow continued to break up, it evolved into a combination of small (30- to 60-cm across) pahoehoe plates and loose, irregular fragments of clinker 15 to 30 cm in size. About 500 m below the transition zone, the textural components of the flow surface change from -70 percent plates and 30 percent clinker to -15 percent plates and 85 percent clinker, evolving into clinkery a'a (after Lipman and Banks (1987); Figures 3a, 4e; Site 4 on Figure 3b). The two major a'a flow textures described here, clinkery a'a and ball a'a, are defined according to the dominant component present.

--
LAVA FLOW SURFACE TEXTURES
(el FIG. 4. Photographs of lava flow surfaces along the December 1974 flow; (a) ropy pahoehoe near the northeasternmost fissure vents of the December 1974 lava flow; view of the south, with person for scale. (b) smooth-surfaced sheet pahoehoe at the centrally located fissure vents; view to the West. (c) a streamer of slab pahoehoe located within a predominantly ropy pahoehoe unit just above the zone of transition to a'a; roughness measurement Sites 1 and 2 are located in this unit. The view is from atop the Koae Faults to the northwest toward the vent; the distance to the kipuka to the left of center is about 500 metres. (d) the jagged surface texture of the spiny pahoehoe located within the zone of transition just north of the transition point. View to the north. (e) the extremely rough, jagged surface textures of clinkery a'a. The view is to the west-southwest, just below the slope breakitransition point. Rafted plates of pahoehoe are observed along the flow, and spiny pahoehoe is seen as a marginal unit to the front and left. (f) View (looking upslope, to the west) of the clinkery a'a textural unit of Site 5, located just below the point at which the separate a'a flow lobes rejoin. Although clinker is the dominant surface textural component, rafted pahoehoe plates are still 0bse~ed on the surface. (g) lava balls, clinker, and plates at Site 6; view to the east. The templet used for surface roughness measurements is also shown. (h) the ball a'a textural unit of Site 7, located within a narrow band near the center of the lava flow. The view is to the northwest. (i) the clinkery a'a surface textures at Site 8; the view is to the south. (j) clinkery a'a at Site 9. Note the uniformly small size and rounded shapes of the clinker in this relatively flat area of the flow. The view to the west. (k) clinkery a'a at Site 10, with larger average sizes and occasional lava balls and plates; view is to the south. (I) Clinkery a'a at Site 11, looking south. (m) ball a'a with clinker at Site 12; view is to the west-southwest. (n) ball a'a Site 13. View is to the northwest.
As described b y Lipman and Banks (1987) for the 1984 Mauna December 1974 flow, clinkers are generally angular, rough, and Loa flow, clinkery a'a consists largely of clots and blocks of spiny, bu t smoother, rounded fragments of clinker are also dense lava overlying an inner core of more fluid lava. In the observed. In the clinkery a'a un i t in Figure 3a, a large variation

PHOTOGRAMMETRIC ENGINEERING & REMOTE SENSING, 1990
FIG. 4. (Cont.) (1 - -1

LAVA FLOW SURFACE TEXTURES
in size and relative number of clinker fragments is observed. Just beyond the zone of transition, where the flow (75- to 100- cm thick) breaks into several lobes and then reunites (Site 5, Figure 3b), a'a consists of -85 percent clinker (10 to 50 cm in size) and -15 percent rafted plates of transitional lava (Figure 4f). Near where the flow reunites (Site 6, Figure 3b), larger (30- to 130 cm across), rounded balls of lava are observed in the flow center (Figure 4g); these are the "accretionary lava balls" of the Wentworth and Macdonald (1953), formed as fluid lava adheres to a solid fragment as it is moved along on or near the surface of an a'a flow. In this area, the a'a textural unit defined here as ball a'a is first observed. As its name suggests, ball a'a consists largely of lava balls of variable shape, size, and relative number. Farther along the flow (near Site 7, Figure 3b), lava balls become larger (50 to 150 cm) and even more common, with the flow consisting of -60 percent lava balls, 35 percent clinker (5 to 25 cm in size), and 5 percent plates (Figure 4h). Beyond Site 7, lava balls begin to give way to clinker, with the flow (-75 cm thick) consisting of -35 percent lava balls, 65 percent clinker (10 to 70 cm in size), and occasional plates near Site 8 (Figures 3b, 4i). Further along the flow clinker again predominates, but an interesting variation in the average size of these fragments is observed: near Site 9 the flow is -90 percent clinker, which ranges in size from 5 to 20 cm and is very uniform in size and shape, and 10 percent small (15- to 30-cm) lava balls (Figures 3b, 4j); near Site 10 the same clinkerhall ratio is observed, but both the clinker and the lava balls are larger (10 to 40 cm and 40 to 120 cm, respectively; Figures 3b, 4k); near site 11 even larger clinker (20 to 50 cm) predominates (-85 percent), but lava balls (30 to 70 cm) again begin to appear within the central part of the 80- to 100-cm thick flow (Figures 3b, 41). Further along, near Site 12, the same units are observed, except that the lava balls are larger, ranging from 40 to 100 cm across (Figures 3b, 4m); in this area the flow is -1.5 to 2 m thick. Toward the toe of the flow (Site 13 on Figure 3b), lava balls (30 to 130 cm) again become predominant (-50 percent), with -40 percent clinker (5 to 30 cm), and occasional plates, lava bowls, and spires (Figure 4n). At its distal end, the December 1974 lava flow is -2.5 to 3 m thick.
~NFERRED EMPLACEMENT PROCESSES OF THE DECEMBER 1974 LAVA FLOW
Several morphological characteristics of the December 1974 flow are consistent with the rapid effusion of fluid lava with small to moderate amounts of dissolved gases as reported by Lockwood et al. (1975). These characteristics include the predominance of pahoehoe near the fissure vents, the broadness and shallowness of the near-vent flow portions, the absence of a well-developed flow channel, and the relatively simple geometry of the single major flow lobe. Pahoehoe flow morphologies near Mauna Ulu have been used by Swanson (1973) to infer their emplacement mechanisms and relative gas contents. For example, shelly pahoehoe was associated with the relatively quiescent eruption of gas-charged magma, and sheet pahoehoe formed as a result of the coalescence of spatter during fire fountaining. By analogy, ropy and shelly pahoehoe (observed at both ends of the fissure svstem of the December 1974 flow) are inferred to have erupted primarily during earlier stages of the eruption while the magma retained some dissolved gases. Also, the sheet pahoehoe obierved in the central portion of the near-vent flow was probably produced during fire-fauntaining events from the centrallv located vents. Because slab vahoehoe is observed near obstruciions such as fault scarps, ki;ukas, or other flow lobes, it appears to result from the breakup, tilting, and imbrication of solidified pahoehoe crust (generally ropy or sheet pahoehoe) as the lava is pushed into an obstacle.
The rough-surfaced spiny pahoehoe, developed during the transition from pahoehoe to a'a, retains the general morphology
of the pahoehoe type from which it evolved. Where it is observed along the margins of the flow beyond the transition zone, it has the primary flow characteristics of ropy pahoehoe (i.e., unbroken crusts with rope and festoons) and thus appears to have been emplaced directly. It is inferred that spiny pahoehoe observed along the December 1974 flow was emplaced during an early phase of the eruption and then overridden by a'a lavas later on, perhaps in response to an increase in eruption rate.
From the vent, the December 1974 flow moved southward down a gentle slope (-0.03") until it encountered scarps of the Koae Faults, where it was constrained to flow along a narrow path at the base of the faults. Although the transition to a'a begins where the flow first joins the scarp, the primary point of transition occurs where the flow moves over a slope break (observed as a 20" slope occurring over a distance of -20 m, marked with a "t" in Figure 2b). Clinkery a'a, first observed at the base of this slope, is found along most of the length of the lower half of the flow. In places along the a'a flow portion, however, ball a'a is the dominant textural type observed (Figure 3). At these ball a'a sites the flow is thicker and the local slopes are among the highest observed along the flow length (e.g., -0.2" near Site 5, and 0.1" near the toe). As a surface textural type, ball a'a appears to result from sorting and segregation of rounded accretionary lava balls, perhaps as flow velocity increased along these slopes. Below Site 5, the ball a'a textural unit may have been deposited as a result of an abrupt decrease in local slope and a change in direction of the flow. This inference is supported by the presence of a thin, wide deposit of clinkery a'a observed on a virtually flat slope downflow from the ball a'a unit (near Sites 9 and 10). The occurrence of small (5 to 20 cm), uniformly rounded, and apparently well-sorted clinkers on the surface of this a'a unit are consistent with a lava flow moving slowly along a relatively flat slope. On the basis of these observations, it appears that the a'a surface textures observed along the December 1974 flow are related to variations in flow velocity due to local slope changes. The influence of local terrain effects and flow rates on the formation of a'a flow texture was also recognized by Lipman and Banks (1987) for the Mauna Loa eruption in 1984.
TERRAIN MEASUREMENTS OF LAVA FLOW SURFACE TEXTURE
In this section, the relationship between lava flow surface roughness variations (as measured in the field) and flow surface textures is examined. The morphology and spatial distribution of lava flow textural units at 13 sites along the length of the December 1974 flow are examined to characterize its eruptive and emplacement history, and to test the utility of the SIR-8 data for distinguishing the textural units observed. Because similar terrain measurements are used to obtain ground truth data for the quantitative analysis of radar images (e.g., Schaber et al., 1980), a secondary objective of this section is to provide con- straints on the selection of appropriate sites for terrain mea- - - - surements of lava flows.
Measurements described here were obtained in both along- and across-flow directions with an aluminum templet consisting of a horizontal rod 6 feet (1.8 m) long 69 freely moving 3.3-foot (1-m) vertical rods, spaced 1-inch (2.54-cm) apart, which could be moved to simulate terrain elevations up to 2 m high (see Figure 4g). Rod heights were digitized from photographs of each templet set-up; five sets of end-to-end measurements were then merged into a single 30-foot (9-m) profile with 341 individual elevations. To document flow textural variations which accompany both the transition from pahoehoe to a'a and the evolution of an a'a flow as a function of distance from the vent,

PHOTOGRAMMETRIC ENGINEERING & REMOTE SENSING, 1990
our measurements began just above the transition zone and continued at approximately 500-m intervals to the end of the flow (sites marked 1 to 13 on Figure 3b). Although well-developed flow channels were not observed, measurement sites were chosen within what appeared to have been the most active (generally centrally located) parts of the flow so that measured textures would best reflect flow emplacement processes. The topographic setting of these measurement sites is summarized in Table 1.
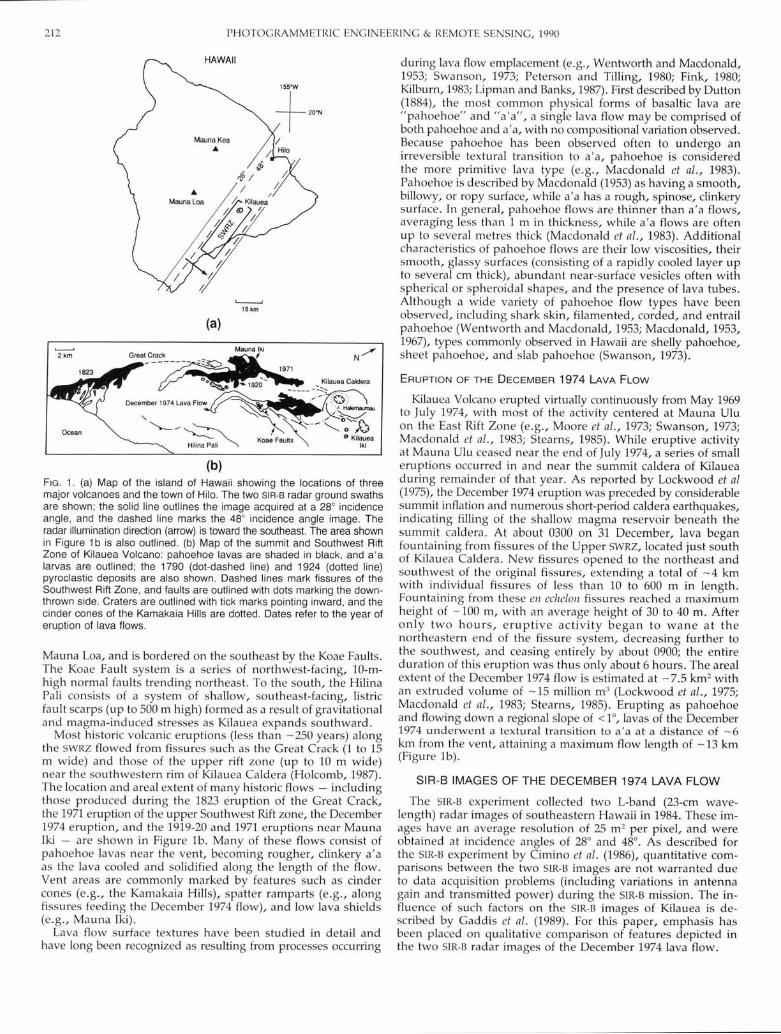
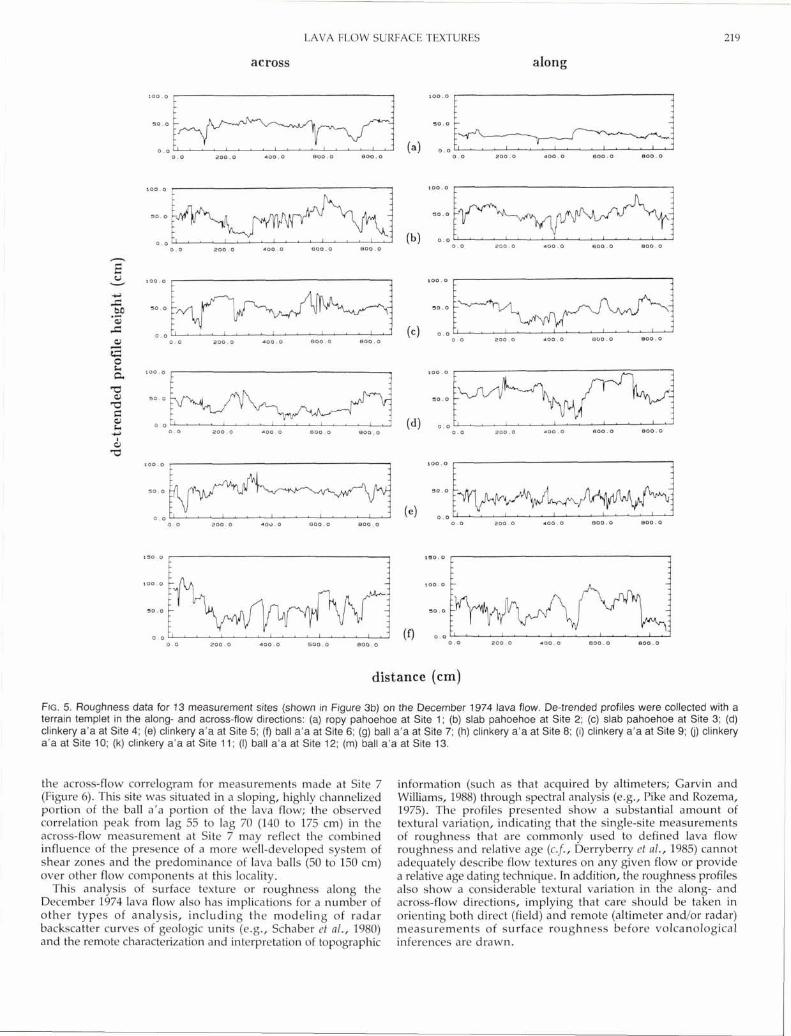
To remove local slope effects (possibly related to preflow topography) each profile was subjected to a "de-trending" or flattening process to remove a linear trend and to make the data stationary. Figure 5 shows the resulting across- and along-flow de-trended profiles. As shown in Figure 3b, Site 1 measurements (Figure 5a) were made on ropy pahoehoe just above the zone of transition; ropy pahoehoe in this locality has evolved into a type of pahoehoe which is almost a cross between ropy pahoehoe and sheet pahoehoe. The Site 1 profiles refect the low-relief, smooth surface of pahoehoe, as well as the presence of occasional plate boundaries and tilted plates. The Site 2 profiles (Figure 5b), measured within a streamer of slabby pahoehoe just above the transition zone (Figure 3), reflect the extremely rough surface textures produced by tilted and upturned pahoehoe plates. A similar surface texture is observed at Site 3 (Figure 5c), located in another streamer of slab pahoehoe at the top of the slope break at which the complete transition from pahoehoe to a'a is observed. Profiles from Site 4 (Figure 5d) and 5 (Figure 5e), situated in clinkery a'a located just below the transitional slope break (Figure 4e) and along the shallow slope below the separation of a'a flow lobes (Figure 4f), respectively, reflect the jagged clots and the broken pahoehoe plates of clinkery a'a. By contrast, profiles from Sites 6 and 7 (Figures 5f and 5g), measured in ball a'a along the base of a scarp of the Koae Faults, show rounded surfaces which correspond to those of the accretionary lava balls (Figures 4g and 4h). Profiles from Sites 8 to 11 (Figures 5h to 5k), located within the clinkery a'a unit at increasing distances along the flow (Figures 4i to 41), also show the irregular, jagged surfaces of mingled clinker, rafted plates, and lava balls. In these profiles, the small-scale spikes of clinker are dominant, particularly at Site 9 (Figure 4j), in which the a'a clinker is observed to be small (5 to 20 cm), and unusually uniform in size and shape. Although distal portions of the lava flow are mapped as ball a'a (Figures 3, 4m, and 4n), profiles from Sites 12 (Figure 51) and 13 (Figure 5m) near the toe of the flow do not appear significantly different from those of the sites just upflow in the clinkery a'a; this may reflect a "sampling bias" in that the a'a lava balls here often exceed 1 m in diameter and
TABLE 1. TOPOGRAPHIC SETTING OF TEMPLET MEASUREMENTS FOR THE
are thus difficult to measure with the device used. One important feature of profiles from Sites 12 and 13 is that they show larger variations in both size of fragments and surface relief, probably as a result of increased thickness towards the toe of the flow.
Of the four textural units measured with the templet along the December 1974 lava flow, only the ropylshelly pahoehoe and the smaller-scale ball a'a can be readily distinguished by examination of the profiles alone. The distinction between slab pahoehoe, clinkery a'a, and larger-scale tall a'a (as observed near the toe of the flow) is not clear. Similar results are obtained from the examination of the standard deviations (s) of the heights along each profile, presented in Table 2. In general, the ropy1 shelly pahoehoe has values of s which are less than 10, the slab pahoehoe, clinkery a'a, and large-scale ball a'a have s-values greater than 10 and less than 15, while the smaller-scale ball a'a has higher s-values, falling between 15 and 25.
One additional feature of many of the roughness profiles discussed here is the presence of steeply dipping gaps or trenches, particularly prominent in the across-flow profiles. The presence of these features and their preferential distribution in the across- flow profiles is illustrated in the values for maximum vertical relief (Table 2); nine out of 13 of the values have higher maximum vertical relief in the across-flow directions than in the along- flow directions. These trenches are attributed to the existence of longitudinal grooves produced by shear zones between portions of the flow moving at different velocities. Such shear zones would be most likely to occur in along-flow directions, and are less likely to be observed in the along-flow profiles.
To facilitate our evaluation of the utility of surface roughness profiles for characterizing flow textural units, for identifying unit boundaries, and for distinguishing the presence and size of specific flow components (such as plates, clinker, and lava balls), autocorrelation functions were calculated for each profile. Figure 6 displays correlograms from five sites both along the across the December 1974 flow. For terrain analysis applications, autocorrelation provides a means of determining the degree of association between pairs of equally spaced profile elements shifted ("lagged) by multiples of the distance between them; any regularities or periodicities in the terrain segments measured are represented by peaks (high correlation) in the resulting correlograms (Pike and Rozema, 1975; Davis, 1986). In this analysis, maximum lag values were calculated to 25 percent of the number of profile elevations (i-e., 25 percent of 341 elevations = 86 lags); lag intervals, equivalent to the spacing between measurements, are 1 inch (2.54 cm). The effects of variations in maximum lag values were not considered in this study.
These correlograms show a pronounced difference between surface textures recorded in the along- and across-flow directions. In general. correlation curves for alone-flow measurements
DECEMBER 1974 LAVA FLOW ( ~ i g r e 6b) of a'a textures show a rapid dveecrrease in the degree Elevation L~~~~ slopex of correlation from 1.0 to 0, then oscillation around 0, with only
Site (ft) (deg.) a small element of periodicity in the oscillations. Thus, a high degree of randomness is observed in the along-flow profiles.
1 3060 2 3010
0-03 By contrast, correlation curves for the across-flow profiles show
3 2970 a more gradual decrease in correlation, suggesting a smaller 4 2950 deppe of randomness in this direction. As observed in the 5 2890 0.18 roughness profiles, these correlation differences may be related 6 2780 0.02 to the existence of longitudinal lineations or shear zones which,
* Local slopes were measured from 20-ft contour intervals immedi- ately above and below measurement sites; horizontal distances range from about 500 to 2000 feet.
as a result of their occurrence in the along-flow direction, are most evident in the across-flow profiles.
As mentioned, the location and strength of correlation peaks reflect the spacing and relative magnitude of recurring terrain features on the scale of the measurements; in the case of lava flows, such features might include rafted plates, lava balls, etc. Little strong evidence for periodicity, and thus for the unique identification of specific flow components, is observable in these profiles. However, some degree of periodicity is observed in
LAVA FLOW SURFACE TEXTURES
across along
distance (cm)
FIG. 5. Roughness data for 13 measurement sites (shown in Figure 3b) on the December 1974 lava flow. De-trended profiles were collected with a terrain templet in the along- and across-flow directions: (a) ropy pahoehoe at Site 1; (b) slab pahoehoe at Site 2; (c) slab pahoehoe at Site 3; (d) clinkery a'a at Site 4; (e) clinkery a'a at Site 5; (9 ball a'a at Site 6; (g) ball a'a at Site 7; (h) clinkery a'a at Site 8; (i) clinkery a'a at Site 9; (j) clinkery a'a at Site 10; (k) clinkery a'a at Site 1 1 ; (I) ball a'a at Site 12; (m) ball a'a at Site 13.
the across-flow correlogram for measurements made at Site 7 (Figure 6). This site was situated in a sloping, highly channelized portion of the ball a'a portion of the lava flow; the observed correlation peak from lag 55 to lag 70 (140 to 175 cm) in the across-flow measurement at Site 7 may reflect the combined influence of the presence of a more well-developed system of shear zones and the predominance of lava balls (50 to 150 cm) over other flow components at this locality.
This analysis of surface texture or roughness along the December 1974 lava flow also has implications for a number of other types of analysis, including the modeling of radar backscatter curves of geologic units (e-g., Schaber et al., 1980) and the remote characterization and interpretation of topographic
information (such as that acquired by altimeters; Garvin and Williams, 1988) through spectral analysis (e.g., Pike and Rozema, 1975). The profiles presented show a substantial amount of textural variatign, indicating that the single-site measurements of roughness that are commonly used to defined lava flow roughness and relative age (c.f., Derryberry et al., 1985) cannot adequately describe flow textures on any given flow or provide a relative age dating technique. In addition, the roughness profiles also show a considerable textural variation in the along- and across-flow directions, implying that care should be taken in orienting both direct (field) and remote (altimeter and/or radar) measurements of surface roughness before volcanological inferences are drawn.
PHOTOGRAMMETRIC ENGINEERING & REMOTE SENSING, 1990
across along
150.0
0 150.0
100.0 100. 0
50.0 50.0
0.0 0 .0 200.0 400.0 800.0 (100.0
(g) 0.0
FIG. 5. (Cont.) distance (cm)
SIR-B IMAGE TEXTURE ANALYSIS
A comparison between the SIR-B radar images (Figure 2) and the textural unit map (Figure 3a) indicates that some degree of lava flow textural unit discrimination is possible on the basis of radargeologic analyses of the SIR-8 radar data, and suggests that radar data might be useful for mapping surface textural units of a lava flow. For example, the textural units mapped as slab
pahoehoe on Figure 3a are readily observed in both radar im- ages as bright streamers within the smooth, radar-dark ropy and sheet pahoehoe. Near the transition zone the spiny pahoe- hoe lava is not clearly distinguishable from the adjacent slab pahoehoe. Also, the spiny pahoehoe observed along the mar- gins of the a'a flow portion has a generally high return on both radar images, and is therefore inseparable from the rough, bright a'a flow portion. Within this a'a flow portion, no clear distinc-

LAVA FLOW SURFACE TEXTURES
TABLE 2. I EMPLETT MEASUREMENTS OF SURFACE ROUGHNESS OF THE DECEMBER 1974 Lnv~ FLOW
Site St. Dev. (cm) Max. Vert. Relief (cm)
1 across 9.8 52.4 1 along 5.3 29.7
2 across 16.6 78.8 2 along 12.2 76.7
3 across 12.5 69.0 3 along 13.2 61.5
4 across 13.4 56.3 4 along 17.6 86.5
5 across 10.4 74.3 5 along 9.6 47.1
6 across 22.0 100.9 6 along 20.6 90.0
7 across 21.9 90.8 7 along 17.7 78.4
8 across 18.9 78.4 8 along 16.7 71.7
9 across 15.5 74.6 9 along 10.3 65.7
10 across 14.9 72.9 10 along 20.0 93.3
11 across 14.9 67.8 11 along 15.7 74.4
12 across 13.9 75.2 12 along 16.0 81.9
13 across 24.4 122.3 13 along 12.7 61.7
tion can be made between the two a'a textural types, clinkery a'a and ball a'a; both exhibit mottled, uniformly bright radar signatures. The purpose of this section is twofold: (1) to describe the application of a quantitative image analysis technique to the two digital SIR-B images of the December 1974 lava flow with the purpose of improving discrimination of image textural dif- ferences; and (2) to examine the correspondence between the units descriminated on the resulting "texture-feature" images and the lava flow textural units previously described. The re- sults of these analyses permit an assessment of the utility of the SIR-B radar images for mapping surface textural variations along a lava flow which can be interpreted as resulting from emplace- ment processes of that flow.
Image texture is described as a measure of the spatial distribution of tonal variations in an image (Pratt, 1978); such tonal variations contain information about pixel-scale spatial variation within units and their relationship to surrounding areas. Texture analysis has been applied to radar image analysis by several authors, including Shanmugam et al., (1981), Irons and Peterson (1981), Frost et al., (1984), Ulaby et al., (1986), and Gaddis et al., (1989).
To evaluate the use of texture analysis for the discrimination of geologically significant units on the SIR-B images of the December 1974 lava flow, we have adapted the gray-tone spatial dependency technique of Haralick et al., (1973). The use of this technique for enhancement of low-return lava flows within Kilauea Caldera was described by Gaddis et al., (1989). The Haralick et al., (1973) technique computes a chosen set of "texture features," or statistical measures of textural characteristics, from a gray level co-occurrence matrix calculated for a digital image; this matrix is an M by M array which describes the occurrence
0.0 ao . o 40.0 80.0 80.0 number o f laas
Site 7 0 - Site IS X
J ~ n . I . a s ' . . . ' ' ' . l '
FIG. 6. Overlaid correlograms for five representative terrain measurement sites (shown in Figure 3b) along the December 1974 lava flow; (a) au- tocorrelation curves for across-flow measurements; (b) autocorrelation curves for along-flow measurements. Measurement sites were located in the following textural units; Site 1 in ropylsheet pahoehoe; Site 2 in slab pahoehoe; Site 6 in ball a'a; Site 7 in ball a'a; Site 13 in large-scale ball a'a.
of gray-level pairs in an image given the joint probability of a pair of gray levels occurring in a given direction and given separation, where M is the number of gray levels possible. We have calculated a nearest-neighbor gray level co-occurrence matrix (separation = 1 pixel) for a quantized version (in which the value of M is 20) of the 2b-incidence angle and 48"-incidence angle SIR-B images of the December 1974 lava flow shown in Figure 2. In addition, four of the statistical texture features described by Haralick et al., (1973) were computed in four directions (horizontal or 0" across the image, at a right-diagonal or 45" angle, vertical or 90°, and at a left-diagonal or 135" angle) from these matrices: (1) the angular second moment measures the degree of homogeneity of the image; (2) contrast measures the amount of local gray level variation; (3) correlation measures gray tone linear dependencies, or the degree to which the rows or columns resemble each other; and (4) entropy measures the degree of randomness within an image. Unlike Haralick et al., (1973), who calculated a series of single texture features for a whole image, we have computed each of these features within a 5- by 5-pixel sliding boxcar on the original image and used it to replace the center value of that window on a calculated image, producing a two-dimensional image showing the local variation for each feature. While this method reduces the amount of pixel-to-pixel variation in the resultant feature images (thus acting as a smoothing filter, reducing the effects of speckle), the areas with more uniform image texture are enhanced.
PHOTOGRAMMETRIC ENGINEERING & REMOTE SENSING, 1990
EVALUATION OF THE SIR-B TEXTURE-FEATURE IMAGES
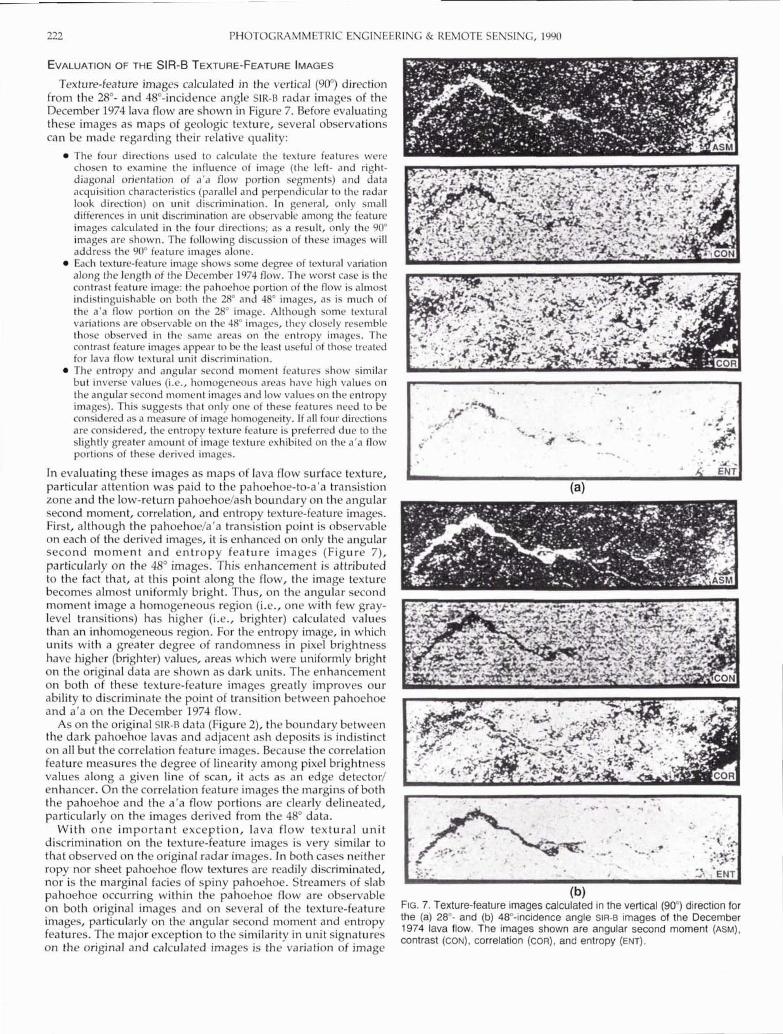
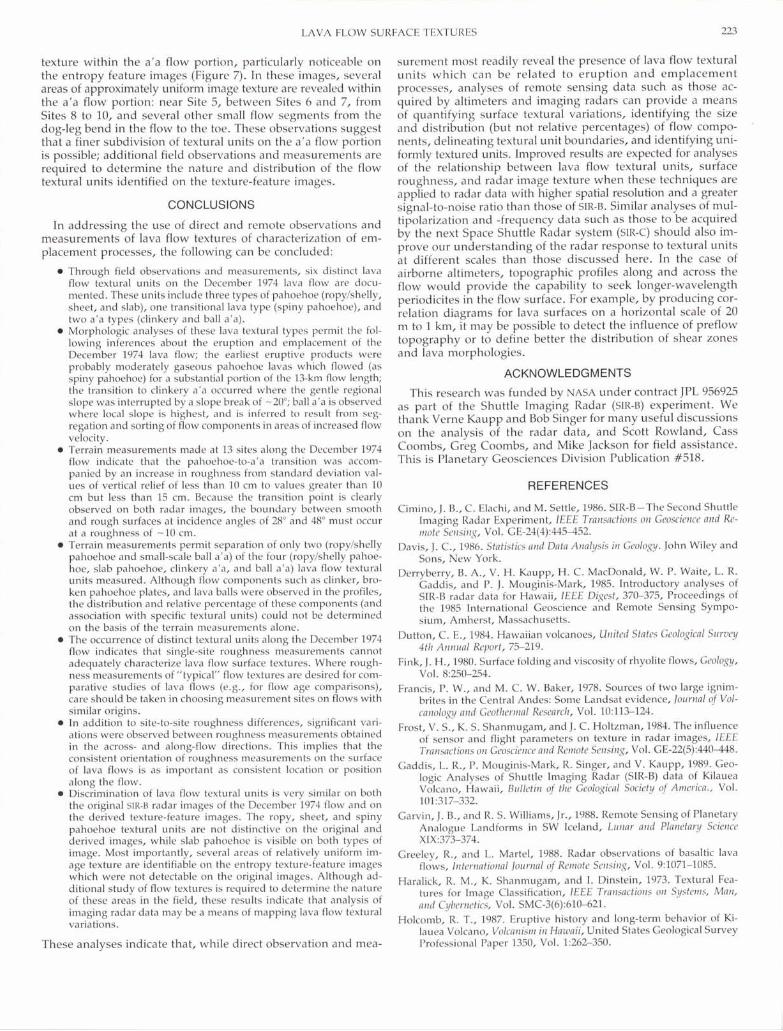
Texture-feature images calculated in the vertical (90") direction from the 28"- and 48"-incidence angle SIR-8 radar images of the December 1974 lava flow are shown in Figure 7. Before evaluating these images as maps of geologic texture, several observations can be made regarding their relative quality:
The four directions used to calculate the texture features were chosen to examine the influence of image (the left- and right- diagonal orientation of a'a flow portion segments) and iata acquisition characteristics (parallel and vervendicular to the radar
1 ' lodk direction) on unit discrimination. In general, only small differences in unit discrimination are observable among the feature images calculated in the four directions; as a result, only the 90" images are shown. The following discussion of these images will address the 90" feature images alone. Each texture-feature image shows some degree of textural variation along the length of the December 1974 flow. The worst case is the contrast feature image: the pahoehoe portion of the flow is almost indistinguishable on both the 28" and 48" images, as is much of the a'a flow portion on the 28" image. Although some textural variations are observable on the 48" images, they closely resemble those observed in the same areas on the entropy images. The contrast feature images appear to be the least useful of those treated for lava flow textural unit discrimination. The entropy and angular second moment features show similar but inverse values (i.e., homogeneous areas have high values on the angular second moment images and low values on the entropy images). This suggests that only one of these features need to be considered as.a measure of image homogeneity. If all four directions are considered, the entropy texture feature is preferred due to the slightly greater amount of image texture exhibited on the a'a flow portions of these derived images.
In evaluating these images as maps of lava flow surface texture, particular attention was paid to the pahoehoe-to-a'a transistion zone and the low-return pahoehoelash boundary on the angular second moment, correlation, and entropy texture-feature images. First, although the pahoehoela'a transistion point is observable on each of the derived images, it is enhanced on only the angular second moment and entropy feature images (Figure 7), particularly on the 48" images. This enhancement is attributed to the fact that, at this point along the flow, the image texture becomes almost uniformlv bright. Thus. on the anrmlar second . .2 " moment image a homogeneous region (i.e., one with few gray- level transitions) has higher (i.e., brighter) calculated values than an inhomogeneous region. For the entropy image, in which units with a greater degree of randomness in pixel brightness have higher (brighter) values, areas which were uniformly bright on the original data are shown as dark units. The enhancement on both of these texture-feature images greatly improves our ability to discriminate the point of transition between pahoehoe and a'a on the December 1974 flow.
As on the original SIR-B data (Figure 2), the boundary between the dark pahoehoe lavas and adjacent ash deposits is indistinct on all but the correlation feature images. Because the correlation feature measures the degree of linearity among pixel brightness values along a given line of scan, it acts as an edge detector1 enhancer. On the correlation feature images the margins of both the pahoehoe and the a'a flow portions are clearly delineated, particularly on the images derived from the 48" data.
With one important exception, lava flow textural unit discrimination on the texture-feature images is very similar to that observed on the original radar images. In both cases neither ropy nor sheet pahoehoe flow textures are readily discriminated, nor is the marginal facies of spiny pahoehoe. Streamers of slab pahoehoe occurring within the pahoehoe flow are observable on both original images and on several of the texture-feature images, particularly on the angular second moment and entropy features. The major exception to the similarity in unit signatures on the original and calculated images is the variation of image
. , FIG. 7. Texture-feature images calculated in the vertical (90") direction for the (a) 28"- and (b) 48"-incidence angle SIR-B images of the December 1974 lava flow. The images shown are angular second moment ( A ~ M ) , contrast (CON), correlation (COR), and entropy (ENT).
LAVA FLOW SURFACE TEXTURES
texture within the a'a flow portion, particularly noticeable o n the entropy feature images (Figure 7). In these images, several areas of approximately uniform image texture are revealed within the a'a flow portion: near Site 5, between Sites 6 a n d 7, from Sites 8 to 10, and several other small flow segments from the dog-leg bend in the flow to the toe. These observations suggest that a finer subdivision of textural units on the a'a flow portion is possible; additional field observations a n d measurements are required to determine the nature and distribution of the flow textural units identified o n the texture-feature images.
CONCLUSIONS
In addressing the use of direct and remote observations and measurements of lava flow textures of characterization of em- placement processes, the following can be concluded:
Through field observations and measurements, six distinct lava flow textural units on the December 1974 lava flow are docu- mented. These units include three types of pahoehoe (ropy/shelly, sheet, and slab), one transitional lava type (spiny pahoehoe), and two a'a types (clinkery and ball a'a). Morphologic analyses of these lava textural types permit the fol- lowing inferences about the eruption and emplacement of the December 1974 lava flow; the earliest eruptive products were probably moderately gaseous pahoehoe lavas which flowed (as spiny pahoehoe) for a substantial portion of the 13-km flow length; the transition to clinkery a'a occurred where the gentle regional slope was interrupted by a slope break of -20"; ball a'a is observed where local slope is highest, and is inferred to result from seg- regation and sorting of flow components in areas of increased flow velocity. Terrain measurements made at 13 sites along the December 1974 flow indicate that the pahoehoe-to-a'a transition was accom- panied by an increase in roughness from standard deviation val- ues of vertical relief of less than 10 cm to values greater than 10 cm but less than 15 cm. Because the transition point is clearly observed on both radar images, the boundary between smooth and rough surfaces at incidence angles of 28" and 48" must occur at a roughness of -10 cm. Terrain measurements permit separation of only two (ropy/shelly pahoehoe and small-scale ball a'a) of the four (ropy/shelly pahoe- hoe, slab pahoehoe, clinkery a'a, and ball a'a) lava flow textural units measured. Although flow components such as clinker, bro- ken pahoehoe plates, and lava balls were observed in the profiles, the distribution and relative percentage of these components (and association with specific textural units) could not be determined on the basis of the terrain measurements alone. The occurrence of distinct textural units along the December 1974 flow indicates that single-site roughness measurements cannot adequately characterize lava flow surface textures. Where rough- ness measurements of "typical" flow textures are desired for com- parative studies of lava flows (e.g., for flow age comparisons), care should be taken in choosing measurement sites on flows with similar origins. In addition to site-to-site roughness differences, significant vari- ations were observed between roughness measurements obtained in the across- and along-flow directions. This implies that the consistent orientation of roughness measurements on the surface of lava flows is as important as consistent location or position along the flow. Discr~mination of lava flow textural units is very simllar on both the original SIR-B radar images of the December 1974 flow and on the derived texture-feature images. The ropy, sheet, and spiny pahoehoe textural units are not distinctive on the original and derived images, while slab pahoehoe is visible on both types of image. Most importantly, several areas of relatively uniform im- age texture are identifiable on the entropy texture-feature images which were not detectable on the original images. Although ad- ditional study of flow textures is required to determine the nature of these areas in the field, these results indicate that analysis of imaging radar data may be a means of mapping lava flow textural variations.
These analyses indicate that, while direct observation a n d mea-
surement most readily reveal the presence of lava flow textural un i t s which can b e related to e rup t ion a n d emplacement processes, analyses of remote sensing data such a s those ac- quired by altimeters and imaging radars can provide a means of quantifying surface textural variations, identifying the size a n d distribution (but not relative percentages) of flow compo-
'
nents, delineating textural unit boundaries, a n d identifying uni- formly textured units. Improved results are expected for analyses of the relationship between lava flow textural units, surface roughness, a n d radar image texture when these techniques are applied to radar data with higher spatial resolution and a greater signal-to-noise ratio than those of SIR-8. Similar analyses of mul- tipolarization a n d -frequency data such a s those to b e acquired by the next Space Shuttle Radar system (SIR-c) should also im- prove our understanding of the radar response to textural units a t different scales than those discussed here. In the case of airborne altimeters, topographic profiles along a n d across the flow would provide the capability to seek longer-wavelength periodicites in the flow surface. For example, by producing cor- relation diagrams for lava surfaces on a horizontal scale of 20 m to 1 krn, it may be possible to detect the influence of preflow topography or to define better the distribution of shear zones and lava morphologies.
ACKNOWLEDGMENTS
This research was funded by NASA under contract JPL 956925 a s part of the Shuttle Imaging Radar (SIR-B) experiment. W e thank Verne Kaupp a n d Bob Singer for many useful discussions on the analysis of the radar data, and Scott Rowland, Cass Coombs, Greg Coombs, and Mike Jackson for field assistance. This is Planetary Geosciences Division Publication #518.
REFERENCES
Cimino, J. B., C. Elachi, and M. Settle, 1986. SIR-8-The Second Shuttle Imaging Radar Experiment, ZEEE Transactions on Geoscience and Re- mote Senszng, Vol. GE-24(4):445-452.
Davis, J. C., 1986. Statistics and Data Analysis in Geology. John Wiley and Sons, New York.
Derryberry, B. A., V. H. Kaupp, H. C. MacDonald, W. P. Waite, L. R. Gaddis, and P. J. Mouginis-Mark, 1985. Introductory analyses of SIR-B radar data for Hawaii, IEEE Digest, 370-375, Proceedings of the 1985 International Geoscience and Remote Sensing Sympo- sium, Amherst, Massachusetts.
Dutton, C. E., 1984. Hawaiian volcanoes, United States Geological Survey 4th Annual Report, 75-219.
Fink, J. H., 1980. Surface folding and viscosity of rhyolite flows, Geology, Vol. 8:250-254.
Francis, P. W., and M. C. W. Baker, 1978. Sources of two large ignim- brites in the Central Andes: Some Landsat evidence, Journal of Vol- canology and Geothermal Research, Vol. 10:113-124.
Frost, V. S., K. S. Shanmugam, and J. C. Holtzman, 1984. The influence of sensor and flight parameters on texture in radar images, IEEE Transacttons on Geoscience and Remote Sensing, Vol. GE-22(5):440-448.
Gaddis, L. R., P. Mouginis-Mark, R. Singer, and V. Kaupp, 1989. Geo- logic Analyses of Shuttle Imaging Radar (SIR-B) data of Kilauea Volcano, Hawali, Bulletin of the Geological Soczety of America., Vol. 101:317-332.
Garvin, J. B., and R. S. Williams, Jr., 1988. Remote Sensing of Planetary Analogue Landforms in SW Iceland, Lunar and Planetary Science XIX:373-374.
Greeley, R., and L. Martel, 1988. Radar observations of basaltic lava flows, International Journal of Remote Sensing, Vol. 9:1071-1085.
Haralick, R. M., K. Shanmugam, and I. Dinstein, 1973. Textural Fea- tures for Image Classification, I E E E Transactions on Systems, Man, and Cybernetics, Vol. SMC-3(6):61M21.
Holcomb, R. T., 1987. Eruptive history and long-term behavior of Ki- lauea Volcano, Volcanism in Hawaii, United States Geological Survey Professional Paper 1350, Vol. 1:262-350.
224 PHOTOGRAMMETRIC ENGINEERING & REMOTE SENSING, 1990
Hulme, G., 1974. The interpretation of lava flow morphology, Geophys- ical Journal of the Royal Astronomical Society, Vol. 39:361-383.
Irons, J. R., and G. W. Peterson, 1981. Texture transforms of remote sensing data, Remote Sensing of Environment, Vol. 11:359-370.
Kaupp, V. H., L. R. Gaddis, P. J. Mouginis-Mark, B. A. Derryberry, H. C. MacDonald, and W. P. Waite, 1986. Preliminary analysis of SIR-B radar data for recent Hawaii lava flows, Remote Sensing of Environment, Vol. 20:283-290.
Kilburn, C. R. J., 1983. Pahoehoe and a'a lavas: A discussion and con- tinuation of the model of Peterson and Tilling, Journal of Volcanology and Geothermal Research, Vol. 11:375-382.
Lipman, P. W., and N. G. Banks, 1987. A'a flow dynamics, Mauna Loa 1984, Volcanism in Hawaii, United States Geological Survey Profes- sional Paper 1350, Vol. 21527-1567.
Lockwood, J. P., D. W. Peterson, and R. I. Tilling, 1975. Chronological summary, Hawaiian Volcano Observatory Summary 174, January to December 1974, United States Geological Survey, Washington, DC.
Macdonald, G. A., 1953. Pahoehoe, a'a, and blocklava, American Journal of Science, Vol. 252:169-191.
-, , 1967. Forms and structures of extrusive basaltic rocks, The Poldervaart Treatise on Rocks of Basaltic Composition (H. H. Hess and A. Poldervaart, eds.), Vol. 1:l-61.
Macdonald, G. A., A. T. Abbott, and F. L. Peterson, 1983. Volcanoes in the Sea, University of Hawaii Press, Honolulu, Hawaii.
Moore, J. G., R. L. Phillips, R. W. Grigg, D. W. Peterson, and D. A. Swanson, 1973. Flow of lava into the sea, 1969-71, Kilauea Volcano, Hawaii, Bulletin of the Geological Society of America, Vol. 84537-546.
Peterson, D. W., and R. I. Tilling, 1980. Transition of basaltic lava from
pahoehoe to a a'a, Kilauea Volcano, Hawaii: Field observations and key factors, Iournal of Volcanology and Geothermal Research, Vol. 7:271- 293.
Pike, R. J., and W. J. Rozema, 1975. Spectral analysis of landforms, Annals Association of American Geographers, Vol. 65(4):499-516. - .
Pratt, W. K., 1978. ~igi tal Image Processing. John wile; and Sons, New York.
Schaber, G. G., G. L. Berlin, and R. J. Pike, 1980. Terrain-analysis pro- cedures for modeling radar backscatter, Radar Geology: An Assess- ment, NASA-JPL Publication 80-61:168-199.
Shanmugam, K. S., V. Narayanan, V. S. Frost, J. A. Stiles, and J. C. Holtzman, 1981. Textural features for radar image analysis, IEEE Transactions on Geoscience and Remote Sensing, Vol. GE-19:153-156.
Stearns, H. T., 1985. Geology of the State of Hawaii, Pacific Books, Palo Alto, California.
Swanson, D. A., 1973. Pahoehoe flows from the 1969-1971 Mauna Ulu Eruption, Kilauea Volcano, Hawaii, Geological Society of America Bul- letin, Vol. 84:615-626.
Ulaby, F. T., F. Kouyate, B. Brisco, and T. H. L. Williams, 1986. Textural information in SAR images, IEEE Transactions on Geoscience and Re- mote Sensing, Vol. GE-23(2):235-245.
Wentworth, C. K., 1938. Ash formations of the isle of Hawaii, Hawaiian Volcano Observatory 3rd Special Report, 183 p.
Wentworth, C. K., and G. A. Macdonald, 1953. Structures and Forms of Basaltic Rocks in Hawaii, United States Geological Survey Bulletin 994,98 p.
(Received 15 July 1988; revised and accepted 27 April 1989)
Large-Scale Mapping Guidelines
ASPRS's Large-Scale Mapping Guidelines is factors to consider when contracting for niapping services. exploding with information to aid local, state, and Federal PART 111. . . agencies, private developers, corporations, and individuals in . . . is filled with precisely written sample contract preparing specifications and acquiring large-scale maps. specifications.
Prepared by the National Mapping Division of the Department of the Interior Geological Survey, the guidelines In addition, Large-Scale Mapping Guidelines includes a are divided into the following three parts: complete glossary with all the relevant mapping terms plus a PART I . . . list of selected references and appendix with illustrated samples
. . . deals with the variety of uses of large-scale maps of large-scale maps. including: This handsome 56-pagepaperback edition will provide a applications for highway and street engineering storm and guide by which an organization or individual needing large-
sanitary engineering * urban area planning* utilities location scale maps can determine a desired end product, specify it and management emergency services tax assessment precisely, and obtain it under fair, reasonable, and uniform
contracting procedures. PART 1 1 . . . . . . focuses on understanding the mapping process and ASPRS is offering Large-Scale Mapping Guidelines at a low -
some of the sophisticated equipment involved as well as several scale price of $5. . . don't miss it! ~ I I I I I I I I I I I I I I I I I I I I I I I I I I m I I I I I I I I
I Large-Scale Mapping Guidelines Stock No. 628L $5 1
SEND BOOKS TO: 1
I Method of Payment* Name Payment Enclosed Mastercard VISA
I I
Address Please complete the following information. I I Account Number (All Digits) I I SEND ALL ORDERS TO: Expiration Date I I ASPRS Questions? Signature
( 5410 Grosvenor Lane, Suite 210 (301) 493-0290 'Note: Checks must he in US dollars, payable in the Unitcd States. COD I
Bethesda, MD 20814-2160 Paperback books are not returnable, orders not accepted. Prices are subject to change without notice. I LIIIIIII~~I~IIIII~IIIIIIIIIII==II~LII~J