law, finance, and economic growth in china -...
TRANSCRIPT
Law, Finance, and Economic Growth in China*
Franklin Allen† Jun Qian Meijun Qian Finance Department Finance Department Finance Department The Wharton School Carroll School of Management Carroll School of Management University of Pennsylvania Boston College Boston College Philadelphia, PA 19104 Chestnut Hill, MA 02467 Chestnut Hill, MA 02467 [email protected] [email protected] [email protected]
Revised: December 23, 2002
Abstract
China is an important counterexample to the findings in the law, finance, and growth
literature: neither its legal nor financial system is well developed by existing standards, yet it has one
of the fastest growing economies. We compare growth in the formal sector (state-owned and publicly
traded firms) and the informal sector (all other firms). With much poorer applicable legal and
financial mechanisms, the informal sector grows much faster than the formal sector, and provides
most of the economy’s growth. There exist effective informal financing channels and governance
mechanisms, such as those based on reputation and relationships, to support this growth.
JEL Classifications: O5, K0, G2. Keywords: Law and finance, economic growth, formal sector, informal sector, corporate governance.
* We appreciate helpful comments from Dan Bergstresser, Gregory Chow, Julan Du, Jie Gan, Tom Heller, Li Jin, Sung Wook Joh, Anthony Neoh, Jay Ritter, Yihong Xia, Wuxiang Zhu, and seminar and conference participants at the 2nd Asia Corporate Governance Conference in Seoul, Korea, Fudan University in Shanghai, China, Harvard Business School, the 1st Tsinghua International Finance Conference in Beijing, China, and the Wharton Impact Conference on “The Future of Chinese Management” in San Francisco. We thank Andy L. Lin and Anthony Neoh for providing us with the data from the Shanghai, Shen Zhen, and Hong Kong Stock Exchanges. Financial support from Boston College and The Wharton School of the University of Pennsylvania is gratefully acknowledged. The authors are responsible for all remaining errors. † Corresponding author: Finance Department, Wharton School, University of Pennsylvania, Philadelphia, PA 19104. Phone: 215-898-3629, fax: 215-573-2207, E-mail: [email protected].
1
I. Introduction
Three strands of related literature on law, finance and growth have emerged in financial
economics in recent years, and their impact on other areas of finance research has been significant.
First, the literature on law and finance links the origins of countries’ legal systems to differences in
their corporate governance, investor protection, and external markets. For example, La Porta, Lopez-
de-Silanes, Shleifer, and Vishny (LLSV hereafter, 1997, 1998, 2000) differentiate countries with
legal systems derived from those in England, France, Germany and Scandinavia. They find those
with English common-law and French civil-law origins are at the extremes. The former (latter) group
of countries offers the strongest (weakest) legal protection of investors, has dispersed (concentrated)
ownership of publicly traded companies, and has stronger and broader (weaker and more narrow)
capital markets. They also find that firms in countries that offer investors strong protection tend to
use external capital markets to raise funds. The second literature champions the view that the
development of the financial system that includes a stock market and intermediation, contributes to a
country’s overall economic growth (e.g., McKinnon 1973). Recently, researchers have strengthened
this view by presenting supporting empirical evidence at the country-level (e.g., King and Levine
1993, Levine and Zervos 1998). Finally, the third literature examines whether there is a link between
law, finance, and economic growth. Based on similar measures of legal systems used in the LLSV
studies, Levine (1999) finds that the legal environment contributes to the growth of financial
intermediation, which in turn stimulates the overall economic growth. At the firm level, Demirguc-
Kunt and Maksimovic (1998) find that in countries with more efficient legal systems, a greater
proportion of firms rely more on external markets for long-term financing, which contributes to
higher firm growth relative to the growth rate calculated based on internal financing and short-term
credit only.
2
However, all the above studies treat each country in their sample on an equal-weight basis.
For example, among the 49 countries in the LLSV sample, countries such as Japan and India receive
the same weight as countries like Jordan and Ecuador. Moreover, they all exclude one of the most
important developing countries in the world, China. In this paper, we demonstrate that China is a
significant counterexample to the findings of the existing literature on law, finance and growth.
Despite its poor legal and financial systems, China has the largest and one of the fastest growing
economies in the world. Perhaps more surprisingly, we find that the growth within the two sectors of
the economy is unbalanced: the size and growth in the formal sector, which includes state-owned and
publicly traded firms, are dominated by those of the informal sector that includes all the other firms,
and where applicable legal and financial mechanisms are much poorer. Our conclusion is that there
exist very effective, non-standard financing channels and corporate governance mechanisms to
support the growth of the informal sector. Our evidence suggests that these informal channels and
mechanisms are based on reputation and relationships, and they can substitute for and do better than
standard channels and mechanisms. Our results challenge the law and finance view that it is the legal
system that causes the difference in financial system, as well as the finance, law and growth view that
legal and/or financial systems are an important contributor to differences in growth. Although our
results are based on China, similar “substitutes” based on reputation and relationships may be behind
the success of other economies as well, including developed economies. Thus a thorough
examination of these substitutes has much more general implications and can provide valuable
guidance for many other countries.
Insert Tables 1-A and 1-B here.
Tables 1-A and 1-B illustrate China’s status as one of the most important countries in the
world. At the end of 1999 it had a population of 1.26 billion people, the largest of any country. From
Table 1-A, China’s GNP ranked seventh in the world as of 1999 in terms of US$, while the average
3
annual growth rate of 8.4% during the period of 1990-1998 is much higher than the weighted average
annual growth rates of the groups of countries studied by LLSV during the same time period. Given
this growth rate and assuming other countries also grow at their respective current rates and using the
nominal exchange rates, China will only take 21 years to surpass Japan, currently the second largest
economy. However, if we use Purchasing Power Parity (PPP) to recalculate the GNPs, China’s
economy is the second largest behind only the US as of 1999. Moreover, with the same PPP formula
and assuming that the US economy continues to grow at 3.6% per year, it will only take 15 years
before China overtakes the US to be the largest economy in the world.1
It may be more useful to compare China’s economic growth with other major emerging
economies rather than the most developed countries, since China’s rapid growth only started in 1979
when it opened its door to the outside world.2 In Table 1-B we compare China with seven of the
largest emerging economies in the world. In terms of PPP-adjusted GNP figures in 1999, China is
more than twice the size of India, the second largest country in the list. While in terms of the growth
of both PPP-adjusted and population-adjusted (per capita) GNPs during 1990-1998, China’s annual
growth rate of 10.7% is almost twice as high as that of Argentina, which has the second highest
growth rate during the same period. With the recent entrance into the WTO and the large potential
market it can provide, China will play an increasingly significant role in the world economy.
Using measures from the existing literature, we find that China’s legal system is significantly
under-developed compared to the countries in the LLSV and Levine samples. Its corporate
governance, accounting standards, and investor protection systems are poor at best, judging by
1 All of China’s GNP and GNP growth figures exclude Hong Kong. The PPP conversion factor we used is obtained from the World Bank Development Indicator. For details refer to the “Handbook of the International Program,” United Nation, New York 1992. Maddison (1998) and Chow (2002) provide similar calculations for China based on PPP. The growth rate of the US is calculated using the period 1990-1998. 2 Measured by simple exchange rates, China’s GNP in 1980 was US$180.6 billion while in 1990 it reached US$368 billion. Also note that the exchange rate between RMB and US$ changed from US$1 = 4.25 yuan to 8.28 yuan in 1992,
4
existing standards in the literature, while its banking system is not well developed and is to a large
degree inefficient. Its newly established Shanghai Stock Exchange (SHSE hereafter) and ShenZhen
Stock Exchange (SZSE hereafter) have been growing very fast since their inception in 1992, but their
scale and importance are still not comparable to other channels of financing, in particular the banking
sector, for the entire economy.
After we examine both the legal and financial systems using established measures and
indexes, we compare growth at the firm level in both the formal and informal sectors. We define the
formal sector to be firms where the government has ultimate control (state-owned enterprises, or
SOEs), or firms that are listed on an exchange and are publicly traded. All other types of firms
belong to the informal sector, which includes: 1) “quasi-state-owned” companies, namely,
collectively- and jointly-owned companies, where joint ownership between the government and local
communities or institutions is forged; 2) privately owned companies (excluding publicly traded
companies that were privately owned): controlling owners of these firms can be Chinese citizens,
investors (or companies) from Taiwan or Hong Kong, or foreign investors (or companies). Measured
by total industrial output and during the period from 1995 to 1999, the informal sector grew an
average of 19.0% per year, compared to the average growth rate of 4.6% in the formal sector, and the
growth in the informal sector contributes most of the overall growth of the economy. If one wonders
how China’s existing legal and financial systems sustain the large and fast growing economy, then
the growth patterns within the formal and informal sectors must be even more surprising, because the
available legal and financial mechanisms are much poorer in the informal sector than those in the
formal sector, yet it is the informal sector that has enjoyed much faster growth. Our conclusion is that
there exist very effective, non-standard financing channels and corporate governance mechanisms,
which actually introduced a significant downward bias for the GNP figure in 1992. This is why using PPP adjusted figures to measure GNP and its growth is actually more appropriate.
5
which can substitute for and do better than standard channels and mechanisms, to support the growth
of the informal sector.
We next examine the aggregate evidence on how firms in these two sectors raise funds,
including: 1) the central government’s budget planning; 2) bank loans; 3) the contribution from
provincial/local government/township/community; 4) private and self-financing, including equity and
bond issuance from listed companies, and direct foreign investment. Not surprisingly, firms in the
informal sector rely heavily on “self-fundraising” to finance the majority of their funding needs. This
category includes fundraising in the form of private equity, debt, loans, and many other informal
contracts from communities, other firms and institutions, investors from Taiwan, Hong Kong and
other countries.
We also examine separately the financing channels and corporate governance of firms in each
of the two sectors at a disaggregated level. For the formal sector, we find that the standard corporate
governance mechanisms are weak and ineffective. While the unique ownership structure of publicly
traded firms, which include different classes of stocks that are owned by the government, legal
entities, and private investors, affects how firms raise funds. However, we find no fundamental
differences between China’s listed firms and their counterparts in developed countries. We also find
that Chinese firms are moving toward the direction defined as the “standard” form in developed
countries.
More interesting results are found for the informal sector. Our evidence suggests that the
informal financing channels and governance mechanisms belong to a unique system of institutions
that has been evolving from a mixture of factors including reputation and relationships (Greif 1989,
1993), competition, culture and history (Greif 1994, Stulz and Williamson 2002), as well as selected
sets of ideology and practice from developed countries. First, many successful informal sector firms
do not use any channel of formal financing during various stages of development. For example, start-

6
up firms often rely on their friends and family and other private sources of funding. While more
mature firms often have cross-listed accounts of credits and debits with their business partners and
other companies. These informal accounts resemble “trade credits” in that they replace cash
transactions and they are cleared periodically. They differ from trade credits as there are sometimes
no formal written contracts and the clearing dates and methods are often subject to renegotiation.
Secondly, despite the almost non-existence of formal governance mechanisms, alternative,
informal mechanisms have been remarkably effective in the informal sector. Perhaps the most
important of these is the role of reputation and relationships. Another important mechanism that
drives good management and corporate governance is competition. Given the environment of low
survivorship during early stages of firms’ development, gaining comparative advantage in the region
and the industry provides a strong incentive for all firms. Another form of effective governance is
family-run firms, as it has been shown that these firms emerge as the dominant form of ownership
structure in countries with weak minority shareholder protections. Consistent with the findings in
other Asian countries, many of China’s successful informal sector firms have a very high fraction of
the firm’s stake owned by their founders and executives, and have performed very well. Finally, the
success of the informal sector would be impossible without the significant contribution from foreign
investors, in particular investors from Taiwan and Hong Kong. In anticipating the possible loss of
their investment due to the failure of the firm, frauds, the almost non-existent formal investor
protection rules, political risks, and the sometimes prevalent corruption of local officials, why are
they willing to finance and refinance these firms? An important reason is the common goal of sharing
high prospective profits that ties local and foreign investors with entrepreneurs and managers to
overcome numerous obstacles to achieve just that. Under this common goal in a multi-period setting,
implicit contractual agreements and reputation can act as enforcement mechanisms to ensure that all
7
parties fulfill their role to help the firm grow and generate profits. Profit sharing also makes it
incentive compatible for officials at various levels not to disturb the operation of the firm.
The rest of the paper is organized as follows. Section II presents evidence comparing China’s
legal and financial systems to those of LLSV countries, as well as evidence on growth differentials in
the formal and informal sectors. Section III presents aggregate evidence on firms’ financing channels
for both sectors, while Section IV presents evidence on publicly traded firms’ corporate governance,
financing channels, and investment decisions. In Section V we first provide anecdotal evidence on
how firms in the informal sector raise funds, and the paths firms take to start, grow and succeed, then
we discuss some of the informal financing channels and governance mechanisms and how they work
together to support the growth of the informal sector. Finally we conclude in Section VI. The
Appendix contains explanations of all the variables that we use in the paper.
II. Evidence on Legal and Financial Systems, and Growth in the Two Sectors
In this section we provide evidence on the status of China’s legal and financial systems, and
compare them to the countries studied by the existing literature (the LLSV sample and the Levine
sample). We then compare growth in the formal and informal sector.
A) Legal System
We first examine similar measures on the legal system of China and compare them to the
average measures of LLSV countries. See Appendix A.1 for a list of the definitions of the measures
used in the paper. From Table 2-A, we can see that in terms of overall creditor rights, China falls in
between the English-origin countries that have the highest measures of protection, and German-origin
countries that have the poorest protection. Table 2-B shows that China’s shareholder protection
shows a similar pattern. Because the distribution of these measures may be heavily skewed toward
the tails due to a few “outlier” countries with very high and low scores, we also provide the
8
percentage of countries in the sub-samples and the entire sample of LLSV countries that have equal
or higher measures than China’s (numbers in brackets in Tables 2-A and 2-B). Almost half of
countries in the French-origin sub-sample, to which China compares favorably, (and three quarters of
the Scandinavian-origin countries) have equal or better measures of creditor and shareholder rights.
The overall evidence thus suggests that the majority of LLSV sample countries have better creditor
and shareholder protections than China: 68% of LLSV sample countries have the same or better
creditor protection, while 65% countries have the same or better shareholder protection than China.
Insert Tables 2-A and 2-B here.
We obviously cannot draw our conclusions regarding the comparison of legal systems based
on Tables 2-A and 2-B alone. First, the scores on creditor and shareholder rights mainly measure the
protection of owners of publicly traded companies. As above, the stock market and private ownership
of corporations are recent phenomena. More importantly, these scores measure the legal system on
paper, not in practice. Even though the Chinese government has adopted various protection measures
into the law, from which we calculated the scores, one can argue that a more important measure for
the status of the legal system would be law enforcement. Table 2-C below provides some evidence in
this regard. It is important to note that all the measures here, including those for China, are drawn
from independent international rating agencies. We can see that for two key categories of law
enforcement, namely, the rule of law and corruption, China’s measures are significantly below all
average measures of LLSV sample countries, regardless of their legal origin. This suggests that the
relatively high scores of creditor- and shareholder-protection of China (in Tables 2-A and 2-B) based
on government legal documents are not reliable.
Insert Tables 2-C and 2-D here.
We also compare China’s legal system to some other large emerging countries, similar to the
growth comparison in Table 1-B above. From Table 2-D, we can see that China’s “corruption” index
9
is the worst among the seven developing countries, while its measure of anti-director rights (creditor
rights) is only higher than that of India and Mexico (Argentina and Mexico). These measures indicate
that the development of China’s legal system is certainly not ahead of any other major emerging
economies, and it is clearly dominated by those that have English common-law origin (India,
Pakistan, and South Africa).
In order to have an effective law enforcement system, a country must have a sufficient supply
of qualified legal professionals.3 By one estimate, there are currently 150,000 lawyers in China,
roughly the same number of licensed attorneys as in the state of California. Lawyers represent only
10% to 25% of all clients in civil and business cases, and even in criminal prosecutions they represent
defendants in only half of the cases. Among approximately five million business enterprises in
China, only 4% of them currently have regular legal advisers. Moreover, only one-fifth of all lawyers
in China have law degrees, and even a lower fraction of judges have formally studied law at a
university or college. Needless to say, it will be a long time before China has a strong legal labor
force. Another reason that many of the new laws will not be effectively enforced in China is the
intrinsic conflict of interests between “fair play” in practicing law and the monopoly power of the
single ruling party, especially in cases where government officials or their affiliates are involved.
Fortunately for investors and entrepreneurs, some independent judicial authority seems to be evolving
in the area of business law.
Finally, we comment on the current status of China’s accounting system.4 The reform started
in 1992, with the enactment of regulations governing the enterprises with foreign investment, which
provided the necessary accounting infrastructure to assist companies in attracting foreign direct
investment. The ASBE (Accounting Standards for Business Enterprises) of China, together with the
3 For more detailed information, see for example Orts (2001). 4 See Xiang (1998) for more information. We thank Arnold Wright and Mohamed Hussein for pointing out this source to us.
10
13-industry regulation board, have been trying to move China’s accounting practice of the formal
sector toward the IAS (International Accounting Standards). However, the most glaring problem in
China’s accounting system is the lack of independent, professional auditors, similar to the situation of
legal professionals. This implies that the proposed IAS-based standards may be counterproductive
within China’s current infrastructure: with few auditors understanding the new standards and
enforcing them, and the lack of an effective judicial system, embezzlement of company’s assets and
frauds may occur more frequently, as compared to the situation where a much simpler set of
accounting standards is adopted.
To summarize, China’s legal system is underdeveloped relative to most countries, including
other major developing countries. By the argument of LLSV and Levine, China’s poor legal system
should tend to severely hinder Chinese companies raising funds through the capital markets, and its
overall growth. What we argue is that this prediction ignores how well alternative mechanisms can
replace formal systems.
B) Financial System
We first examine China’s financial system at the aggregate level, including both its banking
system and financial markets. We then examine its stock exchanges in more detail and also briefly
discuss its venture capital markets.
Insert Table 3 here.
In Table 3 we compare China’s financial system to those of LLSV sample countries, using
measures given by Levine (2000). We first compare the size of a country’s equity markets and banks
relative to that country’s GDP. One can see that China’s stock markets, which did not exist until
1992 but have been growing very fast, are smaller than most of the other countries, both in terms of
11
market capitalization and the total value of equity traded in the market.5 In contrast, China’s banking
system is much more important in terms of size relative to its stock markets: the ration of total bank
credit to GDP is 1.13, higher than even the German-origin countries (with an average of 1), which are
known for having bank-dominated financial systems. However, when we consider bank credit issued
(or loans made) to the private sector only (e.g., individually owned or publicly traded companies),
China’s ratio dropped sharply from 1.13 to 0.242, suggesting that most of the bank credit is issued to
companies in the public sector (e.g., state-owned companies and other collective-owned companies;
see below for more details). Moreover, China’s banking system is not efficient: its overhead cost to
total assets is 12.2%, compared to 5.4% for the French-origin countries, the next highest group of
countries.6 The second panel of Table 3 compares the relative importance of financial markets vs.
banks (“Structure indices”). “Structure activity” and “Structure size” are relative size measures,
which are equal to Log(market size/bank size), with a smaller value indicating that the country’s
financial markets are smaller than its banking system. China has the lowest scores for both categories,
suggesting that China’s banking sector is much larger than its markets, and this dominance by the
banks over markets is stronger than the average of all LLSV sample countries.7
We also compare the development of the entire financial system (“Financial Development”),
including both banks and markets, in the last panel of Table 3. These measures are equal to
Log(market ratio×bank ratio), and a higher figure indicates that the country (group of countries) has a
more developed financial system. If we use all bank credit (including to the public sector) then
5 Note that total value traded is a better measure than market capitalization because when calculating market capitalization non-tradable shares are also included. See the discussion on publicly traded firms below for details. 6 We also compare regulation on banks in terms of the degree of engagement allowed into areas of securities operation, firm ownership, insurance and real estate. On paper Chinese banks are prohibited from doing business in these areas. But these restrictions may be insignificant for the banks in terms of generating profits, since a large amount of the banks’ business comes from the public and government sectors. 7 We also compare “Structure efficiency,” in Table 3, which is the relative efficiency of markets vs. banks, with overhead cost of banks measuring the efficiency of the banking system. The larger the figure, the more efficient are markets relative to banks. Since China has the highest score (-2.653), it indicates that China’s stock markets are actually relatively more efficient than banks, compared to other countries.
12
China’s overall financial market size (“Finance Activity” and “Finance Size”) lies in the middle of
the pack among those LLSV countries. However, given that all other countries’ measures were based
on private bank credit only, if we re-calculate China’s financial system the same way, we find that it
is not as large (relative to the entire economy) as the LLSV sample average level, and is only better
than the French-origin countries’ average, which is the lowest group of countries of the entire sample.
In terms of efficiency of the financial system, China’s measure is below all sub-samples of LLSV
countries, suggesting China’s financial system is under-developed relative to most other countries.8
Based on the above evidence, we can conclude that China’s financial system is dominated by a large
but inefficient banking sector.
Next we examine China’s financial markets, in particular the stock exchanges, in more detail.
From Table 4 below, China’s domestic stock exchanges, SHSE and SZSE, with their combined size
or volume, rank the ninth among the largest stock exchanges in the world. In addition, the Hong
Kong Stock Exchange (HKSE hereafter), where selected firms from Mainland China can now be
listed and traded, is ranked eighth in the world by itself.9 If we rank the combined size of all stock
exchanges in a country, China would rank number 5, behind only the US, Japan, UK, and France.
Insert Table 4 here.
As fast as the growth of China’s stock markets have been, they are not efficient in that prices
and investor’s behavior do not reflect fundamental values of listed firms. Again from Table 4,
“Concentration” measures the fraction of total turnover of the market within 2000 that is due to
turnover from companies making up 5% or more of the total market cap. We can see that shares from
the largest firms in China are not frequently traded and this ratio, 2.73%, is much lower than any
8 We also examine the trend of financial system development in China in the 1990s. It is clear that: 1) the overall size of both markets and banks is growing; 2) banks dominate the markets even though markets are becoming more important relative to banks; 3) efficiency (both in terms of banks and the overall system) remains low.
13
other major stock exchange in the world (Frankfurt has the second lowest concentration but the
fraction is 45.3%). Moreover, shares from medium- and small-firms are traded very frequently, as
shown by the variable “Turnover Velocity,” which is defined as the total turnover for the year
expressed as a percentage of total market cap. The turnover velocity for China’s listed firms is 500%,
even much higher than that of NASDAQ with the well-known trading patterns of technology stocks
in recent years. These patterns strongly suggest that investors do not hold on to their shares very long
and trading and turnover are very frequent, especially for medium- and small-cap stocks.
Insert Tables 5-A and 5-B here.
Next, we examine the role of financial markets in helping firms raising funds (LLSV 1997).
The evidence is presented in Table 5-A. From the comparison of the external capital markets, it is
clear that financing via financial markets in China is different from the LLSV sample countries, in
that both the scale and relative importance (compared with other channels of financing) of the
external markets is small. For example, for the ratio of External Capital and GNP, the LLSV sample
average is 40%, compared to China’s 10% (in 1998); for the ratio of Debt (issued in the private
sectors) over GNP, the LLSV sample average is 59%, compared to China’s 22%, but if we include
debt issued to all sectors (e.g., to central and local government) this ratio increases to 79%,
suggesting that the majority of “debt” does not go through the capital markets but rather through a
sometimes centralized system. Table 5-B provides some evidence on financing sources at the firm
level. The numbers indicate the average of median ratios of all the countries, which could illustrate
different patterns from the aggregate figures shown in Table 5-A.10 The evidence however is
9 However, not all shares are tradable, as shares owned by the government and legal persons (other companies or organizations) are non-tradable. Nevertheless, total market capitalization using tradable shares reached $1500 billion yuan (or US$170 billion) in 2001. 10 Each figure in the table is calculated by first using the median ratio of each category taken from several key industries within a country, then by taking the average of the medians to get the country figure, before averaging over countries in the sub-sample. The figures for China are calculated using data from firms listed on either the SHSE or SZSE.
14
consistent with that in Table 5-A: whether in terms of total equity or total debt, the listed Chinese
companies do not rely on the external markets as much as their counterparts in LLSV countries.
Therefore, the overall evidence on the comparison of China and other countries’ external
markets is consistent with LLSV (1997) predictions. With an underdeveloped legal system, the fact
that China has small external markets comes as no surprise. What is surprising is the fact that the
small scale of funds raised from capital markets in China does not match its large scale of production,
consumption and rapid growth. In what follows we examine what other channels of financing are
playing the role of substituting for external capital markets and standard, textbook financing
channels.
We summarize most of our results on the comparison of China’s legal and financial systems
to those of LLSV countries in Figure 1. The horizontal axis measures overall investor protection in
each country, while the vertical axis measures the (relative) size and efficiency of that country’s
external markets.11 Excluding China, countries with English common-law systems (e.g., US, UK) lie
in the northeastern region of the graph, while those with French civil-law systems (e.g., France,
Argentina) lie in the southwestern region, according to the results of LLSV (1997). China, on the
other hand, would be placed close to the bottom left corner of the graph, with both its legal and
external markets less developed than all the other countries except for Mexico (French-origin)
included in the figure.
Insert Figure 1 here.
Finally, we briefly discuss China’s venture capital markets. It is often argued that one of the
reasons the US has been so successful in recent years in developing new industries is the existence of
11 Following LLSV (1997, 1998, 2000), the score on the horizontal axis is the sum of (overall) creditor rights, shareholder rights (anti-director rights and one-share, one-vote), rule of law, and finally, the corruption index of the government, while the score of the vertical axis indicates the distance of a country’s overall external markets score (external cap/GNP, domestic firms/Pop, IPOs/Pop, Debt/GNP, and Log GNP) to the mean of all countries, with a positive (negative) figure indicating that this country’s overall score is higher (lower) than the mean.
15
a strong venture capital sector.12 Allen and Gale (2000a) suggest that venture capital should be
thought of as closer to market finance rather than intermediated finance, because venture capitalists
can easily cash out by selling firms in IPOs in the market and it is this that makes them willing to
provide seed capital initially. Therefore, it is not surprising and is consistent with the LLSV view that
the boom of venture capital industry coincided with the market boom in the US. Since its inception in
the 1980s, China’s venture capital industry has enjoyed fast growth, in particular since 1992.13
Consistent with our main findings, China’s venture capital industry, measured by US standards, is
under-developed and its role in supporting the growth of young firms is very limited. For example,
based on interviews conducted with 36 venture capitalists in 24 venture companies, Bruton and
Ahlstrom (2002) find that the limited formal rules and regulations are often ineffective, while
informal mechanisms based on relationship are the norm in all stages and phases of the industry.
They also conclude that, understanding the local environment as well as the institutional background
of the Chinese venture industry is the crucial aspect to success in this market.
C) Growth in the Formal and Informal Sectors
We now present evidence on firm growth in the two sectors. We examine all types of firms in
China based on their ownership structures. We present the detailed definitions of all types of firms in
Appendix A.4.
Insert Figure 2 here.
Figure 2 compares the total industrial output produced in the formal and informal sectors from
1995 to 1999. It is clear that the informal sector dominates the formal sector in terms of either the
size of the output (total output in 1999 is US$1200 billion for the informal sector while it is only
12 For example, Kortum and Lerner (2000) have documented a strong relationship in the US between the extent to which venture capital is used in an industry and the rate of patenting. 13 Most of the active venture capital companies are organized as CDIFs (China Direct Investment Funds), but in recent years more companies are organized as limited partnerships, where an offshore corporation is created for the joint venture with local Chinese firms.
16
around US$400 billion in the formal sector) or in terms of the growth trend. Table 6-A below
compares growth rates of industrial output in the formal and informal sectors from 1995-1999. As
above, the informal sector grew at an annual rate of 19.0% between 1995 and 1999, while the formal
sector grew at only 4.6% during the same period. Table 6-A also compares growth rates for firms
with different types of ownership structure between 1998 and 1999. Firms in “other types of
ownership,” which includes firms owned by investors from Taiwan, Hong Kong, and other countries,
and Township Village Enterprises (TVEs), and firms that are individually owned (by Chinese
citizens) grew at the fastest pace (27.6% and 14.4% annually). In contrast, the SOEs and publicly
traded companies in which the government has controlling shares only grew at 8.8%.14 In addition,
the growth rates for investment in fixed assets of these two sectors are comparable (see Panel B of
Table 6-A). These results imply that the informal sector is actually more productive than the formal
sector. Finally, there has been a fundamental change among the formal and informal sector in terms
of their contribution to the entire economy (measured by total industrial output): in 1980, the state
(collectively-owned firms) sector contributed 76% (23.5%) of the country’s total industrial output;
but in 1996, state sector only contributed 28.5% while the collective sector contributed 39.4% of total
industrial output. On the other hand, in 1980 the individual (other types of enterprises) sector was
negligible, but in 1996 it contributed 15.5% (16.6%) of total industrial output, and the above trend of
the informal sector replacing the formal sector (especially the state sector) continued.15
Insert Tables 6-A and 6-B here.
Table 6-B presents the number of non-agricultural employees in these two sectors. We find
that the informal sector is a much more important source for employment opportunities. Over the
14 There is an ongoing process of privatizing SOEs. Potentially this may bias the growth rate of the informal sector. It may be higher relative to the formal sector as there are firms shifting from the formal sector to the informal sector. However, the overwhelming majority of SOEs are transformed into publicly listed firms, which are also categorized in the formal sector along with SOEs. This process is unlikely to change the validity of the results above.
17
five-year period from 1995 to 1999, the informal sector employs an average of 67.5% of all non-
agricultural workers, while the TVEs (a type of informal sector firm) are by far the most important
employer for workers from the rural areas. Moreover, the number of employees working in this
sector was growing at 1.3% over a five-year period, while the labor force in the formal sector was
shrinking. These patterns are particularly important for China, given its vast population and potential
problem of unemployment.
III. Firms’ Financing Sources: Aggregate Evidence
In this section we compare how firms raise funds in China and in LLSV sample countries.
With an underdeveloped legal system, the fact that China has small external markets comes as no
surprise. What is surprising is the fact that the small scale of funds raised from capital markets in
China does not match its large scale of production/consumption and rapid growth. It is worthwhile
then to study what other channels of financing are playing the role of substituting for external capital
markets and standard, textbook financing channels.
To answer this question, we first present evidence on Chinese firms’ financing sources at the
aggregate level. We present the four most important financing sources for all the firms, namely,
(domestic) bank loans, firms’ self-fundraising (or fundraising for short), state budget, and foreign
direct investment, in Figures 3-A through 3-D. In each of these four figures, vertical bars represent
the total size of the given financing source in a given year measured in billions of US dollars (the
vertical axis on the left); while horizontally connected lines represent how different types of firms
rely on this source of financing in the same year (measured by the percentage of this type of firms’
total financing coming from this source, and the vertical axis on the right).
15 See Chapter 16 in Chow (2002) for more details. Individually-owned and other enterprises include publicly traded companies but in 1996 they account for a small fraction of these sectors.
18
Insert Figures 3-A and 3-B here.
By far the two most important sources of financing channels are self-fundraising and bank
loans. Consistent with previous evidence on China’s banking sector, bank loans provide a large
amount of funds to firms, and constitute a large fraction of firms’ total financing needs. From Figure
3-A, we can see that jointly-owned firms rely on bank loans to raise more than 30% of their total
financing needs. A similar pattern holds for state- and collectively-owned companies.16
Self-fundraising includes proceeds from capital raised from local governments and
communities and other investors (not in the form of equity or bonds), internal financing channels
such as retained earnings, and all other funds raised domestically that is not included in the other
three sources. From Figure 3-B we can see this broad category is the most important financing source
for most firms.17 First, the size of total fundraising of all firms has been growing very fast over the
period of 1994-1999, with 1999’s figure reaching close to US$200 billion, compared to a total of
US$75 billion domestic bank loans shown in Figure 3-A.18 Second, self-fundraising is the most
important source of financing for many firms. For example, from Figure 3-B, individually owned
companies, not surprisingly, rely mostly on self-fundraising (about 90% of total financing).
Interestingly, even for state- or quasi-state-owned companies, self-fundraising is also important in
that it captures somewhere between 45% and 65% of total financing.
Insert Figures 3-C and 3-D here.
Next, we briefly examine two other important sources of financing: state budget and foreign
investment (Figure 3-D). As did all socialist countries, China used to rely on a central planning
system to allocate the state budget to most of the companies in the country. As shown in Figure 3-C,
16 We present evidence on how publicly traded firms raise funds in Figure 4-A below. 17 Our current data source, the China Statistical Yearbook (2000), does not provide the breakdowns of “fundraising,” thus we only have the total figures. 18 It is important to point out that equity and bond issuance, which are included in fundraising, apply only to publicly traded firms, and account for only a small fraction of the aggregate financing sources as shown in Table 6-A.
19
the evidence that the state-budget now only contributes 10% of state-owned companies’ total funding
in China should remove anyone’s doubt of the impact of the ongoing economic reform on the
country.19 Finally we look at foreign direct investment. From Figure 3-D, this source is comparable to
the state budget, both in terms of aggregate size and in terms of the relative importance in firms’
financing, which is another sign that the country has evolved from a central planning, closed
economy toward an open-market economy. As of 1997, this source accounts for 7.5% of collectively-
owned firms’ total financing. This ratio dropped following that year, in part due to the Asian financial
crisis. However, with China finally joining the WTO, one might expect the size and relative
importance of foreign investment to increase to higher levels soon.
Insert Figures 4-A and 4-B here.
Having presented the four most important sources contributing to firms’ financing, we now
switch gear to focus on different types of firms’ financing decisions. We first present how firms in
the formal sector raise funds. Figure 4-A (4-B) illustrates how publicly traded firms (state-owned
firms) finance their investment. The vertical bars in Figure 4-A represent the total market cap of all
listed firms in a given year measured in billions of US dollars, while the connected lines in both
Figures 4-A and 4-B represent how each of the four main sources of financing contribute (as a
percentage of total financing) to a given type of firms’ financing needs. Figure 4-A shows that just
below 30% of publicly traded companies’ funding comes from bank loans, and this ratio has been
very stable through the 1990s, despite the fast growth of the stock markets. They also have around
45% of their total funding coming from fundraising, including proceeds from equity and bond
issuance.20
19 It is worth mentioning that the size of the state budget has been growing, which is not surprising, given the overall growth of the economy and the increase in the government’s tax and other incomes. 20 Publicly traded firms also receive funds from the state budget, because some of the firms in this category used to be state-owned, and the funding relationship has not been completely severed. But the state budget is not as important as foreign direct investment, which as of 1997 accounts for 9.5% of total financing.
20
From Figures 4-A and 4-B we can see that the growth of publicly traded firms has been
impressive, with total market capitalization closing in to US$330 billion at the end of 1999,21 whereas
state-owned firms are on a downward trend, as privatization of these firms is still in progress. From
the information on equity and bond sales reported in Table 6-A, we know that these sources of
fundraising that rely on the use of external markets only constitute a small fraction of fundraising,
compared to internal financing and other forms of fundraising. Combined with the fact that
fundraising (bank loans being the second most important source) is also the most important source of
financing for state-owned firms, we can conclude that informal channels of financing are important
even for the formal sector.
Insert Figure 5 here.
Next, we consider how firms in the informal sector raise funds. Figure 5 illustrates the total
size of “investment in fixed assets,” which we use to proxy for total financing needs, and the sources
of these funds, for all types of firms in the sector. We can clearly see that fundraising is by far the
most important source of financing, with close to 60% of total funds raised coming from this channel.
The other fact that we want to stress here is that because firms in this sector operate in an
environment with poorer legal and financial mechanisms and regulations than those firms in the
formal sector, all financing sources probably work differently from how they work in the formal
sector, and in developed countries.
IV. Evidence on Publicly Traded Firms
In this section, we focus on publicly traded companies and examine their financing and
investment decisions. As stated in the introduction, we do this to complement the literature on listed
21 The calculation of market capitalization should be interpreted cautiously; because a large fraction of the total shares are non-tradable hence the multiplication of market price per share and the grand total of shares including both tradable and nontradable shares is incorrect for many uses. See Section IV.1 on ownership structure of publicly traded firms.
21
firms in China, and we draw general conclusions on whether there are fundamental differences
between the Chinese firms and firms in developed countries. Before doing that, let us look at the
unique ownership structure, and available corporate governance mechanisms in these firms.
A) Ownership structure
Table 7-A introduces the type of stocks issued by listed Chinese firms. First, there are tradable
and nontradable shares. The nontradable shares are either held by the state/government or by other
legal entities including financial institutions and other listed firms. An important reason for having
nontradable shares, in particular the state-owned shares, is that many listed firms used to be under
complete control of the government, and these shares keep the government in partial control of these
firms as they go through the transition period. Among the tradable shares, Classes A and B shares are
listed and traded in either the SHSE or SZSE, while Class A (B) shares are issued to Chinese
investors (foreign investors including overseas Chinese). Class H shares are listed and traded on the
HKSE and are issued by selected “Red Chip” Chinese companies.
Insert Tables 7-A and 7-B here.
From Tables 7-B, 8-A, and 8-B, we can see that the ownership structure of a listed company’s
equity in China is different from that observed in many other countries. First, from Table 7-B, “state”
and “non-tradable” shares constitute a majority of all shares: in 2001, the fraction of all shares being
non-tradable (tradable) is 64% (36%); and within the non-tradable shares the majority of them belong
to the government. Information provided in Tables 8-A and 8-B is based on a survey of corporate
governance practices among companies listed on the SHSE conducted in the year 2000 by Integrity
Management Consulting and the Research Center of SHSE.22 Based on over 10,000 questionnaires
22 See also “Corporate Governance and Enterprise Reform in China: Building the institutions of Modern Market,” published by the World Bank in 2002, which provides more detailed information on the ownership and control structure.
22
sent to the directors, supervisors, and other senior managers in listed companies, extensive
information about corporate governance practices was extracted for 257 listed companies.
From Table 8-A, we can see that by far the largest shareholders for listed firms are industrial
SOEs. Since the government has either ultimate or majority ownership in these firms, we know that
the government is also a major owner for all other listed companies. On the other hand, since all
SOEs are regarded as a “legal person,” they enter the ownership structure of listed companies by
holding non-tradable shares, and the evidence here shows that as a group they are the majority
owners of all listed firms. The second largest shareholders are state-owned asset management
companies. The above findings are consistent with the evidence in Table 7-B where state and legal
person shares constitute 55% of all shares of listed firms in 1999.23 More importantly, these findings
illustrate that the ownership structure in China is far from those observed in the US and UK where
there are many disperse and small (individual) shareholders, and resembles more the patterns
observed in Japan and Germany, where cross-holding of shares among other companies and
institutions widely exists.
Insert Tables 8-A and 8-B here.
Consistent with Tables 7-A and 8-A and the one-share, one-vote scheme adopted by Chinese
listed firms, state and legal person shareholders appoint most of the board members. From Table 8-B,
we can see that state and legal person shareholders are the most influential owners, selecting 48% of
all directors on the board. Taking into account that all shareholders only selected a total of 76% of all
directors in these 257 surveyed companies (the other directors were appointed by the government),
state and legal person shareholders, while owning only 44% of the total shares, selected 70% (48 out
of 76) of those directors that took office through the voting process.
23 Also from Table 8-A, we can see that banks and security and other financial firms are never the largest shareholders. This fact reflects the government's restriction on the activities that can be undertaken by these financial companies, similar to the Glass-Steagall Act of 1933 in the US.
23
B) Corporate Governance24
Listed firms in China have a two-tier board structure: the Board of Directors and the Board of
Supervisors. The Board of Supervisors is a mixture of the German-style supervisory committee and
China’s socialist regime with employees/workers being “owners” of the enterprises. In recent years
there seems to be a trend of modeling listed firms’ board structure after US corporations. The
supervisors are usually those officials chosen from government offices at various levels or from the
parent companies. Though they are at the top of the firms’ hierarchy, they are, most of the time,
supervisors by name only, and are actually paid less than the directors, who rank below them. The
Board of Directors is controlled by the firms’ parent companies. As shown in Table 8-B, not all
directors are elected by the shareholders. The rest of them are nominated and appointed by the firms’
parent companies and the nomination process is usually kept secret. Most of the directors are well
educated, with 60% of them holding graduate or equivalent degrees. However, incentive pay is rarely
explicitly specified in the directors’ compensation packages, but a large amount of non-pecuniary
pay, including perks such as company cars and subsidized housing are sometimes linked to
performance.
Since the two-tier board system consists of members who are not voted in by the
shareholders, it is hard to imagine this kind of board structure can effectively monitor firms’
managers, because the goals of board and supervisory members are not congruent with each other or
with those of the shareholders. Some listed firms do not convene regular board meetings, and some
directors do not take the meeting rules and their duties seriously. In some corporations, directors act
as managers or executives, and the excessive overlap in these positions causes corruption.
24 Information presented in this section is based on “Corporate Governance and Enterprise Reform in China: Building the institutions of Modern Market” (World Bank, 2002), and Schipani and Liu (2002).
24
The external corporate governance mechanisms are also limited and weak. First, the existing
ownership structure, characterized by cross-holdings of shares among listed companies and
institutions, makes hostile takeovers virtually impossible. Secondly, institutional investors do not
have a strong influence on management or on the stock market. Open-end funds are a very recent
addition to the financial institutions in China. As for information disclosure, there is a lack of
qualified accounting and auditing professionals. Finally, ineffective bankruptcy implementation
makes the threat and penalty for bad firm performance non-credible. What about government
regulations and government influence through state ownership? The CSRC is the counterpart of the
SEC in the US and there are state-owned asset management companies, which represent the central
government and hold a fraction of the state shares. Since the officials managing these companies are
not shareholders themselves, rather they are elected by the government, it is doubtful that they will
pursue their fiduciary role as control shareholders diligently.
C) Evidence on Financing, Investment, and Performance
In this section, we review the main results from existing research on listed firms’ financing
and investment and related activities. We first examine evidence on listed firms’ post-IPO investment
and performance. With an extensive data set on listed firms in all three exchanges, Shirai (2002) finds
that access to equity market contributes to firms’ investment during early post-IPO years, but the
degree of contribution declined quickly in subsequent years. Moreover, various performance
measures all demonstrate that post-IPO firm performance deteriorates steadily over time.25 This
finding may not be surprising given the inefficiency of the IPO process. As Aharony, Lee, and Wong
(2000) and Shirai (2002) point out, this process favors certain SOEs, in particular those in the
25 Aharony, Lee, and Wong (2000) also reports earnings decline following the IPO, while Shirai (2002) uses return on assets and equity as well as earnings per share as performance measures. Aharony, et al. (2000) also suggest that earnings management in the process of financial packaging depends on the firm's relationship with the central government and on where the securities will be listed: SOEs in unprotected industries may manage accounting accruals to boost earnings
25
“protected industries” or companies located in regions whose local government has more connections
with the decision-making bureau. These firms account for more than 40% of all listed firms, and most
of them are large companies that are also monopolistic in their respective industries. Moreover, once
listed, managers in firms with severe agency problems do not have an incentive to manage assets to
grow, but rather to rely on the external capital market to raise funds (mainly through mergers and
acquisitions, and seasoned offerings of securities) to pursue private benefits. This is possible because
financial markets are incomplete and demand for equity remains high among investors, as evidenced
by the high average P/E ratios across stocks and the high co-movement of the majority of stocks.
Second, empirical evidence reveals that the unique ownership structure in listed firms affect
firm value and share prices. Shirai (2002) and Chen, Lee, and Rui (2002) both found a significant
price discount for Class B shares held by foreign investors, as compared to Class A shares held by
domestic investors. One possible explanation of the price difference is the illiquidity of the B-share
market. However, B-shares move more closely with market fundamentals than A-shares, suggesting
that there is a premium for A-shares (due to excess demand for these shares from domestic investors)
rather than a B-share discount. A related question is how government ownership affects firm value.
To this end, Tian (2002) uses Tobin’s Q as a proxy for firm value and finds that there is a U-shaped
relationship between government ownership and firm value. For firms with low levels of state
ownership, firm value is negatively related to state ownership. This might indicate higher
government ownership is associated with a higher degree of interference with managers. But for
firms with high levels of state ownership, firm value increases with state ownership. This is perhaps
because the government has been the actual owner-manager of the firms before they became public,
and/or list those business units with temporary high profits resulting from high accounting accruals during the process of financial packaging.
26
and similarly to family-run firms, government officials may run these firms better than outside
managers because they are used to doing this.
Before we close this section, we want to stress that the current process of listing companies
fosters both a problem of adverse selection among firms seeking an IPO, and a moral hazard problem
among listed firms. As a result it may adversely affect the growth of the informal sector. The
information disclosure process, which all firms going public and all listed firms must follow, is
inefficient due to bureaucracy, fraudulent disclosure, and lack of independent auditing. This
inefficient process means that certain small, non-state-owned firms with solid growth potential do not
want to participate in the IPO process, while large and inefficient state-owned companies have strong
incentives to go public. If the government forces a transition of all firms including informal sector
firms toward the formal sector by moving toward the listing process, this forced transition is likely to
hinder the growth of the informal sector. To eliminate these problems from the formal system,
financial markets must become more complete through financial innovation, while the auditing
process must become more standard, rigorous, and efficient. In the meantime, the government must
also strengthen anti-insider trading and bankruptcy laws.
V. Evidence on the Informal Sector
Table 9 shows the growth of one type of firm in the informal sector, privately owned firms.
We can see the growth peaked during 1993 and 1994. Though the growth slowed down in the late
1990s, it remains at a very high level.
Insert Table 9 here.
In what follows we study how firms in this sector raise funds, their various growth paths, and
the informal mechanisms employed by owners that can substitute for formal corporate governance
mechanisms. Due to data limitations, much of this evidence is by necessity anecdotal.
27
A) Success Stories for Two Informal Sector Firms
WAHAHA, Co. --- Example of a Small Business with a Huge Impact26
Wahaha started in 1987 by a distributor of school supplies in the Shang Cheng District in
Hangzhou, Zhejiang Province. Its leading manager was Mr. Qinghou Zong. As a collectively-owned
company with a high school as the official owner, its only product at the time was ice cream sticks,
and the initial investment was a mere RMB 140,000 (or US$17,000). In 1989, Mr. Zong changed its
business status to an independent legal person, and changed its name to Wahaha Nutritional Food
Company. The firm’s key business innovation was to produce a soft drink with a “modern taste,”
while drawing its nutrition formula from traditional Chinese medicines. It then expanded its original
soft drink business to producing multiple nutritional drinks for children. Their success attracted large
amounts of subsequent investments: first from the Hangzhou Tin Food company (from the same city
and one of Wahaha’s main business partners), then by the Dutch multinational, Danone Inc., which
also operates in the alternative soft drink business and invested US$71.2 million and established a
joint venture with Wahaha. By 2000, Wahaha’s total sales exceeded US$65 million per year with net
profits close to US$10 million, and it had a market share of 15% of the Chinese soft drink market.
The company is still growing but to this date it remains unlisted and in the informal sector. The
“Wahaha” brand name has become a household name for children’s drinks in China, and Mr. Zong is
one of the most well known celebrities in the entire country.
STONE --- China’s Microsoft/Intel
Stone (a.k.a. “Si Tong,”) was founded in 1984 by four scientists from the Chinese Academy
of Science and Beijing’s No. 3 state-owned computer factory. Its original premises were in the
Haidian District of Beijing (which later on became known as China’s “Silicon Valley”), and it
registered as a collective enterprise. By 1986, the owners had formed three other related subsidiaries,
28
which they transformed into a holding company in 1987, and formed a joint venture with Mitsui of
Japan to manufacture word processors. In 1992, Stone listed one of its subsidiaries, SET, on the
HKSE. Soon after that, SET became the holding company with 52 subsidiaries in and outside of
China, with a trading volume (turnover) of HK$1.5 Billion in 1996. To align the interests of its
employees to those of the owners, they granted a large amount of stock and stock options to their
manager and employees, similarly to US high-tech firms in the 1990s. In 1999, Stone completed an
ownership restructuring by transferring 51% of all shares owned collectively by the Stone Group
Corp. to its management and employees.
While operating in very different industries, Wahaha and Stone had a lot in common in terms
of their paths to success. First, neither company was owned in any form by the state or local
government during any period of their development. Second, it is only when they became leaders in
their respective industries that they received attention and support from the government and gained
easy access to the external markets. The latter would have eventually happened even without the
support of the government or the investment from a particular (or a group of) foreign investor.
Thirdly, founders and managers from both companies came from the formal sector and understood
how businesses are run in the formal as well as the informal sectors.
B) Financing Channels and Governance for Firms in Two Successful Regions
WenZhou -- Village Chambers
Wenzhou, a city in the Zhejiang Province, is the home of some of the earliest and most
successful firms of the informal sector. Firms in the region are known for their keen business sense
and sharp management skills, and they often lead the informal sector in terms of innovation.
Entrepreneurs usually start their family-run businesses in townships with a similar product emphasis,
in order to have the easy access to the necessary technology, management skills, and potential clients
26 For more information, refer to the company’s website (in English): http://www.en.wahaha.com.cn/.
29
and partners. Thus we observe specialization by regions (e.g., Town A produces shoes, Town B
shirts, Town C umbrellas, etc.). During recent years certain developed areas have shifted product
emphasis from labor-intensive products such as clothes to more high-tech products, for example,
parts of radios, TVs, and computers.
There is almost no formal external financing for these firms during their early stage of
growth. What they rely on is relationship- and reputation-based financing channels. For example,
they raise funds from other entrepreneurs, their business partners including retailers, suppliers, family
and friends. Some firms also borrow from certain “private credit/lending agencies.” These lenders
usually charge very high interest rates and/or require large amount of collateral on loans, and can
force liquidation should the entrepreneurs default. These loan contracts resemble junk bonds to a
certain degree. They do not involve formal written contracts but are associated with effective
liquidation decisions. Even after the start-up firms survive the initial growth hurdle, they do not
receive loans from big, state-owned banks. Instead, they gradually form coalitions among producers
and retailers and finance each other’s growth or borrow from the entrepreneurs who can raise extra
capital. The other form of informal financing is that firms often have cross-listed accounts of credits
and debits with their business partners and other companies. These informal accounts resemble “trade
credits” in that they replace cash transactions and they are cleared periodically. They differ from
trade credits in that there are sometimes no formal written contracts and the clearing dates and
methods are often subject to renegotiation.
The other critical factor in determining success is to establish a comparative advantage in an
industry, as the failure rate for start-ups in most industries is high. Thus competition serves as one of
the effective corporate governance mechanisms. New product strategies often start with mimicking
successful or popular products. Some of these products are labor intensive while others require
skillful labors and craftsmen. Patent laws are difficult to implement so often disputes are settled
30
among the entrepreneurs themselves. To overcome this problem, some entrepreneurs expend effort
and money to ensure that the key parts of their new products are difficult to disassemble and to copy.
Another product strategy for many entrepreneurs is that they often aim at "exporting" their products
to other regions, including to foreign countries, instead of selling them locally. Very successful
entrepreneurs eventually win support from the local government, but that is often not the case when
they first start. In order to obtain the necessary support or to avoid obstruction, they need to provide
the officials with incentives, including bribes, so that the “incentive compatibility” constraints on the
officials are also satisfied.27
KUNSHAN --- Foreign Direct Investment and the Separation of Ownership and Control
Kunshan County, which is in Jiangsu province and close to Shanghai, is famous for attracting
foreign direct investment, especially from Taiwanese investors. Some of the most effective policies
have included setting up special development zones with favorable land and tax policies. For
example, in 1997, Kunshan set up a high-tech development zone, to attract foreign investment for
building factories within the zone. Enterprises, in the ownership form of joint ventures, cooperatives,
and solely owned by foreign investors, can take full advantage of a tax waiver and tax reduction for
the initial periods. Firms whose high-tech products are export-oriented can enjoy even more tax
advantages. There is a center in the special zone established by the local government.28 It acts as the
liaison between the local government, entrepreneurs, and foreign investors, and the regulator as well
as service provider for enterprises operating in the zone. Its specific tasks include contacting and
contracting with foreign investors and entrepreneurs regarding the use of land, tax policies, and so on;
collecting fees and taxes from enterprises; and providing services such as land, utility, personnel, etc.
to enterprises. Enterprises in the zone are required to report their operating and financial information
27 Che and Qian (1998a and 1998b) and Jin and Qian (1998) demonstrate that properly empowered and constrained local and community governments can substitute for corporate governance in TVEs. Bai et al. (1999) argue that information decentralization through anonymous banking can limit government’s predation of private assets.
31
to, and are regulated by the center. But they understand that the center will almost never interfere
with their internal decisions. The center’s officials are mainly from the local government. The high-
tech development zone grew very fast since its inception. From 1997 to 2001, the size of the zone
increased eight fold, and currently there are 250 firms, with a total of US$ 200 million foreign direct
investment coming from more than 20 countries and regions, in particular from Taiwan. Firms are
operating in a wide range of industries, from high-tech to clothing, and export their products to all
major markets around the world.
It is remarkable that during the early stage of the special zone, despite vague and almost non-
existent property rights, and high potential political risk, investors from Taiwan were actually willing
to commit their capital to these start-ups and refinance them whenever necessary. Actually the
reason that many investors are from Taiwan is no coincidence. Many people in Kunshan have
relatives in Taiwan and through them the investors obtained the information on the investment
opportunities. The Taiwanese investors also came to understand that although there were almost no
formal investor protection rules, local government officials have an incentive to cooperate with the
development of the special zone in attracting foreign investment, raising taxes, and creating an
economic boom in the local economy since all of these can greatly enhance their chance of being
promoted.
Another interesting phenomenon during the early stage of development was that these
investors from Taiwan did not stay in the area as they often do now, so there was virtually no
monitoring of the entrepreneurs. Hence there was complete separation of ownership and control.
What worked so well is firstly that the common goal of generating profits provides incentives for
each party to participate. Secondly, under this common goal and in a multi-period setting, implicit
contractual agreements and reputation can act as enforcement mechanisms to ensure that each party,
28 For more information, refer to this website: http://www.china-hitech.org/hitech/chinese/qiye.asp.
32
in particular the entrepreneurs and the managers, fulfill their role in the process. Since startups face
excessive risk and uncertainty, and competition from other companies, offering them discretion
instead of “holding” their hands may be the better way to ensure that entrepreneurs and managers do
what they do best, and that is to innovate and to generate new business opportunities. Finally, profit
sharing also makes it incentive compatible for officials at various levels not to hinder or disturb the
operation of the firm.
We can summarize the above examples of how firms in the informal sectors grow and receive
financing as follows. First, firms raise capital through informal channels, some of which resemble
those observed in standard firms. There are also many other informal financing channels that were
not carefully documented here. For example, privately placed bonds and loans have become more
and more popular. Some entrepreneurs obtained their initial startup capital from illegal activities such
as smuggling. Secondly, informal governance mechanisms based on reputation and implicit
contractual agreements, along with competition in the product market ensure that firms innovate and
produce effectively. Finally, profit and revenue sharing in various forms with the officials make
them cooperative in terms of implementing favorable tax and other financial policies to stimulate the
growth of the informal sector.
C) Discussion
How can these informal financing and governance mechanisms be understood? First, Greif
(1989, 1993) argues that certain traders’ organizations in the 11th century were able to overcome
problems of asymmetric information and the lack of legal and contract enforcement mechanisms,
because they had developed institutions based on reputation, implicit contractual relations and
coalitions. Certain aspects of the growth of these institutions resemble what works in China today. In
addition, Greif (1994) and Stulz and Williamson (2002) point out the importance of cultural and
religious beliefs on the development of institutions, legal origins and investor protections. These
33
factors are of particular relevance and importance to China’s development of institutions. Without a
dominant religion, one can argue that the most important force in shaping China’s social values and
institutions is the set of beliefs first developed and formalized by Kong Zi (Confucius). This set of
beliefs clearly defines family and social orders, which are very different from the western beliefs on
how legal codes should be formulated.29 Therefore, it is questionable at best to think that China
should adopt certain western models in order to reform its legal system. Moreover, if the last
argument were true, by the same argument of LLSV on how legal origin determines a country’s
financial system, it is not clear that China should adopt any model from developed countries to
develop its financial system, either.
Second, there are alternative corporate governance mechanisms that have worked well both in
developed and developing countries. Allen and Gale (2000a) show that if cooperation among
different suppliers of inputs is necessary and all suppliers benefit from the firm doing well then a
good equilibrium with no external governance is possible. Allen and Gale (2000b) argue that
competition among firms may be more effective than either the US and UK system based on the
threat of takeover, or the Japanese, French, and Germany system based on monitoring. They point
out that the success and growth of the non-profit organizations in these countries is a good example
of how alternative corporate governance systems can work well. What we see from the success and
life cycles of informal sector firms in WenZhou of China suggest that it is only those firms that have
the strongest comparative advantage in an industry (of the area) that survived and thrived. Gomes
(2000) demonstrates that a managerial reputation effect can replace formal governance in an IPO
firm. Evidence from the Chinese venture capital industry (e.g., Bruton and Ahlstrom 2002) supports
this view. Burkart, Panunzi, and Shleifer (2002) link the degree of separation of ownership and
control to different legal environments, and show that family-run firms will emerge as the dominant
29 Also see Orts (2001) and Chapters 1, 19, and 20 in Chow (2002).
34
form of ownership structure in countries with weak minority shareholder protections, whereas
professionally managed firms must be the optimal form in countries with strong investor protection.
Evidence in Claessens, Djankov and Lang (2000) and Claessens et al. (2002) suggests that family-
owned firms with very high concentration of ownership is the norm in many Asian countries outside
China and these firms have performed well. Based on surveying executives in more than 200 large
TVEs across the countries, Yu and Chen (2002) find that the ownership of the firms’ stake by
founders and top executives in these successful informal sectors firms are often very high, consistent
with findings in listed firms in other Asian countries.
Several questions arise regarding the validity of our conclusion that effective informal
mechanisms support the success of the informal sector. The first question is how long can these
informal mechanisms sustain the growth of the informal sector. While we do not dispute the
importance of well-functioning legal and financial systems, we question when and how they should
be adopted into a developing country’s existing system. It is natural to think that the growth of any
economy should have two stages: the first stage is characterized by very high growth rates and at the
same time very high volatility, and the second stage is characterized by lower growth rates but the
economy is moving toward “steady state.” Our findings provide evidence for the argument that
during the early stage it is those country-specific, non-standard mechanisms that work better and
understanding them is crucial for a smooth transition into the latter stage of growth. Tadesse (2001)
provides evidence for the argument that optimal financial architecture should suit the supporting legal
and institutional environments. Using industry-level data in 36 countries, he finds that firms in bank-
based (market-based) financial system outperform those in market-based (bank-based) system among
countries with under-developed (developed) financial and legal sectors. This again reinforces our
view that a country’s path of developing legal and financial systems should not be uniform.
35
The second question concerns whether firms in the informal sector enjoyed rapid growth
because they take advantage of the loopholes in government regulations and hence what we see is
actually a transfer of inputs and profits from the state-owned sector to the informal sector. Though
this explains the success of some firms in the informal sector, the overwhelming evidence suggests
that the growth in the entire sector cannot be simply a wealth transfer from the formal sector or else
how can we explain the overall growth of the country? Moreover, many firms in the informal sector
started and excelled in industries and products that firms in the formal sector have never operated in
and their productivity and efficiency are also much higher than those of formal sector firms. The third
question is whether the success of the informal sector in China is a special case? Due to the size of
its economy, population and potential markets, China may have a decisive advantage in attracting
foreign investment over many other smaller developing countries that also have poor legal and/or
financial systems. This is because foreign investors are more willing to bear the extra risk to invest in
Chinese firms just to enter its markets for prospective long-term profits. Our answer to this question,
which is related to the previous one, lies in the fact that many informal sector firms in China did not
use any formal financing channels or any foreign investment during their early stage of development.
While investors from Hong Kong and Taiwan did provide an important source of funding, we show
that they are willing to take on the “excessive” risk because: first, they have a good understanding (or
they know where to obtain reliable information) about the informal mechanisms as well as political
uncertainties; second, it is precisely the informal mechanisms based on reputation and implicit
contractual agreements that ensure them that the firms they invest in will have effective corporate
governance, and thus their investment does have positive NPVs despite all the uncertainties.
36
Finally, there is a growing literature studying China’s unique transition from a socialist
economy to a market-oriented economy.30 For instance, Lau, Qian, and Roland (2000) argue that the
continued enforcement of the existing planning system and liberalizing and developing financial
markets is equivalent to lump-sum transfers from the market sector to the planning sector to achieve a
Pareto improvement of the entire society. Qian (1999, 2001) argues that China’s non-standard
institutions suit this transition period in which standard mechanisms are not available, because they
provide incentives for economic agents to innovate and to compete and provide enough benefits to
those in power so that they do not preclude the reform process, and thus they are “second best.”
Finally, there is a literature arguing ambiguous property rights in the Chinese economy sometimes
pareto dominate unambiguously defined private property rights (e.g., Weitzman and Xu 1994, Li
1996, Che and Qian 1998a). These papers argue that due to institutional limitations and uncertainty of
the project, and the inability to enter contingent contracts, entrepreneurs of informal sector firms may
offer (ex ante) ambiguous property rights to government agencies or other investors and bargain with
them over actual control rights ex post. Our paper contributes to these strands of literature by
focusing on the law and finance aspect (at both the aggregate and firm levels) that has not been
studied before.
VI. Concluding Remarks
In this paper we examine and compare China’s formal systems of law and finance and the co-
existing, informal system of institutions and mechanisms, and the relation between the development
of these systems and China’s overall economic growth. With one of the largest and fastest growing
economies in the world, China differs from most of the countries studied in the law, finance, and
growth literature, and is an important counterexample to the findings in the existing literature. Its
30 Qian and Wu (2000) and Qian (2001) provide surveys of this literature.
37
legal and financial systems are both under-developed, but its economy has been growing at a very
fast rate. More importantly, the growth in the informal sector, where applicable legal and financial
mechanisms are much poorer than those in the formal sector that includes state-owned and publicly
traded companies, is much faster than that of the formal sector. We believe that the system of
informal mechanisms and institutions plays an important role in supporting the growth in the
informal sector, and they are excellent substitutes for standard corporate governance mechanisms and
financing channels.
Going forward, our results pose an important question for both researchers and policy makers:
should China also transform the informal sector toward the “standard form” like it has been doing for
the formal sector? Given the success of the informal sector and the deficiency in the formal sector,
we believe that much more research is required, in order to better understand how informal,
alternative mechanisms work where formal mechanisms are not available or not suitable. Our work
also has general implications for the literature on law, finance, and growth: there are important
factors that are not well understood. Adopting results obtained from studying developed countries to
the development of emerging countries can be misleading and counterproductive. We find that these
informal substitutes have worked well in China, and similar substitutes based on relationship and
reputation may have also worked well in other economies including developed economies. Therefore,
a better understanding of how these non-standard mechanisms work to promote growth can shed light
on alternative development paths that can benefit many other countries.
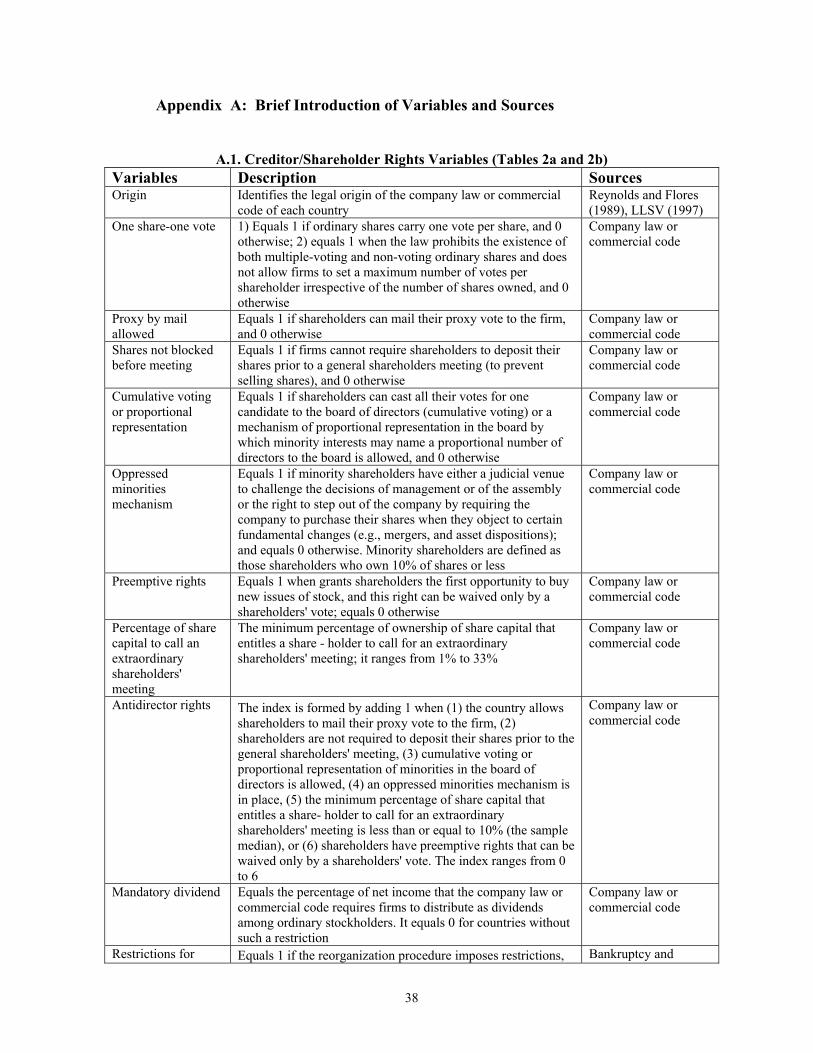
38
Appendix A: Brief Introduction of Variables and Sources
A.1. Creditor/Shareholder Rights Variables (Tables 2a and 2b)
Variables Description Sources Origin Identifies the legal origin of the company law or commercial
code of each country Reynolds and Flores (1989), LLSV (1997)
One share-one vote 1) Equals 1 if ordinary shares carry one vote per share, and 0 otherwise; 2) equals 1 when the law prohibits the existence of both multiple-voting and non-voting ordinary shares and does not allow firms to set a maximum number of votes per shareholder irrespective of the number of shares owned, and 0 otherwise
Company law or commercial code
Proxy by mail allowed
Equals 1 if shareholders can mail their proxy vote to the firm, and 0 otherwise
Company law or commercial code
Shares not blocked before meeting
Equals 1 if firms cannot require shareholders to deposit their shares prior to a general shareholders meeting (to prevent selling shares), and 0 otherwise
Company law or commercial code
Cumulative voting or proportional representation
Equals 1 if shareholders can cast all their votes for one candidate to the board of directors (cumulative voting) or a mechanism of proportional representation in the board by which minority interests may name a proportional number of directors to the board is allowed, and 0 otherwise
Company law or commercial code
Oppressed minorities mechanism
Equals 1 if minority shareholders have either a judicial venue to challenge the decisions of management or of the assembly or the right to step out of the company by requiring the company to purchase their shares when they object to certain fundamental changes (e.g., mergers, and asset dispositions); and equals 0 otherwise. Minority shareholders are defined as those shareholders who own 10% of shares or less
Company law or commercial code
Preemptive rights Equals 1 when grants shareholders the first opportunity to buy new issues of stock, and this right can be waived only by a shareholders' vote; equals 0 otherwise
Company law or commercial code
Percentage of share capital to call an extraordinary shareholders' meeting
The minimum percentage of ownership of share capital that entitles a share - holder to call for an extraordinary shareholders' meeting; it ranges from 1% to 33%
Company law or commercial code
Antidirector rights The index is formed by adding 1 when (1) the country allows shareholders to mail their proxy vote to the firm, (2) shareholders are not required to deposit their shares prior to the general shareholders' meeting, (3) cumulative voting or proportional representation of minorities in the board of directors is allowed, (4) an oppressed minorities mechanism is in place, (5) the minimum percentage of share capital that entitles a share- holder to call for an extraordinary shareholders' meeting is less than or equal to 10% (the sample median), or (6) shareholders have preemptive rights that can be waived only by a shareholders' vote. The index ranges from 0 to 6
Company law or commercial code
Mandatory dividend Equals the percentage of net income that the company law or commercial code requires firms to distribute as dividends among ordinary stockholders. It equals 0 for countries without such a restriction
Company law or commercial code
Restrictions for Equals 1 if the reorganization procedure imposes restrictions, Bankruptcy and
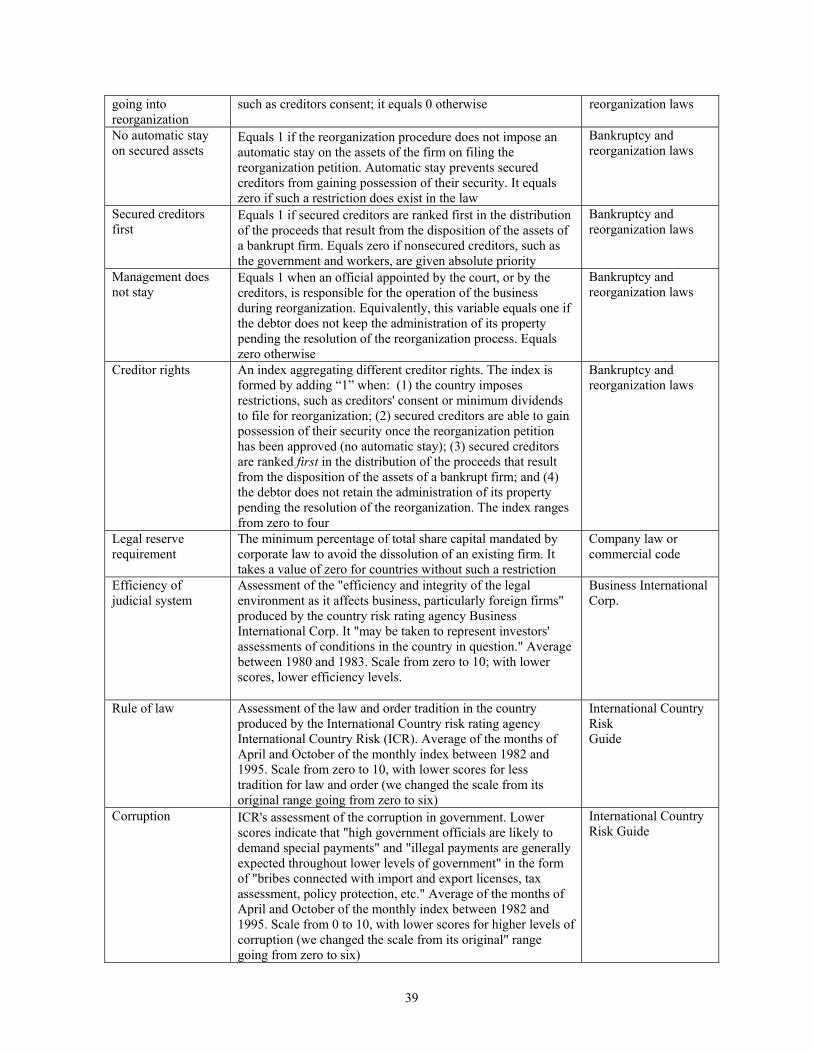
39
going into reorganization
such as creditors consent; it equals 0 otherwise reorganization laws
No automatic stay on secured assets
Equals 1 if the reorganization procedure does not impose an automatic stay on the assets of the firm on filing the reorganization petition. Automatic stay prevents secured creditors from gaining possession of their security. It equals zero if such a restriction does exist in the law
Bankruptcy and reorganization laws
Secured creditors first
Equals 1 if secured creditors are ranked first in the distribution of the proceeds that result from the disposition of the assets of a bankrupt firm. Equals zero if nonsecured creditors, such as the government and workers, are given absolute priority
Bankruptcy and reorganization laws
Management does not stay
Equals 1 when an official appointed by the court, or by the creditors, is responsible for the operation of the business during reorganization. Equivalently, this variable equals one if the debtor does not keep the administration of its property pending the resolution of the reorganization process. Equals zero otherwise
Bankruptcy and reorganization laws
Creditor rights An index aggregating different creditor rights. The index is formed by adding “1” when: (1) the country imposes restrictions, such as creditors' consent or minimum dividends to file for reorganization; (2) secured creditors are able to gain possession of their security once the reorganization petition has been approved (no automatic stay); (3) secured creditors are ranked first in the distribution of the proceeds that result from the disposition of the assets of a bankrupt firm; and (4) the debtor does not retain the administration of its property pending the resolution of the reorganization. The index ranges from zero to four
Bankruptcy and reorganization laws
Legal reserve requirement
The minimum percentage of total share capital mandated by corporate law to avoid the dissolution of an existing firm. It takes a value of zero for countries without such a restriction
Company law or commercial code
Efficiency of judicial system
Assessment of the "efficiency and integrity of the legal environment as it affects business, particularly foreign firms" produced by the country risk rating agency Business International Corp. It "may be taken to represent investors' assessments of conditions in the country in question." Average between 1980 and 1983. Scale from zero to 10; with lower scores, lower efficiency levels.
Business International Corp.
Rule of law Assessment of the law and order tradition in the country produced by the International Country risk rating agency International Country Risk (ICR). Average of the months of April and October of the monthly index between 1982 and 1995. Scale from zero to 10, with lower scores for less tradition for law and order (we changed the scale from its original range going from zero to six)
International Country Risk Guide
Corruption ICR's assessment of the corruption in government. Lower scores indicate that "high government officials are likely to demand special payments" and "illegal payments are generally expected throughout lower levels of government" in the form of "bribes connected with import and export licenses, tax assessment, policy protection, etc." Average of the months of April and October of the monthly index between 1982 and 1995. Scale from 0 to 10, with lower scores for higher levels of corruption (we changed the scale from its original" range going from zero to six)
International Country Risk Guide
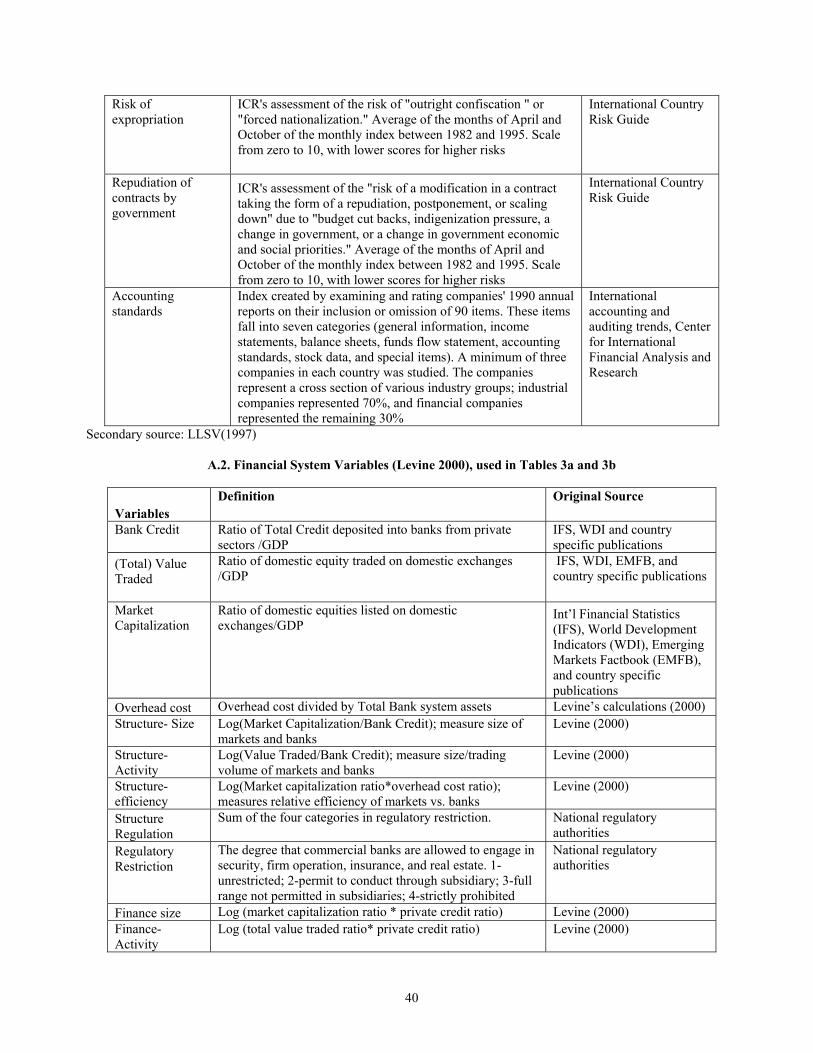
40
Risk of expropriation
ICR's assessment of the risk of "outright confiscation " or "forced nationalization." Average of the months of April and October of the monthly index between 1982 and 1995. Scale from zero to 10, with lower scores for higher risks
International Country Risk Guide
Repudiation of contracts by government
ICR's assessment of the "risk of a modification in a contract taking the form of a repudiation, postponement, or scaling down" due to "budget cut backs, indigenization pressure, a change in government, or a change in government economic and social priorities." Average of the months of April and October of the monthly index between 1982 and 1995. Scale from zero to 10, with lower scores for higher risks
International Country Risk Guide
Accounting standards
Index created by examining and rating companies' 1990 annual reports on their inclusion or omission of 90 items. These items fall into seven categories (general information, income statements, balance sheets, funds flow statement, accounting standards, stock data, and special items). A minimum of three companies in each country was studied. The companies represent a cross section of various industry groups; industrial companies represented 70%, and financial companies represented the remaining 30%
International accounting and auditing trends, Center for International Financial Analysis and Research
Secondary source: LLSV(1997)
A.2. Financial System Variables (Levine 2000), used in Tables 3a and 3b
Variables Definition Original Source
Bank Credit Ratio of Total Credit deposited into banks from private sectors /GDP
IFS, WDI and country specific publications
(Total) Value Traded
Ratio of domestic equity traded on domestic exchanges /GDP
IFS, WDI, EMFB, and country specific publications
Market Capitalization
Ratio of domestic equities listed on domestic exchanges/GDP
Int’l Financial Statistics (IFS), World Development Indicators (WDI), Emerging Markets Factbook (EMFB), and country specific publications
Overhead cost Overhead cost divided by Total Bank system assets Levine’s calculations (2000) Structure- Size Log(Market Capitalization/Bank Credit); measure size of
markets and banks Levine (2000)
Structure-Activity
Log(Value Traded/Bank Credit); measure size/trading volume of markets and banks
Levine (2000)
Structure-efficiency
Log(Market capitalization ratio*overhead cost ratio); measures relative efficiency of markets vs. banks
Levine (2000)
Structure Regulation
Sum of the four categories in regulatory restriction. National regulatory authorities
Regulatory Restriction
The degree that commercial banks are allowed to engage in security, firm operation, insurance, and real estate. 1- unrestricted; 2-permit to conduct through subsidiary; 3-full range not permitted in subsidiaries; 4-strictly prohibited
National regulatory authorities
Finance size Log (market capitalization ratio * private credit ratio) Levine (2000) Finance-Activity
Log (total value traded ratio* private credit ratio) Levine (2000)
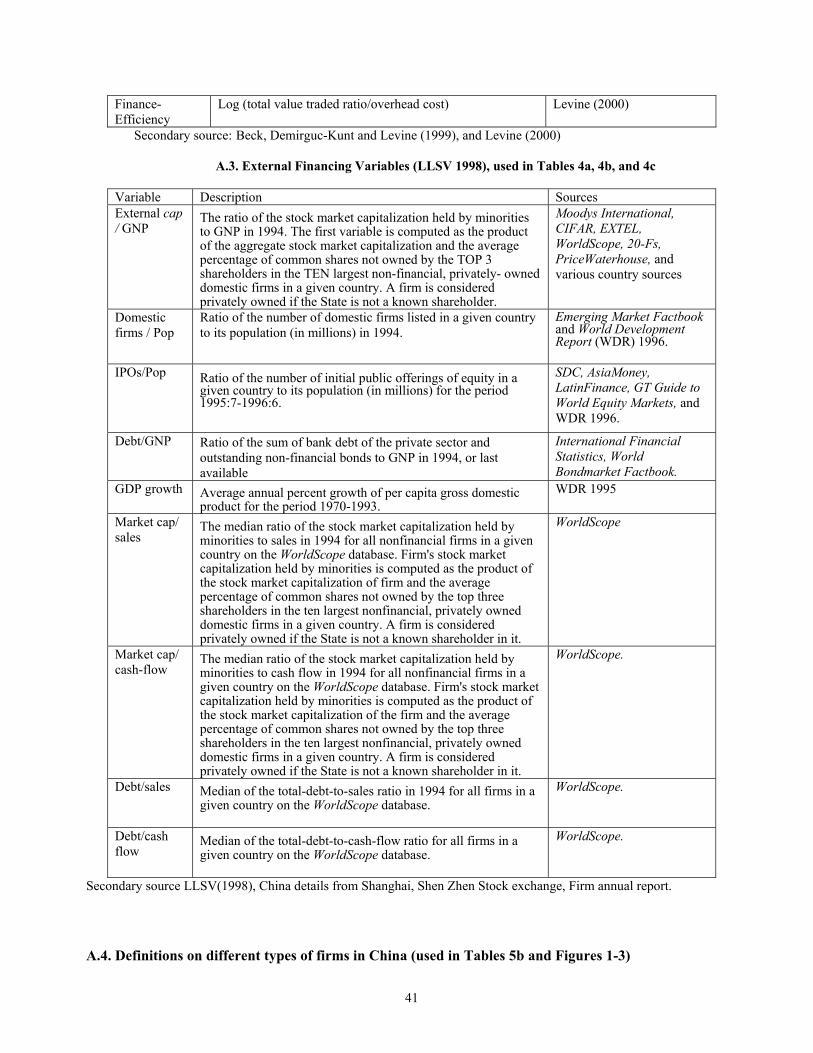
41
Finance-Efficiency
Log (total value traded ratio/overhead cost) Levine (2000)
Secondary source: Beck, Demirguc-Kunt and Levine (1999), and Levine (2000)
A.3. External Financing Variables (LLSV 1998), used in Tables 4a, 4b, and 4c
Variable Description Sources External cap / GNP
The ratio of the stock market capitalization held by minorities to GNP in 1994. The first variable is computed as the product of the aggregate stock market capitalization and the average percentage of common shares not owned by the TOP 3 shareholders in the TEN largest non-financial, privately- owned domestic firms in a given country. A firm is considered privately owned if the State is not a known shareholder.
Moodys International, CIFAR, EXTEL, WorldScope, 20-Fs, PriceWaterhouse, and various country sources
Domestic firms / Pop
Ratio of the number of domestic firms listed in a given country to its population (in millions) in 1994.
Emerging Market Factbook and World Development Report (WDR) 1996.
IPOs/Pop Ratio of the number of initial public offerings of equity in a given country to its population (in millions) for the period 1995:7-1996:6.
SDC, AsiaMoney, LatinFinance, GT Guide to World Equity Markets, and WDR 1996.
Debt/GNP Ratio of the sum of bank debt of the private sector and outstanding non-financial bonds to GNP in 1994, or last available
International Financial Statistics, World Bondmarket Factbook.
GDP growth Average annual percent growth of per capita gross domestic product for the period 1970-1993.
WDR 1995
Market cap/ sales
The median ratio of the stock market capitalization held by minorities to sales in 1994 for all nonfinancial firms in a given country on the WorldScope database. Firm's stock market capitalization held by minorities is computed as the product of the stock market capitalization of firm and the average percentage of common shares not owned by the top three shareholders in the ten largest nonfinancial, privately owned domestic firms in a given country. A firm is considered privately owned if the State is not a known shareholder in it.
WorldScope
Market cap/ cash-flow
The median ratio of the stock market capitalization held by minorities to cash flow in 1994 for all nonfinancial firms in a given country on the WorldScope database. Firm's stock market capitalization held by minorities is computed as the product of the stock market capitalization of the firm and the average percentage of common shares not owned by the top three shareholders in the ten largest nonfinancial, privately owned domestic firms in a given country. A firm is considered privately owned if the State is not a known shareholder in it.
WorldScope.
Debt/sales Median of the total-debt-to-sales ratio in 1994 for all firms in a given country on the WorldScope database.
WorldScope.
Debt/cash flow
Median of the total-debt-to-cash-flow ratio for all firms in a given country on the WorldScope database.
WorldScope.
Secondary source LLSV(1998), China details from Shanghai, Shen Zhen Stock exchange, Firm annual report.
A.4. Definitions on different types of firms in China (used in Tables 5b and Figures 1-3)

42
1. State-owned Enterprises: Non-corporation economic units where the entire assets are owned by the state and
which have registered in accordance with the "regulation of the People's Republic of China on the Management of Registration of Corporate Enterprises." Excluded from this category are the sole state funded corporations in the limited liability corporation. Note: The government is the de facto owner, and they choose managers to run the firm. Even though these firms do enter the credit plan, but this process is constructed and enforced by state banks, which are also under the control of the government.
2. Collective-Owned Enterprises: Economic units where the assets are owned collectively and which have
registered in accordance with the "Regulation of the People's Republic of China on the management of registration of corporate Enterprise. Note: Local government can be regarded as the agent of central government. Therefore, any firm owned by local government is also owned by central government. Collective ownership here means the community in the city or rural area joins the ownership.
3. Township-village Enterprises (TVEs): Enterprises and economic units located in rural areas, collectively-
owned or with most of investment from residents in these rural areas. An enterprise in a rural area is legally registered as a TVE where rural communities or residents invest more than 50% of the firm’s total assets or act as the control owners in the operation of enterprise. Note: There can be firms that are both collectively-owned and TVEs, as long as they are in the rural areas and have more than 50% of total assets coming from residents from the same rural area/county. The difference is that TVEs are all located in rural areas while collectively-owned firms can be in cities; while TVEs can be solely owned by residents of that rural area and the local government has no ownership nor control over the firm.
4. Jointly-owned firms: Economic Units established by two or more corporate enterprises or institutions of the
same or different ownership, through joint investment on the basis of equality, voluntary participation and mutual benefits. They include state joint ownership enterprises, collective joint ownership enterprises, joint state-collective enterprise, and other joint ownership. Note: Enterprise involved with foreign investment/ownership is not in this category. They are in the Category of "Enterprise with Foreign investment, which has 3 different types.
5. Share-holding Corporations Ltd: Economic units registered in accordance with the "Regulation of the
People's Republic of China on the management of Corporations", with total registered capitals divided into equal shares and raised through issuing stocks. Each investor bears limited liability to the corporation depending on the holding of shares, and the corporation bears liability to its debt to the maximum of its total assets. Note: The above is essentially the same definition of US public companies, but these Chinese companies have non-tradable shares that are the by-product of the reforming process.
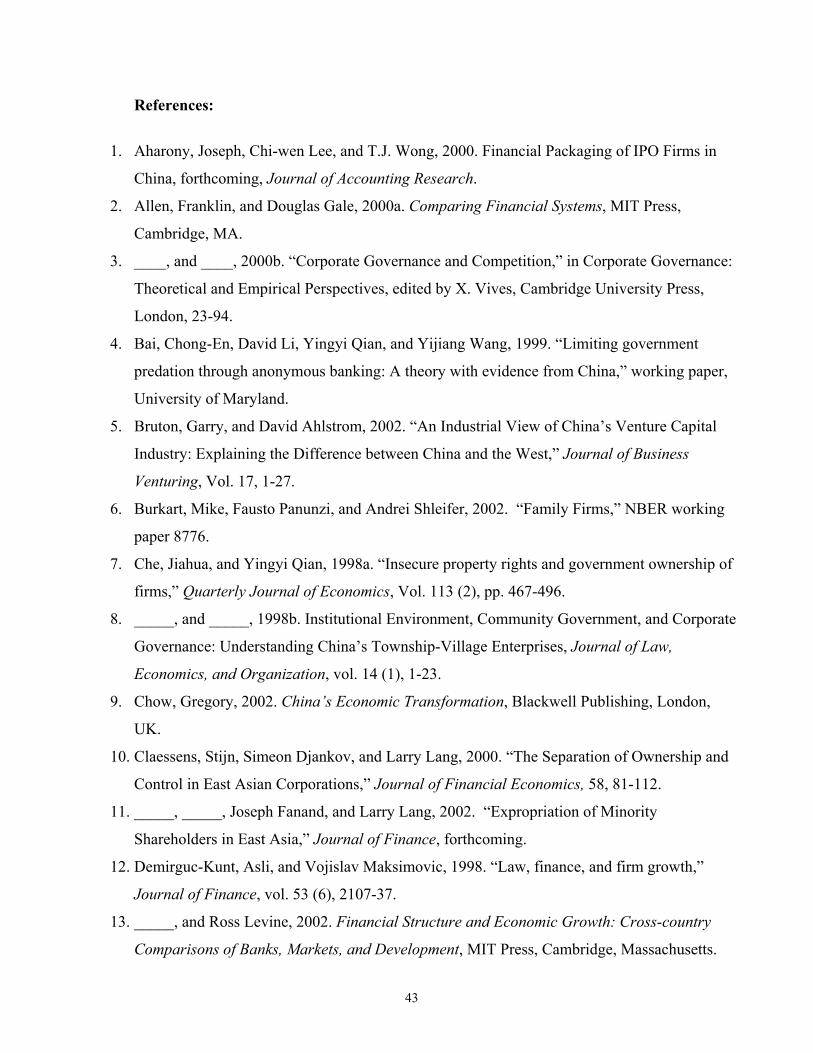
43
References:
1. Aharony, Joseph, Chi-wen Lee, and T.J. Wong, 2000. Financial Packaging of IPO Firms in
China, forthcoming, Journal of Accounting Research.
2. Allen, Franklin, and Douglas Gale, 2000a. Comparing Financial Systems, MIT Press,
Cambridge, MA.
3. ____, and ____, 2000b. “Corporate Governance and Competition,” in Corporate Governance:
Theoretical and Empirical Perspectives, edited by X. Vives, Cambridge University Press,
London, 23-94.
4. Bai, Chong-En, David Li, Yingyi Qian, and Yijiang Wang, 1999. “Limiting government
predation through anonymous banking: A theory with evidence from China,” working paper,
University of Maryland.
5. Bruton, Garry, and David Ahlstrom, 2002. “An Industrial View of China’s Venture Capital
Industry: Explaining the Difference between China and the West,” Journal of Business
Venturing, Vol. 17, 1-27.
6. Burkart, Mike, Fausto Panunzi, and Andrei Shleifer, 2002. “Family Firms,” NBER working
paper 8776.
7. Che, Jiahua, and Yingyi Qian, 1998a. “Insecure property rights and government ownership of
firms,” Quarterly Journal of Economics, Vol. 113 (2), pp. 467-496.
8. _____, and _____, 1998b. Institutional Environment, Community Government, and Corporate
Governance: Understanding China’s Township-Village Enterprises, Journal of Law,
Economics, and Organization, vol. 14 (1), 1-23.
9. Chow, Gregory, 2002. China’s Economic Transformation, Blackwell Publishing, London,
UK.
10. Claessens, Stijn, Simeon Djankov, and Larry Lang, 2000. “The Separation of Ownership and
Control in East Asian Corporations,” Journal of Financial Economics, 58, 81-112.
11. _____, _____, Joseph Fanand, and Larry Lang, 2002. “Expropriation of Minority
Shareholders in East Asia,” Journal of Finance, forthcoming.
12. Demirguc-Kunt, Asli, and Vojislav Maksimovic, 1998. “Law, finance, and firm growth,”
Journal of Finance, vol. 53 (6), 2107-37.
13. _____, and Ross Levine, 2002. Financial Structure and Economic Growth: Cross-country
Comparisons of Banks, Markets, and Development, MIT Press, Cambridge, Massachusetts.
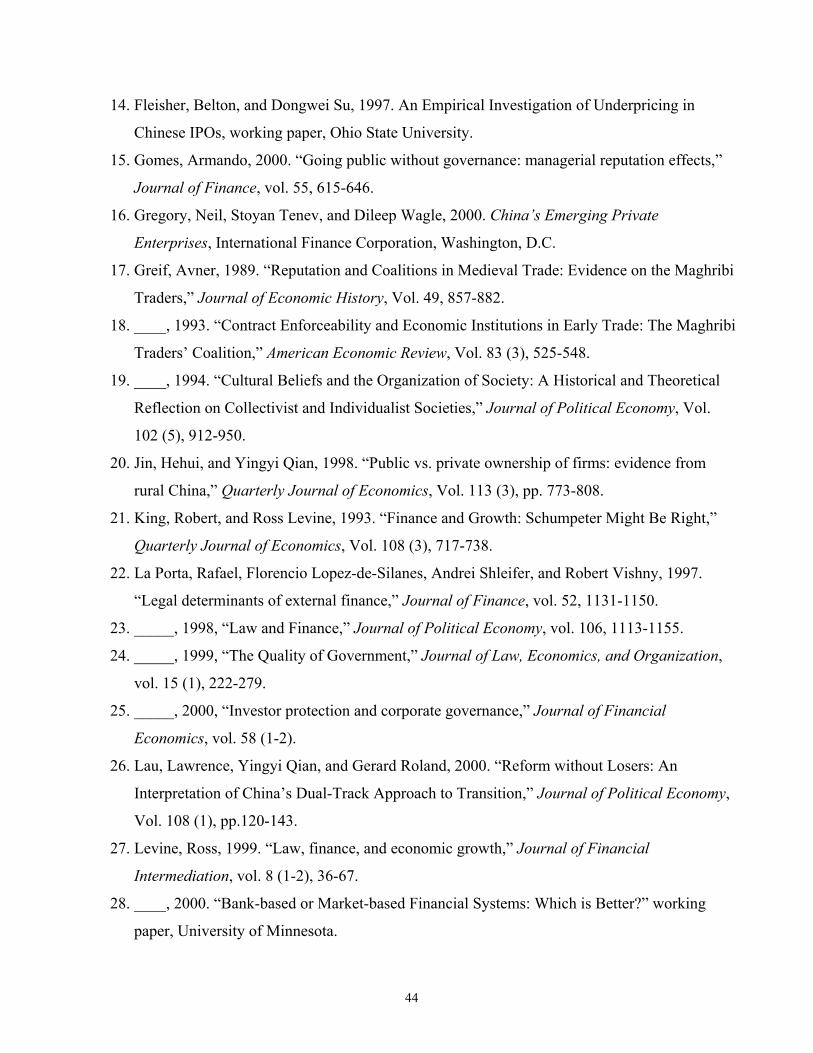
44
14. Fleisher, Belton, and Dongwei Su, 1997. An Empirical Investigation of Underpricing in
Chinese IPOs, working paper, Ohio State University.
15. Gomes, Armando, 2000. “Going public without governance: managerial reputation effects,”
Journal of Finance, vol. 55, 615-646.
16. Gregory, Neil, Stoyan Tenev, and Dileep Wagle, 2000. China’s Emerging Private
Enterprises, International Finance Corporation, Washington, D.C.
17. Greif, Avner, 1989. “Reputation and Coalitions in Medieval Trade: Evidence on the Maghribi
Traders,” Journal of Economic History, Vol. 49, 857-882.
18. ____, 1993. “Contract Enforceability and Economic Institutions in Early Trade: The Maghribi
Traders’ Coalition,” American Economic Review, Vol. 83 (3), 525-548.
19. ____, 1994. “Cultural Beliefs and the Organization of Society: A Historical and Theoretical
Reflection on Collectivist and Individualist Societies,” Journal of Political Economy, Vol.
102 (5), 912-950.
20. Jin, Hehui, and Yingyi Qian, 1998. “Public vs. private ownership of firms: evidence from
rural China,” Quarterly Journal of Economics, Vol. 113 (3), pp. 773-808.
21. King, Robert, and Ross Levine, 1993. “Finance and Growth: Schumpeter Might Be Right,”
Quarterly Journal of Economics, Vol. 108 (3), 717-738.
22. La Porta, Rafael, Florencio Lopez-de-Silanes, Andrei Shleifer, and Robert Vishny, 1997.
“Legal determinants of external finance,” Journal of Finance, vol. 52, 1131-1150.
23. _____, 1998, “Law and Finance,” Journal of Political Economy, vol. 106, 1113-1155.
24. _____, 1999, “The Quality of Government,” Journal of Law, Economics, and Organization,
vol. 15 (1), 222-279.
25. _____, 2000, “Investor protection and corporate governance,” Journal of Financial
Economics, vol. 58 (1-2).
26. Lau, Lawrence, Yingyi Qian, and Gerard Roland, 2000. “Reform without Losers: An
Interpretation of China’s Dual-Track Approach to Transition,” Journal of Political Economy,
Vol. 108 (1), pp.120-143.
27. Levine, Ross, 1999. “Law, finance, and economic growth,” Journal of Financial
Intermediation, vol. 8 (1-2), 36-67.
28. ____, 2000. “Bank-based or Market-based Financial Systems: Which is Better?” working
paper, University of Minnesota.
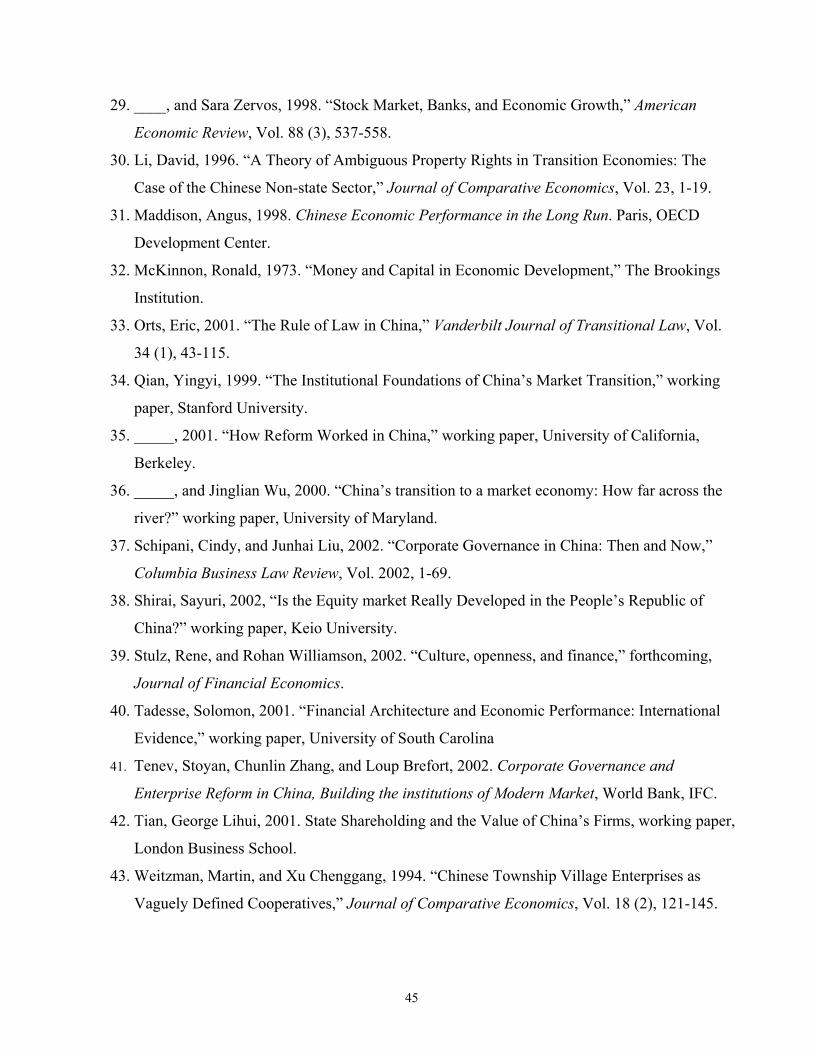
45
29. ____, and Sara Zervos, 1998. “Stock Market, Banks, and Economic Growth,” American
Economic Review, Vol. 88 (3), 537-558.
30. Li, David, 1996. “A Theory of Ambiguous Property Rights in Transition Economies: The
Case of the Chinese Non-state Sector,” Journal of Comparative Economics, Vol. 23, 1-19.
31. Maddison, Angus, 1998. Chinese Economic Performance in the Long Run. Paris, OECD
Development Center.
32. McKinnon, Ronald, 1973. “Money and Capital in Economic Development,” The Brookings
Institution.
33. Orts, Eric, 2001. “The Rule of Law in China,” Vanderbilt Journal of Transitional Law, Vol.
34 (1), 43-115.
34. Qian, Yingyi, 1999. “The Institutional Foundations of China’s Market Transition,” working
paper, Stanford University.
35. _____, 2001. “How Reform Worked in China,” working paper, University of California,
Berkeley.
36. _____, and Jinglian Wu, 2000. “China’s transition to a market economy: How far across the
river?” working paper, University of Maryland.
37. Schipani, Cindy, and Junhai Liu, 2002. “Corporate Governance in China: Then and Now,”
Columbia Business Law Review, Vol. 2002, 1-69.
38. Shirai, Sayuri, 2002, “Is the Equity market Really Developed in the People’s Republic of
China?” working paper, Keio University.
39. Stulz, Rene, and Rohan Williamson, 2002. “Culture, openness, and finance,” forthcoming,
Journal of Financial Economics.
40. Tadesse, Solomon, 2001. “Financial Architecture and Economic Performance: International
Evidence,” working paper, University of South Carolina
41. Tenev, Stoyan, Chunlin Zhang, and Loup Brefort, 2002. Corporate Governance and
Enterprise Reform in China, Building the institutions of Modern Market, World Bank, IFC.
42. Tian, George Lihui, 2001. State Shareholding and the Value of China’s Firms, working paper,
London Business School.
43. Weitzman, Martin, and Xu Chenggang, 1994. “Chinese Township Village Enterprises as
Vaguely Defined Cooperatives,” Journal of Comparative Economics, Vol. 18 (2), 121-145.
46
44. Xiang, Bing, 1998. “Institutional factors influencing China’s accounting reforms and
standards,” Accounting Horizons. Pages??
45. Yu, Qiao, and Jianbo Chen, 2002. “Investment Patterns of Firms in an Emerging Market:
Evidence from China,” working paper, Fudan University.
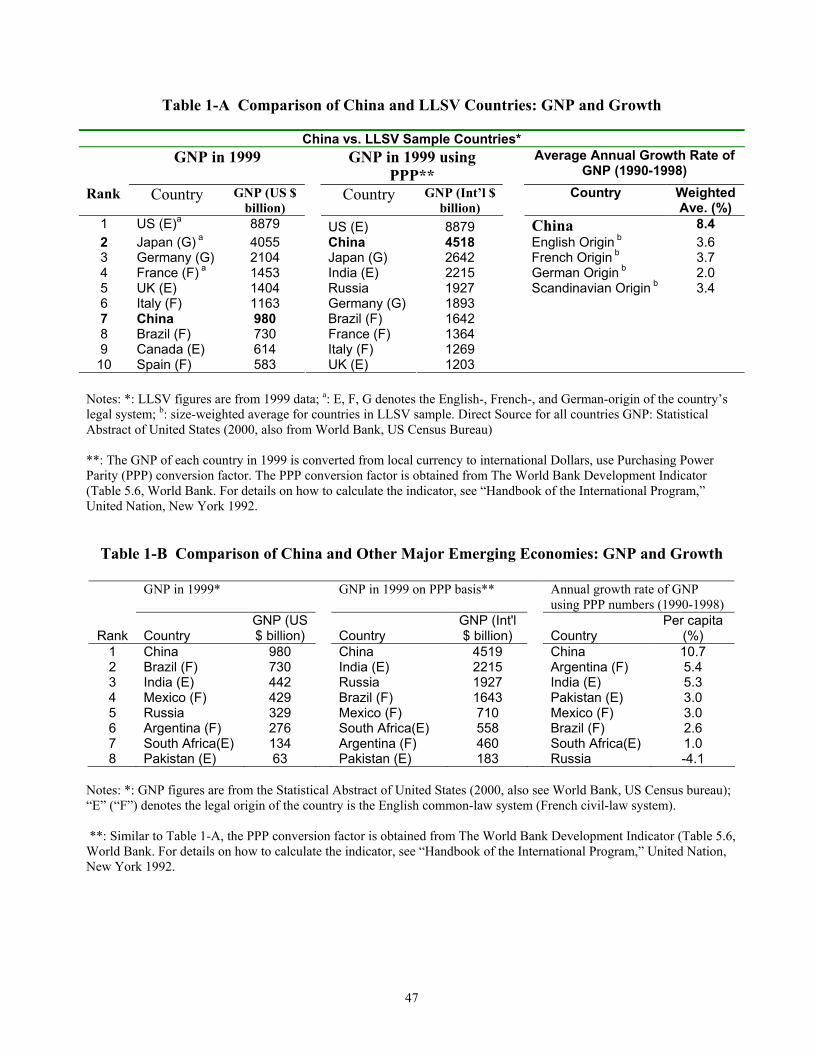
47
Table 1-A Comparison of China and LLSV Countries: GNP and Growth
China vs. LLSV Sample Countries* GNP in 1999 GNP in 1999 using
PPP** Average Annual Growth Rate of
GNP (1990-1998)
Rank Country GNP (US $ billion)
Country GNP (Int’l $ billion)
Country Weighted Ave. (%)
1 US (E)a 8879 US (E) 8879 China 8.4 2 Japan (G) a 4055 China 4518 English Origin b 3.6 3 Germany (G) 2104 Japan (G) 2642 French Origin b 3.7 4 France (F) a 1453 India (E) 2215 German Origin b 2.0 5 UK (E) 1404 Russia 1927 Scandinavian Origin b 3.4 6 Italy (F) 1163 Germany (G) 1893 7 China 980 Brazil (F) 1642 8 Brazil (F) 730 France (F) 1364 9 Canada (E) 614 Italy (F) 1269 10 Spain (F) 583
UK (E) 1203
Notes: *: LLSV figures are from 1999 data; a: E, F, G denotes the English-, French-, and German-origin of the country’s legal system; b: size-weighted average for countries in LLSV sample. Direct Source for all countries GNP: Statistical Abstract of United States (2000, also from World Bank, US Census Bureau) **: The GNP of each country in 1999 is converted from local currency to international Dollars, use Purchasing Power Parity (PPP) conversion factor. The PPP conversion factor is obtained from The World Bank Development Indicator (Table 5.6, World Bank. For details on how to calculate the indicator, see “Handbook of the International Program,” United Nation, New York 1992.
Table 1-B Comparison of China and Other Major Emerging Economies: GNP and Growth
GNP in 1999* GNP in 1999 on PPP basis** Annual growth rate of GNP using PPP numbers (1990-1998)
Rank Country GNP (US $ billion)
Country
GNP (Int'l $ billion)
Country
Per capita (%)
1 China 980 China 4519 China 10.7 2 Brazil (F) 730 India (E) 2215 Argentina (F) 5.4 3 India (E) 442 Russia 1927 India (E) 5.3 4 Mexico (F) 429 Brazil (F) 1643 Pakistan (E) 3.0 5 Russia 329 Mexico (F) 710 Mexico (F) 3.0 6 Argentina (F) 276 South Africa(E) 558 Brazil (F) 2.6 7 South Africa(E) 134 Argentina (F) 460 South Africa(E) 1.0 8 Pakistan (E) 63 Pakistan (E) 183 Russia -4.1
Notes: *: GNP figures are from the Statistical Abstract of United States (2000, also see World Bank, US Census bureau); “E” (“F”) denotes the legal origin of the country is the English common-law system (French civil-law system). **: Similar to Table 1-A, the PPP conversion factor is obtained from The World Bank Development Indicator (Table 5.6, World Bank. For details on how to calculate the indicator, see “Handbook of the International Program,” United Nation, New York 1992.
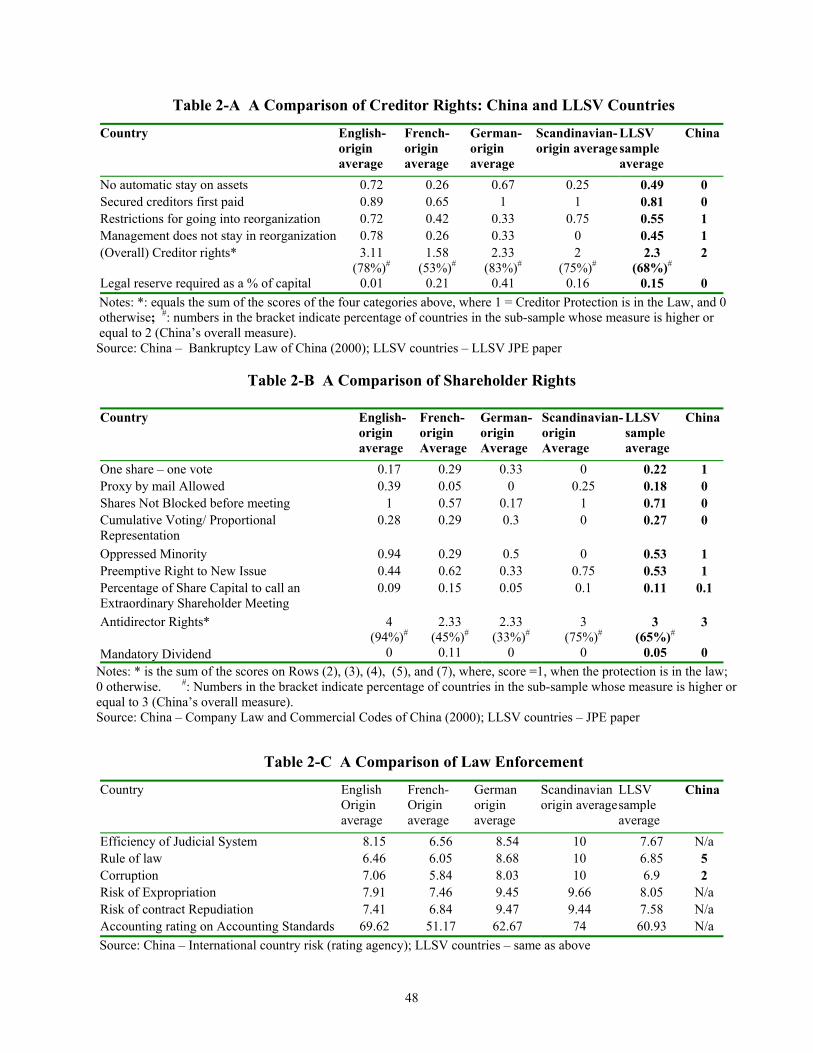
48
Table 2-A A Comparison of Creditor Rights: China and LLSV Countries
Country English-origin average
French-origin average
German-origin average
Scandinavian-origin average
LLSV sample average
China
No automatic stay on assets 0.72 0.26 0.67 0.25 0.49 0 Secured creditors first paid 0.89 0.65 1 1 0.81 0 Restrictions for going into reorganization 0.72 0.42 0.33 0.75 0.55 1 Management does not stay in reorganization 0.78 0.26 0.33 0 0.45 1 (Overall) Creditor rights* 3.11
(78%)# 1.58
(53%)# 2.33
(83%)# 2
(75%)# 2.3
(68%)# 2
Legal reserve required as a % of capital 0.01 0.21 0.41 0.16 0.15 0 Notes: *: equals the sum of the scores of the four categories above, where 1 = Creditor Protection is in the Law, and 0 otherwise; #: numbers in the bracket indicate percentage of countries in the sub-sample whose measure is higher or equal to 2 (China’s overall measure).
Source: China – Bankruptcy Law of China (2000); LLSV countries – LLSV JPE paper
Table 2-B A Comparison of Shareholder Rights
Country English-origin average
French- origin Average
German- origin Average
Scandinavian- origin Average
LLSV sample average
China
One share – one vote 0.17 0.29 0.33 0 0.22 1 Proxy by mail Allowed 0.39 0.05 0 0.25 0.18 0 Shares Not Blocked before meeting 1 0.57 0.17 1 0.71 0 Cumulative Voting/ Proportional Representation
0.28 0.29 0.3 0 0.27 0
Oppressed Minority 0.94 0.29 0.5 0 0.53 1 Preemptive Right to New Issue 0.44 0.62 0.33 0.75 0.53 1 Percentage of Share Capital to call an Extraordinary Shareholder Meeting
0.09 0.15 0.05 0.1 0.11 0.1
Antidirector Rights* 4 (94%)#
2.33 (45%)#
2.33 (33%)#
3 (75%)#
3 (65%)#
3
Mandatory Dividend 0 0.11 0 0 0.05 0 Notes: * is the sum of the scores on Rows (2), (3), (4), (5), and (7), where, score =1, when the protection is in the law; 0 otherwise. #: Numbers in the bracket indicate percentage of countries in the sub-sample whose measure is higher or equal to 3 (China’s overall measure). Source: China – Company Law and Commercial Codes of China (2000); LLSV countries – JPE paper
Table 2-C A Comparison of Law Enforcement
Country English Origin average
French-Origin average
German origin average
Scandinavian origin average
LLSV sample average
China
Efficiency of Judicial System 8.15 6.56 8.54 10 7.67 N/a Rule of law 6.46 6.05 8.68 10 6.85 5 Corruption 7.06 5.84 8.03 10 6.9 2 Risk of Expropriation 7.91 7.46 9.45 9.66 8.05 N/a Risk of contract Repudiation 7.41 6.84 9.47 9.44 7.58 N/a Accounting rating on Accounting Standards 69.62 51.17 62.67 74 60.93 N/a
Source: China – International country risk (rating agency); LLSV countries – same as above
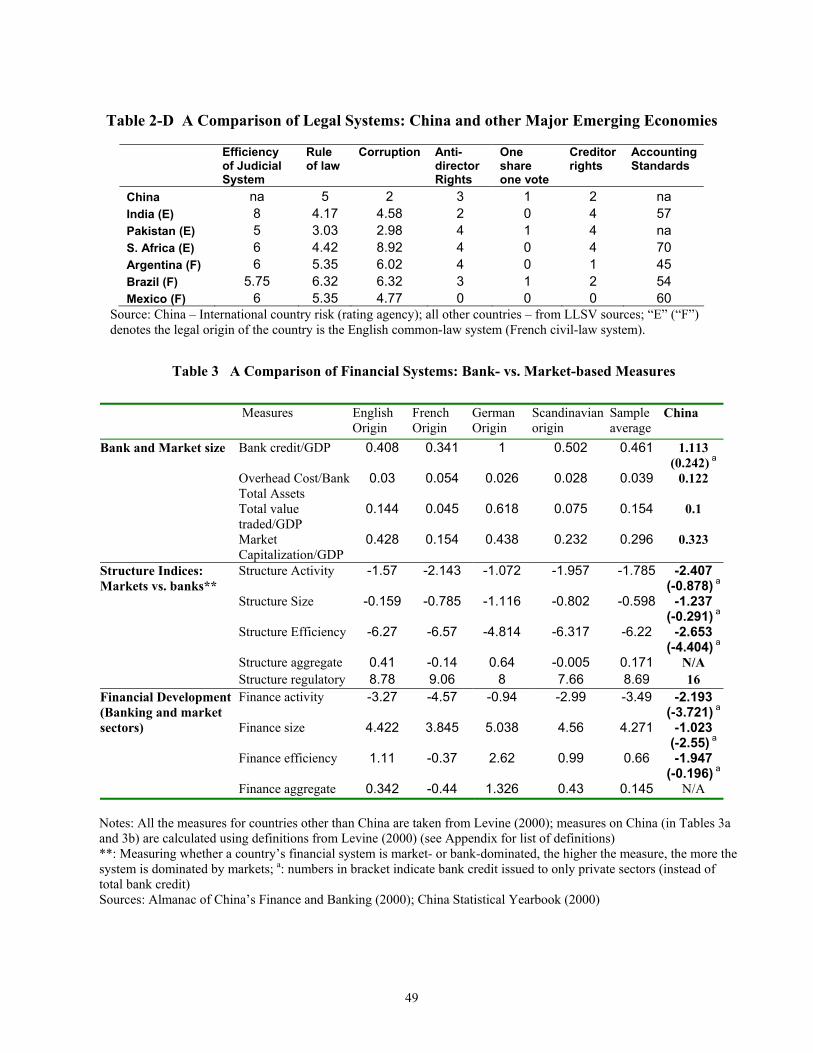
49
Table 2-D A Comparison of Legal Systems: China and other Major Emerging Economies
Efficiency of Judicial System
Rule of law
Corruption
Anti-director Rights
One share one vote
Creditor rights
Accounting Standards
China na 5 2 3 1 2 na India (E) 8 4.17 4.58 2 0 4 57 Pakistan (E) 5 3.03 2.98 4 1 4 na S. Africa (E) 6 4.42 8.92 4 0 4 70 Argentina (F) 6 5.35 6.02 4 0 1 45 Brazil (F) 5.75 6.32 6.32 3 1 2 54 Mexico (F) 6 5.35 4.77 0 0 0 60
Source: China – International country risk (rating agency); all other countries – from LLSV sources; “E” (“F”) denotes the legal origin of the country is the English common-law system (French civil-law system).
Table 3 A Comparison of Financial Systems: Bank- vs. Market-based Measures
Measures English Origin
French Origin
German Origin
Scandinavian origin
Sample average
China
Bank credit/GDP 0.408 0.341 1 0.502 0.461 1.113 (0.242) a
Overhead Cost/Bank Total Assets
0.03 0.054 0.026 0.028 0.039 0.122
Total value traded/GDP
0.144 0.045 0.618 0.075 0.154 0.1
Bank and Market size
Market Capitalization/GDP
0.428 0.154 0.438 0.232 0.296 0.323
Structure Activity -1.57 -2.143 -1.072 -1.957 -1.785 -2.407 (-0.878) a
Structure Size -0.159 -0.785 -1.116 -0.802 -0.598 -1.237 (-0.291) a
Structure Efficiency -6.27 -6.57 -4.814 -6.317 -6.22 -2.653 (-4.404) a
Structure aggregate 0.41 -0.14 0.64 -0.005 0.171 N/A
Structure Indices: Markets vs. banks**
Structure regulatory 8.78 9.06 8 7.66 8.69 16 Finance activity -3.27 -4.57 -0.94 -2.99 -3.49 -2.193
(-3.721) a
Finance size 4.422 3.845 5.038 4.56 4.271 -1.023 (-2.55) a
Finance efficiency 1.11 -0.37 2.62 0.99 0.66 -1.947 (-0.196) a
Financial Development (Banking and market sectors)
Finance aggregate 0.342 -0.44 1.326 0.43 0.145 N/A
Notes: All the measures for countries other than China are taken from Levine (2000); measures on China (in Tables 3a and 3b) are calculated using definitions from Levine (2000) (see Appendix for list of definitions) **: Measuring whether a country’s financial system is market- or bank-dominated, the higher the measure, the more the system is dominated by markets; a: numbers in bracket indicate bank credit issued to only private sectors (instead of total bank credit) Sources: Almanac of China’s Finance and Banking (2000); China Statistical Yearbook (2000)
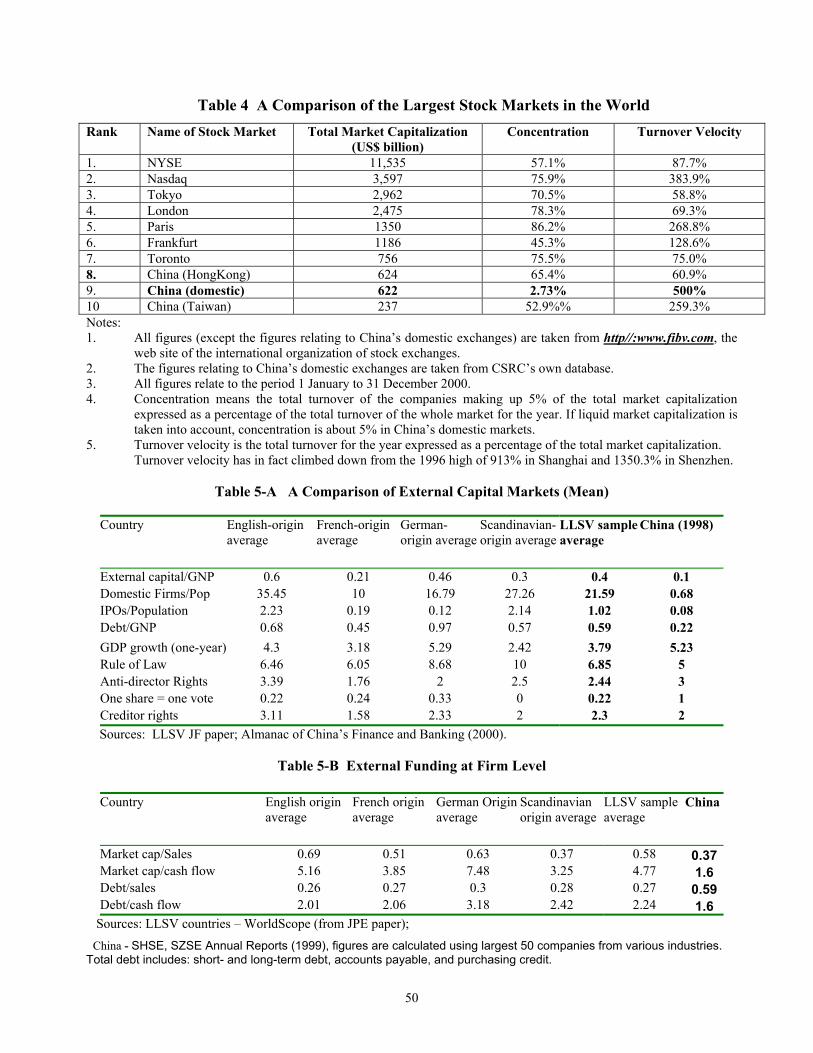
50
Table 4 A Comparison of the Largest Stock Markets in the World Rank Name of Stock Market Total Market Capitalization
(US$ billion) Concentration
Turnover Velocity
1. NYSE 11,535 57.1% 87.7% 2. Nasdaq 3,597 75.9% 383.9% 3. Tokyo 2,962 70.5% 58.8% 4. London 2,475 78.3% 69.3% 5. Paris 1350 86.2% 268.8% 6. Frankfurt 1186 45.3% 128.6% 7. Toronto 756 75.5% 75.0% 8. China (HongKong) 624 65.4% 60.9% 9. China (domestic) 622 2.73% 500% 10 China (Taiwan) 237 52.9%% 259.3% Notes: 1. All figures (except the figures relating to China’s domestic exchanges) are taken from http//:www.fibv.com, the
web site of the international organization of stock exchanges. 2. The figures relating to China’s domestic exchanges are taken from CSRC’s own database. 3. All figures relate to the period 1 January to 31 December 2000. 4. Concentration means the total turnover of the companies making up 5% of the total market capitalization
expressed as a percentage of the total turnover of the whole market for the year. If liquid market capitalization is taken into account, concentration is about 5% in China’s domestic markets.
5. Turnover velocity is the total turnover for the year expressed as a percentage of the total market capitalization. Turnover velocity has in fact climbed down from the 1996 high of 913% in Shanghai and 1350.3% in Shenzhen.
Table 5-A A Comparison of External Capital Markets (Mean)
Country English-origin
average French-origin average
German- origin average
Scandinavian- origin average
LLSV sample average
China (1998)
External capital/GNP 0.6 0.21 0.46 0.3 0.4 0.1 Domestic Firms/Pop 35.45 10 16.79 27.26 21.59 0.68 IPOs/Population 2.23 0.19 0.12 2.14 1.02 0.08 Debt/GNP 0.68 0.45 0.97 0.57 0.59 0.22 GDP growth (one-year) 4.3 3.18 5.29 2.42 3.79 5.23 Rule of Law 6.46 6.05 8.68 10 6.85 5 Anti-director Rights 3.39 1.76 2 2.5 2.44 3 One share = one vote 0.22 0.24 0.33 0 0.22 1 Creditor rights 3.11 1.58 2.33 2 2.3 2
Sources: LLSV JF paper; Almanac of China’s Finance and Banking (2000).
Table 5-B External Funding at Firm Level
Country English origin average
French origin average
German Origin average
Scandinavian origin average
LLSV sample average
China
Market cap/Sales 0.69 0.51 0.63 0.37 0.58 0.37Market cap/cash flow 5.16 3.85 7.48 3.25 4.77 1.6 Debt/sales 0.26 0.27 0.3 0.28 0.27 0.59Debt/cash flow 2.01 2.06 3.18 2.42 2.24 1.6
Sources: LLSV countries – WorldScope (from JPE paper); China - SHSE, SZSE Annual Reports (1999), figures are calculated using largest 50 companies from various industries. Total debt includes: short- and long-term debt, accounts payable, and purchasing credit.
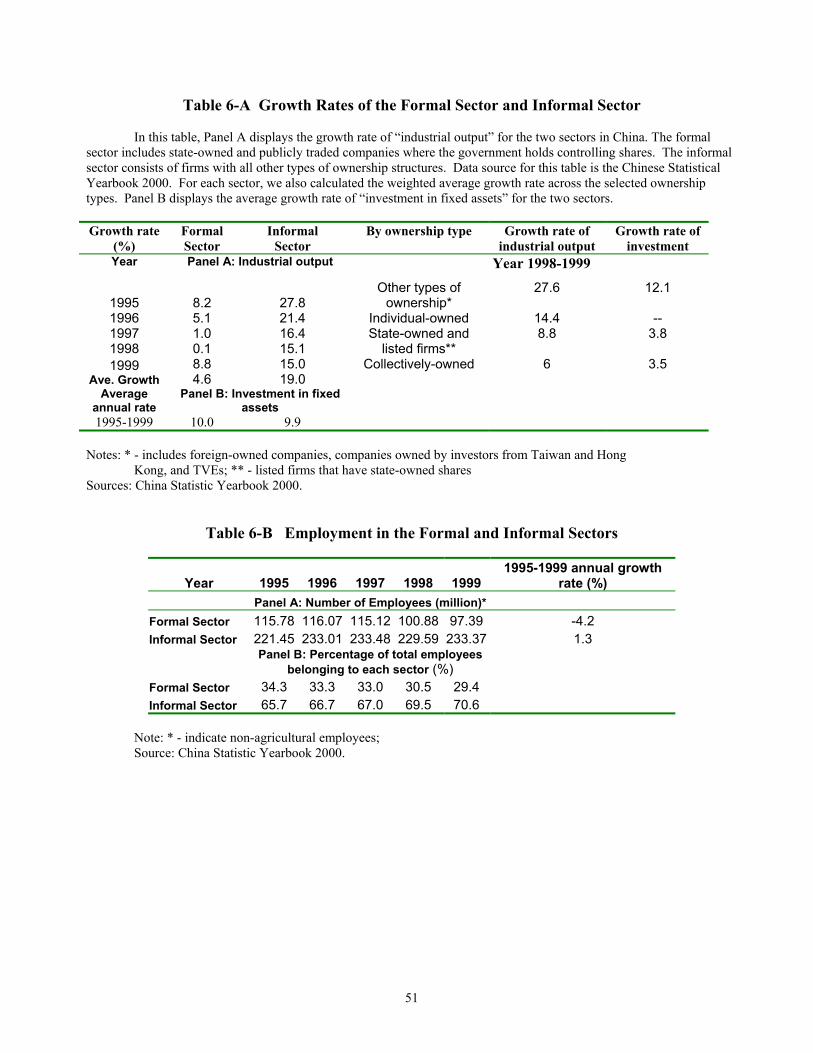
51
Table 6-A Growth Rates of the Formal Sector and Informal Sector
In this table, Panel A displays the growth rate of “industrial output” for the two sectors in China. The formal sector includes state-owned and publicly traded companies where the government holds controlling shares. The informal sector consists of firms with all other types of ownership structures. Data source for this table is the Chinese Statistical Yearbook 2000. For each sector, we also calculated the weighted average growth rate across the selected ownership types. Panel B displays the average growth rate of “investment in fixed assets” for the two sectors. Growth rate
(%) Formal Sector
Informal Sector
By ownership type Growth rate of industrial output
Growth rate of investment
Year Panel A: Industrial output Year 1998-1999
1995 8.2 27.8 Other types of
ownership* 27.6
1996 5.1 21.4 Individual-owned 14.4
12.1
-- 1997 1.0 16.4 1998 0.1 15.1
State-owned and listed firms**
8.8 3.8
1999 Ave. Growth
8.8 4.6
15.0 19.0
Collectively-owned 6 3.5
Average annual rate
Panel B: Investment in fixed assets
1995-1999 10.0 9.9 Notes: * - includes foreign-owned companies, companies owned by investors from Taiwan and Hong
Kong, and TVEs; ** - listed firms that have state-owned shares Sources: China Statistic Yearbook 2000.
Table 6-B Employment in the Formal and Informal Sectors
Year 1995 1996 1997 1998 1999
1995-1999 annual growth rate (%)
Panel A: Number of Employees (million)* Formal Sector 115.78 116.07 115.12 100.88 97.39 -4.2 Informal Sector 221.45 233.01 233.48 229.59 233.37 1.3
Panel B: Percentage of total employees
belonging to each sector (%) Formal Sector 34.3 33.3 33.0 30.5 29.4 Informal Sector 65.7 66.7 67.0 69.5 70.6
Note: * - indicate non-agricultural employees; Source: China Statistic Yearbook 2000.
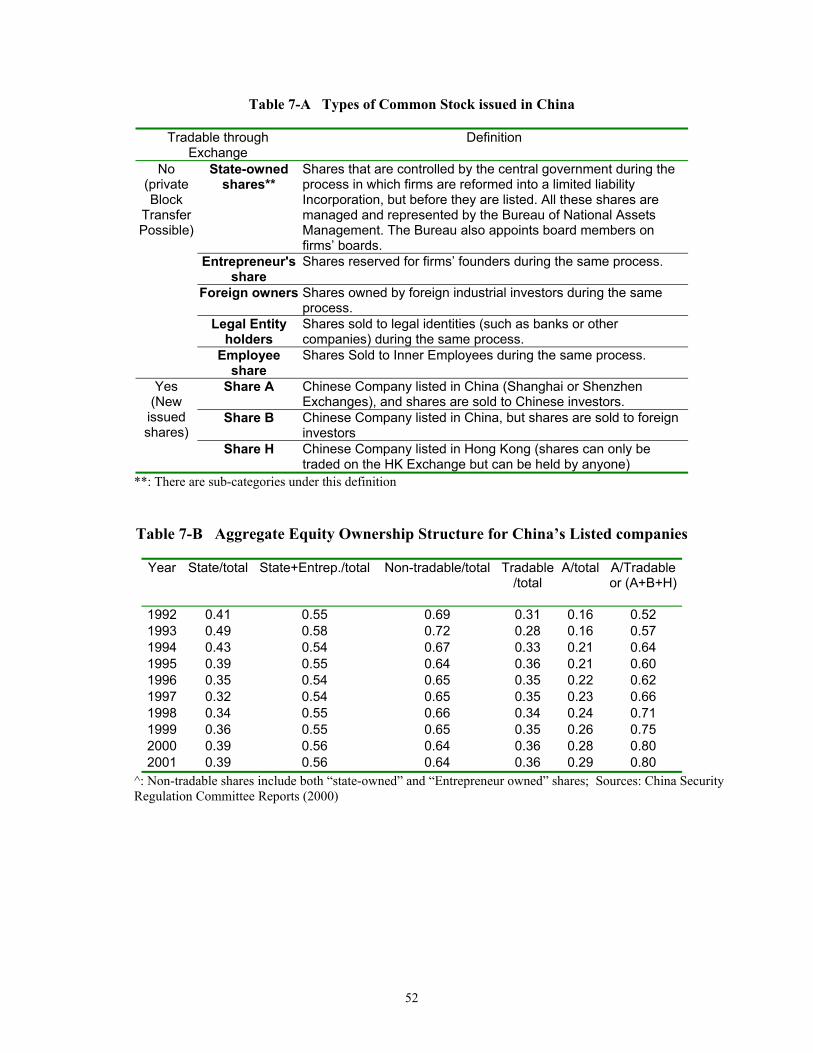
52
Table 7-A Types of Common Stock issued in China
Tradable through Exchange
Definition
State-owned shares**
Shares that are controlled by the central government during the process in which firms are reformed into a limited liability Incorporation, but before they are listed. All these shares are managed and represented by the Bureau of National Assets Management. The Bureau also appoints board members on firms’ boards.
Entrepreneur's share
Shares reserved for firms’ founders during the same process.
Foreign owners Shares owned by foreign industrial investors during the same process.
Legal Entity holders
Shares sold to legal identities (such as banks or other companies) during the same process.
No (private Block
Transfer Possible)
Employee share
Shares Sold to Inner Employees during the same process.
Share A Chinese Company listed in China (Shanghai or Shenzhen Exchanges), and shares are sold to Chinese investors.
Share B Chinese Company listed in China, but shares are sold to foreign investors
Yes (New issued shares)
Share H Chinese Company listed in Hong Kong (shares can only be traded on the HK Exchange but can be held by anyone)
**: There are sub-categories under this definition
Table 7-B Aggregate Equity Ownership Structure for China’s Listed companies
Year State/total State+Entrep./total Non-tradable/total Tradable/total
A/total A/Tradable or (A+B+H)
1992 0.41 0.55 0.69 0.31 0.16 0.52 1993 0.49 0.58 0.72 0.28 0.16 0.57 1994 0.43 0.54 0.67 0.33 0.21 0.64 1995 0.39 0.55 0.64 0.36 0.21 0.60 1996 0.35 0.54 0.65 0.35 0.22 0.62 1997 0.32 0.54 0.65 0.35 0.23 0.66 1998 0.34 0.55 0.66 0.34 0.24 0.71 1999 0.36 0.55 0.65 0.35 0.26 0.75 2000 0.39 0.56 0.64 0.36 0.28 0.80 2001 0.39 0.56 0.64 0.36 0.29 0.80
^: Non-tradable shares include both “state-owned” and “Entrepreneur owned” shares; Sources: China Security Regulation Committee Reports (2000)
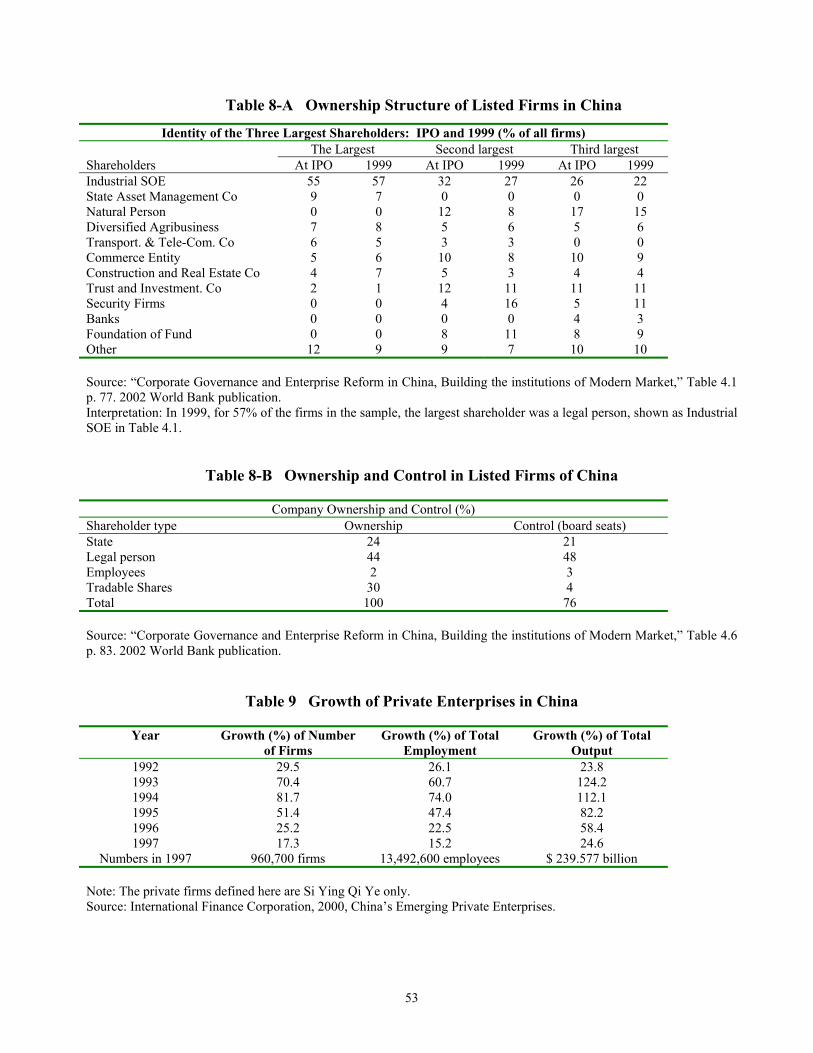
53
Table 8-A Ownership Structure of Listed Firms in China
Identity of the Three Largest Shareholders: IPO and 1999 (% of all firms) The Largest Second largest Third largest
Shareholders At IPO 1999 At IPO 1999 At IPO 1999 Industrial SOE 55 57 32 27 26 22 State Asset Management Co 9 7 0 0 0 0 Natural Person 0 0 12 8 17 15 Diversified Agribusiness 7 8 5 6 5 6 Transport. & Tele-Com. Co 6 5 3 3 0 0 Commerce Entity 5 6 10 8 10 9 Construction and Real Estate Co 4 7 5 3 4 4 Trust and Investment. Co 2 1 12 11 11 11 Security Firms 0 0 4 16 5 11 Banks 0 0 0 0 4 3 Foundation of Fund 0 0 8 11 8 9 Other 12 9 9 7 10 10 Source: “Corporate Governance and Enterprise Reform in China, Building the institutions of Modern Market,” Table 4.1 p. 77. 2002 World Bank publication. Interpretation: In 1999, for 57% of the firms in the sample, the largest shareholder was a legal person, shown as Industrial SOE in Table 4.1.
Table 8-B Ownership and Control in Listed Firms of China
Company Ownership and Control (%) Shareholder type Ownership Control (board seats) State 24 21 Legal person 44 48 Employees 2 3 Tradable Shares 30 4 Total 100 76 Source: “Corporate Governance and Enterprise Reform in China, Building the institutions of Modern Market,” Table 4.6 p. 83. 2002 World Bank publication.
Table 9 Growth of Private Enterprises in China
Year Growth (%) of Number
of Firms Growth (%) of Total
Employment Growth (%) of Total
Output 1992 29.5 26.1 23.8 1993 70.4 60.7 124.2 1994 81.7 74.0 112.1 1995 51.4 47.4 82.2 1996 25.2 22.5 58.4 1997 17.3 15.2 24.6
Numbers in 1997 960,700 firms 13,492,600 employees $ 239.577 billion Note: The private firms defined here are Si Ying Qi Ye only. Source: International Finance Corporation, 2000, China’s Emerging Private Enterprises.
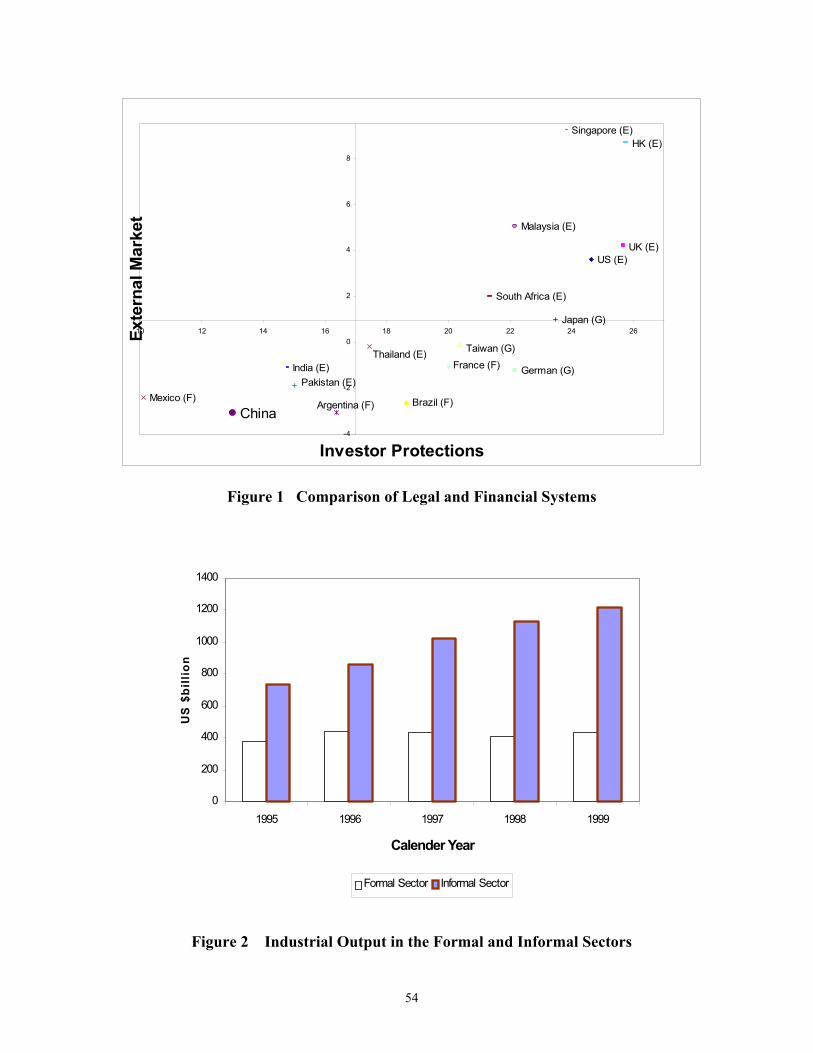
54
China
US (E)UK (E)
Mexico (F) Brazil (F)Argentina (F)
South Africa (E)
Pakistan (E)India (E) France (F) German (G)
Taiwan (G)Thailand (E)
Malaysia (E)
Japan (G)
Singapore (E)HK (E)
-4
-2
0
2
4
6
8
10 12 14 16 18 20 22 24 26
Investor Protections
Exte
rnal
Mar
ket
Figure 1 Comparison of Legal and Financial Systems
0
200
400
600
800
1000
1200
1400
1995 1996 1997 1998 1999
Calender Year
US
$bi
llion
Formal Sector Informal Sector
Figure 2 Industrial Output in the Formal and Informal Sectors
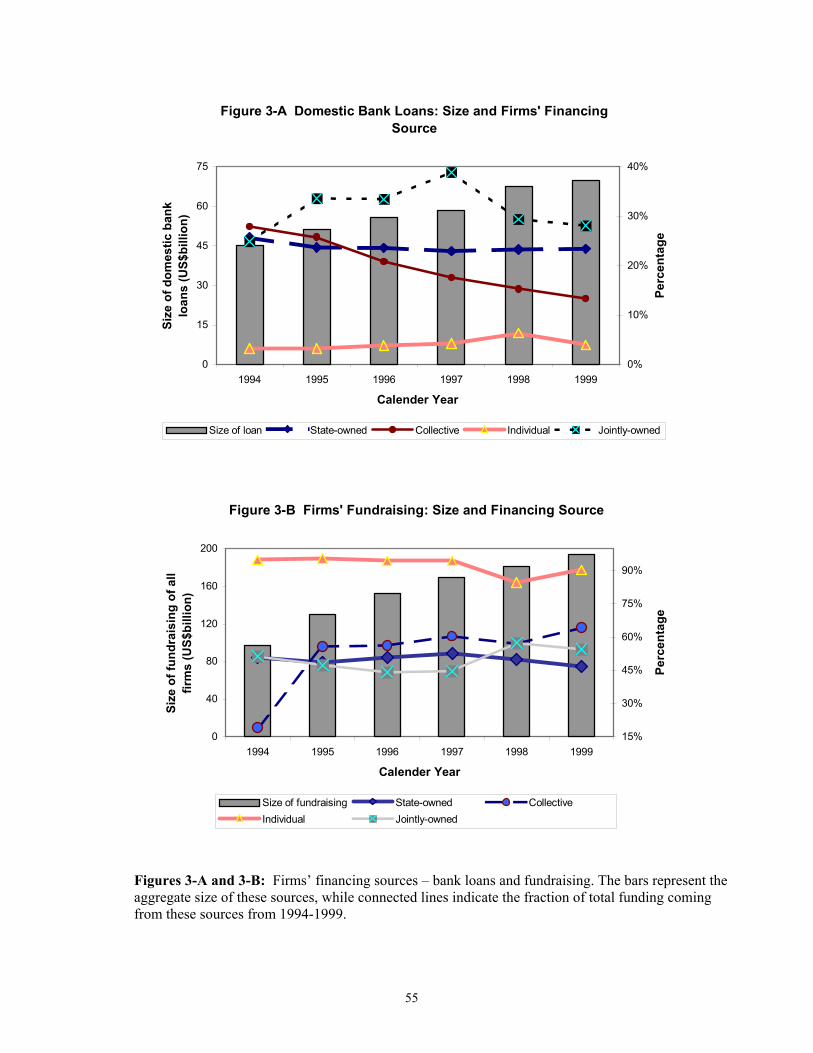
55
Figures 3-A and 3-B: Firms’ financing sources – bank loans and fundraising. The bars represent the aggregate size of these sources, while connected lines indicate the fraction of total funding coming from these sources from 1994-1999.
Figure 3-A Domestic Bank Loans: Size and Firms' Financing Source
0
15
30
45
60
75
1994 1995 1996 1997 1998 1999
Calender Year
Size
of d
omes
tic b
ank
loan
s (U
S$bi
llion
)
0%
10%
20%
30%
40%
Perc
enta
ge
Size of loan State-owned Collective Individual Jointly-owned
Figure 3-B Firms' Fundraising: Size and Financing Source
0
40
80
120
160
200
1994 1995 1996 1997 1998 1999
Calender Year
Size
of f
undr
aisi
ng o
f all
firm
s (U
S$bi
llion
)
15%
30%
45%
60%
75%
90%
Perc
enta
ge
Size of fundraising State-owned CollectiveIndividual Jointly-owned
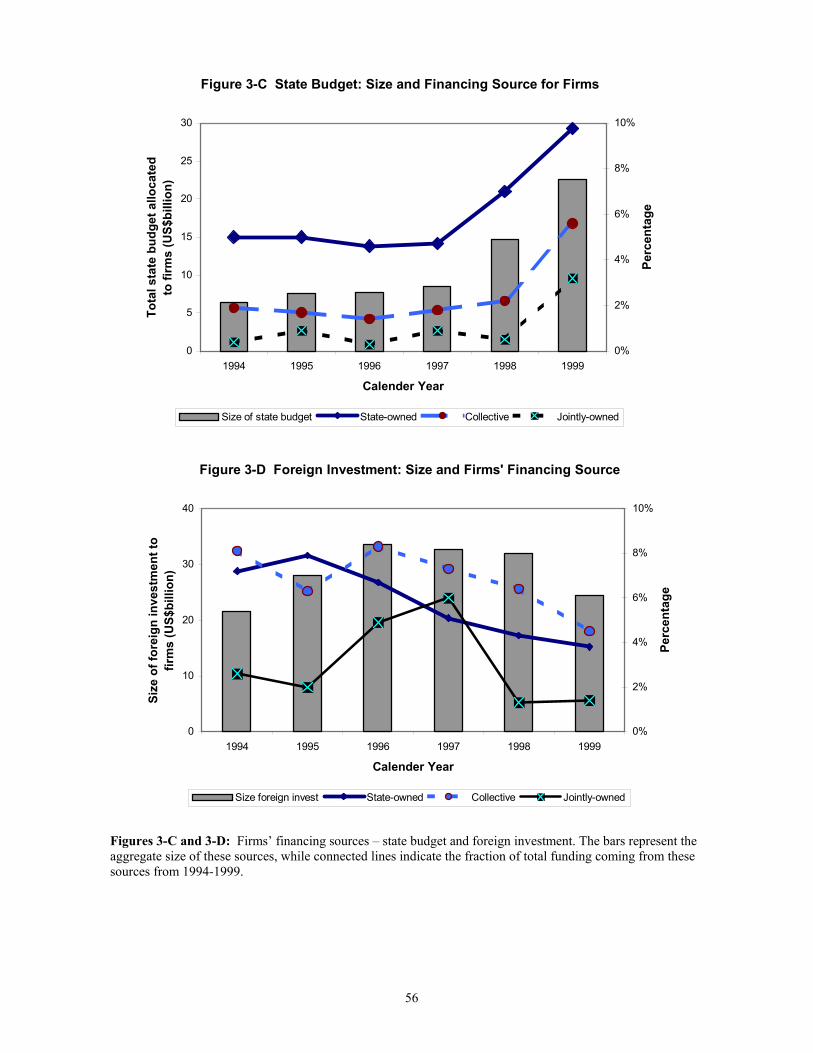
56
Figures 3-C and 3-D: Firms’ financing sources – state budget and foreign investment. The bars represent the aggregate size of these sources, while connected lines indicate the fraction of total funding coming from these sources from 1994-1999.
Figure 3-C State Budget: Size and Financing Source for Firms
0
5
10
15
20
25
30
1994 1995 1996 1997 1998 1999
Calender Year
Tota
l sta
te b
udge
t allo
cate
d to
firm
s (U
S$bi
llion
)
0%
2%
4%
6%
8%
10%
Perc
enta
ge
Size of state budget State-owned Collective Jointly-owned
Figure 3-D Foreign Investment: Size and Firms' Financing Source
0
10
20
30
40
1994 1995 1996 1997 1998 1999
Calender Year
Size
of f
orei
gn in
vest
men
t to
firm
s (U
S$bi
llion
)
0%
2%
4%
6%
8%
10%
Perc
enta
ge
Size foreign invest State-owned Collective Jointly-owned
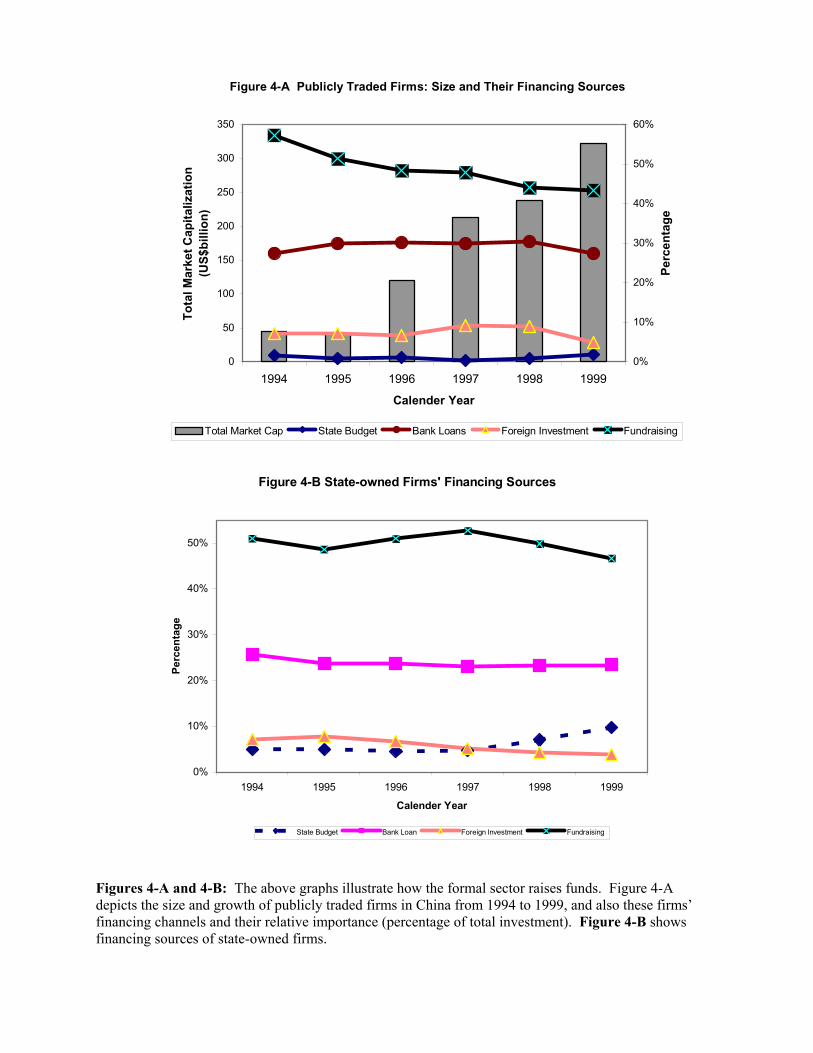
Figures 4-A and 4-B: The above graphs illustrate how the formal sector raises funds. Figure 4-A depicts the size and growth of publicly traded firms in China from 1994 to 1999, and also these firms’ financing channels and their relative importance (percentage of total investment). Figure 4-B shows financing sources of state-owned firms.
Figure 4-A Publicly Traded Firms: Size and Their Financing Sources
0
50
100
150
200
250
300
350
1994 1995 1996 1997 1998 1999
Calender Year
Tota
l Mar
ket C
apita
lizat
ion
(US$
billi
on)
0%
10%
20%
30%
40%
50%
60%
Perc
enta
ge
Total Market Cap State Budget Bank Loans Foreign Investment Fundraising
Figure 4-B State-owned Firms' Financing Sources
0%
10%
20%
30%
40%
50%
1994 1995 1996 1997 1998 1999
Calender Year
Perc
enta
ge
State Budget Bank Loan Foreign Investment Fundraising
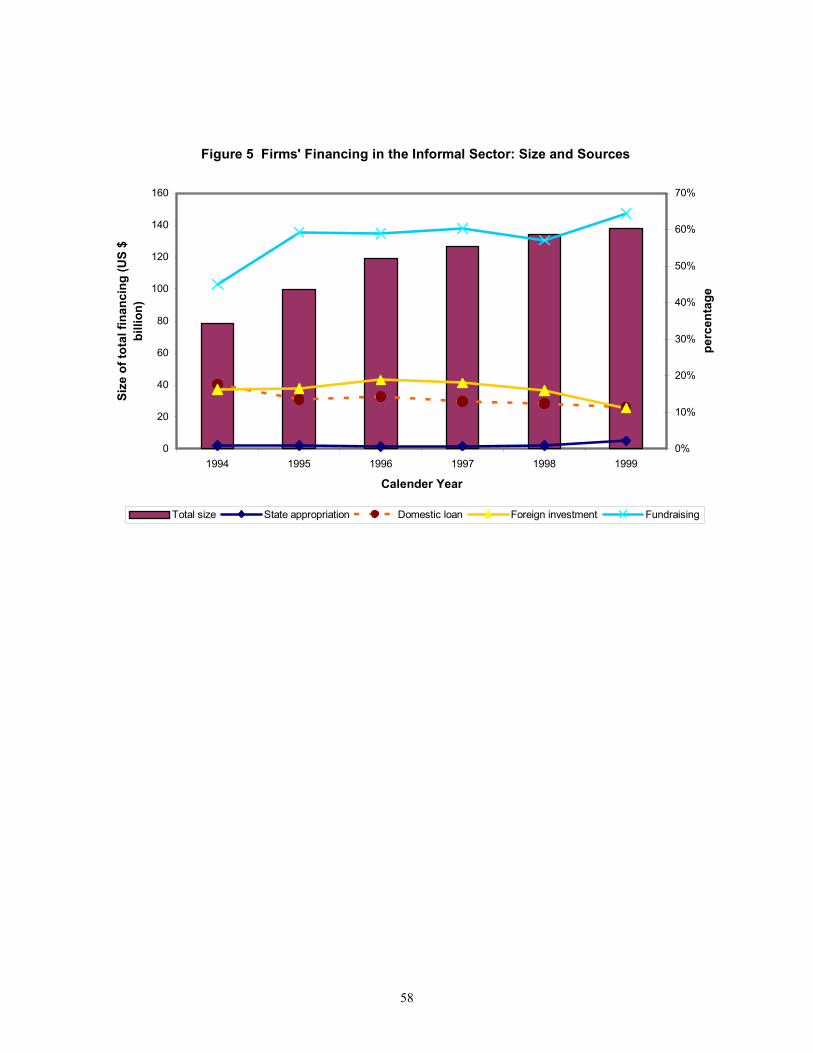
58
Figure 5 Firms' Financing in the Informal Sector: Size and Sources
0
20
40
60
80
100
120
140
160
1994 1995 1996 1997 1998 1999
Calender Year
Size
of t
otal
fina
ncin
g (U
S $
billi
on)
0%
10%
20%
30%
40%
50%
60%
70%
perc
enta
ge
Total size State appropriation Domestic loan Foreign investment Fundraising